Embed Size (px)
Citation preview

U.S. ARMY MEDICAL RESEARCH
SINSTITUTE OF CHEMICAL DEFENSES• • USAMRICD-TR,-90-03
NN
1 • DRUG RETENTION DURING ANIMAL INHALATIONEXPOSURE BY FT-IR SPECTROSCOPY
DTICS ELECTEJUL 27 WO011 Ernest H. Braue Jr.
Dc• D', Michael G. lannella
May 1990
Approved for public release; distribution unlimited
• U. S. ARmY MEDICAL RESEARCH INSTITUTE OF CHEMICAL DEFENSEI Aberdeen Proving Ground, MD 21010-5425
90 07 26 007

DISPOSITION INSTRUCTIONS
Destroy this report when no longer needed. Do not return tothe originator.
The findings in this report are not to be construed as anofficial Department of the Army position unless so designated byother authorized documents.
In conducting the work described in this report, theinvestigators adhered to the "Guide for the Care and Use ofLaboratory Animals" as promulgated by the Committee on Revisionof the Guide for Laboratory Animal Facilities and Care of theInstitute of Laboratory Animal Resources, National ResearchCouncil.
The use of trade names does not constitute an officialendorsement or approval of the use of such commercial hardware orsoftware. This document may not be cited for purposes ofadvertisement.

$1WRIrY CA.51F!,CA.TON' O.F THIS PACE , .. . , .
REPORT DOCUMENTATION PAGE
"Ia. REPORT SECURITY CLASSIFICATION 1b, RESTRICTIVE MARKINGSUNCLASSIFIED
14. SECURITY CLASSIFICATION AUTHORITY 3. DiSTRIBUTIONIAVA•LAIILITY OF REPORT
1b..... MSELApproved for public releaseS 2b. DECLASSIPICATIONJDOWNGRADING SCEDULE- Distribution is unlimited
4. PERFORMING ORGAIIZATION REPORT NUMBER(Si) 5. MONITORING ORGANI•ATION REPOR PI UMBER(S)
USAMRICD-TR-90-03 USAMRICD-TR-90-03
re. NE OF PERFORMING ORGANIZATION 6b. OFFICE SYMBOL 7s. NAME OF USNITRING ON•ANWTIONU.S. Army Medical Research (ffsokable) U.S. Army Medical Research Institute ofInstitute of Chemical Defense I SGRD-UV-DB Chemical Defense, SGRD-UV-RC
6L ADDRESS (I-y. State, and ZI'PCoe) 7b. ADDRESS'(-. SeWe. I end, *ZP C")APG, MD 21010-5425 APG, MD 21010-5425
ga. NAME OF FUNDING /SPONSORiNG Sb. OFFICE SYMBOL 9. PROCUREMENT INSTRUMENT IDENTIFICATION NUMBER-ORGANIZATION I (If appliable)
USAMRICD ISGRD-UV-DBINC ADDRESS (City Stat, end ZIP Co*e) 10. SOURCE OF FUNDING NUMBERS
Aberdeen Proving Ground, Edgewood Area PROGRAM IPROJECT K M07 •O UNIT
Maryland 21010-5425 ELEMENT NO. TNO. NO. CCSSION No.
11. TITLE (Include Security ClQi~fitftion) 628A 3177 75A
Drug Retention During Animal Inhalation Exposure by FT-IR Spectroscopy
12. PERSONAL AUTHOR(S)Rr.;klj _ FNH-- ,jr- AnU P nng a-_ M- . ..
13a. TYPE OF REPORT 13b. TIME COVERED 14. DATE OF REPORT (Yeer, Moth. a iS. PAGE COUNTTechnical I FROM RR ju TO,._•.• May 1990 18
16, SUPPLEMENTARY NOTA11ONNone
17. COSATI CODES IN. SUBJECT TERMS (Cot,, on rve, e necearyandM by lrie ,t' r)FI.ELD GROUP I SUN-GROUP ]'T-IR spectroscopy, inhalation exposure, gas cell analysis,
07 04 1 drug retention06 11 1 -" /
19. ABSTRACT (Continue on reverse if necessary nd $ blck numberrA unique analytical method ?or the deter-mination of the amount of volatile drug retention by animals during inhalation exposureexperiments was developed and evaluated. A large-volume collection system was used to col-lect and store all exhaled air from the animal. The collected air was analyzed by FT-IRspectroscopy utilizing a Nicolet 5SXB spectrometer and a Spectra-Tech, Inc. 10 meter, long-,path gas cell. The developed technique was evaluated using bis-(trifluoromethyl) disulfide(TFD) administered to adult sheep. Control experiments confirmed the system's ability tocapture 100% of the administered compound. It was observed that the sheep retained an aver-
"* age of 4.4 mg of this compound per Kg of body weight during a 10-min exposure period at anair, concentration of 5.0 mg per liter.. After quantitative analysis, compounds exhaled by thtanimal were concentrated by passing the collected air through a series of dry ice and liquidnitrogen cooled traps. FT-IR analysis of the colIeced concentrated products indicated thatTFD did not undergo chemical decomposition to form trifluoromethyl sulfide during the ex-posure experiment.(' r5) -L .---
20. DISTRIBUTION /AVAILABIIITY OF ABSTRACT 121. ABSTRACT SECURITY CLASSIFICATIONSUNCLASSIFIEODJNLIMITEO 0 SAME AS RPT. 0 OTIC USERS UNCLASSIFIED
22a. NAME OF RESPONSIBLE INDIVIDUAL 22b TELEPHONE (FIcud Am& Code) I 22. OFFIC SYMBOLDAVID T. ZOL.CK. LTC. MS .. . 11§71-444U SGRD-UV -
DI Form 1473, JUN 86 Previous editions are obsolete. SECURITY CLASSIFICATION OF THIS PAGE
UNCLASSIFIED

FOREWORD
The work described in this report was directly related to researchauthorized under US Army Medical Research Institute of Chemical Defense(USAMRICD) protocol number 1-03-87-000-A-422 and by JSA requirements C-A-306,C-A-309, and C-A-325. The original research data were recorded in USAMRICDlaboratory notebook number 033-88. The authors wish to thank MAJ Kenneth G.Phillips for assisting in the design of the inhalation exposure system, Dr.Holcombe H. Hurt, Jr. for administering the anesthesia and intubation of thetrachea, and SOT Felix Feliciano-Emmanuelli for his assistance in setting upthe inhalation exposure system.
The present address of Michael G. Pannella is the University of Marylandat Baltimore, School of Pharmacy, Clinical Pharmacokinictics Laboratory, 20North Pine Street, Baltimore, Maryland 21201.
Accesion Fcr
NTIS CRA&IDTIC TAB 0Ufornnou:Cced 0Justification
ByDistribution /
101 Avaloibidyo Codes
Avail OrDist

TABLE OF CONTENTS
INTRODUCTION .................................................... I
MATERIALS AND METHODS ........................................... 1
RESULTS AND DISCUSSION .......................................... 6
CONCLUSIONS AND RECOMMENDATIONS ................................ 10
DISTRIBUTION LIST .............................................. 11
lV

List of Figures
Figure 1. Collection System .................................... 3
Figure 2. Analysis System ...................................... 3
Figure 3. Concentration System ................................. 4
Figure 4. Concentration System Analysis ........................ 4
Figure 5. IR Spectrum of Bis-(trifluoromethyl) disulfide ....... 7
Figure 6. Calibration Data ..................................... 9
vii

INTRODUCTION
To determine the role of pulmonary edema in the pathophysiology ofpulmonary irritants, the Analytical Chemistry Branch of the US Army MedicalResearch Institute of Chemical Defense (USAMRICD) was tasked to develop ananalytical method to determine the amount of drug retained by animals duringinhalation exposure experiments. In addition, the method was required todetermine whether decomposition of the test compound occurred during animalexposure.
The ability of IR spectroscopy to quantify ppm (part per million)concentrations of components in a gaseous mixture, coupled with its abilityto qualitatively identify unknown components, made the use of this techniquea logical choice for achieving the stated task. In this report, we describean analytical method for determining the amount of drug retained by animalsduring inhalation exposure experiments. We selected bis-(trifluoromethyl)disulfide (TFD), a commercially available (1) toxic compound often encounteredin industry and agriculture, as a test compound.
MATERIALS AND METHODS
Equipment and Supplies. A Nicolet 5SXB FT-IR spectrometer utilizing aliquid nitrogen-cooled mercury cadmium telluiride (MCT-A) detector, agermaniunP-on-KBr beam splitter, and air cooled globar source were used torecord all spectra. The optical retardation velocity was .0.198 cm/sec, andthe laser frequency was 3.13 kHz. Instrumental parameters were optimized togive the best results and are listed in Table I. The sample compartment wasopen to the room atmosphere, and the instrument was not purged. Spectrarecorded were the result of 32 co-added interferograms at 4.0 cm-l resolution.Happ-Genzel apodization was used in the subsequent Fourier transform (FT).

Table I. FT-IR Parameters
Parameter Value Parameter Value
AFN HG APT FLAXS YS BDL 15BNF 3 CBM NOCOR Lo CXF -500CYT 25.00 FIT YESFSZ 22528 FXF 4000FYT 0.0 CAN 4HPS 0 LSP 0LXF 500.0 LYT 125.0MIR SB NDP 6144NPD 200 NPT 1024NSB 32 NSD 32NSS 32 NSK 0NTP 8192 PAG YSPHZ PH PLO 100SBM FT SFN 2SGH 0 SGL 0SSP 2 VEL 40XEP 500 XSP 4000YEP 2.50 YSL 5YSP 4000
All spectra were run using a variable long pathlength gas cell (BarnesAnalytical Division, Spectra Tech Inc., 652 Glenbrook Road, Stamford, CT06906). The gas cell had a volume of 2.5 L and was constructed of gold-coatedcast aluminum. All experiments used KBr windows and a pathlength of 10meters.
Figure I gives a block diagram of the experimental set-up during thecollection phase of the experiment, and Figure 2 gives a block diagram of theexperimental set-up for the analysis phase of the experiment. Figure 3 givesa block diagram of the -pparatus used to concentrate the collected products,and Figure 4 shows the equipment used to analyze the concentrated products.
2

ID 0
E HHC
A F
Figure 1. Collection System. A - compressed air tank, B - dual stageregulator, C - mass flow controller, model FC-261, Tylan Corp., D- mass flow controller module, model RO-28, Tyler Corp., E -injection port (butyl rubber), F - syringe pump, model 335, SageInstruments, G - gas tight Hamilton syringe, 1000 #1, model 1001,H - Hans Rudolph valve, I - endo-tracheal tube (used with animal),J - animal or respirator pump, model 613, Harvard Apparatus, K -
air circulating pump, model KB-41, Metal Bellows, L - inhalationreservoir bag (4 L), M - one-way valve, N - plastic drum (208 L),0 - shut-off valve.
0
N N
Figure 2. Analysis System. A - compressed air tank, B - dual stage regulator,K - air circulating pump, model MB-41, Metal Bellows, M - one-wayvalve, N - plastic drum (208 L), P - FT-IR gas cell, Q - 3-wayvalve.
3

Q
: • i
pIK
I~T
it N N
R R S
Figure 3. Concentration System. K - air circulating pump, model 14-41, MetalBellows, M! - one-way valve, N -plastic drum (208 L), P - FT-IR gascell, Q - 3-way valve, R =dry-ice cold trap, S -liquid nitrogencold trap.
MB-4I, Metal Bellows, P - FT-IR gas cell, T - cold trap at roomtemperature.
Procedure. In preparation for the animal exposure, the analysis systemdescribed in Figure 2 was flushed completely with the compressed air. Aspectrum was recorded, stored to hard disk on the FT-IR spectrometer, and usedas the background spectrum in the analysis. The collection system, which
included part of the analysis system, was evacuated using house vacuum inorder to collapse the 208 liter plastic drums. The collectron system,
however, was at room pressure at the start of collecting the sheep's expiredPgas. Before connecting the sheep to the collection system a sample of te
sheep's expired gas was collected in the FT-IR gas cell and the spectrumrecorded. A ratio of this spectrum wit the background spectrum was made andstored to hard disk. The ratioed spectrum of the normal sheep's expired gas
4
was used as the reference spectrum for spectral subtraction duringquantitative analysis. The sheep or respirator pump was connected to thecollection system as described in Figure 1. The expired gas from the sheepand the air through the by-pass loop were completely collected into thecollapsed plastic tanks. An inhalation reservoir bag and air pump on the by-pass loop were manually controlled by an operator to ensured that a positivepressure did not force air into the animal. A second inhalation reservoir bag
allowed the animal to exhale easily. An operator manually collapsed this bagduring animal inhalation, forcing the exhaled air into the storage tanks. A1000 pl Hamilton gas-tight syringe was filled with TFD (PCI Inc, P.O. Box1466, Gainsville, FL 32602, Cat No. 185009, CAS No 372-64-5) and the beginningvolume recorded. The syringe was placed into the syringe pump, the needle
inserted into the septum port and the syringe pump started. The animals were
exposed to a concentration of 5.0 mg compound per liter of air for 10 minutes;
then the syringe was removed and the amount of remaining liquid noted. Theamount of compound presented to the animal was determined from the initial and
final reading of the syringe. The ability to read the volume dispensed by thesyringe pump accurately was confirmed by simulating the syringe pump injectionprocedure using water in the syringe and quantitatively weighing the waterdispensed.
The sheep used in this study was maintained using standard large animalprocedures with supporting veterinary care. No premedication was used. In
preparation for TFD exposure the sheep was placed in a metabolism cage andsupported by means of a fish net sling adjusted to support nearly its fullweight. A balloon tipped flow directed catheter was used to administer a 10mg/ml solution of ketamine in normal saline into the pulmonary artery. Theketamine was given in increments, in amounts sufficient to produceunconsciousness of sufficient relaxation to permit oral intubation of thetrachea. Thereafter, additional amounts were given at roughly 5-min intervalsby the same route to maintain a level of anesthesia edequate to allow thesheep to tolerate the exposure to TFD and the continuing intubation whilevital signs were monitored. At 4 hours post-TFD exposure the sheep was given
pentobarbital (50 mg/kg) intravenously (IV) to achieve a surgical plane of
anesthesia. The sheep was then exsanguinated by bilateral sectioning of the
jugular veins and carotid arteries.
After the 10-mi: exposure period, the animal remained connected to the
collection system until both collecting tanks were completely filled. Thistypically took about 25 min with an air flow rate of 15 liters per min. After
the tanks were completely filled the animal was disconnected from the
collecting system, and a sample of the animal's expired gas was directed tothe FT-IR gas cell for analysis. The recorded spectrum confirmed that theanimal was not exhaling any of the tested compound at this time.
The one-way valve before the first collecting tank (Figure 1) preventedloss of test compound when the collecting system was switched to the analysissystem. Before analysis of the test compound its concentration was allowed
to come to equilibrium. The equilibration process took about 2 hours usingthe air circulating pump. Equilibrium was confirmed by observing a constant
IR absorbance value for the test compound. The concentration of the test
compound was determined by the average absorbance value of three consecutive
IR spectra.5

Quantification of TED used the absorbance band at 758 cm-1. StandardNicolet software allowed for the spectral subtraction of the reference sheepbreath. The FCR subtraction factor was visually determined for each spectrumand recorded. After manual baseline correction, the maximum peak height(absorbance) of the 758 cm-1 band was determined by the PFK Nicolet command.
The concentration of TFD was determined from the calibration experimentand the Beer's law relationship. For the calibration experiment a controlsheep was used in the standard apparatus, but TFD was not injected into thesystem. After filling the collection system (Figure 1) the apparatus wasswitched to the analysis system (Figure 2). A volume of 500 Al of TFD wasinjected into the analysis loop using the 1000 p1 Hamilton gas tight syringe,and the air was circulated using the air circulation pump. When no change wasobserved in the absorbance of the 758 cm-i band, the maximum peak height ofthis absorbance band was determined as described above.
After the concentration of TFD was determined in the analysis system ofFigure 2. the collected gas from the animal was concentrated using theapparatus described in Figure 3. The collected gas was circulated for atleast 12 hours allowing the organic gases to he collected in the cold traps.After the collection period, each of the cold traps was analyzed by IRspectroscopy using the apparatus described in Figure 4.
RESULTS AND DISCUSSION
The IR spectrum of TFD (Figure 5) was recorded after 290 Al was injectedinto the Analysis system (Figure 2). The C-F stretching bands at 1101, 1133,1189, and 1204 cm-i are all off scale. The C-S stretching absorption band at758 cm-l was chosen as the quantitative peak because of its location andextinction coefficient. The relatively small peak at 758 cm-I was clear ofinterferences and gave an almost ideal quantitative absorbance value of 0.81a.u. (absorbance units) for a 500 p1 injection. The IR spectrum of theexhaled sheep breath showed several absorption bands, but these wereeffectively subtracted out using the standard Nicolet software duringquantification of TFD.
The total volume of the analysis system was estimated to be 420 liters.After injection of a 500 p1 sample into the analysis system, equilibrium wasachieved after 1 to 2 hours, which was confirmed by the observation of aconstant absorbance value for the 758 cm-1 peak.
The analysis system was calibrated by injection of 500 11 of TFD.Analysis in triplicate of the absorbance values for the 758 cm-i peak gave amean value of 0.810 a.u., with a standard deviation of 0.0106 (n-3) and a
6

Figure 5. IR Spectrum of Bis-(trifluoromethyl) disulfide, 290 Al in 420L, 10 m pathlength.
--( BIS-rTRIFLUOROMETHYL] DISULFIDE
LI"
rD
LO
_L N
U•.)
1'4oo 3t2o 3640 2860 260o ioo 1[2o 60WAVENUMBER
7

coefficient of variation (CV) 1.3 %. The Beer's law relationship A - abcwhere
A - absorbancea - molar absorptivity constantb - pathlengthc - concentration
was used for the quantification. Since the terms "a* and "bT as well as thetotal volume of the system were all constant for these experiments, Beer'slaw was reduced to A - Kv where
K - grouping of all constantsv - volume of sample compound in the system
The K value for these experiments was calculated from the calibrationexperiment to be 1.62 (± 0.02) x 10-'. This K value was used to calculate theamount of TFD in the other experiments.
Although a single point calibration was used for the sheep exposure andcontrol study, good linearity for the analysis of TFD by this technique wasestablished in a modified experimental setup. The apparatus setup used wassimilar to that described in Figure 4, except that the total volume was about8 liters. Using this 8-liter system, the analytical data obtained issummarized in Table II.
Table II. Calibration Data
Volume, p1 Mean SD (n-3) % C.V.a MeanTFD Absorbance Absorbance
758 cm-l 1101 cm-i
1.00 0.0627 0.00382 6.09 0.8522.00 0.122 0.00115 0.94 1.773.00 0.7,;2 0.00551 3.03 off scale
a Percent coefficient of variation, (SD/mean)100
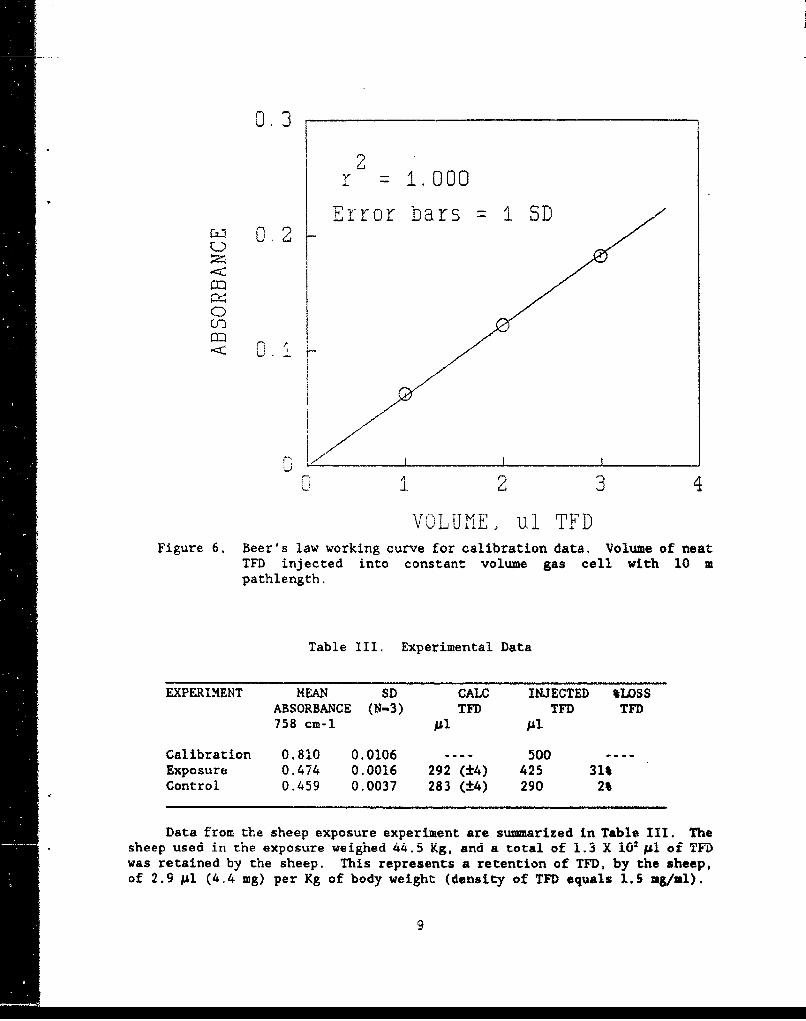
The Beer's law plot for this data is given in Figure 6. The correlationcoefficient was calculated to be 1.000. As can be observed, the linearity isexcellent.
A control experiment was performed using a respirator pump instead of asheep (Table III). All other experimental conditions were the same as theactual sheep exposure. In this experiment, 290 pl of TFD was injected duringthe 10-min exposure period. Within experimental error, all of the injectedsample was recovered in the collection System. This control experimentdemonstrated the collection system's ability to determine whether injectedsample was retained by the animal.
8
0.3
2r = 1.000
Error bars = I SD .
0.0
EI =
C1 2 3 4
VOLUME, ii TFDFigure 6. Beer's law working curve for calibration data. Volume of neat
TFD injected into constant volume gas cell with 10 mpathlength.
Table III. Experimental Data
EXPERIMENT MEAN SD CALC INJECTED %LOSSABSORBANCE (N-3) TFD TFD TED758 cm-i Ai l1
Calibration 0.810 0.0106 .. 500 -Exposure 0.474 0.0016 292 (±4) 425 31%Control 0.459 0.0037 283 (±4) 290 2%
Data from the sheep exposure experiment are summarized in Table III. Thesheep used in the exposure weighed 44.5 Kg, and a total of 1.3 X 10² I1 of TFDwas retained by the sheep. This represents a retention of TFD, by the sheep,of 2.9 1A (4.4 mg) per Kg of body weight (density of TFD equals 1.5 mg/ml).
9

Another goal of this study was to determine whether the compound to beevaluated would undergo any chemical change during the animal exposure period.An expected decomposition product of TFD is trifluoromethyl sulfide. The S-H stretching band for trifluoromethyl sulfide should be located in the 2590-2550 cm-I range.* An absorbance band in this range was not observed for theproducts trapped in the collection system from either the control or the sheepexposure experiments. Due to the large volume (420 L) of the analysis system(Figure 2) small amounts of the decomposition products would most likely bebelow the detection limit of analysis technique. Figure 3 describes anapparatus system used to concentrate the collected gases. It was observedthat -78 deg C (dry ice temperature) was not cold enough to trap out TFD(boiling point, 34-35 deg C). A liquid nitrogen (-196 deg C) cold trap wassuccessful. Due to the large amount of water vapor and carbon dioxide exhaledby the animal, a series of three traps was necessary to effectively trap TFD.The first two dry-ice cold traps removed enough water so that the liquidnitrogen cold trap did not become clogged.
IR analysis (Figure 4) of the concentrated products from the sheepexposure and control experiments did not yield an S-H absorbance band. Thisindicates TFD did not decompose to form trifluoromethyl sulfide.
CONCLUSIONS
It was demonstrated that the analytical method developed using a large-volume collection system, a long pathlength gas cell, and FT-IR spectroscopyis well suited for determining the amount of drug retained by animals duringinhalation exposure experiments. The analytical method can also be used todetermine whether any decomposition products of the tested compound areexhaled by the animal.
It was observed that TFD is retained in sheep during inhalation exposure.The amount of retention in sheep was observed to be 4.4 mg TFD per Kg of bodyweight following a dose of 14.3 mg per Kg of body weight.
We did not observe TFD to undergo chemical decomposition during theexposure period.
We recommend this analytical method for eval• tiion of the amount of drugretained by animals d.ring inhalation exposure experiments.
*L. J. Bellamy, The Infrared SRectra of Comnex KMolecules (Chapman and HallLtd, London, Eng, 1975), 3rd ed., pp 395-397.
10

Distribution List
Addresses copies Addresses cQpies
Defense Technical Information 12 Commander ICenter US Any Psearch Institute of
ATM: DLIC-DDAC Ewir ntal Medicine-eon Staticn, Bldg 5 Bldg 42Alexandria, VA 22304-6145 Natick, NA 01760-5007
Crxier 2 CmMaIdantUS Army Medical Research US Army Chmical School
and Development Command Af"N: AN-CK-CFort Detrick, MD 21701-5012 Fort lMuellan, AL 36205
HQM(MSG-HM) 1 DirectorWashington, DC 20310 Armed Forces Medical
Intelligence CnterDirector 1 Fort Detrick, MD 21701-5004Walter Reed Army Institute of
Research CommanderBldg 40 US Army Institute of DentalWashixrgtm, DC 20307-5100 Research
Bldg 40Commallder 1 Washington, DC 20307-5100Letterman Army Institute
of Research O a1Bldg 1110 US Army Institute of SurgicalPresidio of San Francisco, CA Research
94129-6800 Bldg 2653Fort Sam Houston, TX 78234-6200
Ccmmander 1US Army Aerameical Research Cnomm ant- 1
laboratory Academy of Health SciencesATrN: Scientific Information Ctr US ArmyP.O. Box 577 ATTN: RHA-CCFort ]baEker, AL 363E"-5000 Fort Sam Hcaiston, TX 78234-6100
Commander 1 Comwxan~ntUS Army Biomeical Research Acaemy of Health Sciesns
and Develcpnent Laboratory US ArmyBldg 568 ATIN: SHA--CMFort Detrick, MD 21701-5010 Fort Sam Houtmt, TX 78234-6100
Ccumander 1 Dr. Joseph Osterman 1US Army Medical Research Institute Director, ~virionmental and
of Infectious Disease Life ScierncsBldg 1425 Office of the Deputy Under SecretaryFort Detrick, MD 21701-5011 of Dmfarme (JIt & vdr T7b -.-lcy)
Paom 3D129Waddriqtax, DC 20301-2300
11

1 Deartment of Health andrUS Ar•y Training ard DOctrine, aun Services
Qzmuand Naticrml Iratitutes of HealthA7Ml: AMW The National Library of YadicineFort Monroe, VA 23651 Serial Pacozds Section
8600 fockville PIimam= I Bethesdat, 20894
US Azry Nuclear and CmnicalPqerr' Stemson Library
7500 Bcaddick Road Academy of Health ScierncssBldg 2073 Bldg 2840, IJm 106Springfield, VA 22150-3198 Fort Sam Hm-atml, T 78234-6100
Biological Science Division 1 US Army Plesear OfficeOffice of Naval Research ATIN: Chuical and BiologicalArlington, VA 22217 Sciences Division
P.O. BoK 12211•citive Officer I Research Triangle Park, NC
Naval Y58dical Research Institute 27709-2211Naval Medicine CitmmndNational Capital Region A •SR/NLBethesda, MD 20814 Bldg 410, Rm A217
Bolling APB, DC 20332USAF School of Aerospace 1
Medicine/VN Q ImrxleCrew Technology Division US Army awmical Research,Brooks A--, TX 78235-5000 Develcmnnt & Engirwering Ctr
ATT•I R-itSCauarder 27 Aberdeen Proving Ground, EDUS Anry Medical Research 21010-5423
Institute of Chemical DefenseATTN: SGRD-UV-ZA
SGR>D-V-ZBSGD-IV-ZS (2 copies)SMD-V-RC (5 copies)SGRD-UV-R (13 copies)SGRD-WUV-AI-WSGD-UV-DStD-UV-PSGRD-UV-VSGRD-UV-Y
Aberdeen Proving Gromun, MD21010-5425
12


![Chronic Obstructive Pulmonary Diseaseopenaccessebooks.com/chronic-obstructive-pulmonary...Chronic Obstructive Pulmonary Disease 5 a-MCI is made [32]. COPD patients without significant](https://img.pdfslide.us/doc/110x75/5f853ccf82a2412fd65b9e28/chronic-obstructive-pulmonary-dis-chronic-obstructive-pulmonary-disease-5-a-mci.jpg)