Embed Size (px)
Citation preview
2020
Russia Economic Report #43
Russia: Recession and Growth under the Shadow of a Pandemic
Special Focus: Education
The cutoff date for the analysis and data used in this report was June 30, 2020 for parts 1 and 2.
1
Table of Contents
OVERVIEW ......................................................................................................................................................................... 7
PART 1. Recent Economic Developments ....................................................................................................................... 16
1.1 Global activity: a sharp recession amid the COVID-19 pandemic ..................................................... 16
1.2 Russia: sliding into recession after relatively robust growth in the first quarter ............................. 21
1.3 Balance of payments: the COVID-19 crisis has weighed on the current account since February, mainly due to the contraction in energy goods exports ......................................................................... 26
1.4 Monetary Policy: The CBR moved to an accommodative monetary policy ............................................. 34
1.5 Financial sector: Vulnerabilities on the Rise ..................................................................................... 37
1.6 Fiscal policy: Fiscal revenues are under strain from low oil prices and the spread of the pandemic ................................................................................................................................................................ 45
1.7 Labor market and poverty trends ..................................................................................................... 50
PART 2. Outlook: A deep recession looms – with a modest hike in the poverty rate .................................................... 61
PART 3. Education in Russia ............................................................................................................................................ 67
1. The importance of education in Russia and long-term positioning for stronger economic growth .. 68
2. Better and smarter education has been a focus of government policies ........................................... 74
3. The short- and long-term impacts of COVID-19 on Russia’s education system ................................. 79
4. Challenges of Russia as a premium higher education destination: the value of internationalization and concentration on elite universities .................................................................................................. 83
Conclusion ............................................................................................................................................... 87
Annex .............................................................................................................................................................................. 90
List of Figures
Figure 1: Global activity has fallen into a recession .................................................................................... 17
Figure 2: The global goods trade has sharply contracted amid supply-chain disruptions and weak
demand ....................................................................................................................................................... 17
Figure 3: Global stock markets recovered and borrowing costs stabilized ............................................... 17
Figure 4: Google mobility indicators have underscored the weakness in economic activity .................... 18
Figure 5: In the first quarter of 2020, economic growth in China contracted by 6.8 percent .................... 19
Figure 6: Brent crude oil prices fell to a multi-decade low ......................................................................... 20
Figure 7: Demand for oil is expected to decline 18 percent in the second quarter of 2020 ...................... 20
Figure 8: In the United States, the oil rig count fell to its lowest level since 2009 ..................................... 20
Figure 9: The epidemic reached Russia later than the EU, US, and Asian countries .................................. 21
Figure 10: High-frequency indicators of consumer and investment demand suggest continued growth in
January -February ....................................................................................................................................... 21
Figure 11: In the first quarter of 2020, GDP growth flash estimate points to a limited effect from COVID-
2
19 ................................................................................................................................................................ 22
Figure 12: Export volumes for many commodities exported by Russia dropped in the first quarter of
2020 compared to the first quarter of 2019 ............................................................................................... 22
Figure 13: Electricity consumption dropped in April (adjusted for temperature effects, y/y) ................... 22
Figure 14: In April, growth weakened in all sectors except agriculture ..................................................... 23
Figure 15: PMI indexes reached record lows in April ................................................................................. 23
Figure 16: The number of SMEs has declined, notably in the Central Federal District .............................. 24
Figure 17: The number of employees in SMEs has followed a declining trend, picking up in May 2020... 24
Figure 18: The current account weakened in the first quarter of 2020 to 5.5 percent of GDP compared to
8.9 percent of GDP in the same period last year ........................................................................................ 27
Figure 19: In the beginning of 2020, prices dropped for most commodities exported by Russia .............. 27
Figure 20: Total goods exports fell by 19.8 percent, y/y, in January-April 2020 ........................................ 28
Figure 21: Services exports fell by 5 percent, y/y, in the first quarter of 2020 and by 18 percent in
January-April 2020 ...................................................................................................................................... 28
Figure 22: Exports to the EU, CIS, and Asia dropped considerably in January-March 2020, y/y, imports
declined modestly ....................................................................................................................................... 28
Figure 23: In March, inflation rose for the first time in a year ................................................................... 35
Figure 24: Heightened global risk aversion on financial markets created pressure on the exchange rate
and bond spreads in Russia, which was exacerbated by a slump in oil prices ........................................... 37
Figure 25: Deposits remain banks’ main funding source (as percent of total liabilities) ........................... 38
Figure 26: High level of NPLs in the system ................................................................................................ 38
Figure 27: Key credit and financial-sector performance indicators remained stable at the onset of
pandemic .................................................................................................................................................... 39
Figure 28: Credit growth dynamics continue to be mixed .......................................................................... 39
Figure 29: Corporate loans account for 54 percent of the banking sector loan portfolio, as of April 1 .... 43
Figure 30: Among the most vulnerable sectors in the corporate sector lending portfolio are
manufacturing, trade, and transportation (structure of debt by sector, as of May 1)............................... 43
Figure 31: The federal budget surplus dropped in the first five months of 2020 ...................................... 46
Figure 32: Regional budget expenditure rose by 14.4 percent in January-April 2020, compared to
January-April 2019 ...................................................................................................................................... 46
Figure 33: Russia’s support package is low, relative to advanced economies, but at par with others
(percent of GDP) ......................................................................................................................................... 49
Figure 34: In terms of government debt sustainability and external sector debt, Russia favorably
compares to other EMDEs .......................................................................................................................... 50
Figure 35: The number of employed and labor force decreased in April-May .......................................... 51
Figure 36: The unemployment rate was close to a minimum but increased in April-May, percent .......... 51
Figure 37: Real wage contracted in April 2020 across most sectors, percent year-on-year ..................... 52
Figure 38: Real disposable income decreased in the Q1 2020 compared to the same period of 2019,
percent year-on-year .................................................................................................................................. 52
Figure 39: Ex ante, announced government measures could partly contain the crisis-induced increase . 56
3
Figure 40: The impact of the crisis varies by groups of population ............................................................ 57
Figure 41: Crude oil supply is expected to fall ............................................................................................ 62
Figure 42: The growth forecast for Russia suggests deep contraction in 2020 (real GDP growth, percent)
.................................................................................................................................................................... 63
Figure 43: Crude oil, oil products, and natural gas accounted for 87.6 percent of energy export value,
and 54.4 percent of total exports (2019) .................................................................................................... 63
Figure 44: Infrastructure projects and support to SMEs total about half of the plan ............................... 66
Figure 45: Top Harmonized Learning Outcomes Performers ..................................................................... 69
Figure 46: Relative performance in collaborative problem solving based on performance in PISA science,
reading and mathematics ........................................................................................................................... 72
Figure 47: Potential learning loss in reading in Russia due to COVID-19 (if schools are closed for 5
months) ....................................................................................................................................................... 81
Figure 48: An effective online learning support platform is available (percentage of 15-year-old students
whose school principal agreed or strongly agreed when answering this question) .................................. 82
List of Tables
Table 1: Balance of payments accounts, US$ bln ....................................................................................... 30
Table 2: Fiscal support measures total 3.9 percent of GDP. ....................................................................... 47
Table 3: Poverty (cumulative) ..................................................................................................................... 53
Table 4: A deep recession is projected in 2020 (Major macroeconomic indicators) ................................. 64
Table 5: Actual poverty rates and projections by scenarios (percent): ...................................................... 64
Table 7: Skill shortages as reported by employers in Russia ...................................................................... 71
Table 8: Policies for each group of Russian regions .................................................................................... 76
Table 9: Progress of Russian universities in international university rankings (2012-2020). ..................... 83
List of Boxes
Box 1: SMEs are disproportionally affected by the current crisis, being more vulnerable and less resilient
to the supply and demand shocks, while relying more on a services consumption that has rapidly
declined. ...................................................................................................................................................... 25
Box 2: Russia and the EAEU impose restrictive trade policies in response to COVID-19. ......................... 30
Box 3: Financial-Sector Support Measures in Response to COVID-19. ....................................................... 40
Box 4: SME Support Measures in Response to COVID-19 .......................................................................... 44
Box 5: The Returns to Education: Crucial Component of Russia’s Human Capital ..................................... 78
Box 6: Methodology for Estimating the Impact of COVID-19-Induced School Closures on Learning Loss*
.................................................................................................................................................................... 79
4
Abbreviations and Acronyms
AML/CFT ARWU
BNM
CAR
CBR
CGC
CIS
CLPS
COVID-19
CPAP
CPB
CPI
EAEU
ECA
ECDC
EGE
EMBI
EMDEs
EU
EUROMOD
FDI
FX
GDP
GFC
GNFS
HCI
HLO
HSBC
HSE
IEA
IMF
KYC
LNG
MSCI
NPA
NPL
NWF
OECD
OPEC
PBOC
PIRLS
PISA
PIT
Anti-Money Laundering/Combating the Financing of Terrorism Academic Ranking of World Universities
Bank Negara Malaysia
Capital Adequacy Ratio
Central Bank of the Russian Federation
Credit Guarantee Corporation Malaysia
Commonwealth of Independent States
Collaborative Problem Solving
Coronavirus Disease
Constant Positive Airway Pressure
Netherlands Bureau for Economic Policy Analysis
Consumer Price Inflation
Eurasian Economic Union
Europe and Central Asia
European Centre for Disease Prevention and Control
Unified State Examination
Emerging Markets Bond Index
Emerging Markets and Developing Economies
European Union
Tax-Benefit Microsimulation Model for The European Union
Foreign Direct Investment
Foreign Exchange
Gross Domestic Product
Global financial crisis
General Number Field Sieve
Human Capital Index
Harmonized Learning Outcomes
Hong Kong and Shanghai Banking Corporation
Higher School of Economics
International Energy Agency
International Monetary Fund
Know Your Customer
Liquified natural gas
Morgan Stanley Capital International
Non-performing assets
Non-performing loan
National Welfare Fund
Organization for Economic Co-operation and Development
Organization of the Petroleum Exporting Countries
People’s Bank of China
International Reading Literacy Study
Program for International Student Assessment
Personal Income Tax
5
PMI
QS
READ
REER
RF
RLMS
ROA
ROE
Rosstat
RUSMOD
SACE
SIC
SMEs
THE
TIMSS
VAT
WB
WTI
WTO
Purchasing Managers’ Index
Quacquarelli Symonds
Education Aid Development Program
Real Effective Exchange Rate
Russian Federation
Russia Longitudinal Monitoring Survey
Return on assets
Return on equity
Russian Federal State Statistics Service
Tax-Benefit Micro Simulation Model for Russia
Italian Export Credit Agency
Social Insurance Contributions
Small and Medium-Sized Enterprises
Times Higher Education
Trends in International Mathematics and Science Study
Value-Added Tax
The World Bank
West Texas Intermediate
World Trade Organization
6
Acknowledgements This report is produced twice a year by World Bank economists in the Macroeconomics, Trade and
Investment (MTI) Global Practice. The team that prepared this edition was led by Apurva Sanghi (Lead
Economist for the Russian Federation) and Olga Emelyanova (Economist, MTI), and consisted of Mikhail
Matytsin (Research Analyst, POV), Irina Rostovtseva (Research Analyst, MTI), Lucie Wuester (Consultant,
MTI), Katerina Levitanskaya (Senior Financial Sector Specialist, FCI), Martin Melecky (Lead Economist,
FCI), Peter Stephen Oliver Nagle (Senior Economist, EFI PG), Collette Mari Wheeler (Economist, EFI PG),
Julia Renee Roseman Norfleet (Research Analyst, EFI PG), Samuel Freije-Rodriguez (Lead Economist,
POV), Nithin Umapathi (Senior Economist, SPL), and Yohei Okawa (Economist, EFI PG).
The focus note on education in Russia was produced by the World Bank Education ECA Global Practice
team: Harry Anthony Patrinos (Practice Manager), Tigran Shmis (Senior Education Specialist, Education
ECA), Denis Nikolaev (Education Specialist), Maria Ustinova (Consultant), Polina Zavalina (Consultant)
and Suhas Parandekar (Senior Economist).
Peer reviewers included Dmitry Zaitsev (Commissioner, Accounts Chamber of the Russian Federation),
Kevin Carey (Practice Manager, EMNM2, MTI), Ivailo Izvorski (Lead Economist, EECM1, MTI) and Halsey
Rogers (Lead Economist, HEDGE, Education).
The team would like to thank Renaud Seligmann (Country Director for the Russian Federation), Sandeep
Mahajan (Practice Manager, MTI Global Practice), Asli Demirguc-Kunt (Chief Economist, ECACE), Michael
Lokshin (Lead Economist, ECACE), Ivan Torre (Economist, ECACE), Annette Kyobe (Resident
Representative, IMF), Oxana Dynnikova (Economist, IMF), Nina Chebotareva (Economist, IMF), Sergei
Ulatov (Director for coordination, Eurasian Development Bank) for their comments, advice and support.
The team also would like to express its gratitude to the Department for Budget Policy and Strategic
Planning of the Ministry of Finance for its collaboration.
The report was edited by Christopher Pala (Consultant). It went to press on July 6, 2020.
For queries, please contact Apurva Sanghi at [email protected].
7
OVERVIEW A. Sharp recession grips the world
The COVID-19 pandemic has triggered a deep global economic recession. The COVID-19 shock is the
most adverse peacetime shock to the global economy in a century. Activity contracted across major
economies in Q1 2020, including in China, the Euro Area, the United States and Japan, as these countries
grappled with the pandemic to varying degrees. Overall, global GDP is estimated to have sharply
contracted in Q1 2020 by -11.1 percent (q/q, saar), and is expected to drop by 5.2 percent overall in
2020. Global industrial production suffered its steepest fall since the 2008 global financial crisis.
Economic indicators point to an even steeper fall in Q2 2020, reflecting an unprecedented collapse in
services and manufacturing amid lockdown measures. Manufacturing activity and new export orders, as
measured by the Purchasing Managers' Index (PMI), have slid into a deep contraction as global trade
suffers from supply disruptions and weakened demand. Many emerging market and developing
economies (EMDEs) have experienced capital outflows greater than during the 2008 global financial
crisis as aversion to risk has spread and portfolio investors have moved to safer grounds with
unparalleled speed.
Crude oil prices have plummeted since the start of the year. They dropped 65 percent between January
and April. With incipient tensions in the global oil market already present in early 2020, oil demand
collapsed as a result of the pandemic, and the restrictions needed to stem its spread have severely
disrupted the transportation sector, which accounts for around two-thirds of oil demand. Oil demand is
expected to decline by an unprecedented 8 percent in 2020. However, since April, oil prices have seen a
partial recovery, with the price of Brent crude oil averaging US$40/bbl in June, up from US$23/bbl in
April, as some countries started to ease lockdown restrictions and oil producers have implemented
sharp cuts to production.
Activity in the Euro Area – Russia's largest trading partner – also contracted. The Euro Area GDP
contracted at an annualized rate of 13.6 percent in Q1 2020 — the steepest fall in the bloc's existence —
with several economies registering record declines. Retail sales and industrial production in the Euro
Area both experienced their largest contraction on record in March. The weak momentum in sales and
production will contribute to what is expected to be an unprecedented collapse in output during the
second quarter, possibly falling by nearly 50 percent (q/q, saar), according to the European Central Bank.
China, Russia's second-largest trading partner, has embarked on a fragile recovery after a major
economic contraction. Its GDP fell by 6.8 percent in Q1 2020, the first negative growth reading since
quarterly records began in 1992. However, incoming data suggest that the output decline softened
somewhat in March, as falls in industrial production, nominal retail sales, and imports and exports
bottomed out. Available daily activity data in April pointed to a continued gradual normalization of
economic activity. The recovery remains fragile, however, as air traffic and tourism, for example, remain
well below levels observed prior to COVID-19.
B. Russia heads toward a recession
According to the estimates of the Ministry of Economic Development, GDP contracted by 12. 1 percent,
y/y, in April and 10.9 percent, y/y, in May. High-frequency statistics in April and May pointed to negative
8
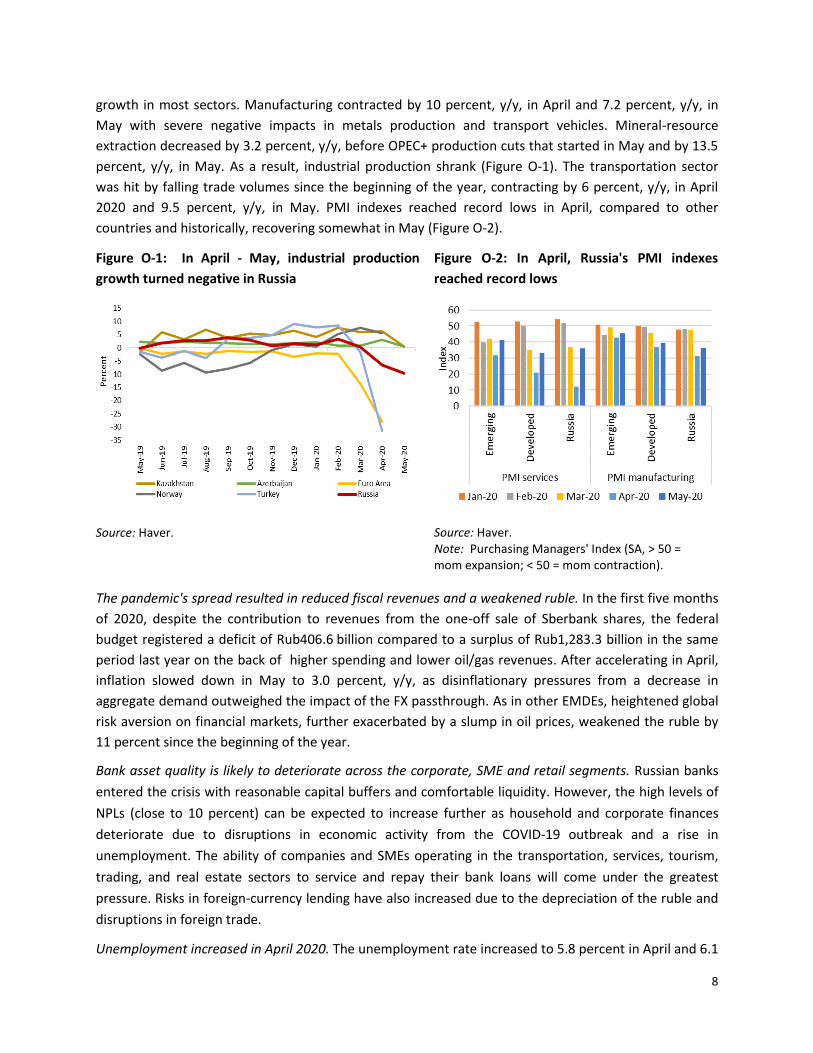
growth in most sectors. Manufacturing contracted by 10 percent, y/y, in April and 7.2 percent, y/y, in
May with severe negative impacts in metals production and transport vehicles. Mineral-resource
extraction decreased by 3.2 percent, y/y, before OPEC+ production cuts that started in May and by 13.5
percent, y/y, in May. As a result, industrial production shrank (Figure O-1). The transportation sector
was hit by falling trade volumes since the beginning of the year, contracting by 6 percent, y/y, in April
2020 and 9.5 percent, y/y, in May. PMI indexes reached record lows in April, compared to other
countries and historically, recovering somewhat in May (Figure O-2).
The pandemic's spread resulted in reduced fiscal revenues and a weakened ruble. In the first five months
of 2020, despite the contribution to revenues from the one-off sale of Sberbank shares, the federal
budget registered a deficit of Rub406.6 billion compared to a surplus of Rub1,283.3 billion in the same
period last year on the back of higher spending and lower oil/gas revenues. After accelerating in April,
inflation slowed down in May to 3.0 percent, y/y, as disinflationary pressures from a decrease in
aggregate demand outweighed the impact of the FX passthrough. As in other EMDEs, heightened global
risk aversion on financial markets, further exacerbated by a slump in oil prices, weakened the ruble by
11 percent since the beginning of the year.
Bank asset quality is likely to deteriorate across the corporate, SME and retail segments. Russian banks
entered the crisis with reasonable capital buffers and comfortable liquidity. However, the high levels of
NPLs (close to 10 percent) can be expected to increase further as household and corporate finances
deteriorate due to disruptions in economic activity from the COVID-19 outbreak and a rise in
unemployment. The ability of companies and SMEs operating in the transportation, services, tourism,
trading, and real estate sectors to service and repay their bank loans will come under the greatest
pressure. Risks in foreign-currency lending have also increased due to the depreciation of the ruble and
disruptions in foreign trade.
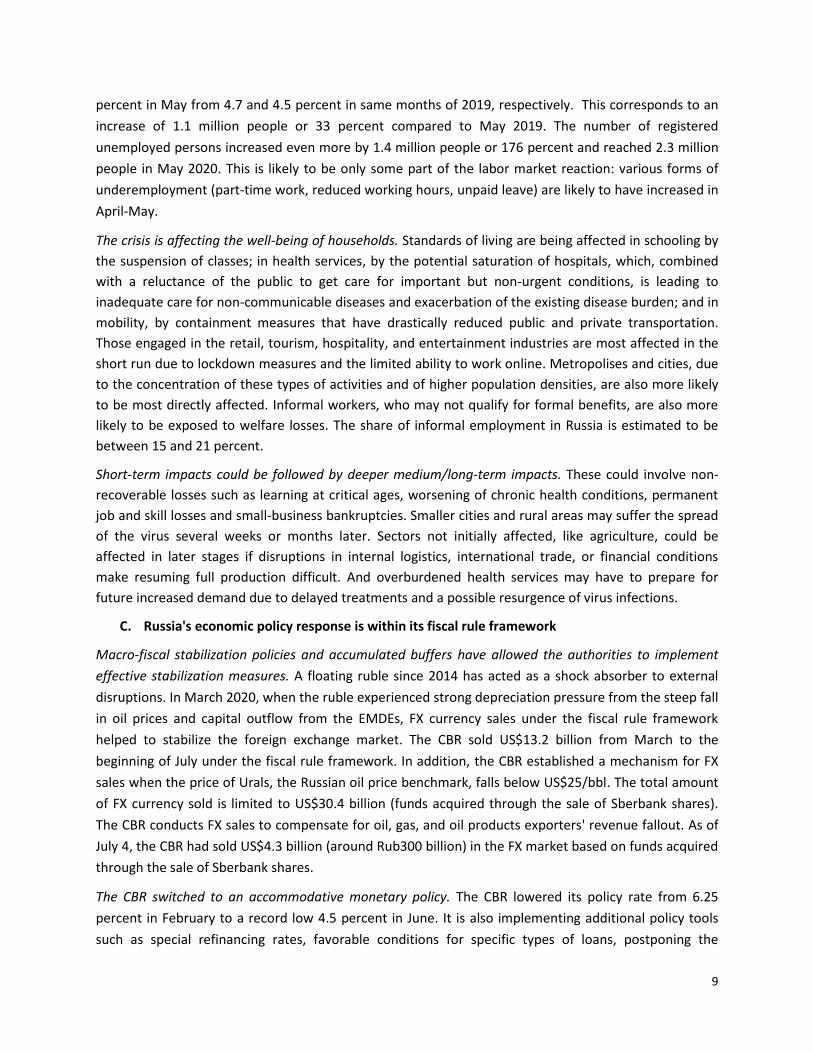
Unemployment increased in April 2020. The unemployment rate increased to 5.8 percent in April and 6.1
Figure O-1: In April - May, industrial production
growth turned negative in Russia
Figure O-2: In April, Russia's PMI indexes
reached record lows
Source: Haver. Source: Haver. Note: Purchasing Managers' Index (SA, > 50 = mom expansion; < 50 = mom contraction).
9
percent in May from 4.7 and 4.5 percent in same months of 2019, respectively. This corresponds to an
increase of 1.1 million people or 33 percent compared to May 2019. The number of registered
unemployed persons increased even more by 1.4 million people or 176 percent and reached 2.3 million
people in May 2020. This is likely to be only some part of the labor market reaction: various forms of
underemployment (part-time work, reduced working hours, unpaid leave) are likely to have increased in
April-May.
The crisis is affecting the well-being of households. Standards of living are being affected in schooling by
the suspension of classes; in health services, by the potential saturation of hospitals, which, combined
with a reluctance of the public to get care for important but non-urgent conditions, is leading to
inadequate care for non-communicable diseases and exacerbation of the existing disease burden; and in
mobility, by containment measures that have drastically reduced public and private transportation.
Those engaged in the retail, tourism, hospitality, and entertainment industries are most affected in the
short run due to lockdown measures and the limited ability to work online. Metropolises and cities, due
to the concentration of these types of activities and of higher population densities, are also more likely
to be most directly affected. Informal workers, who may not qualify for formal benefits, are also more
likely to be exposed to welfare losses. The share of informal employment in Russia is estimated to be
between 15 and 21 percent.
Short-term impacts could be followed by deeper medium/long-term impacts. These could involve non-
recoverable losses such as learning at critical ages, worsening of chronic health conditions, permanent
job and skill losses and small-business bankruptcies. Smaller cities and rural areas may suffer the spread
of the virus several weeks or months later. Sectors not initially affected, like agriculture, could be
affected in later stages if disruptions in internal logistics, international trade, or financial conditions
make resuming full production difficult. And overburdened health services may have to prepare for
future increased demand due to delayed treatments and a possible resurgence of virus infections.
C. Russia's economic policy response is within its fiscal rule framework
Macro-fiscal stabilization policies and accumulated buffers have allowed the authorities to implement
effective stabilization measures. A floating ruble since 2014 has acted as a shock absorber to external
disruptions. In March 2020, when the ruble experienced strong depreciation pressure from the steep fall
in oil prices and capital outflow from the EMDEs, FX currency sales under the fiscal rule framework
helped to stabilize the foreign exchange market. The CBR sold US$13.2 billion from March to the
beginning of July under the fiscal rule framework. In addition, the CBR established a mechanism for FX
sales when the price of Urals, the Russian oil price benchmark, falls below US$25/bbl. The total amount
of FX currency sold is limited to US$30.4 billion (funds acquired through the sale of Sberbank shares).
The CBR conducts FX sales to compensate for oil, gas, and oil products exporters' revenue fallout. As of
July 4, the CBR had sold US$4.3 billion (around Rub300 billion) in the FX market based on funds acquired
through the sale of Sberbank shares.
The CBR switched to an accommodative monetary policy. The CBR lowered its policy rate from 6.25
percent in February to a record low 4.5 percent in June. It is also implementing additional policy tools
such as special refinancing rates, favorable conditions for specific types of loans, postponing the
10
introduction of tighter rules, and reducing regulatory and supervisory burdens for financial institutions.
Moreover, the CBR has introduced a Rub500 billion facility to support SMEs lending and has approved
measures to ease liquidity regulations for systemically important financial institutions. The CBR also
announced measures to maintain the availability of insurance services, to support professional
participants in the securities market and the trading and clearing infrastructure, and to support
collective investment market participants. For households affected by the COVID-19 crisis, the CBR
allowed banks and microfinance organizations to restructure their loans, forgo penalties and avoid
foreclosures on collateral.
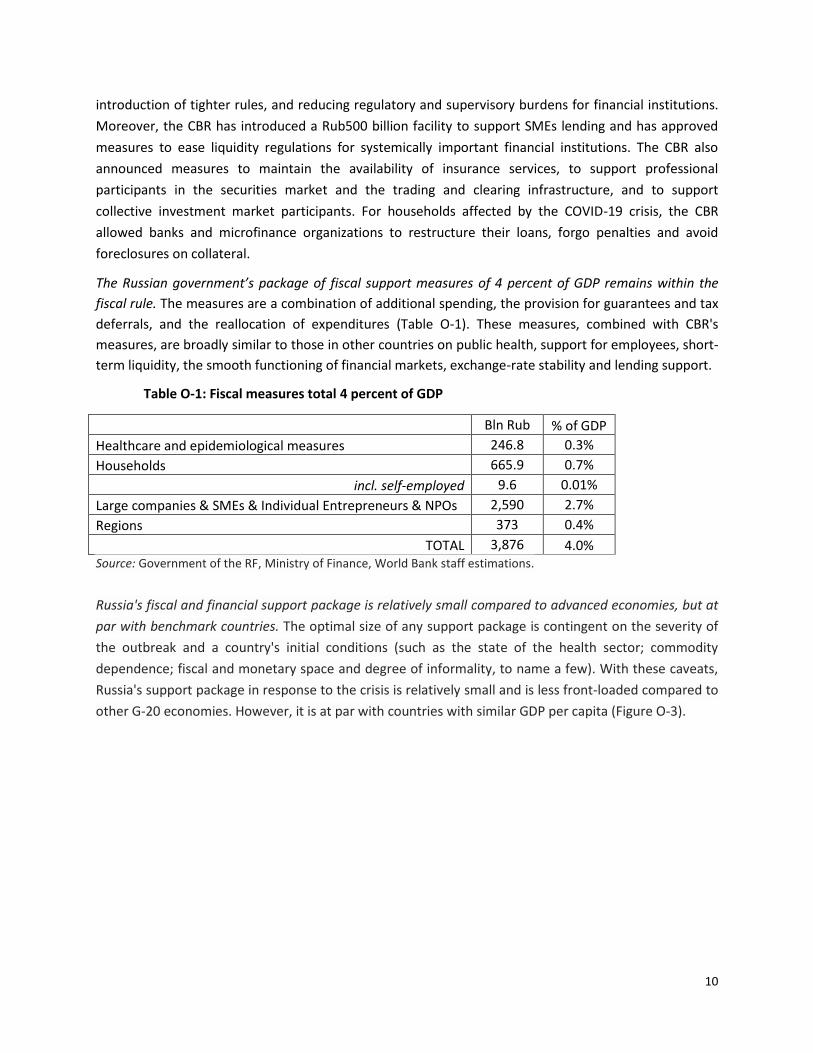
The Russian government’s package of fiscal support measures of 4 percent of GDP remains within the
fiscal rule. The measures are a combination of additional spending, the provision for guarantees and tax
deferrals, and the reallocation of expenditures (Table O-1). These measures, combined with CBR's
measures, are broadly similar to those in other countries on public health, support for employees, short-
term liquidity, the smooth functioning of financial markets, exchange-rate stability and lending support.
Table O-1: Fiscal measures total 4 percent of GDP
Bln Rub % of GDP
Healthcare and epidemiological measures 246.8 0.3%
Households 665.9 0.7%
incl. self-employed 9.6 0.01%
Large companies & SMEs & Individual Entrepreneurs & NPOs 2,590 2.7%
Regions 373 0.4%
TOTAL 3,876 4.0% Source: Government of the RF, Ministry of Finance, World Bank staff estimations.
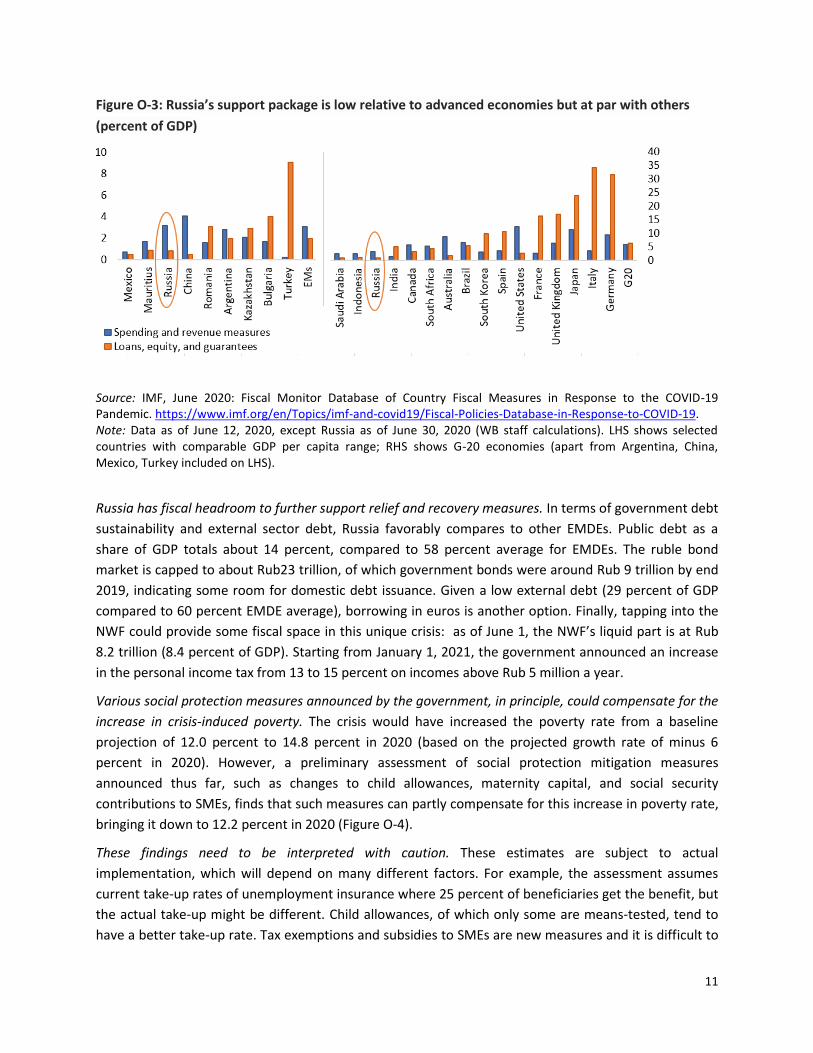
Russia's fiscal and financial support package is relatively small compared to advanced economies, but at
par with benchmark countries. The optimal size of any support package is contingent on the severity of
the outbreak and a country's initial conditions (such as the state of the health sector; commodity
dependence; fiscal and monetary space and degree of informality, to name a few). With these caveats,
Russia's support package in response to the crisis is relatively small and is less front-loaded compared to
other G-20 economies. However, it is at par with countries with similar GDP per capita (Figure O-3).
11
Figure O-3: Russia’s support package is low relative to advanced economies but at par with others
(percent of GDP)
Source: IMF, June 2020: Fiscal Monitor Database of Country Fiscal Measures in Response to the COVID-19 Pandemic. https://www.imf.org/en/Topics/imf-and-covid19/Fiscal-Policies-Database-in-Response-to-COVID-19. Note: Data as of June 12, 2020, except Russia as of June 30, 2020 (WB staff calculations). LHS shows selected countries with comparable GDP per capita range; RHS shows G-20 economies (apart from Argentina, China, Mexico, Turkey included on LHS).
Russia has fiscal headroom to further support relief and recovery measures. In terms of government debt
sustainability and external sector debt, Russia favorably compares to other EMDEs. Public debt as a
share of GDP totals about 14 percent, compared to 58 percent average for EMDEs. The ruble bond
market is capped to about Rub23 trillion, of which government bonds were around Rub 9 trillion by end
2019, indicating some room for domestic debt issuance. Given a low external debt (29 percent of GDP
compared to 60 percent EMDE average), borrowing in euros is another option. Finally, tapping into the
NWF could provide some fiscal space in this unique crisis: as of June 1, the NWF’s liquid part is at Rub
8.2 trillion (8.4 percent of GDP). Starting from January 1, 2021, the government announced an increase
in the personal income tax from 13 to 15 percent on incomes above Rub 5 million a year.
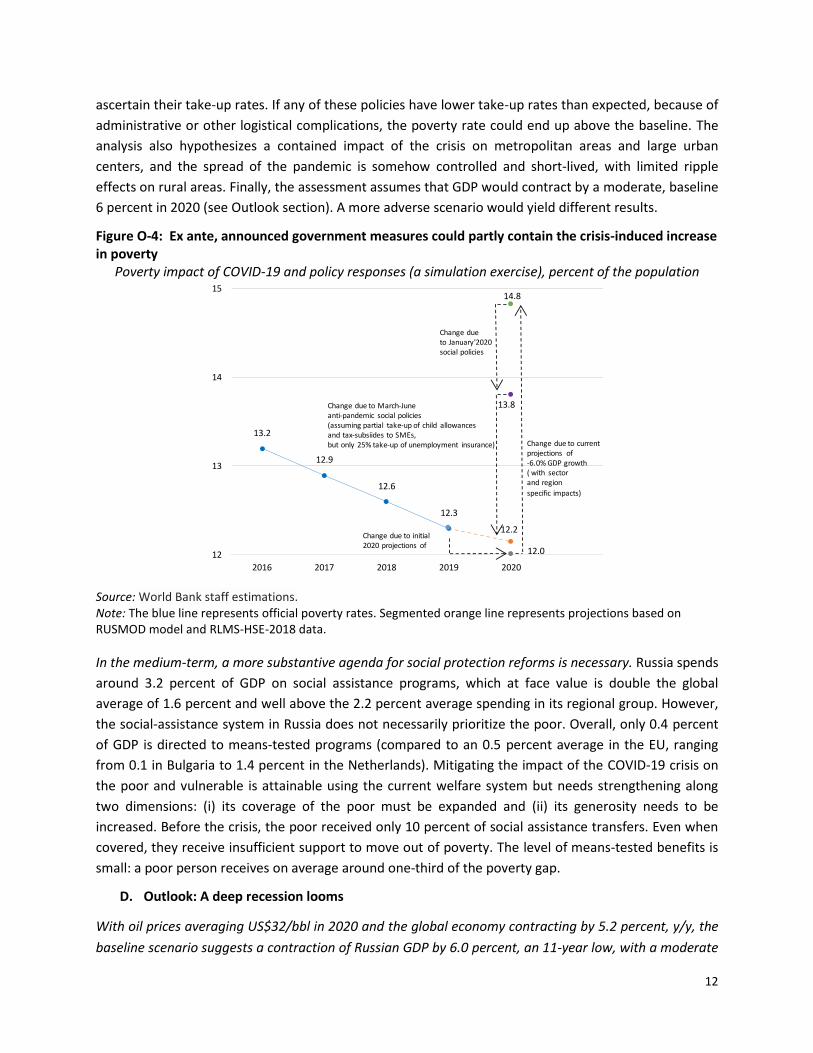
Various social protection measures announced by the government, in principle, could compensate for the
increase in crisis-induced poverty. The crisis would have increased the poverty rate from a baseline
projection of 12.0 percent to 14.8 percent in 2020 (based on the projected growth rate of minus 6
percent in 2020). However, a preliminary assessment of social protection mitigation measures
announced thus far, such as changes to child allowances, maternity capital, and social security
contributions to SMEs, finds that such measures can partly compensate for this increase in poverty rate,
bringing it down to 12.2 percent in 2020 (Figure O-4).
These findings need to be interpreted with caution. These estimates are subject to actual
implementation, which will depend on many different factors. For example, the assessment assumes
current take-up rates of unemployment insurance where 25 percent of beneficiaries get the benefit, but
the actual take-up might be different. Child allowances, of which only some are means-tested, tend to
have a better take-up rate. Tax exemptions and subsidies to SMEs are new measures and it is difficult to
12
ascertain their take-up rates. If any of these policies have lower take-up rates than expected, because of
administrative or other logistical complications, the poverty rate could end up above the baseline. The
analysis also hypothesizes a contained impact of the crisis on metropolitan areas and large urban
centers, and the spread of the pandemic is somehow controlled and short-lived, with limited ripple
effects on rural areas. Finally, the assessment assumes that GDP would contract by a moderate, baseline
6 percent in 2020 (see Outlook section). A more adverse scenario would yield different results.
Figure O-4: Ex ante, announced government measures could partly contain the crisis-induced increase in poverty
Poverty impact of COVID-19 and policy responses (a simulation exercise), percent of the population
Source: World Bank staff estimations. Note: The blue line represents official poverty rates. Segmented orange line represents projections based on RUSMOD model and RLMS-HSE-2018 data.
In the medium-term, a more substantive agenda for social protection reforms is necessary. Russia spends
around 3.2 percent of GDP on social assistance programs, which at face value is double the global
average of 1.6 percent and well above the 2.2 percent average spending in its regional group. However,
the social-assistance system in Russia does not necessarily prioritize the poor. Overall, only 0.4 percent
of GDP is directed to means-tested programs (compared to an 0.5 percent average in the EU, ranging
from 0.1 in Bulgaria to 1.4 percent in the Netherlands). Mitigating the impact of the COVID-19 crisis on
the poor and vulnerable is attainable using the current welfare system but needs strengthening along
two dimensions: (i) its coverage of the poor must be expanded and (ii) its generosity needs to be
increased. Before the crisis, the poor received only 10 percent of social assistance transfers. Even when
covered, they receive insufficient support to move out of poverty. The level of means-tested benefits is
small: a poor person receives on average around one-third of the poverty gap.
D. Outlook: A deep recession looms
With oil prices averaging US$32/bbl in 2020 and the global economy contracting by 5.2 percent, y/y, the
baseline scenario suggests a contraction of Russian GDP by 6.0 percent, an 11-year low, with a moderate
13.2
12.9
12.6
12.3
12.2
12.0
14.8
13.8
12
13
14
15
2016 2017 2018 2019 2020
Change due to initial 2020 projections of
Change due to January'2020social policies
Change due to current projections of -6.0% GDP growth( with sector and region
specific impacts)
Change due to March-June anti-pandemic social policies(assuming partial take-up of child allowances and tax-subsiides to SMEs, but only 25% take-up of unemployment insurance)
13
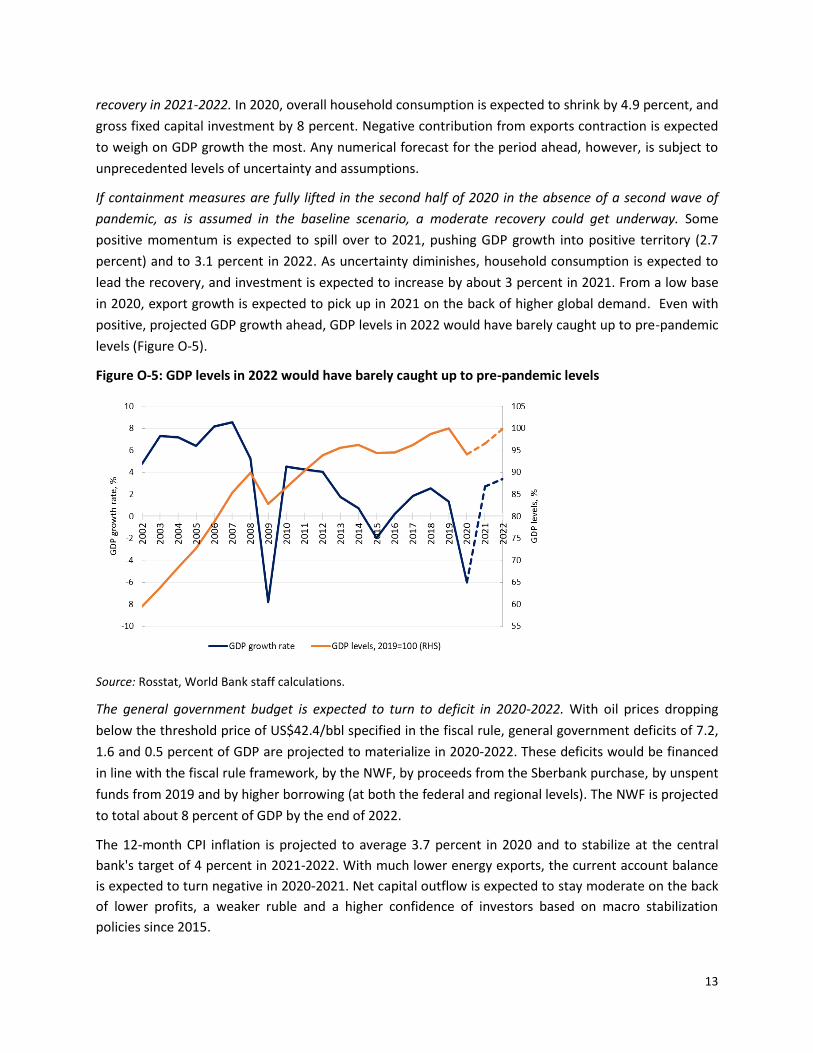
recovery in 2021-2022. In 2020, overall household consumption is expected to shrink by 4.9 percent, and
gross fixed capital investment by 8 percent. Negative contribution from exports contraction is expected
to weigh on GDP growth the most. Any numerical forecast for the period ahead, however, is subject to
unprecedented levels of uncertainty and assumptions.
If containment measures are fully lifted in the second half of 2020 in the absence of a second wave of
pandemic, as is assumed in the baseline scenario, a moderate recovery could get underway. Some
positive momentum is expected to spill over to 2021, pushing GDP growth into positive territory (2.7
percent) and to 3.1 percent in 2022. As uncertainty diminishes, household consumption is expected to
lead the recovery, and investment is expected to increase by about 3 percent in 2021. From a low base
in 2020, export growth is expected to pick up in 2021 on the back of higher global demand. Even with
positive, projected GDP growth ahead, GDP levels in 2022 would have barely caught up to pre-pandemic
levels (Figure O-5).
Figure O-5: GDP levels in 2022 would have barely caught up to pre-pandemic levels
Source: Rosstat, World Bank staff calculations.
The general government budget is expected to turn to deficit in 2020-2022. With oil prices dropping
below the threshold price of US$42.4/bbl specified in the fiscal rule, general government deficits of 7.2,
1.6 and 0.5 percent of GDP are projected to materialize in 2020-2022. These deficits would be financed
in line with the fiscal rule framework, by the NWF, by proceeds from the Sberbank purchase, by unspent
funds from 2019 and by higher borrowing (at both the federal and regional levels). The NWF is projected
to total about 8 percent of GDP by the end of 2022.
The 12-month CPI inflation is projected to average 3.7 percent in 2020 and to stabilize at the central
bank's target of 4 percent in 2021-2022. With much lower energy exports, the current account balance
is expected to turn negative in 2020-2021. Net capital outflow is expected to stay moderate on the back
of lower profits, a weaker ruble and a higher confidence of investors based on macro stabilization
policies since 2015.
14
Risks are firmly tilted to the downside. They include a more protracted pandemic and hence a
prolongation of containment measures, a slow and shallow global economic recovery, a further drop in
commodity prices, and a slower recovery due to lasting impacts on households and firms and
disruptions in global value chains. Pre-existing financial-sector vulnerabilities could be amplified by the
pandemic. In a more adverse scenario, GDP could contract by 9.6 percent in 2020 and recover by a
marginal 0.1 percent in 2021.
E. Special Focus: Education in Russia
Education is a significant contributor to Russia’s human capital. Russia is ranked 34th in the World
Bank’s human capital index, and Russian students rank in the global top 10 in harmonized learning
outcomes (a measure of their performance in different international assessments of mathematics,
reading, and science). Systemic analyses, reforms, and the internationalization of education have helped
Russia become one of the leading countries in education outcomes. Russia both contributes to – and
benefits from – participating in the global education community.
However, there remain systemic issues with 21st-century skills, critical for the future labor force. Russian
students fare poorly in terms of collaborative problem-solving skills relative to their performance in the
traditional or cognitive skills measured by the OECD’s Programme for International Student Assessment
(PISA). That is, they do well in terms of traditional math, science, and reading proficiency, but not as well
in terms of what could be defined as “skills of the future.” The development of such skills is a critical
area for enhancing the Russian education system and can be an effective response to the COVID-19
crisis as it raises personal resilience, efficiency, and the employability of young citizens. Another
systemic issue is wide regional disparities. For example, premiums to education in Russian regions range
from 10.1 percent (Karelia Republic) to 38.2 percent (Altai Republic) at the university level and from 10.4
percent to 20.6 percent at the vocational level.
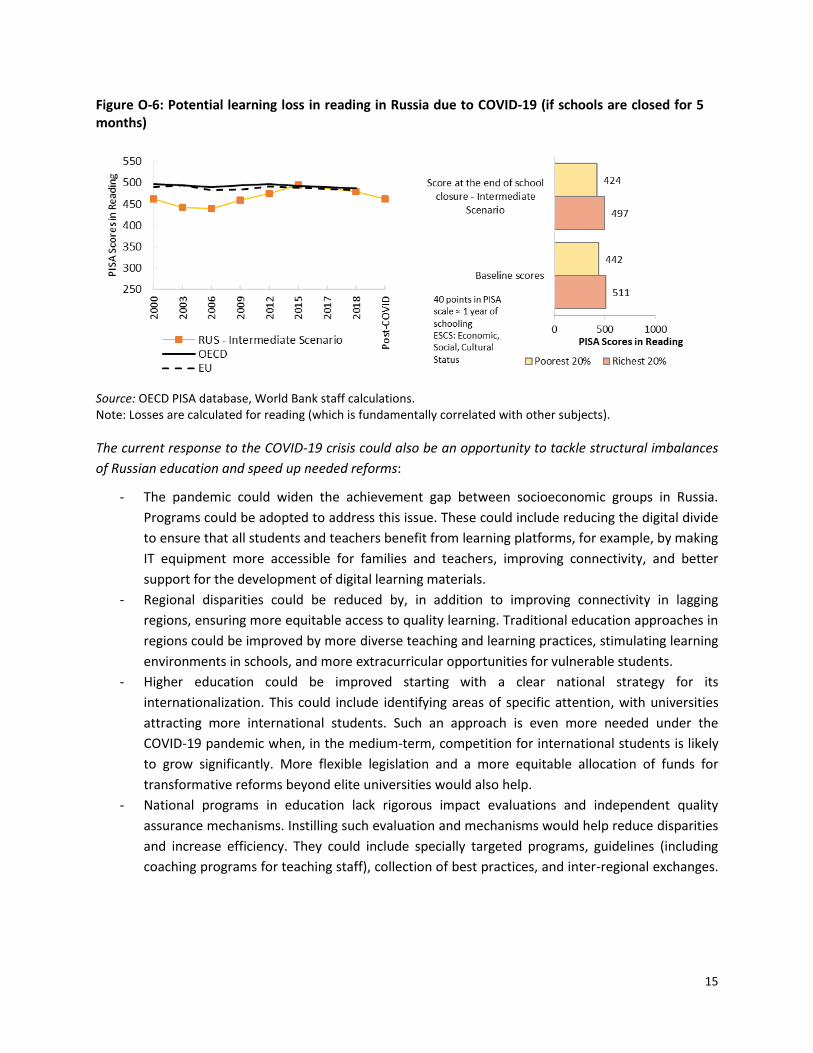
COVID-19-related school closures could lead to a learning loss of more than one-third of a Russian school
year. If schools remain closed for five months this year, the learning loss of the average student could
reach 16 PISA points in reading (despite current compensatory measures such as online learning and
educational TV). These losses are higher than those estimated for OECD and EU countries. Moreover,
there are distributional issues: while students from the top quintile could lose about 14 PISA points,
those in the bottom quintile could lose 18 points. These 18 points translate into a loss compared with
missing one-half of the year’s learning (Figure O-6). A five-month school closure could reduce marginal
future earnings by about 2.5 percent per year over a student’s working life. Longer closures would have
a larger impact.
15
Figure O-6: Potential learning loss in reading in Russia due to COVID-19 (if schools are closed for 5 months)
Source: OECD PISA database, World Bank staff calculations. Note: Losses are calculated for reading (which is fundamentally correlated with other subjects).
The current response to the COVID-19 crisis could also be an opportunity to tackle structural imbalances
of Russian education and speed up needed reforms:
- The pandemic could widen the achievement gap between socioeconomic groups in Russia.
Programs could be adopted to address this issue. These could include reducing the digital divide
to ensure that all students and teachers benefit from learning platforms, for example, by making
IT equipment more accessible for families and teachers, improving connectivity, and better
support for the development of digital learning materials.
- Regional disparities could be reduced by, in addition to improving connectivity in lagging
regions, ensuring more equitable access to quality learning. Traditional education approaches in
regions could be improved by more diverse teaching and learning practices, stimulating learning
environments in schools, and more extracurricular opportunities for vulnerable students.
- Higher education could be improved starting with a clear national strategy for its
internationalization. This could include identifying areas of specific attention, with universities
attracting more international students. Such an approach is even more needed under the
COVID-19 pandemic when, in the medium-term, competition for international students is likely
to grow significantly. More flexible legislation and a more equitable allocation of funds for
transformative reforms beyond elite universities would also help.
- National programs in education lack rigorous impact evaluations and independent quality
assurance mechanisms. Instilling such evaluation and mechanisms would help reduce disparities
and increase efficiency. They could include specially targeted programs, guidelines (including
coaching programs for teaching staff), collection of best practices, and inter-regional exchanges.
16
PART 1. Recent Economic Developments
1.1 Global activity: a sharp recession amid the COVID-19 pandemic
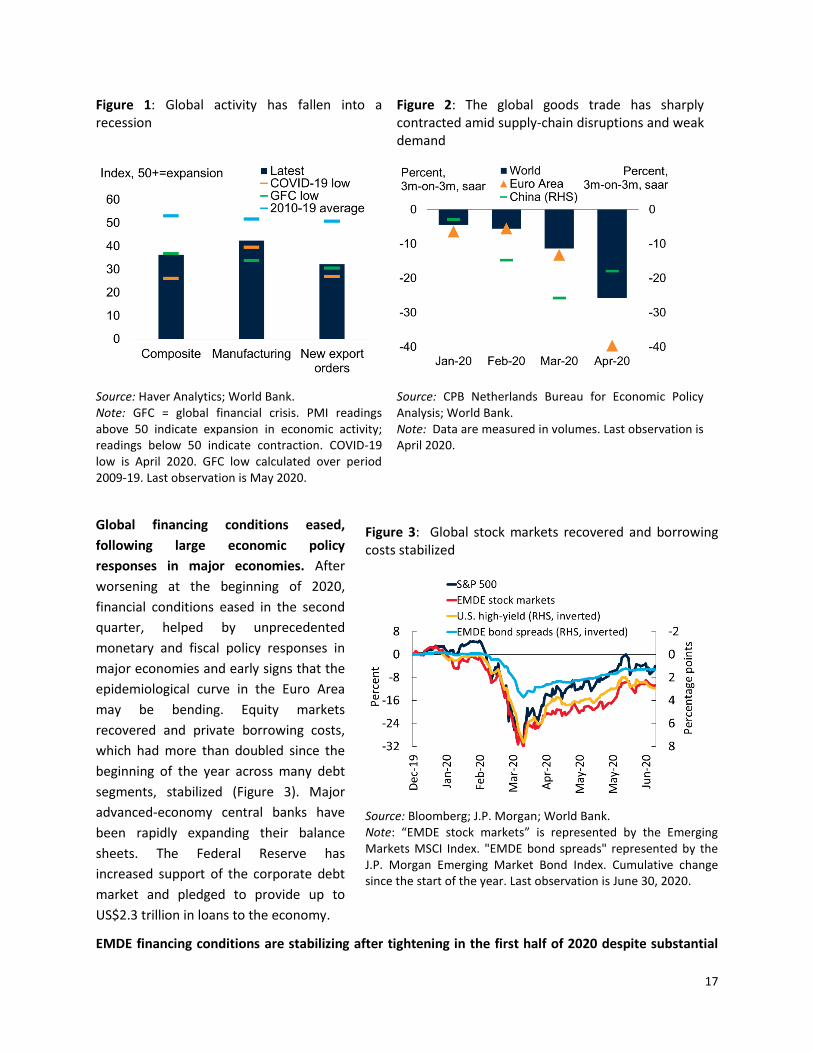
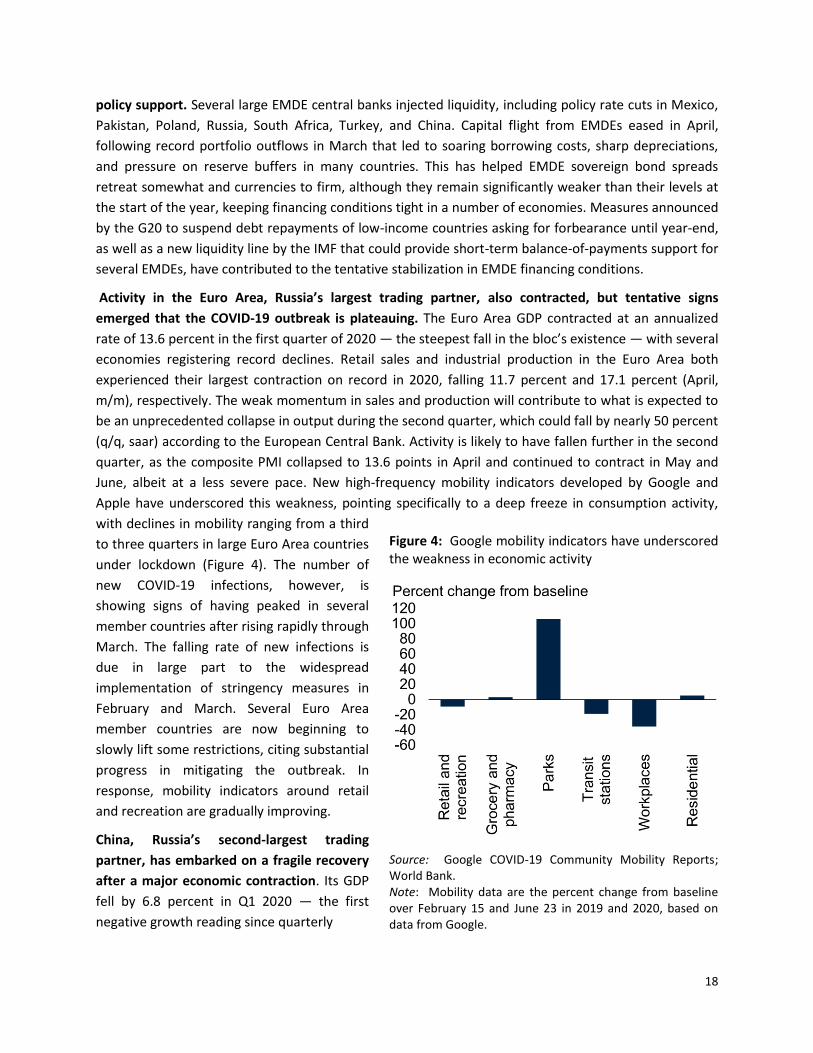
The COVID-19 pandemic has triggered a deep global economic recession. Global activity is expected to
contract 5.2 percent — the largest contraction since World War II — as countries grapple with the
COVID-19 pandemic to varying degrees. Global industrial production suffered its steepest fall since 2008
the global financial crisis in Q1 2020, at -4.4 percent (q/q, saar). Economic indicators point to an even
steeper fall in Q2 2020, reflecting an unprecedented collapse in services and manufacturing amid
lockdown measures. Nearly all countries have imposed stringent measures to stem the virus’s spread —
including travel restrictions, lockdowns, and international border and school closures — that have
generated both supply and demand shocks. The impact has been particularly severe for international
trade due to disruptions in the global value chain and weakened demand. Many emerging market and
developing economies (EMDEs) have experienced capital outflows greater than during the global
financial crisis, as aversion to risk has risen and portfolio investors have moved to safer grounds at an
unparalleled speed.
Crude oil prices have plummeted since the start of the year, dropping 65 percent between January and
April. With incipient tensions in the global oil market already present in early 2020, oil demand collapsed
as a result of the pandemic, and the restrictions needed to stem its spread have severely disrupted
transportation, which accounts for around two-thirds of oil demand. Oil demand is expected to decline
by an unprecedented 8 percent in 2020. However, since April, oil prices have seen a partial recovery, as
countries have started to ease lockdown restrictions, and oil producers have implemented sharp cuts to
production. The price of Brent crude oil averaged US$40/bbl in June, a substantial increase from its April
average of US$23/bbl.
The global economy has fallen into a sharp recession amid the COVID-19 pandemic.1 The pandemic,
which has infected over 7 million people globally, is expected to plunge the global economy into a deep
recession in 2020, with activity contracting 5.2 percent (World Bank 2020). The collapse in services
activity has been unprecedented, reflecting a sharp decline in demand amid associated lockdown
measures and travel restrictions (Figure 1). Manufacturing activity and new export orders, as measured
by the Purchasing Managers’ Index (PMI), have also slid into a deep contraction as global trade suffers
from supply disruptions and weakened demand.
Global trade flows have collapsed due to the fall in demand and to severe disruptions to value chains.
The international goods trade has been deeply affected by the fall in demand, as well as by severe
disruptions to global value chains, particularly in Europe and Asia (Figure 2). Global tourism — an
important source of export receipts for many economies — has also plunged due to the pandemic. Daily
counts of the number of commercial flights were down by more than three-quarters relative to last year
as of early June.
1 World Bank. 2020. Global Economic Prospects, June 2020. Washington, DC: World Bank.
17
Figure 1: Global activity has fallen into a recession
Figure 2: The global goods trade has sharply contracted amid supply-chain disruptions and weak demand
Source: Haver Analytics; World Bank. Note: GFC = global financial crisis. PMI readings above 50 indicate expansion in economic activity; readings below 50 indicate contraction. COVID-19 low is April 2020. GFC low calculated over period 2009-19. Last observation is May 2020.
Source: CPB Netherlands Bureau for Economic Policy Analysis; World Bank. Note: Data are measured in volumes. Last observation is April 2020.
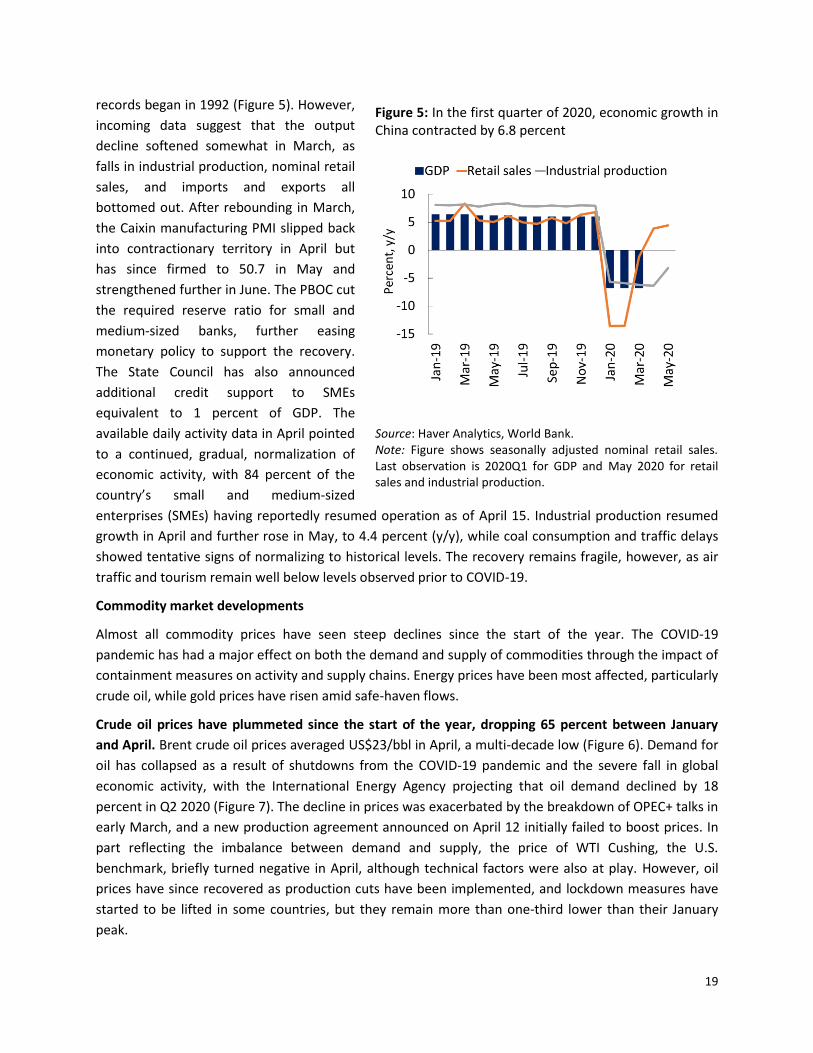
Global financing conditions eased,
following large economic policy
responses in major economies. After
worsening at the beginning of 2020,
financial conditions eased in the second
quarter, helped by unprecedented
monetary and fiscal policy responses in
major economies and early signs that the
epidemiological curve in the Euro Area
may be bending. Equity markets
recovered and private borrowing costs,
which had more than doubled since the
beginning of the year across many debt
segments, stabilized (Figure 3). Major
advanced-economy central banks have
been rapidly expanding their balance
sheets. The Federal Reserve has
increased support of the corporate debt
market and pledged to provide up to
US$2.3 trillion in loans to the economy.
EMDE financing conditions are stabilizing after tightening in the first half of 2020 despite substantial
Figure 3: Global stock markets recovered and borrowing costs stabilized
Source: Bloomberg; J.P. Morgan; World Bank. Note: “EMDE stock markets” is represented by the Emerging Markets MSCI Index. "EMDE bond spreads" represented by the J.P. Morgan Emerging Market Bond Index. Cumulative change since the start of the year. Last observation is June 30, 2020.
18
policy support. Several large EMDE central banks injected liquidity, including policy rate cuts in Mexico,
Pakistan, Poland, Russia, South Africa, Turkey, and China. Capital flight from EMDEs eased in April,
following record portfolio outflows in March that led to soaring borrowing costs, sharp depreciations,
and pressure on reserve buffers in many countries. This has helped EMDE sovereign bond spreads
retreat somewhat and currencies to firm, although they remain significantly weaker than their levels at
the start of the year, keeping financing conditions tight in a number of economies. Measures announced
by the G20 to suspend debt repayments of low-income countries asking for forbearance until year-end,
as well as a new liquidity line by the IMF that could provide short-term balance-of-payments support for
several EMDEs, have contributed to the tentative stabilization in EMDE financing conditions.
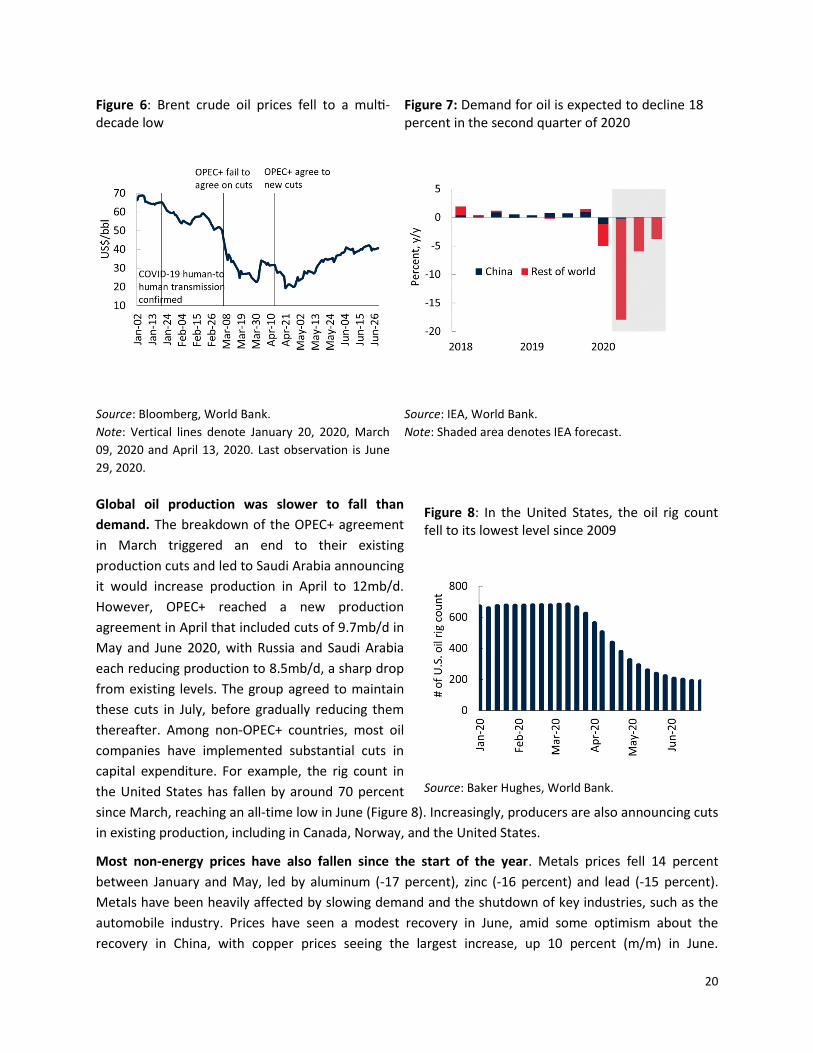
Activity in the Euro Area, Russia’s largest trading partner, also contracted, but tentative signs
emerged that the COVID-19 outbreak is plateauing. The Euro Area GDP contracted at an annualized
rate of 13.6 percent in the first quarter of 2020 — the steepest fall in the bloc’s existence — with several
economies registering record declines. Retail sales and industrial production in the Euro Area both
experienced their largest contraction on record in 2020, falling 11.7 percent and 17.1 percent (April,
m/m), respectively. The weak momentum in sales and production will contribute to what is expected to
be an unprecedented collapse in output during the second quarter, which could fall by nearly 50 percent
(q/q, saar) according to the European Central Bank. Activity is likely to have fallen further in the second
quarter, as the composite PMI collapsed to 13.6 points in April and continued to contract in May and
June, albeit at a less severe pace. New high-frequency mobility indicators developed by Google and
Apple have underscored this weakness, pointing specifically to a deep freeze in consumption activity,
with declines in mobility ranging from a third
to three quarters in large Euro Area countries
under lockdown (Figure 4). The number of
new COVID-19 infections, however, is
showing signs of having peaked in several
member countries after rising rapidly through
March. The falling rate of new infections is
due in large part to the widespread
implementation of stringency measures in
February and March. Several Euro Area
member countries are now beginning to
slowly lift some restrictions, citing substantial
progress in mitigating the outbreak. In
response, mobility indicators around retail
and recreation are gradually improving.
China, Russia’s second-largest trading
partner, has embarked on a fragile recovery
after a major economic contraction. Its GDP
fell by 6.8 percent in Q1 2020 — the first
negative growth reading since quarterly
Figure 4: Google mobility indicators have underscored the weakness in economic activity
Source: Google COVID-19 Community Mobility Reports; World Bank. Note: Mobility data are the percent change from baseline over February 15 and June 23 in 2019 and 2020, based on data from Google.
19
records began in 1992 (Figure 5). However,
incoming data suggest that the output
decline softened somewhat in March, as
falls in industrial production, nominal retail
sales, and imports and exports all
bottomed out. After rebounding in March,
the Caixin manufacturing PMI slipped back
into contractionary territory in April but
has since firmed to 50.7 in May and
strengthened further in June. The PBOC cut
the required reserve ratio for small and
medium-sized banks, further easing
monetary policy to support the recovery.
The State Council has also announced
additional credit support to SMEs
equivalent to 1 percent of GDP. The
available daily activity data in April pointed
to a continued, gradual, normalization of
economic activity, with 84 percent of the
country’s small and medium-sized
enterprises (SMEs) having reportedly resumed operation as of April 15. Industrial production resumed
growth in April and further rose in May, to 4.4 percent (y/y), while coal consumption and traffic delays
showed tentative signs of normalizing to historical levels. The recovery remains fragile, however, as air
traffic and tourism remain well below levels observed prior to COVID-19.
Commodity market developments
Almost all commodity prices have seen steep declines since the start of the year. The COVID-19
pandemic has had a major effect on both the demand and supply of commodities through the impact of
containment measures on activity and supply chains. Energy prices have been most affected, particularly
crude oil, while gold prices have risen amid safe-haven flows.
Crude oil prices have plummeted since the start of the year, dropping 65 percent between January
and April. Brent crude oil prices averaged US$23/bbl in April, a multi-decade low (Figure 6). Demand for
oil has collapsed as a result of shutdowns from the COVID-19 pandemic and the severe fall in global
economic activity, with the International Energy Agency projecting that oil demand declined by 18
percent in Q2 2020 (Figure 7). The decline in prices was exacerbated by the breakdown of OPEC+ talks in
early March, and a new production agreement announced on April 12 initially failed to boost prices. In
part reflecting the imbalance between demand and supply, the price of WTI Cushing, the U.S.
benchmark, briefly turned negative in April, although technical factors were also at play. However, oil
prices have since recovered as production cuts have been implemented, and lockdown measures have
started to be lifted in some countries, but they remain more than one-third lower than their January
peak.
Figure 5: In the first quarter of 2020, economic growth in China contracted by 6.8 percent
Source: Haver Analytics, World Bank. Note: Figure shows seasonally adjusted nominal retail sales. Last observation is 2020Q1 for GDP and May 2020 for retail sales and industrial production.
20
Figure 6: Brent crude oil prices fell to a multi-decade low
Figure 7: Demand for oil is expected to decline 18 percent in the second quarter of 2020
Source: Bloomberg, World Bank.
Note: Vertical lines denote January 20, 2020, March
09, 2020 and April 13, 2020. Last observation is June
29, 2020.
Source: IEA, World Bank.
Note: Shaded area denotes IEA forecast.
Global oil production was slower to fall than
demand. The breakdown of the OPEC+ agreement
in March triggered an end to their existing
production cuts and led to Saudi Arabia announcing
it would increase production in April to 12mb/d.
However, OPEC+ reached a new production
agreement in April that included cuts of 9.7mb/d in
May and June 2020, with Russia and Saudi Arabia
each reducing production to 8.5mb/d, a sharp drop
from existing levels. The group agreed to maintain
these cuts in July, before gradually reducing them
thereafter. Among non-OPEC+ countries, most oil
companies have implemented substantial cuts in
capital expenditure. For example, the rig count in
the United States has fallen by around 70 percent
since March, reaching an all-time low in June (Figure 8). Increasingly, producers are also announcing cuts
in existing production, including in Canada, Norway, and the United States.
Most non-energy prices have also fallen since the start of the year. Metals prices fell 14 percent
between January and May, led by aluminum (-17 percent), zinc (-16 percent) and lead (-15 percent).
Metals have been heavily affected by slowing demand and the shutdown of key industries, such as the
automobile industry. Prices have seen a modest recovery in June, amid some optimism about the
recovery in China, with copper prices seeing the largest increase, up 10 percent (m/m) in June.
Figure 8: In the United States, the oil rig count fell to its lowest level since 2009
Source: Baker Hughes, World Bank.
21
Disruptions to the supply of metal ores and refined metals arising from containment measures have also
provided some support to metal prices. Among precious metals, gold prices have increased 11 percent
since January, as a result of heightened uncertainty and safe-haven flows, while platinum prices
dropped by almost 20 percent reflecting their heavy use in the production of catalytic converters in the
transportation industry. In general, agricultural commodity prices have seen modest declines since
January, with two exceptions. Natural rubber prices are down almost 20 percent from January,
reflecting their use in the manufacture of tires, while rice prices have risen more than 20 percent on
worsening crop conditions and some trade restrictions.
1.2 Russia: heading towards a recession after relatively robust growth
in the first quarter
The impact of COVID-19 on economic activities in Russia was limited in Q1 2020 and mostly channeled
through a sharp reduction in trade and commodity prices. With the introduction of lockdown measures
at the end of March, Russia slipped into recession hit by domestic supply and demand shocks against a
backdrop of already weak external demand. In April, contraction in the output of five basic sectors2
totaled 9.9 percent, y/y, which is on par with the contraction of this indicator in 2009, during the global
financial crisis.
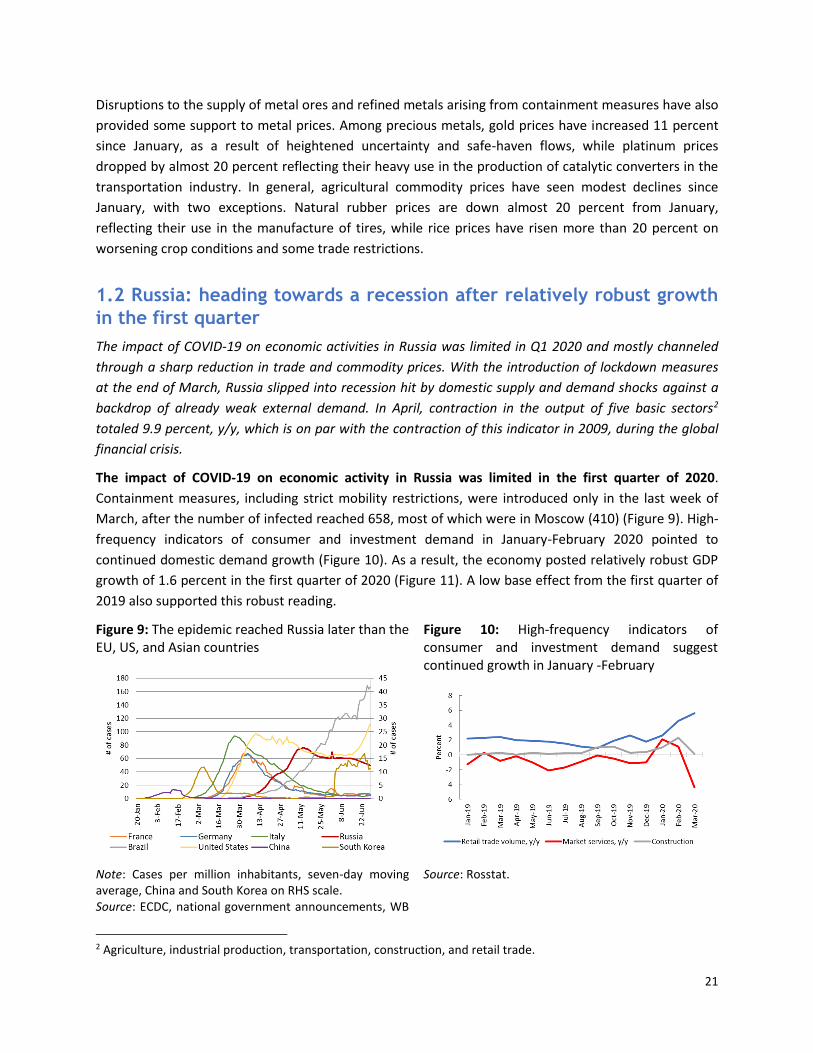
The impact of COVID-19 on economic activity in Russia was limited in the first quarter of 2020.
Containment measures, including strict mobility restrictions, were introduced only in the last week of
March, after the number of infected reached 658, most of which were in Moscow (410) (Figure 9). High-
frequency indicators of consumer and investment demand in January-February 2020 pointed to
continued domestic demand growth (Figure 10). As a result, the economy posted relatively robust GDP
growth of 1.6 percent in the first quarter of 2020 (Figure 11). A low base effect from the first quarter of
2019 also supported this robust reading.
Figure 9: The epidemic reached Russia later than the EU, US, and Asian countries
Figure 10: High-frequency indicators of consumer and investment demand suggest continued growth in January -February
Note: Cases per million inhabitants, seven-day moving average, China and South Korea on RHS scale. Source: ECDC, national government announcements, WB
Source: Rosstat.
2 Agriculture, industrial production, transportation, construction, and retail trade.
22
staff calculations.
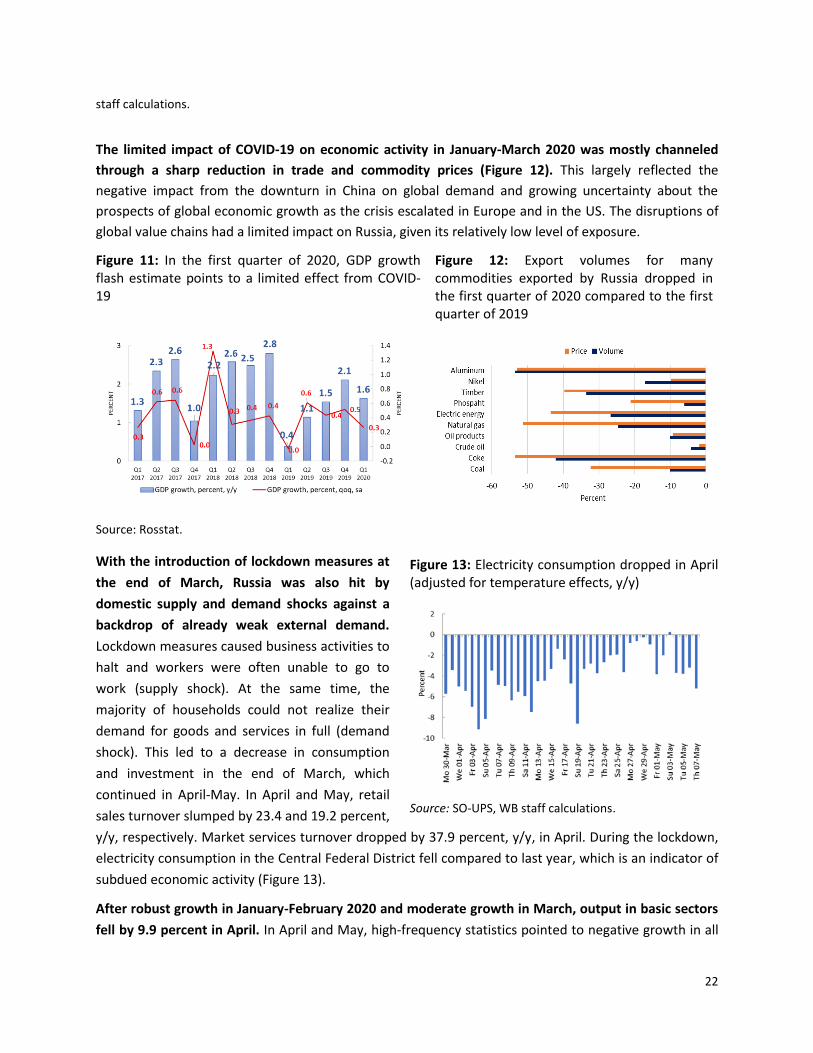
The limited impact of COVID-19 on economic activity in January-March 2020 was mostly channeled
through a sharp reduction in trade and commodity prices (Figure 12). This largely reflected the
negative impact from the downturn in China on global demand and growing uncertainty about the
prospects of global economic growth as the crisis escalated in Europe and in the US. The disruptions of
global value chains had a limited impact on Russia, given its relatively low level of exposure.
Figure 11: In the first quarter of 2020, GDP growth flash estimate points to a limited effect from COVID-19
Figure 12: Export volumes for many commodities exported by Russia dropped in the first quarter of 2020 compared to the first quarter of 2019
Source: Rosstat.
With the introduction of lockdown measures at
the end of March, Russia was also hit by
domestic supply and demand shocks against a
backdrop of already weak external demand.
Lockdown measures caused business activities to
halt and workers were often unable to go to
work (supply shock). At the same time, the
majority of households could not realize their
demand for goods and services in full (demand
shock). This led to a decrease in consumption
and investment in the end of March, which
continued in April-May. In April and May, retail
sales turnover slumped by 23.4 and 19.2 percent,
y/y, respectively. Market services turnover dropped by 37.9 percent, y/y, in April. During the lockdown,
electricity consumption in the Central Federal District fell compared to last year, which is an indicator of
subdued economic activity (Figure 13).
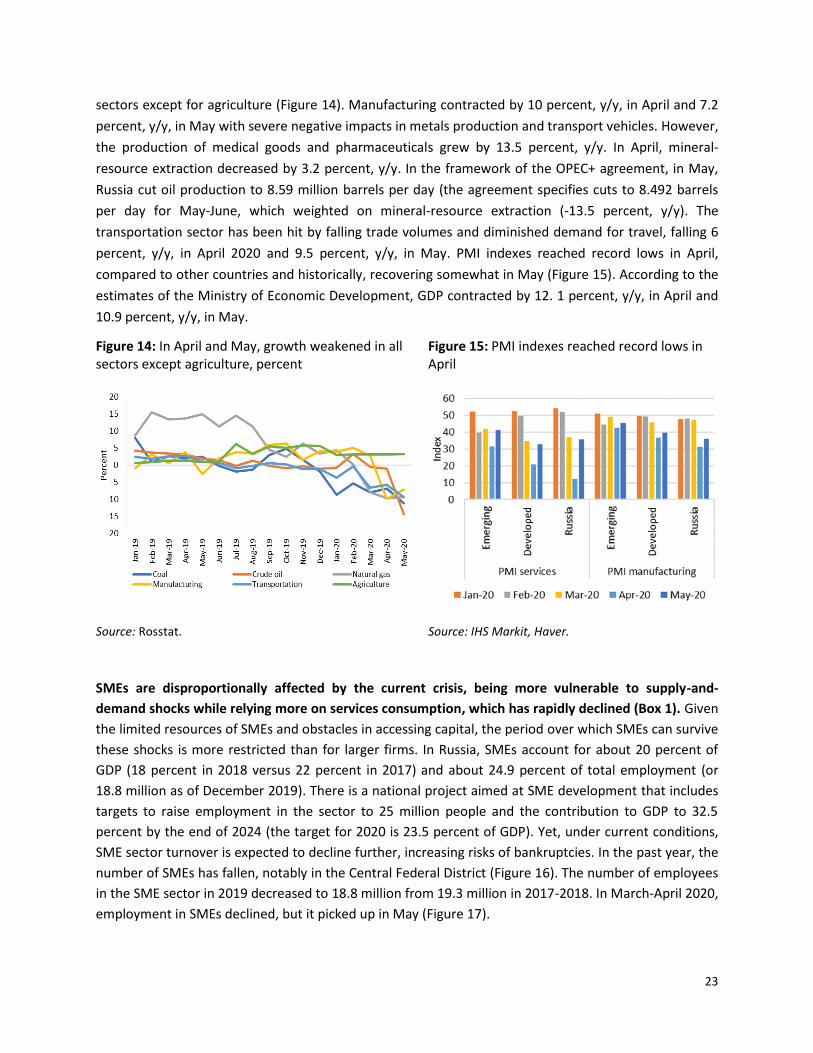
After robust growth in January-February 2020 and moderate growth in March, output in basic sectors
fell by 9.9 percent in April. In April and May, high-frequency statistics pointed to negative growth in all
Figure 13: Electricity consumption dropped in April (adjusted for temperature effects, y/y)
Source: SO-UPS, WB staff calculations.
23
sectors except for agriculture (Figure 14). Manufacturing contracted by 10 percent, y/y, in April and 7.2
percent, y/y, in May with severe negative impacts in metals production and transport vehicles. However,
the production of medical goods and pharmaceuticals grew by 13.5 percent, y/y. In April, mineral-
resource extraction decreased by 3.2 percent, y/y. In the framework of the OPEC+ agreement, in May,
Russia cut oil production to 8.59 million barrels per day (the agreement specifies cuts to 8.492 barrels
per day for May-June, which weighted on mineral-resource extraction (-13.5 percent, y/y). The
transportation sector has been hit by falling trade volumes and diminished demand for travel, falling 6
percent, y/y, in April 2020 and 9.5 percent, y/y, in May. PMI indexes reached record lows in April,
compared to other countries and historically, recovering somewhat in May (Figure 15). According to the
estimates of the Ministry of Economic Development, GDP contracted by 12. 1 percent, y/y, in April and
10.9 percent, y/y, in May.
Figure 14: In April and May, growth weakened in all sectors except agriculture, percent
Figure 15: PMI indexes reached record lows in April
Source: Rosstat. Source: IHS Markit, Haver.
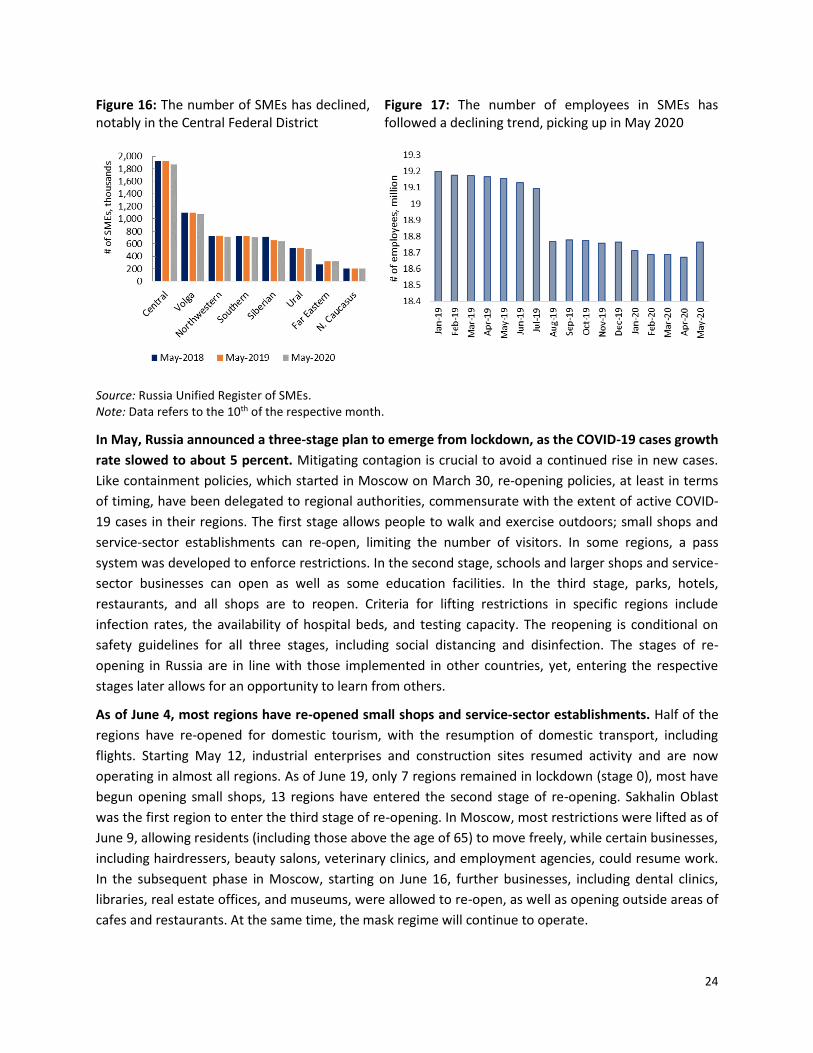
SMEs are disproportionally affected by the current crisis, being more vulnerable to supply-and-
demand shocks while relying more on services consumption, which has rapidly declined (Box 1). Given
the limited resources of SMEs and obstacles in accessing capital, the period over which SMEs can survive
these shocks is more restricted than for larger firms. In Russia, SMEs account for about 20 percent of
GDP (18 percent in 2018 versus 22 percent in 2017) and about 24.9 percent of total employment (or
18.8 million as of December 2019). There is a national project aimed at SME development that includes
targets to raise employment in the sector to 25 million people and the contribution to GDP to 32.5
percent by the end of 2024 (the target for 2020 is 23.5 percent of GDP). Yet, under current conditions,
SME sector turnover is expected to decline further, increasing risks of bankruptcies. In the past year, the
number of SMEs has fallen, notably in the Central Federal District (Figure 16). The number of employees
in the SME sector in 2019 decreased to 18.8 million from 19.3 million in 2017-2018. In March-April 2020,
employment in SMEs declined, but it picked up in May (Figure 17).
24
Figure 16: The number of SMEs has declined, notably in the Central Federal District
Figure 17: The number of employees in SMEs has followed a declining trend, picking up in May 2020
Source: Russia Unified Register of SMEs. Note: Data refers to the 10th of the respective month.
In May, Russia announced a three-stage plan to emerge from lockdown, as the COVID-19 cases growth
rate slowed to about 5 percent. Mitigating contagion is crucial to avoid a continued rise in new cases.
Like containment policies, which started in Moscow on March 30, re-opening policies, at least in terms
of timing, have been delegated to regional authorities, commensurate with the extent of active COVID-
19 cases in their regions. The first stage allows people to walk and exercise outdoors; small shops and
service-sector establishments can re-open, limiting the number of visitors. In some regions, a pass
system was developed to enforce restrictions. In the second stage, schools and larger shops and service-
sector businesses can open as well as some education facilities. In the third stage, parks, hotels,
restaurants, and all shops are to reopen. Criteria for lifting restrictions in specific regions include
infection rates, the availability of hospital beds, and testing capacity. The reopening is conditional on
safety guidelines for all three stages, including social distancing and disinfection. The stages of re-
opening in Russia are in line with those implemented in other countries, yet, entering the respective
stages later allows for an opportunity to learn from others.
As of June 4, most regions have re-opened small shops and service-sector establishments. Half of the
regions have re-opened for domestic tourism, with the resumption of domestic transport, including
flights. Starting May 12, industrial enterprises and construction sites resumed activity and are now
operating in almost all regions. As of June 19, only 7 regions remained in lockdown (stage 0), most have
begun opening small shops, 13 regions have entered the second stage of re-opening. Sakhalin Oblast
was the first region to enter the third stage of re-opening. In Moscow, most restrictions were lifted as of
June 9, allowing residents (including those above the age of 65) to move freely, while certain businesses,
including hairdressers, beauty salons, veterinary clinics, and employment agencies, could resume work.
In the subsequent phase in Moscow, starting on June 16, further businesses, including dental clinics,
libraries, real estate offices, and museums, were allowed to re-open, as well as opening outside areas of
cafes and restaurants. At the same time, the mask regime will continue to operate.
25
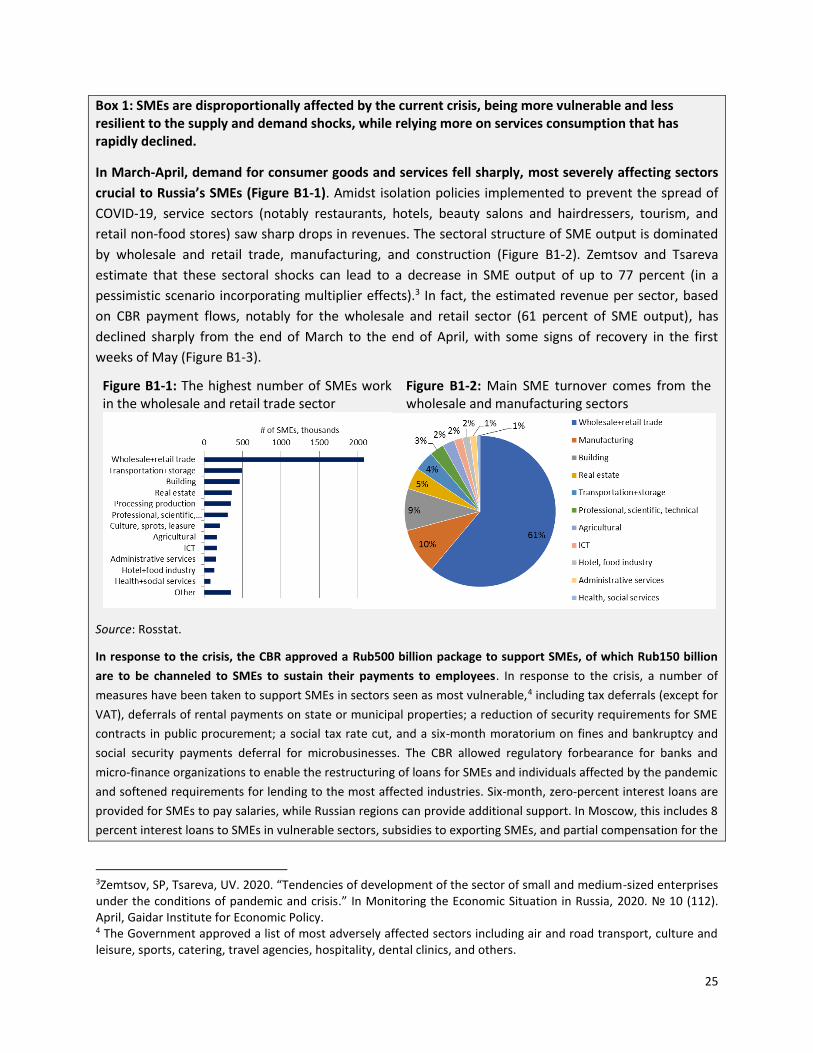
Box 1: SMEs are disproportionally affected by the current crisis, being more vulnerable and less resilient to the supply and demand shocks, while relying more on services consumption that has rapidly declined.
In March-April, demand for consumer goods and services fell sharply, most severely affecting sectors
crucial to Russia’s SMEs (Figure B1-1). Amidst isolation policies implemented to prevent the spread of
COVID-19, service sectors (notably restaurants, hotels, beauty salons and hairdressers, tourism, and
retail non-food stores) saw sharp drops in revenues. The sectoral structure of SME output is dominated
by wholesale and retail trade, manufacturing, and construction (Figure B1-2). Zemtsov and Tsareva
estimate that these sectoral shocks can lead to a decrease in SME output of up to 77 percent (in a
pessimistic scenario incorporating multiplier effects).3 In fact, the estimated revenue per sector, based
on CBR payment flows, notably for the wholesale and retail sector (61 percent of SME output), has
declined sharply from the end of March to the end of April, with some signs of recovery in the first
weeks of May (Figure B1-3).
Figure B1-1: The highest number of SMEs work in the wholesale and retail trade sector
Figure B1-2: Main SME turnover comes from the wholesale and manufacturing sectors
Source: Rosstat.
In response to the crisis, the CBR approved a Rub500 billion package to support SMEs, of which Rub150 billion
are to be channeled to SMEs to sustain their payments to employees. In response to the crisis, a number of
measures have been taken to support SMEs in sectors seen as most vulnerable,4 including tax deferrals (except for
VAT), deferrals of rental payments on state or municipal properties; a reduction of security requirements for SME
contracts in public procurement; a social tax rate cut, and a six-month moratorium on fines and bankruptcy and
social security payments deferral for microbusinesses. The CBR allowed regulatory forbearance for banks and
micro-finance organizations to enable the restructuring of loans for SMEs and individuals affected by the pandemic
and softened requirements for lending to the most affected industries. Six-month, zero-percent interest loans are
provided for SMEs to pay salaries, while Russian regions can provide additional support. In Moscow, this includes 8
percent interest loans to SMEs in vulnerable sectors, subsidies to exporting SMEs, and partial compensation for the
3Zemtsov, SP, Tsareva, UV. 2020. “Tendencies of development of the sector of small and medium-sized enterprises under the conditions of pandemic and crisis.” In Monitoring the Economic Situation in Russia, 2020. № 10 (112). April, Gaidar Institute for Economic Policy. 4 The Government approved a list of most adversely affected sectors including air and road transport, culture and leisure, sports, catering, travel agencies, hospitality, dental clinics, and others.
26
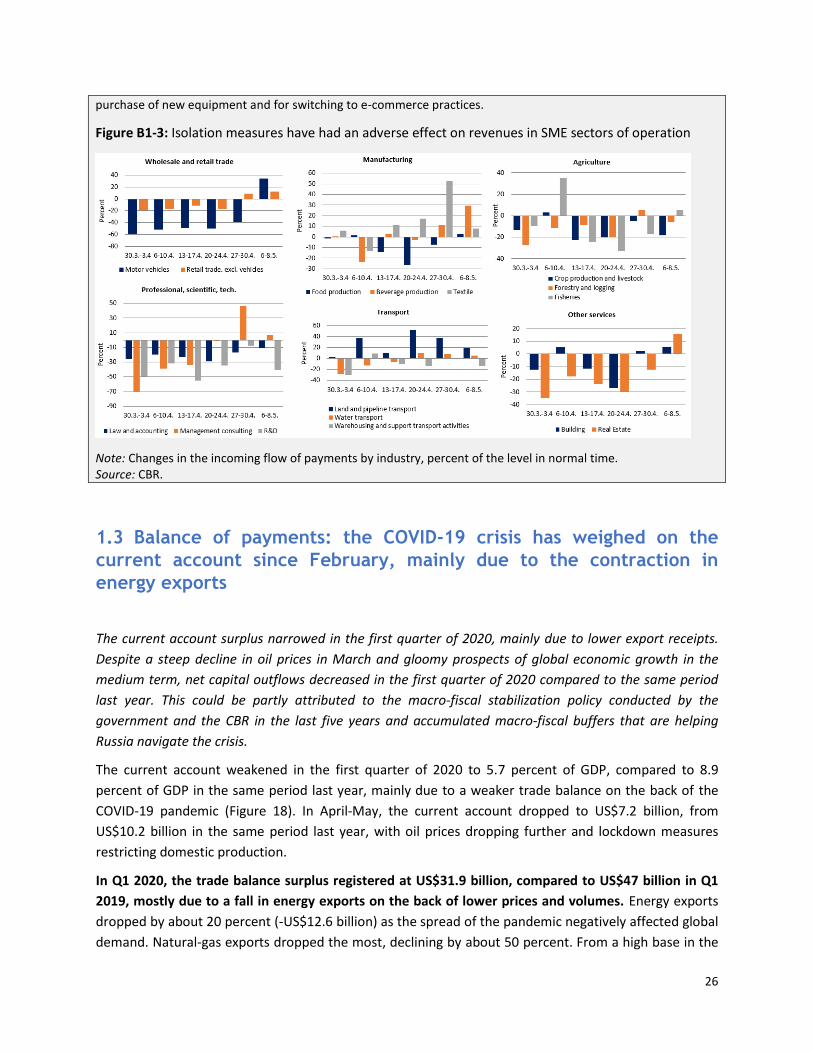
purchase of new equipment and for switching to e-commerce practices.
Figure B1-3: Isolation measures have had an adverse effect on revenues in SME sectors of operation
Note: Changes in the incoming flow of payments by industry, percent of the level in normal time. Source: CBR.
1.3 Balance of payments: the COVID-19 crisis has weighed on the
current account since February, mainly due to the contraction in
energy exports
The current account surplus narrowed in the first quarter of 2020, mainly due to lower export receipts.
Despite a steep decline in oil prices in March and gloomy prospects of global economic growth in the
medium term, net capital outflows decreased in the first quarter of 2020 compared to the same period
last year. This could be partly attributed to the macro-fiscal stabilization policy conducted by the
government and the CBR in the last five years and accumulated macro-fiscal buffers that are helping
Russia navigate the crisis.
The current account weakened in the first quarter of 2020 to 5.7 percent of GDP, compared to 8.9
percent of GDP in the same period last year, mainly due to a weaker trade balance on the back of the
COVID-19 pandemic (Figure 18). In April-May, the current account dropped to US$7.2 billion, from
US$10.2 billion in the same period last year, with oil prices dropping further and lockdown measures
restricting domestic production.
In Q1 2020, the trade balance surplus registered at US$31.9 billion, compared to US$47 billion in Q1
2019, mostly due to a fall in energy exports on the back of lower prices and volumes. Energy exports
dropped by about 20 percent (-US$12.6 billion) as the spread of the pandemic negatively affected global
demand. Natural-gas exports dropped the most, declining by about 50 percent. From a high base in the
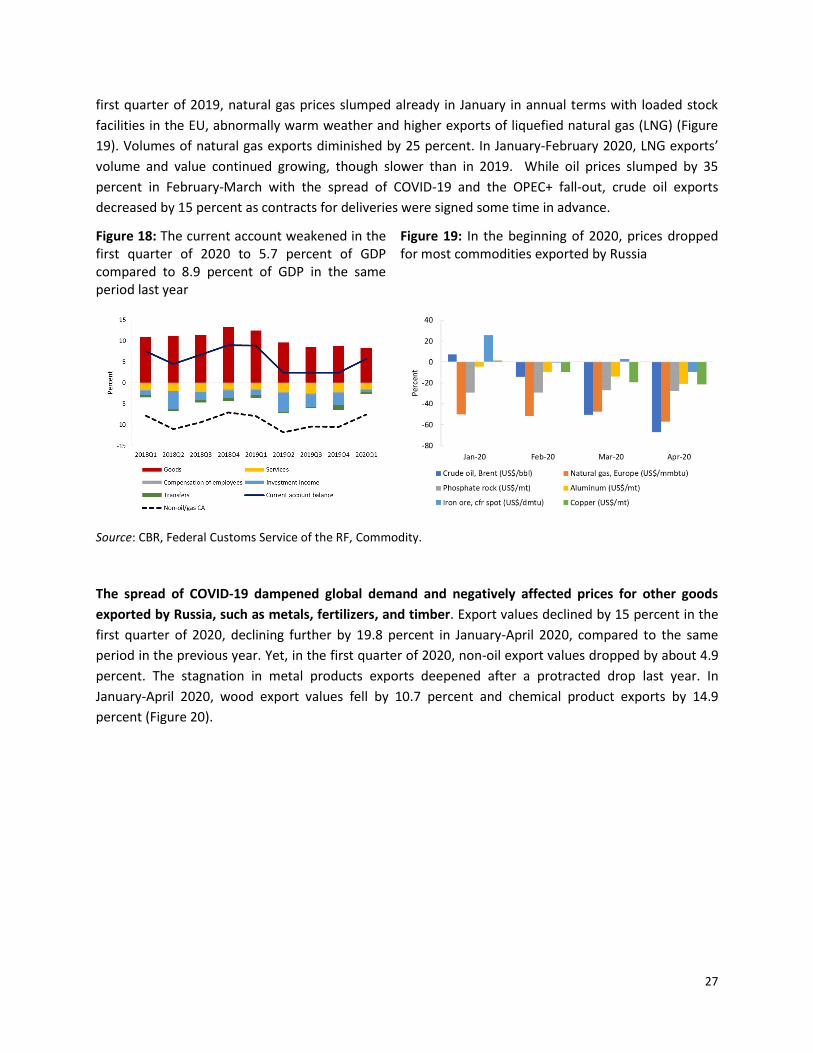
27
first quarter of 2019, natural gas prices slumped already in January in annual terms with loaded stock
facilities in the EU, abnormally warm weather and higher exports of liquefied natural gas (LNG) (Figure
19). Volumes of natural gas exports diminished by 25 percent. In January-February 2020, LNG exports’
volume and value continued growing, though slower than in 2019. While oil prices slumped by 35
percent in February-March with the spread of COVID-19 and the OPEC+ fall-out, crude oil exports
decreased by 15 percent as contracts for deliveries were signed some time in advance.
Figure 18: The current account weakened in the first quarter of 2020 to 5.7 percent of GDP compared to 8.9 percent of GDP in the same period last year
Figure 19: In the beginning of 2020, prices dropped for most commodities exported by Russia
Source: CBR, Federal Customs Service of the RF, Commodity.
The spread of COVID-19 dampened global demand and negatively affected prices for other goods
exported by Russia, such as metals, fertilizers, and timber. Export values declined by 15 percent in the
first quarter of 2020, declining further by 19.8 percent in January-April 2020, compared to the same
period in the previous year. Yet, in the first quarter of 2020, non-oil export values dropped by about 4.9
percent. The stagnation in metal products exports deepened after a protracted drop last year. In
January-April 2020, wood export values fell by 10.7 percent and chemical product exports by 14.9
percent (Figure 20).
28
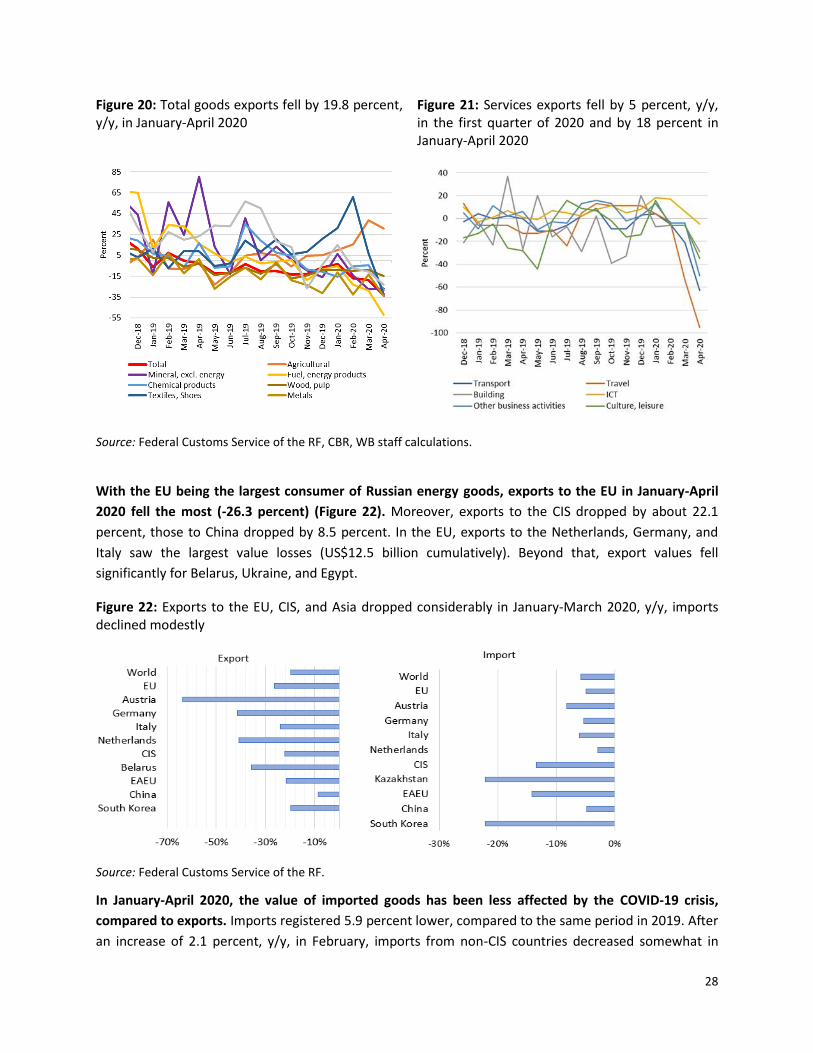
Figure 20: Total goods exports fell by 19.8 percent, y/y, in January-April 2020
Figure 21: Services exports fell by 5 percent, y/y, in the first quarter of 2020 and by 18 percent in January-April 2020
Source: Federal Customs Service of the RF, CBR, WB staff calculations.
With the EU being the largest consumer of Russian energy goods, exports to the EU in January-April
2020 fell the most (-26.3 percent) (Figure 22). Moreover, exports to the CIS dropped by about 22.1
percent, those to China dropped by 8.5 percent. In the EU, exports to the Netherlands, Germany, and
Italy saw the largest value losses (US$12.5 billion cumulatively). Beyond that, export values fell
significantly for Belarus, Ukraine, and Egypt.
Figure 22: Exports to the EU, CIS, and Asia dropped considerably in January-March 2020, y/y, imports declined modestly
Source: Federal Customs Service of the RF.
In January-April 2020, the value of imported goods has been less affected by the COVID-19 crisis,
compared to exports. Imports registered 5.9 percent lower, compared to the same period in 2019. After
an increase of 2.1 percent, y/y, in February, imports from non-CIS countries decreased somewhat in
29
March and mostly in April. The largest contributions to the slowdown were made by declines in imports
of machinery and equipment, minerals and fuel products, and chemical products. Until the end of
March, the drop in import value, y/y, was moderate and remains small compared to declines in export
value. This was due to several factors: the price effect was much more severe for exports dominated by
energy goods; in the first quarter of 2020, the effect on domestic demand was limited. Macro-fiscal
policies and measures such as the switch to foreign currency (FX) sales in the fiscal rule framework and
FX sales in the framework of the Sberbank deal supported the ruble.
Russia and the Eurasian Economic Union (EAEU) have imposed several temporary trade measures
curbing exports of medical and food products and reducing tariffs for importing them (Box 2). This
type of policy response to the health crisis is not unique to the region, as the WTO reports that 80
countries5 have in fact taken restrictive trade measures. These measures are meant to offset domestic
shortages and rising prices as demand for essential medical goods has sharply risen. However, restrictive
export policies reduce global supply, leading to higher prices. In fact, the importance of trade in
overcoming the pandemic is crucial, as liberalizing trade policies, for instance through tariff reductions,
can instead help reduce the cost of goods and services essential to overcoming COVID-19 and will be
important in supporting economic recovery. Where restrictive trade policies are imposed, if absolutely
necessary, they should be targeted, proportionate, transparent, and temporary.6
COVID-19 affected the trade in services mainly in the transportation and travel sectors (Figure 21).
Both exports and imports of services dropped, on the back of diminished use of transport and travel
services, negatively affected by containment measures applied by Russia and other countries since
January. In the first quarter of 2020, services exports fell most sharply in the travel and transportation
sectors, -18.4 percent and -7.6 percent, respectively, compared to the first quarter of 2019. Imports
contracted slightly more than exports (US$1.2 billion versus US$0.7 billion), supporting the current
account. In April, services exports fell steeply, by 52.9 percent overall, while services imports fell by 60.7
percent improving substantially balance of services; exports of travel and transport services fell by 95.5
percent and 63.3 percent, respectively, compared to April 2019.
The non-oil current account increased slightly in the first quarter of 2020, compared to the same period
last year, supported by improved investment income balance and services.
Despite the steep decline in oil prices in March and gloomy prospects for global economic growth in
the medium term, net capital outflows decreased in the first quarter of 2020 compared to the same
period last year. In the first quarter of 2020, net capital outflows from the private sector dropped to
US$16.8 billion, compared to US$24.5 billion in the same period last year. Net capital outflows dropped
equally in the banking and in the non-banking sector. Banks continued to pay off debt amidst economic
sanctions. With elevated uncertainty and lower reinvestment of profits, FDI inflows turned almost to
zero from US$10.3 billion in the same period last year. Acquisition of foreign assets dropped
substantially for both sectors partly because of the ruble depreciation and lower profits. Yet, despite the
5 WTO. (2020). “Export Prohibitions and Restrictions”, [https://www.wto.org/english/tratop_e/COVID19_e/export_prohibitions_report_e.pdf] 6 World Bank, (2020), “Trade and COVID-19 Guidance Note – Do’s and Don’ts of Trade Policy in the Response to COVID-19”.
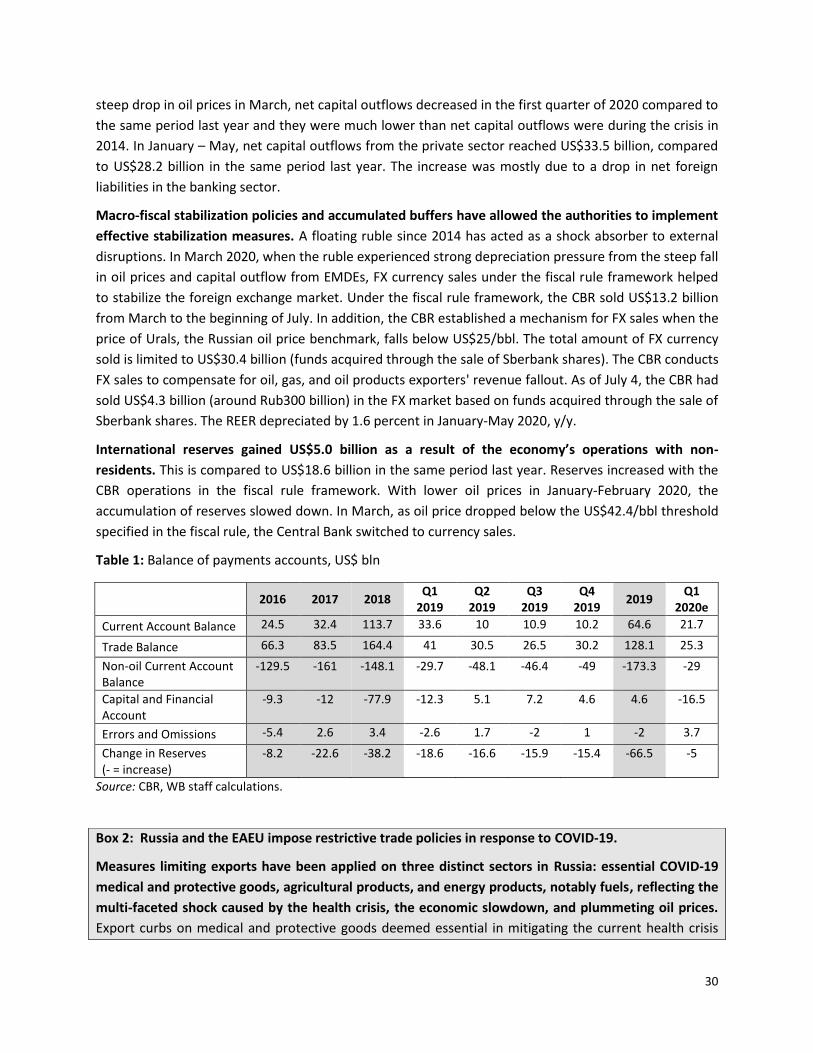
30
steep drop in oil prices in March, net capital outflows decreased in the first quarter of 2020 compared to
the same period last year and they were much lower than net capital outflows were during the crisis in
2014. In January – May, net capital outflows from the private sector reached US$33.5 billion, compared
to US$28.2 billion in the same period last year. The increase was mostly due to a drop in net foreign
liabilities in the banking sector.
Macro-fiscal stabilization policies and accumulated buffers have allowed the authorities to implement
effective stabilization measures. A floating ruble since 2014 has acted as a shock absorber to external
disruptions. In March 2020, when the ruble experienced strong depreciation pressure from the steep fall
in oil prices and capital outflow from EMDEs, FX currency sales under the fiscal rule framework helped
to stabilize the foreign exchange market. Under the fiscal rule framework, the CBR sold US$13.2 billion
from March to the beginning of July. In addition, the CBR established a mechanism for FX sales when the
price of Urals, the Russian oil price benchmark, falls below US$25/bbl. The total amount of FX currency
sold is limited to US$30.4 billion (funds acquired through the sale of Sberbank shares). The CBR conducts
FX sales to compensate for oil, gas, and oil products exporters' revenue fallout. As of July 4, the CBR had
sold US$4.3 billion (around Rub300 billion) in the FX market based on funds acquired through the sale of
Sberbank shares. The REER depreciated by 1.6 percent in January-May 2020, y/y.
International reserves gained US$5.0 billion as a result of the economy’s operations with non-
residents. This is compared to US$18.6 billion in the same period last year. Reserves increased with the
CBR operations in the fiscal rule framework. With lower oil prices in January-February 2020, the
accumulation of reserves slowed down. In March, as oil price dropped below the US$42.4/bbl threshold
specified in the fiscal rule, the Central Bank switched to currency sales.
Table 1: Balance of payments accounts, US$ bln
2016 2017 2018
Q1 2019
Q2 2019
Q3 2019
Q4 2019
2019 Q1
2020e
Current Account Balance 24.5 32.4 113.7 33.6 10 10.9 10.2 64.6 21.7
Trade Balance 66.3 83.5 164.4 41 30.5 26.5 30.2 128.1 25.3
Non-oil Current Account Balance
-129.5 -161 -148.1 -29.7 -48.1 -46.4 -49 -173.3 -29
Capital and Financial Account
-9.3 -12 -77.9 -12.3 5.1 7.2 4.6 4.6 -16.5
Errors and Omissions -5.4 2.6 3.4 -2.6 1.7 -2 1 -2 3.7
Change in Reserves (- = increase)
-8.2 -22.6 -38.2 -18.6 -16.6 -15.9 -15.4 -66.5 -5
Source: CBR, WB staff calculations.
Box 2: Russia and the EAEU impose restrictive trade policies in response to COVID-19.
Measures limiting exports have been applied on three distinct sectors in Russia: essential COVID-19
medical and protective goods, agricultural products, and energy products, notably fuels, reflecting the
multi-faceted shock caused by the health crisis, the economic slowdown, and plummeting oil prices.
Export curbs on medical and protective goods deemed essential in mitigating the current health crisis
31
7 Essential good scan be categorized as medicines (pharmaceuticals), medical supplies, medical equipment and technology, and personal protective products. See: WCO HS Classification reference for COVID-19 medical supplies (http://www.wcoomd.org/-/media/wco/public/global/pdf/topics/facilitation/activities-and-programmes/naturaldisaster/COVID_19/hs-classification-reference_en.pdf?la=en) 8 Espitia, A, Rocha, N, Ruta, M. 2020. “Trade and COVID-19 Guidance Note, Trade in Critical COVID-19 products.” World Bank. Washington, DC. 9 Evenett, S. 2020. “Tackling COVID-19 Together, The Trade Policy Dimension.” Global Trade Alert, University of St Gallen, Switzerland.
have been applied by multiple members in this temporary manner, to protect their own population
amidst exposed shortages in these goods. Restrictive policies on the export of food follows the same
logic of protecting the domestic market, but it can have severe consequences, in Russia’s case notably
on grain prices. Plans have been announced to limit the import of gasoline amidst diminished demand
and filled tanks. Contemplating the effects of bans in these distinct sectors, the following section will
look at Russia’s dependence, i.e. the need to protect the domestic consumers, and the most affected
trade partners.
Essential goods
Russia was quick to impose export bans on “essential” goods7 to mitigate the COVID-19 health crisis,
but it was also adversely affected by similar policies implemented in other countries. The trade in
products for prevention, testing, and treatment of COVID-19 has become central to tackling the health
crisis globally, which has exposed shortages. The high concentration of imports in certain products
makes many countries, especially developing ones, vulnerable to restrictive policies by exporters.
In turn, Russia is also adversely affected by restrictive policies implemented by exporters, especially
for protective equipment (Table B2-1). Among the goods essential to tackling the health crisis, medical
masks are likely to be the product most affected by restrictions, for which prices could increase by 20.5
percent. 8 Russia imports 77.4 percent of its medical masks and 54 percent of its venturi masks from
countries now imposing export restrictions. The consequences of export curbs on medical ventilators
illustrate the risks of such policies, as there are no significant exporters of these machines in the CIS
region. This is highlighted in a report by Global Trade Alert, which argues that given the existing trade
patterns and the sophisticated technology involved in the production of ventilators, many countries are
dependent on international trade for access to this critical technology.9 The report also indicates that
Russia still has numerous non-tariff policies in place that are limiting imports of protective equipment
and medical devices. Russia imports the majority of its ventilators from China, Germany, and the United
States.
Together with the EAEU, Russia is planning to establish much-needed procedures to ease the imports
of essential goods. The EAEU has temporarily liberalised imports, aiming to establish a green channel for
essential goods, via tariff reductions for medical goods, including protective equipment, disinfectants,
diagnostic reagents, and certain types of medical equipment and materials (later added to the list were
medicine, pipettes, disinfection units, endoscopes and thermometers). In addition, Russia has
suspended customs audits until May 1. Trade-weighted applied tariffs are still in place for the majority
of essential goods in Russia, the highest being at 12.1 percent for protective clothing. Other countries
have begun to implement important import reforms. For instance, Brazil has eliminated tariffs on
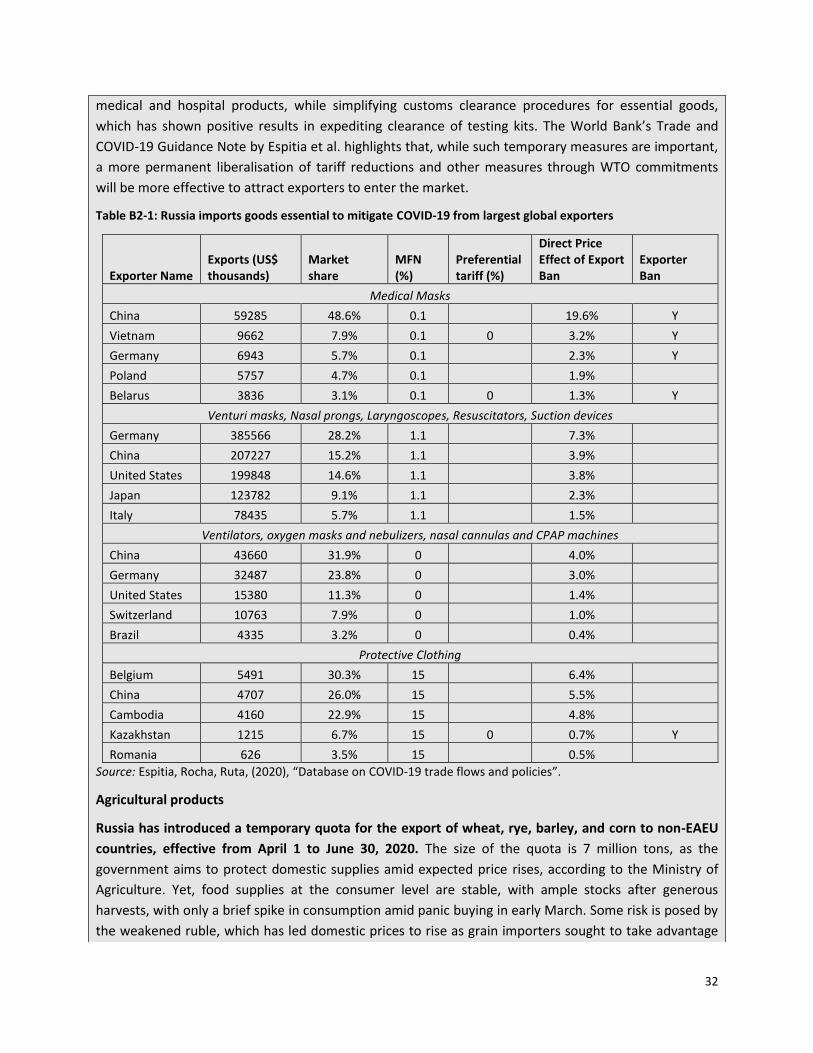
32
medical and hospital products, while simplifying customs clearance procedures for essential goods,
which has shown positive results in expediting clearance of testing kits. The World Bank’s Trade and
COVID-19 Guidance Note by Espitia et al. highlights that, while such temporary measures are important,
a more permanent liberalisation of tariff reductions and other measures through WTO commitments
will be more effective to attract exporters to enter the market.
Table B2-1: Russia imports goods essential to mitigate COVID-19 from largest global exporters
Exporter Name Exports (US$ thousands)
Market share
MFN (%)
Preferential tariff (%)
Direct Price Effect of Export Ban
Exporter Ban
Medical Masks
China 59285 48.6% 0.1 19.6% Y
Vietnam 9662 7.9% 0.1 0 3.2% Y
Germany 6943 5.7% 0.1 2.3% Y
Poland 5757 4.7% 0.1 1.9%
Belarus 3836 3.1% 0.1 0 1.3% Y
Venturi masks, Nasal prongs, Laryngoscopes, Resuscitators, Suction devices
Germany 385566 28.2% 1.1 7.3%
China 207227 15.2% 1.1 3.9%
United States 199848 14.6% 1.1 3.8%
Japan 123782 9.1% 1.1 2.3%
Italy 78435 5.7% 1.1 1.5%
Ventilators, oxygen masks and nebulizers, nasal cannulas and CPAP machines
China 43660 31.9% 0 4.0%
Germany 32487 23.8% 0 3.0%
United States 15380 11.3% 0 1.4%
Switzerland 10763 7.9% 0 1.0%
Brazil 4335 3.2% 0 0.4%
Protective Clothing
Belgium 5491 30.3% 15 6.4%
China 4707 26.0% 15 5.5%
Cambodia 4160 22.9% 15 4.8%
Kazakhstan 1215 6.7% 15 0 0.7% Y
Romania 626 3.5% 15 0.5%
Source: Espitia, Rocha, Ruta, (2020), “Database on COVID-19 trade flows and policies”.
Agricultural products
Russia has introduced a temporary quota for the export of wheat, rye, barley, and corn to non-EAEU
countries, effective from April 1 to June 30, 2020. The size of the quota is 7 million tons, as the
government aims to protect domestic supplies amid expected price rises, according to the Ministry of
Agriculture. Yet, food supplies at the consumer level are stable, with ample stocks after generous
harvests, with only a brief spike in consumption amid panic buying in early March. Some risk is posed by
the weakened ruble, which has led domestic prices to rise as grain importers sought to take advantage
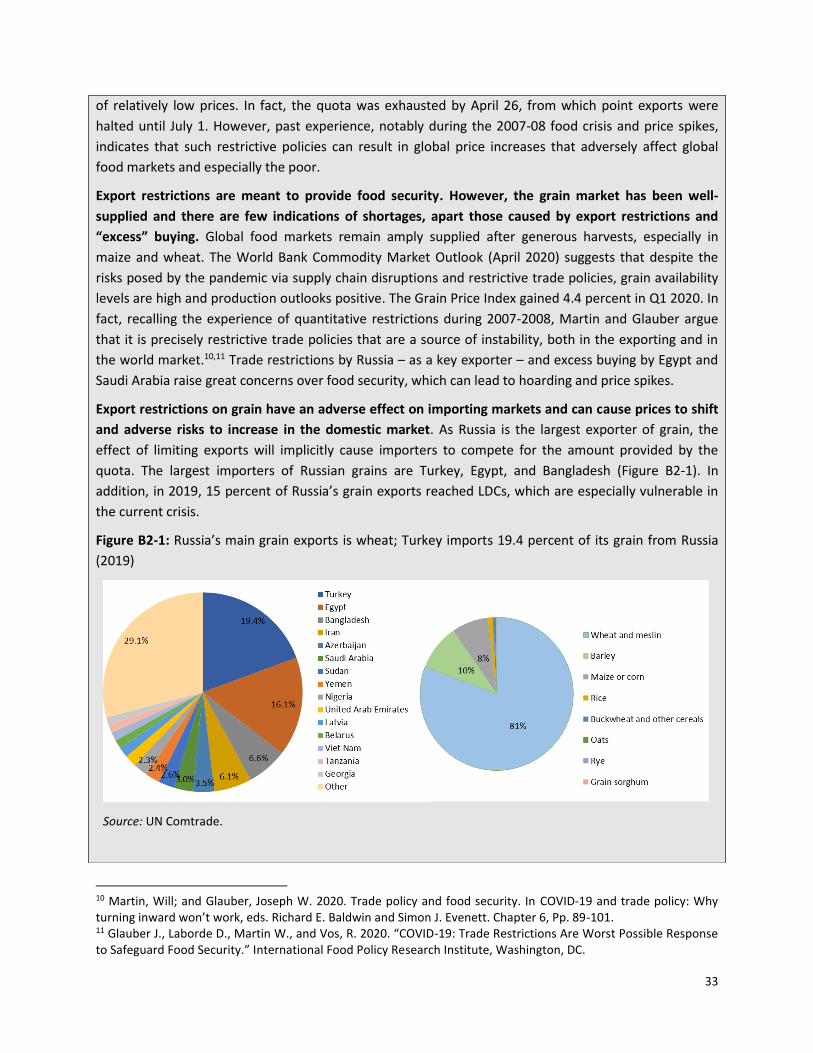
33
10 Martin, Will; and Glauber, Joseph W. 2020. Trade policy and food security. In COVID-19 and trade policy: Why turning inward won’t work, eds. Richard E. Baldwin and Simon J. Evenett. Chapter 6, Pp. 89-101. 11 Glauber J., Laborde D., Martin W., and Vos, R. 2020. “COVID-19: Trade Restrictions Are Worst Possible Response to Safeguard Food Security.” International Food Policy Research Institute, Washington, DC.
of relatively low prices. In fact, the quota was exhausted by April 26, from which point exports were
halted until July 1. However, past experience, notably during the 2007-08 food crisis and price spikes,
indicates that such restrictive policies can result in global price increases that adversely affect global
food markets and especially the poor.
Export restrictions are meant to provide food security. However, the grain market has been well-
supplied and there are few indications of shortages, apart those caused by export restrictions and
“excess” buying. Global food markets remain amply supplied after generous harvests, especially in
maize and wheat. The World Bank Commodity Market Outlook (April 2020) suggests that despite the
risks posed by the pandemic via supply chain disruptions and restrictive trade policies, grain availability
levels are high and production outlooks positive. The Grain Price Index gained 4.4 percent in Q1 2020. In
fact, recalling the experience of quantitative restrictions during 2007-2008, Martin and Glauber argue
that it is precisely restrictive trade policies that are a source of instability, both in the exporting and in
the world market.10,11 Trade restrictions by Russia – as a key exporter – and excess buying by Egypt and
Saudi Arabia raise great concerns over food security, which can lead to hoarding and price spikes.
Export restrictions on grain have an adverse effect on importing markets and can cause prices to shift
and adverse risks to increase in the domestic market. As Russia is the largest exporter of grain, the
effect of limiting exports will implicitly cause importers to compete for the amount provided by the
quota. The largest importers of Russian grains are Turkey, Egypt, and Bangladesh (Figure B2-1). In
addition, in 2019, 15 percent of Russia’s grain exports reached LDCs, which are especially vulnerable in
the current crisis.
Figure B2-1: Russia’s main grain exports is wheat; Turkey imports 19.4 percent of its grain from Russia
(2019)
Source: UN Comtrade.
34
1.4 Monetary Policy: The CBR moved to accommodative monetary policy
The expected negative impact of the COVID-19 pandemic on economic activity prompted the Central
Bank of Russia (CBR) to turn monetary policy from neutral to accommodative, with the policy rate now at
a record low of 4.5 percent. In March, inflation rose for the first time in a year, driven by increased
demand for food and essential products that followed the imposition of mobility-restricting containment
measures, and by a ruble weakened by collapsing oil prices and dampened global demand. Household
inflation expectations and corporate price expectations increased on the back of the weaker ruble and
heightened uncertainty. The CBR has taken preventive measures to address exchange-rate volatility and
to support financial markets
The expected negative impact of the pandemic on economic activity prompted the CBR to
turn monetary policy from neutral to accommodative. The CBR lowered its key rate by 50 basis points
(bps) to 5.5 percent in late April, in expectation that the restrictive measures introduced by the
government to contain the spread of the pandemic, as well as the global recession, would dampen
economic activity and aggregate demand. Further, in June, on the back of the prevailing disinflationary
factors (above expectations) and sluggish economic activity, the CBR cut the key rate by 100 bps down
12 Government Order No. 1062-r, April 18, http://government.ru/docs/39534/.
Oil products, gasoline
Russia has imposed a ban temporarily limiting the imports of certain types of fuel starting June 2,
2020, in response to low oil prices. The corresponding decree (signed on May 22) indicates that the
temporary ban will be in effect until October 1, 2020, affecting gasoline, kerosene, diesel fuel, gas oil,
and marine fuel imports, excluding transit trade. The Ministry of Energy had proposed the ban to
prevent cheap foreign gasoline from entering the domestic market. On March 28, petrol, diesel and fuel
had been added to the government’s list of non-food essential goods.12 Russia imports petroleum oils
and oils obtained from bituminous minerals (excluding crude) from EAEU countries, notably Belarus, the
EU and Asia. Domestic fuel demand had been falling on the back of measures to mitigate the spread of
COVID-19. By the end of March, Kazakhstan had introduced embargos on the import of gasoline, diesel
fuel and jet fuel from Russia for a period of three months.
Global fuel prices have fallen steeply, while Russian domestic prices have fallen relatively less,
attributable to a “damping” mechanism that smooths price dynamics. Retail fuel prices in Russia have
been relatively stable in comparison to those in other countries. In line with this mechanism, oil
companies pay an extra amount to the government when the domestic market turns premium, i.e.
when it cannot lower gas station prices. If, on the other hand, domestic market prices are at a discount
relative to export deliveries, then the budget pays an additional amount to companies so that prices
don’t rise. Amidst the current global dynamics, this has resulted in higher domestic prices compared to
netback. The Ministry of Finance reported that in March, oil companies paid Rub10.5 billion to the
budgets in line with the damping mechanism.
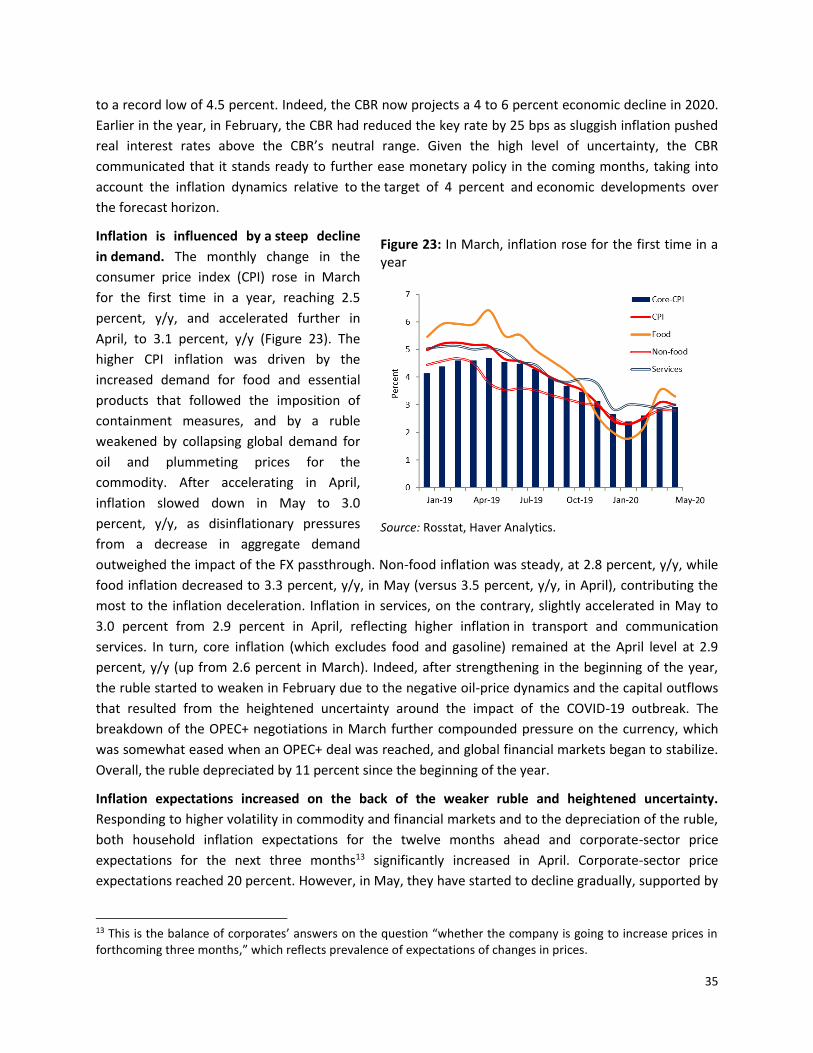
35
to a record low of 4.5 percent. Indeed, the CBR now projects a 4 to 6 percent economic decline in 2020.
Earlier in the year, in February, the CBR had reduced the key rate by 25 bps as sluggish inflation pushed
real interest rates above the CBR’s neutral range. Given the high level of uncertainty, the CBR
communicated that it stands ready to further ease monetary policy in the coming months, taking into
account the inflation dynamics relative to the target of 4 percent and economic developments over
the forecast horizon.
Inflation is influenced by a steep decline
in demand. The monthly change in the
consumer price index (CPI) rose in March
for the first time in a year, reaching 2.5
percent, y/y, and accelerated further in
April, to 3.1 percent, y/y (Figure 23). The
higher CPI inflation was driven by the
increased demand for food and essential
products that followed the imposition of
containment measures, and by a ruble
weakened by collapsing global demand for
oil and plummeting prices for the
commodity. After accelerating in April,
inflation slowed down in May to 3.0
percent, y/y, as disinflationary pressures
from a decrease in aggregate demand
outweighed the impact of the FX passthrough. Non-food inflation was steady, at 2.8 percent, y/y, while
food inflation decreased to 3.3 percent, y/y, in May (versus 3.5 percent, y/y, in April), contributing the
most to the inflation deceleration. Inflation in services, on the contrary, slightly accelerated in May to
3.0 percent from 2.9 percent in April, reflecting higher inflation in transport and communication
services. In turn, core inflation (which excludes food and gasoline) remained at the April level at 2.9
percent, y/y (up from 2.6 percent in March). Indeed, after strengthening in the beginning of the year,
the ruble started to weaken in February due to the negative oil-price dynamics and the capital outflows
that resulted from the heightened uncertainty around the impact of the COVID-19 outbreak. The
breakdown of the OPEC+ negotiations in March further compounded pressure on the currency, which
was somewhat eased when an OPEC+ deal was reached, and global financial markets began to stabilize.
Overall, the ruble depreciated by 11 percent since the beginning of the year.
Inflation expectations increased on the back of the weaker ruble and heightened uncertainty.
Responding to higher volatility in commodity and financial markets and to the depreciation of the ruble,
both household inflation expectations for the twelve months ahead and corporate-sector price
expectations for the next three months13 significantly increased in April. Corporate-sector price
expectations reached 20 percent. However, in May, they have started to decline gradually, supported by
13 This is the balance of corporates’ answers on the question “whether the company is going to increase prices in forthcoming three months,” which reflects prevalence of expectations of changes in prices.
Figure 23: In March, inflation rose for the first time in a year
Source: Rosstat, Haver Analytics.
36
the disinflationary effect of weak demand that has strengthened due to both the current and deferred
economic effect of restrictive measures and the ruble exchange-rate appreciation. Earlier in the year,
developments around inflation expectations had been mixed. While household inflation expectations
were on a downward trend (declining to 7.9 percent in March compared to 8.3 percent in the beginning
of the year), inflation expectations of corporates accelerated rapidly to 18 percent in March (from 8.6
percent in January), as increased uncertainty in external conditions and weaker commodity prices
negatively weighed on the ruble.
The CBR is using all available policy tools, in addition to changes in the key rate, to ensure that
markets continue to operate smoothly. The expected pick-up in inflation will likely be contained by a
large decrease in aggregate demand, as the pass-through of exchange-rate depreciation to goods
inflation will be limited by compressed profit mark-ups. In this context, it is uncertain to what extent the
recent (and future) reductions of policy rates will stimulate the economy. This makes it essential for the
CBR to use additional policy tools to support demand and ensure that markets continue to operate
smoothly. In order to reduce the long-term damage to the economy, the CBR has already implemented
several measures, including temporary measures to increase incentives for banks to issue and extend
loans such as: special refinancing rates, favorable conditions for specific types of loans, postponing the
introduction of tighter rules, and reducing regulatory and supervisory burdens for financial institutions.
Moreover, the CBR has introduced a Rub 500 billion facility to support SMEs lending and approved
measures to ease liquidity regulations for systemically important financial institutions. The CBR also
announced measures to maintain the availability of insurance services, to support professional
participants in the securities market and the trading and clearing infrastructure, and to support
collective investment market participants. For households affected by the COVID-19, the CBR allowed
banks and microfinance organizations to restructure their loans, forgo penalties, and avoid foreclosures
on collateral.
The CBR has taken preventative measures to address exchange-rate volatility. As in other EMDEs,
heightened global risk aversion on financial markets created pressure on the exchange rate and bond
spreads in Russia, which was exacerbated by a slump in oil prices (Figure 24). Starting March 10th, the
CBR discontinued its FX purchases and started pre-emptive sales of the FX reserves from the National
Welfare Fund (NWF) under the fiscal rule framework. In addition to that, on March 19, the CBR
established a mechanism for additional FX sales on the domestic market. In case the price of the Russian
oil price benchmark (Urals) falls below US$25/bbl, the CBR will conduct FX sales to compensate for oil,
gas, and oil products exporters’ revenue fallout. Under the fiscal rule framework, the CBR sold US$13.2
billion from March to the beginning of July. The CBR also uses FX from the government’s purchase
of Sberbank shares. As of July 4, the CBR had sold US$4.3 billion (around Rub300 billion) in the FX
market based on funds acquired through the sale of Sberbank shares. These measures should support
the economy and domestic consumption.
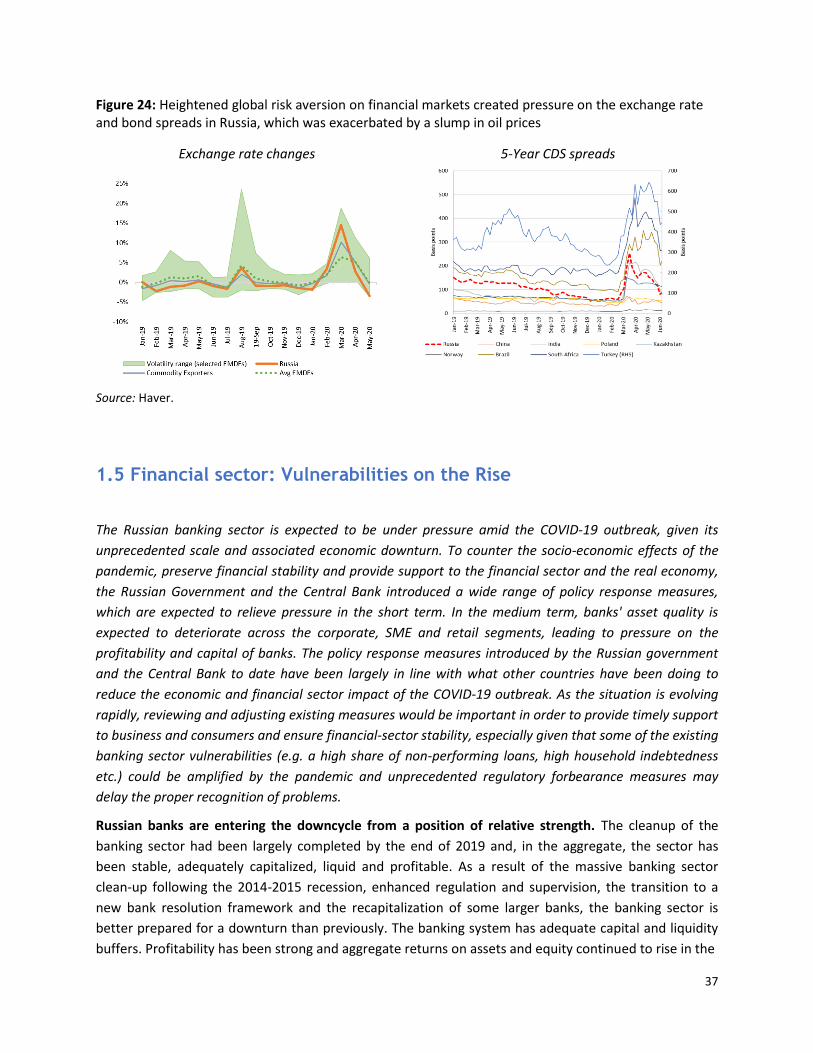
37
Figure 24: Heightened global risk aversion on financial markets created pressure on the exchange rate and bond spreads in Russia, which was exacerbated by a slump in oil prices
Exchange rate changes
5-Year CDS spreads
Source: Haver.
1.5 Financial sector: Vulnerabilities on the Rise
The Russian banking sector is expected to be under pressure amid the COVID-19 outbreak, given its
unprecedented scale and associated economic downturn. To counter the socio-economic effects of the
pandemic, preserve financial stability and provide support to the financial sector and the real economy,
the Russian Government and the Central Bank introduced a wide range of policy response measures,
which are expected to relieve pressure in the short term. In the medium term, banks' asset quality is
expected to deteriorate across the corporate, SME and retail segments, leading to pressure on the
profitability and capital of banks. The policy response measures introduced by the Russian government
and the Central Bank to date have been largely in line with what other countries have been doing to
reduce the economic and financial sector impact of the COVID-19 outbreak. As the situation is evolving
rapidly, reviewing and adjusting existing measures would be important in order to provide timely support
to business and consumers and ensure financial-sector stability, especially given that some of the existing
banking sector vulnerabilities (e.g. a high share of non-performing loans, high household indebtedness
etc.) could be amplified by the pandemic and unprecedented regulatory forbearance measures may
delay the proper recognition of problems.
Russian banks are entering the downcycle from a position of relative strength. The cleanup of the
banking sector had been largely completed by the end of 2019 and, in the aggregate, the sector has
been stable, adequately capitalized, liquid and profitable. As a result of the massive banking sector
clean-up following the 2014-2015 recession, enhanced regulation and supervision, the transition to a
new bank resolution framework and the recapitalization of some larger banks, the banking sector is
better prepared for a downturn than previously. The banking system has adequate capital and liquidity
buffers. Profitability has been strong and aggregate returns on assets and equity continued to rise in the
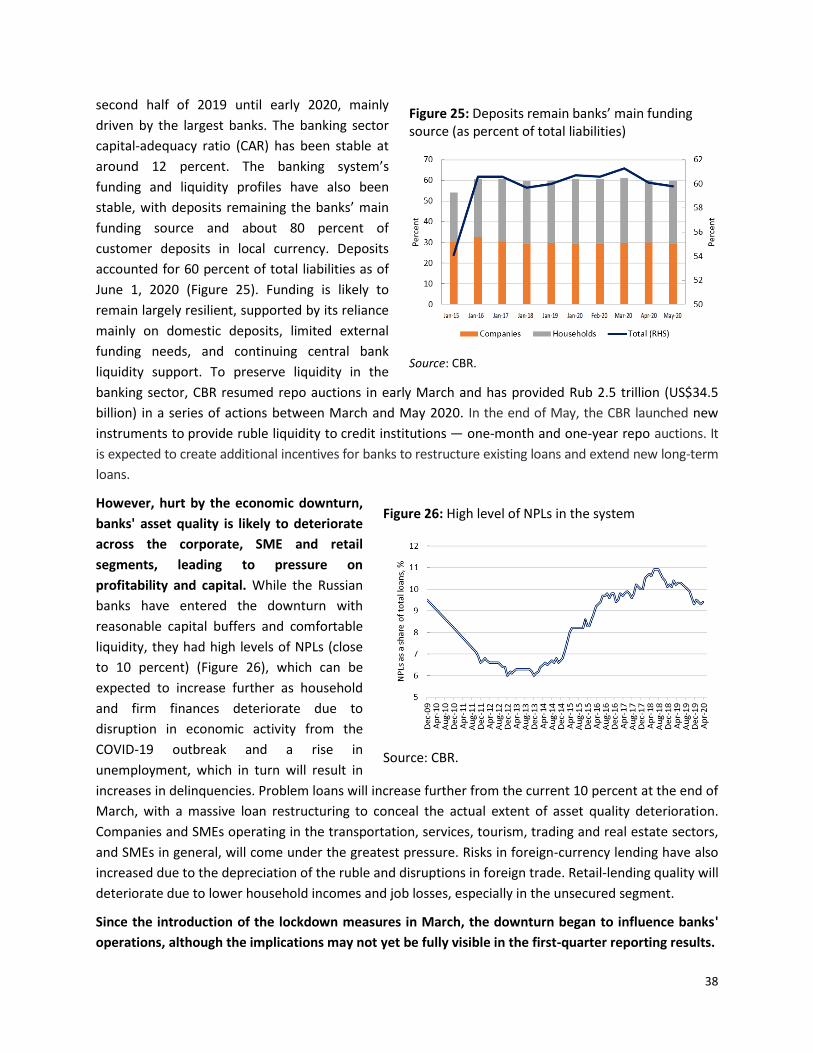
38
second half of 2019 until early 2020, mainly
driven by the largest banks. The banking sector
capital-adequacy ratio (CAR) has been stable at
around 12 percent. The banking system’s
funding and liquidity profiles have also been
stable, with deposits remaining the banks’ main
funding source and about 80 percent of
customer deposits in local currency. Deposits
accounted for 60 percent of total liabilities as of
June 1, 2020 (Figure 25). Funding is likely to
remain largely resilient, supported by its reliance
mainly on domestic deposits, limited external
funding needs, and continuing central bank
liquidity support. To preserve liquidity in the
banking sector, CBR resumed repo auctions in early March and has provided Rub 2.5 trillion (US$34.5
billion) in a series of actions between March and May 2020. In the end of May, the CBR launched new
instruments to provide ruble liquidity to credit institutions — one-month and one-year repo auctions. It
is expected to create additional incentives for banks to restructure existing loans and extend new long-term
loans.
However, hurt by the economic downturn,
banks' asset quality is likely to deteriorate
across the corporate, SME and retail
segments, leading to pressure on
profitability and capital. While the Russian
banks have entered the downturn with
reasonable capital buffers and comfortable
liquidity, they had high levels of NPLs (close
to 10 percent) (Figure 26), which can be
expected to increase further as household
and firm finances deteriorate due to
disruption in economic activity from the
COVID-19 outbreak and a rise in
unemployment, which in turn will result in
increases in delinquencies. Problem loans will increase further from the current 10 percent at the end of
March, with a massive loan restructuring to conceal the actual extent of asset quality deterioration.
Companies and SMEs operating in the transportation, services, tourism, trading and real estate sectors,
and SMEs in general, will come under the greatest pressure. Risks in foreign-currency lending have also
increased due to the depreciation of the ruble and disruptions in foreign trade. Retail-lending quality will
deteriorate due to lower household incomes and job losses, especially in the unsecured segment.
Since the introduction of the lockdown measures in March, the downturn began to influence banks'
operations, although the implications may not yet be fully visible in the first-quarter reporting results.
Figure 25: Deposits remain banks’ main funding source (as percent of total liabilities)
Source: CBR.
Figure 26: High level of NPLs in the system
Source: CBR.
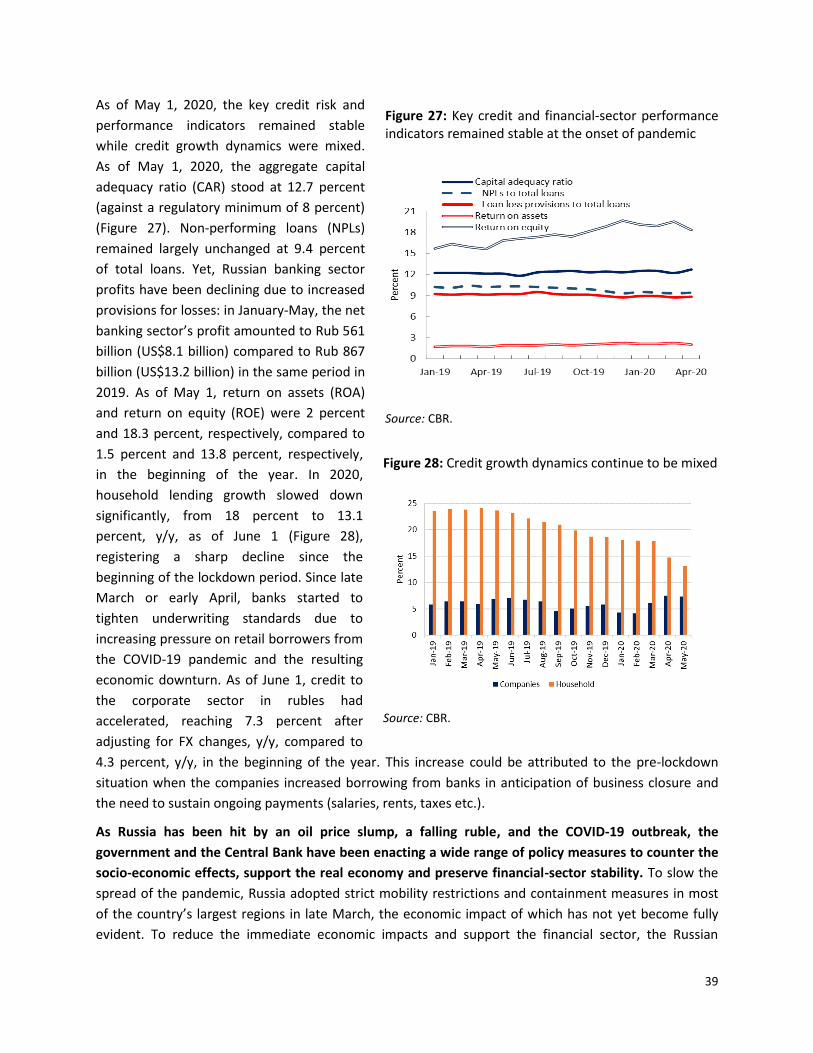
39
As of May 1, 2020, the key credit risk and
performance indicators remained stable
while credit growth dynamics were mixed.
As of May 1, 2020, the aggregate capital
adequacy ratio (CAR) stood at 12.7 percent
(against a regulatory minimum of 8 percent)
(Figure 27). Non-performing loans (NPLs)
remained largely unchanged at 9.4 percent
of total loans. Yet, Russian banking sector
profits have been declining due to increased
provisions for losses: in January-May, the net
banking sector’s profit amounted to Rub 561
billion (US$8.1 billion) compared to Rub 867
billion (US$13.2 billion) in the same period in
2019. As of May 1, return on assets (ROA)
and return on equity (ROE) were 2 percent
and 18.3 percent, respectively, compared to
1.5 percent and 13.8 percent, respectively,
in the beginning of the year. In 2020,
household lending growth slowed down
significantly, from 18 percent to 13.1
percent, y/y, as of June 1 (Figure 28),
registering a sharp decline since the
beginning of the lockdown period. Since late
March or early April, banks started to
tighten underwriting standards due to
increasing pressure on retail borrowers from
the COVID-19 pandemic and the resulting
economic downturn. As of June 1, credit to
the corporate sector in rubles had
accelerated, reaching 7.3 percent after
adjusting for FX changes, y/y, compared to
4.3 percent, y/y, in the beginning of the year. This increase could be attributed to the pre-lockdown
situation when the companies increased borrowing from banks in anticipation of business closure and
the need to sustain ongoing payments (salaries, rents, taxes etc.).
As Russia has been hit by an oil price slump, a falling ruble, and the COVID-19 outbreak, the
government and the Central Bank have been enacting a wide range of policy measures to counter the
socio-economic effects, support the real economy and preserve financial-sector stability. To slow the
spread of the pandemic, Russia adopted strict mobility restrictions and containment measures in most
of the country’s largest regions in late March, the economic impact of which has not yet become fully
evident. To reduce the immediate economic impacts and support the financial sector, the Russian
Figure 27: Key credit and financial-sector performance indicators remained stable at the onset of pandemic
Source: CBR.
Figure 28: Credit growth dynamics continue to be mixed
Source: CBR.
40
Government and the Central Bank have announced a range of policy responses aimed at injecting
liquidity and easing monetary conditions, supporting the banking sector and its borrowers, stabilizing
financial markets, supporting non-bank financial institutions and facilitating the use of digital payments
– all largely in line with what other countries have been doing (Box 3). In Russia, this includes measures
such as (i) continuously providing support for the ruble and FX liquidity; (ii) allowing regulatory
forbearance for banks and micro-finance organizations to allow the restructuring of loans to SMEs, to
firms in the most affected sectors and to individuals affected by the pandemic as well as softening
requirements for lending to the most affected industries; (iii) expanding subsidized lending and partial
credit guaranty programs for SMEs and affected industries, (iv) simplifying the use of digital payments;
(v) postponing a number of changes to the regulation of credit organizations; (vi) reducing the
regulatory and supervisory burden on financial institutions; (vii) maintaining the availability of insurance
services; (viii) supporting professional participants in the securities market and the trading and clearing
infrastructure; and (ix) supporting collective investment market participants, among others.
Box 3: Financial Sector Support Measures in Response to COVID-19.
For the financial sector, the global policy responses to date could be grouped into four main categories
of intervention: injecting liquidity and easing monetary conditions; supporting the banking sector and its
borrowers; stabilizing financial markets while supporting non-bank financial institutions, and
underpinning payments systems. According to the World Bank database, since the COVID-19 outbreak
began in December 2019, more than 1,400 measures have been adopted to support the financial sector by
more than 140 different countries. The goals are to stabilize financial markets, so that credit and liquidity
can keep flowing to the most affected and vulnerable sectors — especially SMEs and households.
Most countries have enacted emergency measures to provide liquidity and support financial institutions.
Confronted by massive capital outflows, several EMDEs have intervened in foreign exchange markets and
established swap lines with other central banks, mostly with the U.S. Federal Reserve. Other countries
have approved measures targeting the payments sector, mainly to encourage the use of digital channels
and mitigate the shock to remittance flows. These include waiving charges and fees and simplifying
electronic Know Your Customer (e-KYC) and digital identification procedures.
Overall, more than half of the measures approved thus far target the banking sector and, within this
category, almost two-thirds are prudential measures taken by regulators and supervisors to help keep
lending flowing and allow time for solvent borrowers to withstand the worst effects of the supply and
demand shocks induced by the lockdown. This is done mostly through a temporary relaxation of certain
key regulatory and supervisory requirements, for example on the use of buffers, reporting, or treatment of
past-due loans. In most G20 economies, and some non-G20 emerging-market economies with well-
developed financial markets, the package also includes clear supervisory guidance and expectations on
how banks should effectively and soundly use this new flexibility. The top measures are credit repayment
moratoria, supporting or facilitating the restructuring of loans, relaxation in the classification and/or
provisioning of non-performing assets (NPA), and releasing or deferring existing capital buffers.
Financial authorities in countries with resilient banking sectors have been relaxing prudential regulations
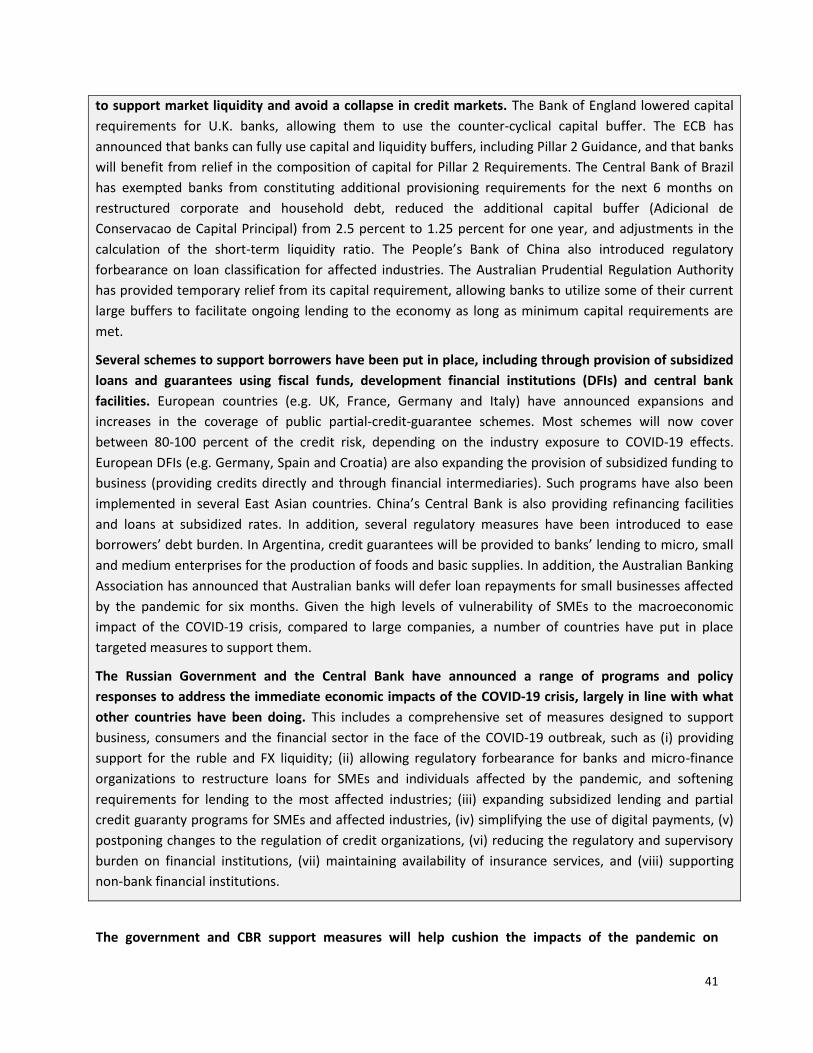
41
to support market liquidity and avoid a collapse in credit markets. The Bank of England lowered capital
requirements for U.K. banks, allowing them to use the counter-cyclical capital buffer. The ECB has
announced that banks can fully use capital and liquidity buffers, including Pillar 2 Guidance, and that banks
will benefit from relief in the composition of capital for Pillar 2 Requirements. The Central Bank of Brazil
has exempted banks from constituting additional provisioning requirements for the next 6 months on
restructured corporate and household debt, reduced the additional capital buffer (Adicional de
Conservacao de Capital Principal) from 2.5 percent to 1.25 percent for one year, and adjustments in the
calculation of the short-term liquidity ratio. The People’s Bank of China also introduced regulatory
forbearance on loan classification for affected industries. The Australian Prudential Regulation Authority
has provided temporary relief from its capital requirement, allowing banks to utilize some of their current
large buffers to facilitate ongoing lending to the economy as long as minimum capital requirements are
met.
Several schemes to support borrowers have been put in place, including through provision of subsidized
loans and guarantees using fiscal funds, development financial institutions (DFIs) and central bank
facilities. European countries (e.g. UK, France, Germany and Italy) have announced expansions and
increases in the coverage of public partial-credit-guarantee schemes. Most schemes will now cover
between 80-100 percent of the credit risk, depending on the industry exposure to COVID-19 effects.
European DFIs (e.g. Germany, Spain and Croatia) are also expanding the provision of subsidized funding to
business (providing credits directly and through financial intermediaries). Such programs have also been
implemented in several East Asian countries. China’s Central Bank is also providing refinancing facilities
and loans at subsidized rates. In addition, several regulatory measures have been introduced to ease
borrowers’ debt burden. In Argentina, credit guarantees will be provided to banks’ lending to micro, small
and medium enterprises for the production of foods and basic supplies. In addition, the Australian Banking
Association has announced that Australian banks will defer loan repayments for small businesses affected
by the pandemic for six months. Given the high levels of vulnerability of SMEs to the macroeconomic
impact of the COVID-19 crisis, compared to large companies, a number of countries have put in place
targeted measures to support them.
The Russian Government and the Central Bank have announced a range of programs and policy
responses to address the immediate economic impacts of the COVID-19 crisis, largely in line with what
other countries have been doing. This includes a comprehensive set of measures designed to support
business, consumers and the financial sector in the face of the COVID-19 outbreak, such as (i) providing
support for the ruble and FX liquidity; (ii) allowing regulatory forbearance for banks and micro-finance
organizations to restructure loans for SMEs and individuals affected by the pandemic, and softening
requirements for lending to the most affected industries; (iii) expanding subsidized lending and partial
credit guaranty programs for SMEs and affected industries, (iv) simplifying the use of digital payments, (v)
postponing changes to the regulation of credit organizations, (vi) reducing the regulatory and supervisory
burden on financial institutions, (vii) maintaining availability of insurance services, and (viii) supporting
non-bank financial institutions.
The government and CBR support measures will help cushion the impacts of the pandemic on
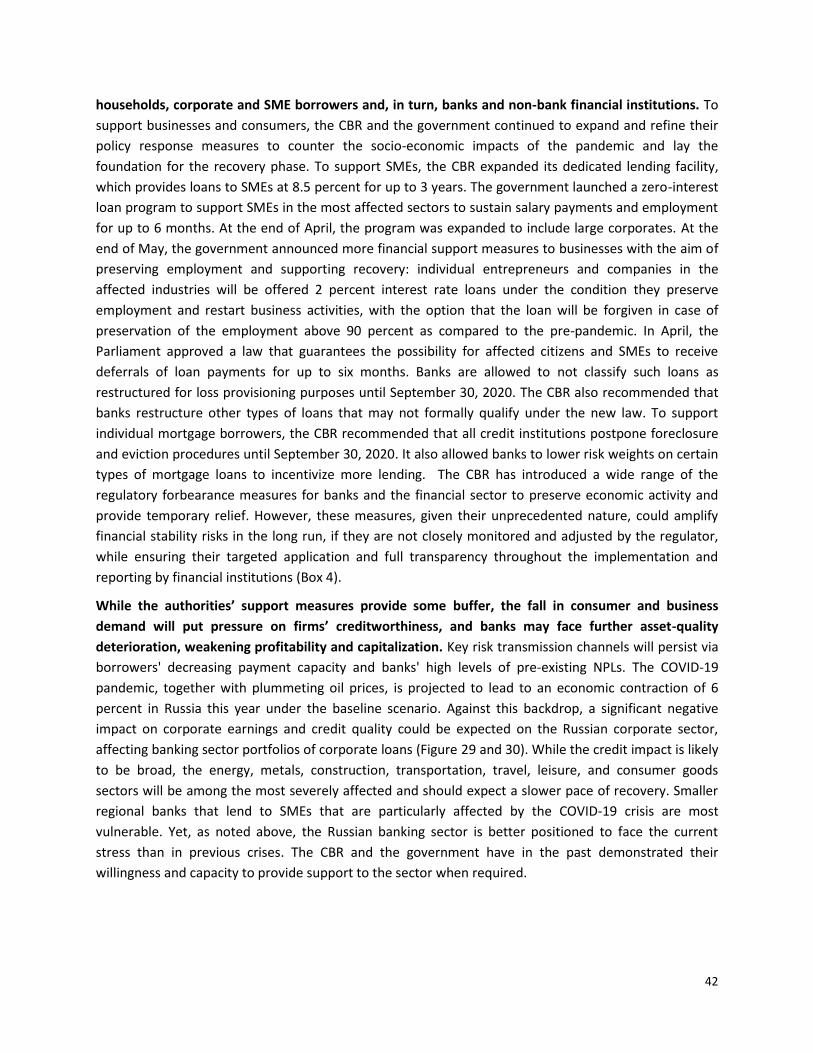
42
households, corporate and SME borrowers and, in turn, banks and non-bank financial institutions. To
support businesses and consumers, the CBR and the government continued to expand and refine their
policy response measures to counter the socio-economic impacts of the pandemic and lay the
foundation for the recovery phase. To support SMEs, the CBR expanded its dedicated lending facility,
which provides loans to SMEs at 8.5 percent for up to 3 years. The government launched a zero-interest
loan program to support SMEs in the most affected sectors to sustain salary payments and employment
for up to 6 months. At the end of April, the program was expanded to include large corporates. At the
end of May, the government announced more financial support measures to businesses with the aim of
preserving employment and supporting recovery: individual entrepreneurs and companies in the
affected industries will be offered 2 percent interest rate loans under the condition they preserve
employment and restart business activities, with the option that the loan will be forgiven in case of
preservation of the employment above 90 percent as compared to the pre-pandemic. In April, the
Parliament approved a law that guarantees the possibility for affected citizens and SMEs to receive
deferrals of loan payments for up to six months. Banks are allowed to not classify such loans as
restructured for loss provisioning purposes until September 30, 2020. The CBR also recommended that
banks restructure other types of loans that may not formally qualify under the new law. To support
individual mortgage borrowers, the CBR recommended that all credit institutions postpone foreclosure
and eviction procedures until September 30, 2020. It also allowed banks to lower risk weights on certain
types of mortgage loans to incentivize more lending. The CBR has introduced a wide range of the
regulatory forbearance measures for banks and the financial sector to preserve economic activity and
provide temporary relief. However, these measures, given their unprecedented nature, could amplify
financial stability risks in the long run, if they are not closely monitored and adjusted by the regulator,
while ensuring their targeted application and full transparency throughout the implementation and
reporting by financial institutions (Box 4).
While the authorities’ support measures provide some buffer, the fall in consumer and business
demand will put pressure on firms’ creditworthiness, and banks may face further asset-quality
deterioration, weakening profitability and capitalization. Key risk transmission channels will persist via
borrowers' decreasing payment capacity and banks' high levels of pre-existing NPLs. The COVID-19
pandemic, together with plummeting oil prices, is projected to lead to an economic contraction of 6
percent in Russia this year under the baseline scenario. Against this backdrop, a significant negative
impact on corporate earnings and credit quality could be expected on the Russian corporate sector,
affecting banking sector portfolios of corporate loans (Figure 29 and 30). While the credit impact is likely
to be broad, the energy, metals, construction, transportation, travel, leisure, and consumer goods
sectors will be among the most severely affected and should expect a slower pace of recovery. Smaller
regional banks that lend to SMEs that are particularly affected by the COVID-19 crisis are most
vulnerable. Yet, as noted above, the Russian banking sector is better positioned to face the current
stress than in previous crises. The CBR and the government have in the past demonstrated their
willingness and capacity to provide support to the sector when required.
43
Figure 29: Corporate loans account for 54 percent of the banking sector loan portfolio, as of April 1
Figure 30: Among the most vulnerable sectors in the corporate sector lending portfolio are manufacturing, trade, and transportation (structure of debt by sector, as of May 1)
Source: CBR. Source: CBR.
The Russian government bought control of Sberbank, Russia’s largest financial institution, from
Russia’s Central Bank; the transaction will help compensate for the lost revenues due to the slump in
oil process and to meet social obligations increased by the pandemic. In April, the Russian government
completed the purchase of a majority stake in Sberbank from the CBR in a Rub 2.1 trillion (US$28.5
billion) deal. The Central Bank sold its 50 percent plus one stake in Sberbank in one move at a price of
Rub 189.44 per share. The price was taken as an average of Sberbank’s closing share price over the last
month of volatile trading. To finance the purchase, the government tapped into the NWF. Change in
Sberbank ownership will resolve the regulator-owner conflict of interest of the CBR holding a majority
stake in Russia’s biggest bank. Yet, as the purchaser is the MoF, Sberbank remains in state hands, so the
state-owned-bank footprint in Russia will remain unchanged (over 60 percent of all assets, of which
Sberbank represents nearly half).
In Russia, where digital payments are already prevalent, COVID-19 could be a significant accelerator
for further advancement of the use of digital financial services. Since the beginning of the pandemic,
the population, businesses and governments have been increasingly relying upon digitally enabled
services to purchase goods and services, make payments and distribute social and emergency assistance
as person-to-person contact has become limited. In line with the policy response measures
implemented by the governments and financial sector authorities globally to facilitate use of digital
payments during the pandemic, the Russian authorities have urged consumers and businesses to use
digital payments rather than cash in an effort to slow down the spread of COVID-19 and advised
commercial banks to limit ruble notes in circulation. The CBR approved measures to ensure the
availability of payments systems to the population, including: (i) lowering/waiving the fees on instant
payments using the CBR Fast Payment System; (ii) lowering the fees paid by online merchants for the
acceptance of cards to encourage the use of online purchases of essential goods and services; (iii)
allowing banks not to block and to automatically extend the validity of all bank cards approaching
44
expiration date, through July 1, 2020, (iv) authorizing banks to temporarily (during the mobility
restricting containment period) open accounts remotely with simplified know-your-customer (KYC)
rules, provided these accounts are opened by individuals to make or receive socially important
payments (social transfers, alimonies, insurance reimbursement, mortgage payments etc.). In terms of
the immediate COVID-19 response, the increased use of digital payments and other financial services,
including due to some temporary KYC relaxation requirements and increased transaction limits, should
be balanced against careful monitoring of increased cyber security risks and AML/CFT concerns. In the
medium term, accelerating the use of biometric data and digital IDs for both individuals and SMEs to
facilitate remote customer identification and enrolment would lead to a greater adoption of digital
financial services.
Box 4: SME Support Measures in Response to COVID-19
Given the high levels of vulnerability of SMEs, compared to large companies, to the macroeconomic
impact of the pandemic, a number of countries have put measures in place to support them. Several
countries have included financial instruments (such as tax relief, guarantees and grants) to reduce the
impact of the outbreak. Several countries have introduced direct financial support to SMEs, such as
new credits granted by public investment banks (France), zero-interest loans with no collateral
(Japan), reducing the time required for banks to provide credit approval (Israel), sectoral support,
especially for the tourism industry (in Australia, Chile and Italy), new public guarantees (Austria,
Japan, Korea, Israel), accounts receivable insurance (Korea) and the mobilization of credit mediation
for SMEs wishing to renegotiate credit terms (France). The Reserve Bank of India introduced
regulatory measures to promote credit flows to the retail sector and micro, small, and medium
enterprises (MSMEs) and provided regulatory forbearance on asset classification of loans to MSMEs
and real estate developers.
Various countries are taking measures regarding procurement and late payments. For example,
France and Belgium have suspended penalties for payment delays on government contracts. France
also offers conflict mediation between SMEs and clients/suppliers. New Zealand asks customers to
pay their bills to small businesses within 10 days. Furthermore, some countries have taken actions to
help SMEs adopt new work processes and find new markets. Finally, in some countries commercial
banks have also taken steps, for instance offering credit and easing conditions for loan repayment. For
example, the Italian Banking Association and several business associations (backed by the
government) have agreed on a large-scale moratorium on debt repayments, including mortgages and
repayments of small loans and revolving credit lines for businesses. To assist businesses and
households impacted by COVID-19, the Bank Negara Malaysia (BNM) allocated RM3.3 billion of
financing facilities under BNM’s Fund for SMEs to provide support for SMEs in sustaining business
operations, safeguarding jobs and encouraging domestic investments. The financing facilities include
(1) a Special Relief Facility, (2) Agrofood Facility and (3) SME Automation and Digitalization Facility.
Participating financial institutions can obtain guarantee coverage from the Credit Guarantee
Corporation Malaysia (CGC) for these facilities.
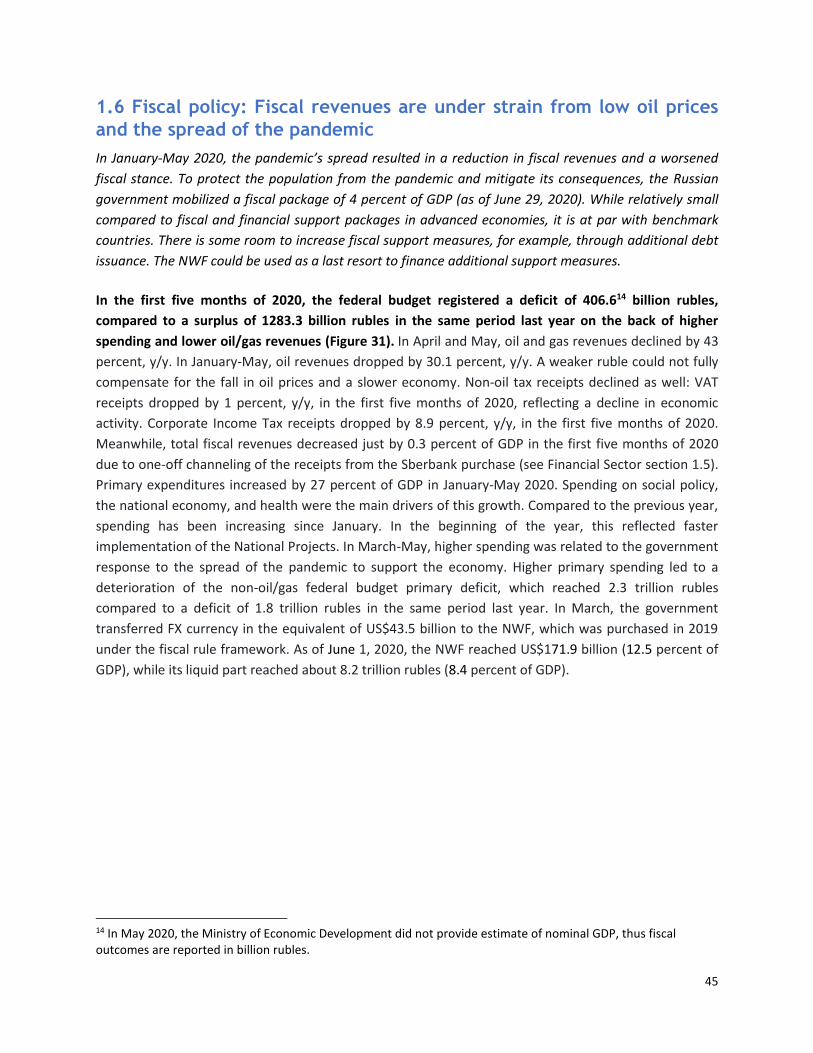
45
1.6 Fiscal policy: Fiscal revenues are under strain from low oil prices
and the spread of the pandemic
In January-May 2020, the pandemic’s spread resulted in a reduction in fiscal revenues and a worsened
fiscal stance. To protect the population from the pandemic and mitigate its consequences, the Russian
government mobilized a fiscal package of 4 percent of GDP (as of June 29, 2020). While relatively small
compared to fiscal and financial support packages in advanced economies, it is at par with benchmark
countries. There is some room to increase fiscal support measures, for example, through additional debt
issuance. The NWF could be used as a last resort to finance additional support measures.
In the first five months of 2020, the federal budget registered a deficit of 406.614 billion rubles,
compared to a surplus of 1283.3 billion rubles in the same period last year on the back of higher
spending and lower oil/gas revenues (Figure 31). In April and May, oil and gas revenues declined by 43
percent, y/y. In January-May, oil revenues dropped by 30.1 percent, y/y. A weaker ruble could not fully
compensate for the fall in oil prices and a slower economy. Non-oil tax receipts declined as well: VAT
receipts dropped by 1 percent, y/y, in the first five months of 2020, reflecting a decline in economic
activity. Corporate Income Tax receipts dropped by 8.9 percent, y/y, in the first five months of 2020.
Meanwhile, total fiscal revenues decreased just by 0.3 percent of GDP in the first five months of 2020
due to one-off channeling of the receipts from the Sberbank purchase (see Financial Sector section 1.5).
Primary expenditures increased by 27 percent of GDP in January-May 2020. Spending on social policy,
the national economy, and health were the main drivers of this growth. Compared to the previous year,
spending has been increasing since January. In the beginning of the year, this reflected faster
implementation of the National Projects. In March-May, higher spending was related to the government
response to the spread of the pandemic to support the economy. Higher primary spending led to a
deterioration of the non-oil/gas federal budget primary deficit, which reached 2.3 trillion rubles
compared to a deficit of 1.8 trillion rubles in the same period last year. In March, the government
transferred FX currency in the equivalent of US$43.5 billion to the NWF, which was purchased in 2019
under the fiscal rule framework. As of June 1, 2020, the NWF reached US$171.9 billion (12.5 percent of
GDP), while its liquid part reached about 8.2 trillion rubles (8.4 percent of GDP).
14 In May 2020, the Ministry of Economic Development did not provide estimate of nominal GDP, thus fiscal outcomes are reported in billion rubles.
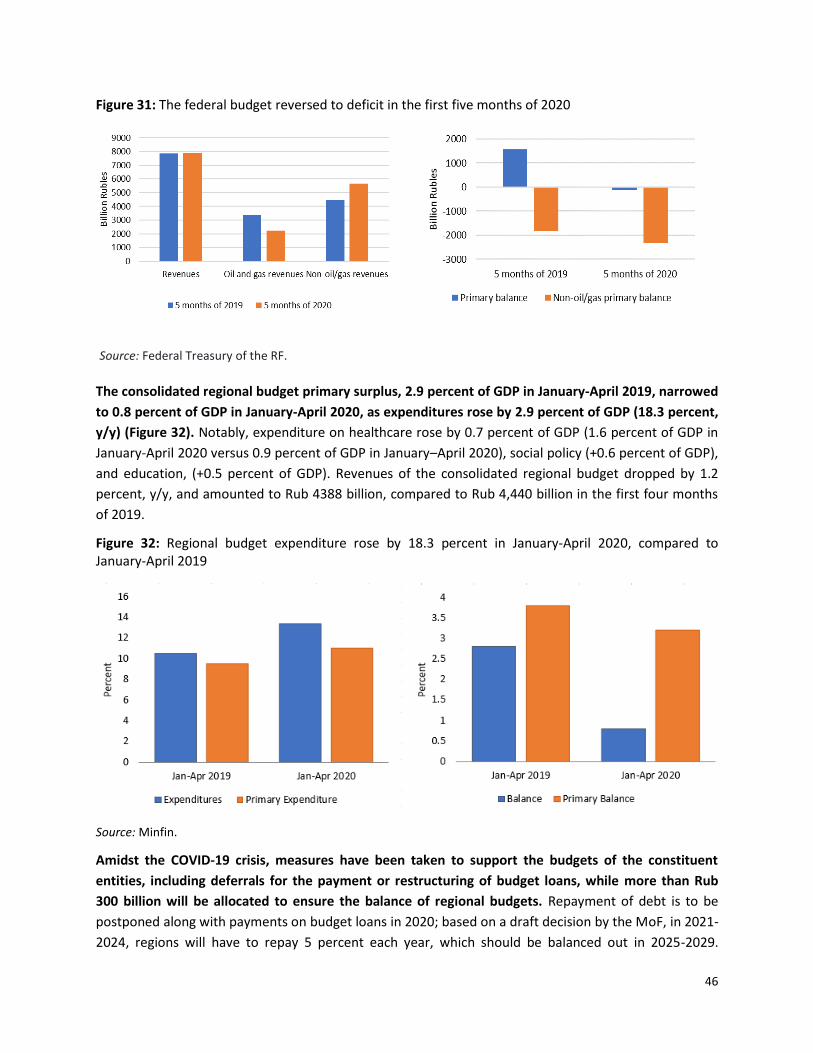
46
Figure 31: The federal budget reversed to deficit in the first five months of 2020
Source: Federal Treasury of the RF.
The consolidated regional budget primary surplus, 2.9 percent of GDP in January-April 2019, narrowed
to 0.8 percent of GDP in January-April 2020, as expenditures rose by 2.9 percent of GDP (18.3 percent,
y/y) (Figure 32). Notably, expenditure on healthcare rose by 0.7 percent of GDP (1.6 percent of GDP in
January-April 2020 versus 0.9 percent of GDP in January–April 2020), social policy (+0.6 percent of GDP),
and education, (+0.5 percent of GDP). Revenues of the consolidated regional budget dropped by 1.2
percent, y/y, and amounted to Rub 4388 billion, compared to Rub 4,440 billion in the first four months
of 2019.
Figure 32: Regional budget expenditure rose by 18.3 percent in January-April 2020, compared to January-April 2019
Source: Minfin.
Amidst the COVID-19 crisis, measures have been taken to support the budgets of the constituent
entities, including deferrals for the payment or restructuring of budget loans, while more than Rub
300 billion will be allocated to ensure the balance of regional budgets. Repayment of debt is to be
postponed along with payments on budget loans in 2020; based on a draft decision by the MoF, in 2021-
2024, regions will have to repay 5 percent each year, which should be balanced out in 2025-2029.
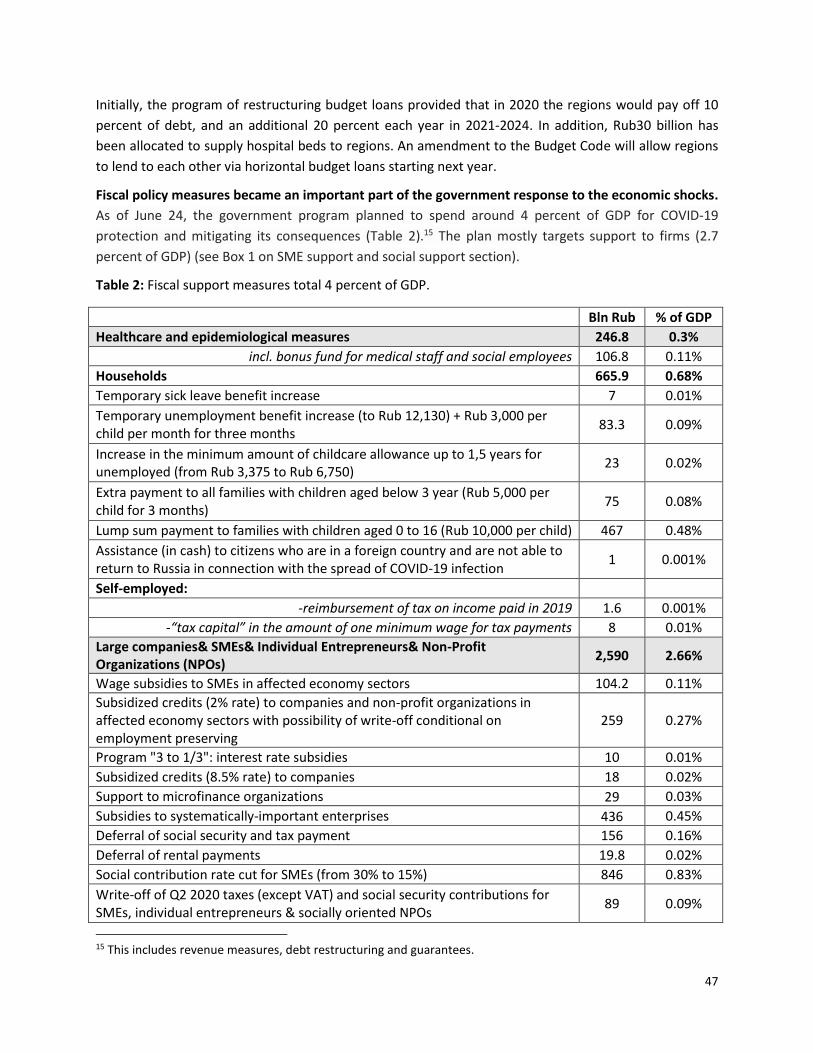
47
Initially, the program of restructuring budget loans provided that in 2020 the regions would pay off 10
percent of debt, and an additional 20 percent each year in 2021-2024. In addition, Rub30 billion has
been allocated to supply hospital beds to regions. An amendment to the Budget Code will allow regions
to lend to each other via horizontal budget loans starting next year.
Fiscal policy measures became an important part of the government response to the economic shocks.
As of June 24, the government program planned to spend around 4 percent of GDP for COVID-19
protection and mitigating its consequences (Table 2).15 The plan mostly targets support to firms (2.7
percent of GDP) (see Box 1 on SME support and social support section).
Table 2: Fiscal support measures total 4 percent of GDP.
Bln Rub % of GDP
Healthcare and epidemiological measures 246.8 0.3%
incl. bonus fund for medical staff and social employees 106.8 0.11%
Households 665.9 0.68%
Temporary sick leave benefit increase 7 0.01%
Temporary unemployment benefit increase (to Rub 12,130) + Rub 3,000 per child per month for three months
83.3 0.09%
Increase in the minimum amount of childcare allowance up to 1,5 years for unemployed (from Rub 3,375 to Rub 6,750)
23 0.02%
Extra payment to all families with children aged below 3 year (Rub 5,000 per child for 3 months)
75 0.08%
Lump sum payment to families with children aged 0 to 16 (Rub 10,000 per child) 467 0.48%
Assistance (in cash) to citizens who are in a foreign country and are not able to return to Russia in connection with the spread of COVID-19 infection
1 0.001%
Self-employed:
-reimbursement of tax on income paid in 2019 1.6 0.001%
-“tax capital” in the amount of one minimum wage for tax payments 8 0.01%
Large companies& SMEs& Individual Entrepreneurs& Non-Profit Organizations (NPOs)
2,590 2.66%
Wage subsidies to SMEs in affected economy sectors 104.2 0.11%
Subsidized credits (2% rate) to companies and non-profit organizations in affected economy sectors with possibility of write-off conditional on employment preserving
259 0.27%
Program "3 to 1/3": interest rate subsidies 10 0.01%
Subsidized credits (8.5% rate) to companies 18 0.02%
Support to microfinance organizations 29 0.03%
Subsidies to systematically-important enterprises 436 0.45%
Deferral of social security and tax payment 156 0.16%
Deferral of rental payments 19.8 0.02%
Social contribution rate cut for SMEs (from 30% to 15%) 846 0.83%
Write-off of Q2 2020 taxes (except VAT) and social security contributions for SMEs, individual entrepreneurs & socially oriented NPOs
89 0.09%
15 This includes revenue measures, debt restructuring and guarantees.
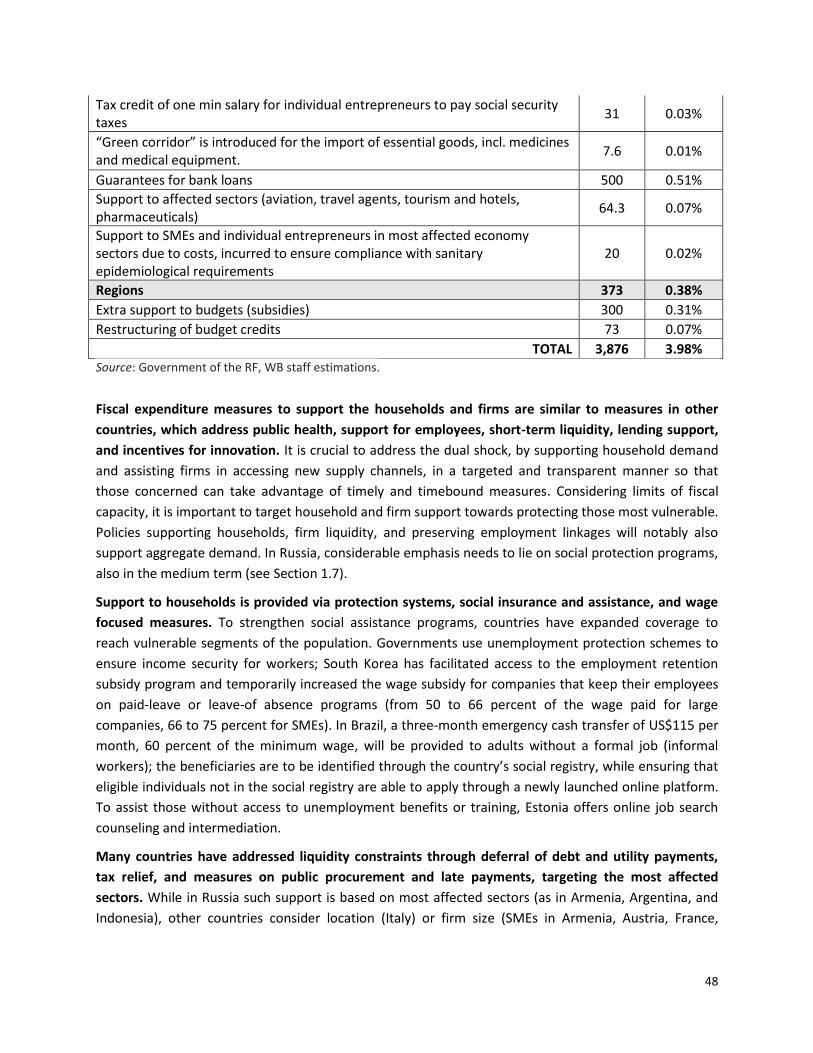
48
Tax credit of one min salary for individual entrepreneurs to pay social security taxes
31 0.03%
“Green corridor” is introduced for the import of essential goods, incl. medicines and medical equipment.
7.6 0.01%
Guarantees for bank loans 500 0.51%
Support to affected sectors (aviation, travel agents, tourism and hotels, pharmaceuticals)
64.3 0.07%
Support to SMEs and individual entrepreneurs in most affected economy sectors due to costs, incurred to ensure compliance with sanitary epidemiological requirements
20 0.02%
Regions 373 0.38%
Extra support to budgets (subsidies) 300 0.31%
Restructuring of budget credits 73 0.07%
TOTAL 3,876 3.98% Source: Government of the RF, WB staff estimations.
Fiscal expenditure measures to support the households and firms are similar to measures in other
countries, which address public health, support for employees, short-term liquidity, lending support,
and incentives for innovation. It is crucial to address the dual shock, by supporting household demand
and assisting firms in accessing new supply channels, in a targeted and transparent manner so that
those concerned can take advantage of timely and timebound measures. Considering limits of fiscal
capacity, it is important to target household and firm support towards protecting those most vulnerable.
Policies supporting households, firm liquidity, and preserving employment linkages will notably also
support aggregate demand. In Russia, considerable emphasis needs to lie on social protection programs,
also in the medium term (see Section 1.7).
Support to households is provided via protection systems, social insurance and assistance, and wage
focused measures. To strengthen social assistance programs, countries have expanded coverage to
reach vulnerable segments of the population. Governments use unemployment protection schemes to
ensure income security for workers; South Korea has facilitated access to the employment retention
subsidy program and temporarily increased the wage subsidy for companies that keep their employees
on paid-leave or leave-of absence programs (from 50 to 66 percent of the wage paid for large
companies, 66 to 75 percent for SMEs). In Brazil, a three-month emergency cash transfer of US$115 per
month, 60 percent of the minimum wage, will be provided to adults without a formal job (informal
workers); the beneficiaries are to be identified through the country’s social registry, while ensuring that
eligible individuals not in the social registry are able to apply through a newly launched online platform.
To assist those without access to unemployment benefits or training, Estonia offers online job search
counseling and intermediation.
Many countries have addressed liquidity constraints through deferral of debt and utility payments,
tax relief, and measures on public procurement and late payments, targeting the most affected
sectors. While in Russia such support is based on most affected sectors (as in Armenia, Argentina, and
Indonesia), other countries consider location (Italy) or firm size (SMEs in Armenia, Austria, France,
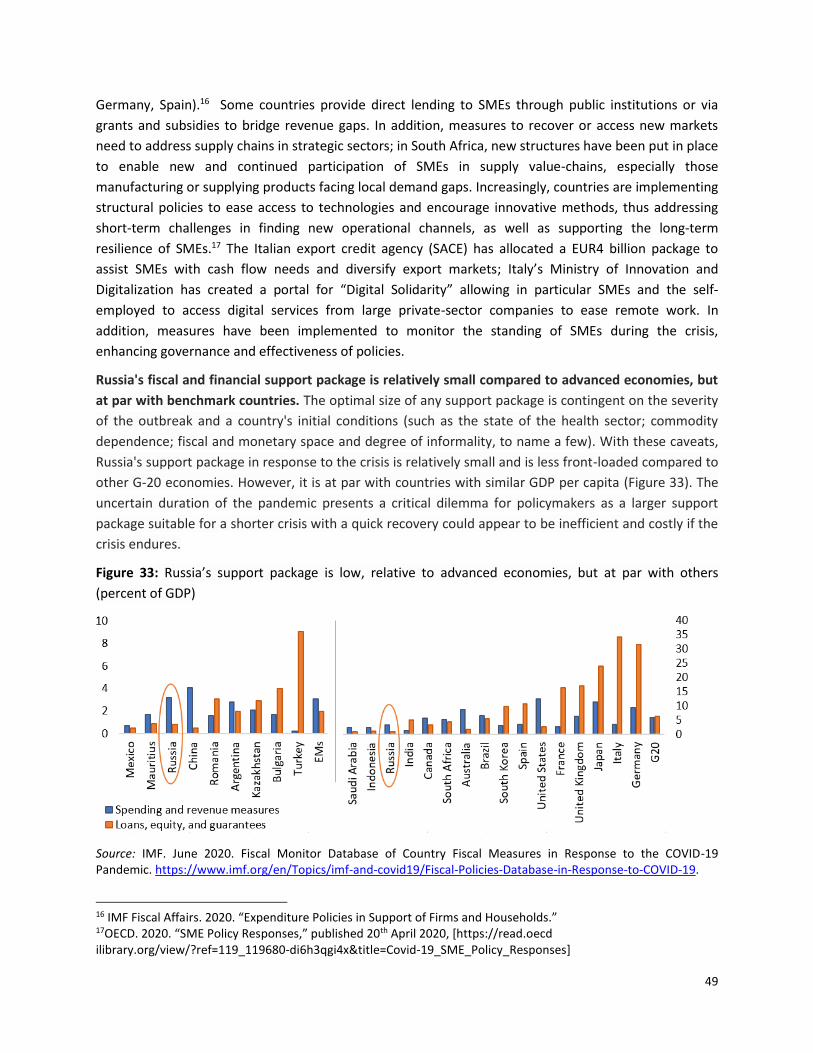
49
Germany, Spain).16 Some countries provide direct lending to SMEs through public institutions or via
grants and subsidies to bridge revenue gaps. In addition, measures to recover or access new markets
need to address supply chains in strategic sectors; in South Africa, new structures have been put in place
to enable new and continued participation of SMEs in supply value-chains, especially those
manufacturing or supplying products facing local demand gaps. Increasingly, countries are implementing
structural policies to ease access to technologies and encourage innovative methods, thus addressing
short-term challenges in finding new operational channels, as well as supporting the long-term
resilience of SMEs.17 The Italian export credit agency (SACE) has allocated a EUR4 billion package to
assist SMEs with cash flow needs and diversify export markets; Italy’s Ministry of Innovation and
Digitalization has created a portal for “Digital Solidarity” allowing in particular SMEs and the self-
employed to access digital services from large private-sector companies to ease remote work. In
addition, measures have been implemented to monitor the standing of SMEs during the crisis,
enhancing governance and effectiveness of policies.
Russia's fiscal and financial support package is relatively small compared to advanced economies, but
at par with benchmark countries. The optimal size of any support package is contingent on the severity
of the outbreak and a country's initial conditions (such as the state of the health sector; commodity
dependence; fiscal and monetary space and degree of informality, to name a few). With these caveats,
Russia's support package in response to the crisis is relatively small and is less front-loaded compared to
other G-20 economies. However, it is at par with countries with similar GDP per capita (Figure 33). The
uncertain duration of the pandemic presents a critical dilemma for policymakers as a larger support
package suitable for a shorter crisis with a quick recovery could appear to be inefficient and costly if the
crisis endures.
Figure 33: Russia’s support package is low, relative to advanced economies, but at par with others
(percent of GDP)
Source: IMF. June 2020. Fiscal Monitor Database of Country Fiscal Measures in Response to the COVID-19 Pandemic. https://www.imf.org/en/Topics/imf-and-covid19/Fiscal-Policies-Database-in-Response-to-COVID-19.
16 IMF Fiscal Affairs. 2020. “Expenditure Policies in Support of Firms and Households.” 17OECD. 2020. “SME Policy Responses,” published 20th April 2020, [https://read.oecd ilibrary.org/view/?ref=119_119680-di6h3qgi4x&title=Covid-19_SME_Policy_Responses]
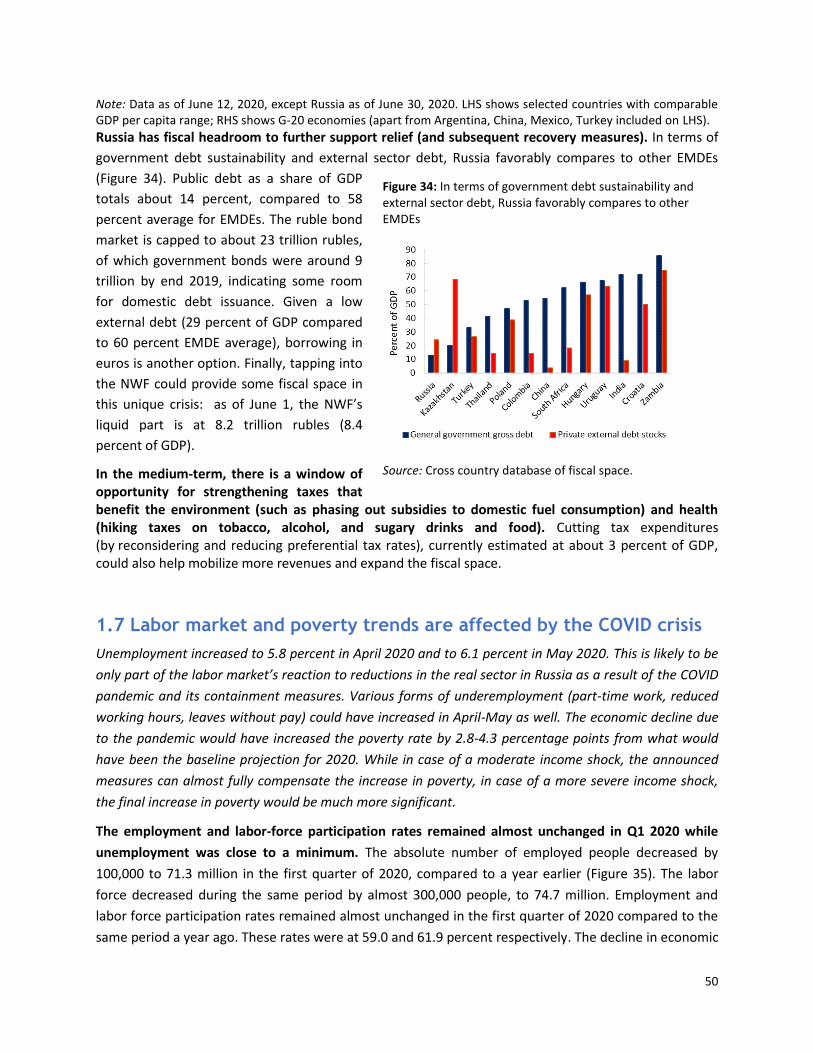
50
Note: Data as of June 12, 2020, except Russia as of June 30, 2020. LHS shows selected countries with comparable GDP per capita range; RHS shows G-20 economies (apart from Argentina, China, Mexico, Turkey included on LHS).
Russia has fiscal headroom to further support relief (and subsequent recovery measures). In terms of
government debt sustainability and external sector debt, Russia favorably compares to other EMDEs
(Figure 34). Public debt as a share of GDP
totals about 14 percent, compared to 58
percent average for EMDEs. The ruble bond
market is capped to about 23 trillion rubles,
of which government bonds were around 9
trillion by end 2019, indicating some room
for domestic debt issuance. Given a low
external debt (29 percent of GDP compared
to 60 percent EMDE average), borrowing in
euros is another option. Finally, tapping into
the NWF could provide some fiscal space in
this unique crisis: as of June 1, the NWF’s
liquid part is at 8.2 trillion rubles (8.4
percent of GDP).
In the medium-term, there is a window of opportunity for strengthening taxes that benefit the environment (such as phasing out subsidies to domestic fuel consumption) and health (hiking taxes on tobacco, alcohol, and sugary drinks and food). Cutting tax expenditures (by reconsidering and reducing preferential tax rates), currently estimated at about 3 percent of GDP, could also help mobilize more revenues and expand the fiscal space.
1.7 Labor market and poverty trends are affected by the COVID crisis
Unemployment increased to 5.8 percent in April 2020 and to 6.1 percent in May 2020. This is likely to be
only part of the labor market’s reaction to reductions in the real sector in Russia as a result of the COVID
pandemic and its containment measures. Various forms of underemployment (part-time work, reduced
working hours, leaves without pay) could have increased in April-May as well. The economic decline due
to the pandemic would have increased the poverty rate by 2.8-4.3 percentage points from what would
have been the baseline projection for 2020. While in case of a moderate income shock, the announced
measures can almost fully compensate the increase in poverty, in case of a more severe income shock,
the final increase in poverty would be much more significant.
The employment and labor-force participation rates remained almost unchanged in Q1 2020 while
unemployment was close to a minimum. The absolute number of employed people decreased by
100,000 to 71.3 million in the first quarter of 2020, compared to a year earlier (Figure 35). The labor
force decreased during the same period by almost 300,000 people, to 74.7 million. Employment and
labor force participation rates remained almost unchanged in the first quarter of 2020 compared to the
same period a year ago. These rates were at 59.0 and 61.9 percent respectively. The decline in economic
Figure 34: In terms of government debt sustainability and external sector debt, Russia favorably compares to other EMDEs
Source: Cross country database of fiscal space.
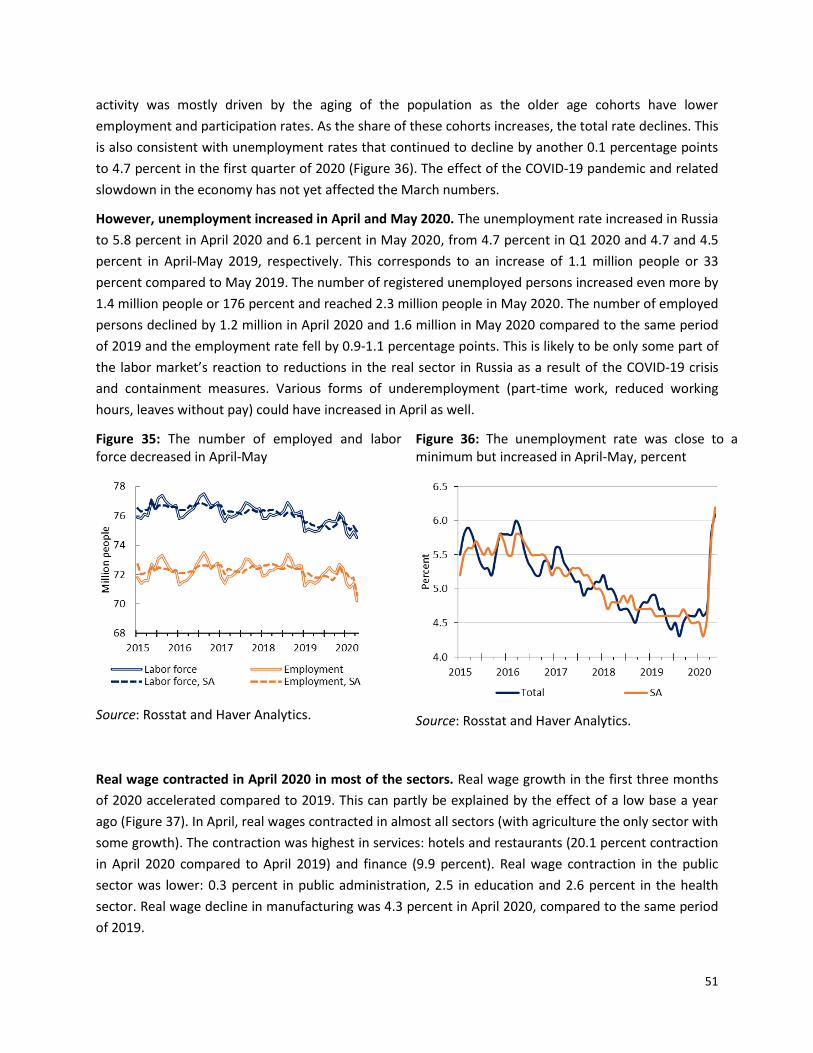
51
activity was mostly driven by the aging of the population as the older age cohorts have lower
employment and participation rates. As the share of these cohorts increases, the total rate declines. This
is also consistent with unemployment rates that continued to decline by another 0.1 percentage points
to 4.7 percent in the first quarter of 2020 (Figure 36). The effect of the COVID-19 pandemic and related
slowdown in the economy has not yet affected the March numbers.
However, unemployment increased in April and May 2020. The unemployment rate increased in Russia
to 5.8 percent in April 2020 and 6.1 percent in May 2020, from 4.7 percent in Q1 2020 and 4.7 and 4.5
percent in April-May 2019, respectively. This corresponds to an increase of 1.1 million people or 33
percent compared to May 2019. The number of registered unemployed persons increased even more by
1.4 million people or 176 percent and reached 2.3 million people in May 2020. The number of employed
persons declined by 1.2 million in April 2020 and 1.6 million in May 2020 compared to the same period
of 2019 and the employment rate fell by 0.9-1.1 percentage points. This is likely to be only some part of
the labor market’s reaction to reductions in the real sector in Russia as a result of the COVID-19 crisis
and containment measures. Various forms of underemployment (part-time work, reduced working
hours, leaves without pay) could have increased in April as well.
Figure 35: The number of employed and labor force decreased in April-May
Source: Rosstat and Haver Analytics.
Figure 36: The unemployment rate was close to a minimum but increased in April-May, percent
Source: Rosstat and Haver Analytics.
Real wage contracted in April 2020 in most of the sectors. Real wage growth in the first three months
of 2020 accelerated compared to 2019. This can partly be explained by the effect of a low base a year
ago (Figure 37). In April, real wages contracted in almost all sectors (with agriculture the only sector with
some growth). The contraction was highest in services: hotels and restaurants (20.1 percent contraction
in April 2020 compared to April 2019) and finance (9.9 percent). Real wage contraction in the public
sector was lower: 0.3 percent in public administration, 2.5 in education and 2.6 percent in the health
sector. Real wage decline in manufacturing was 4.3 percent in April 2020, compared to the same period
of 2019.
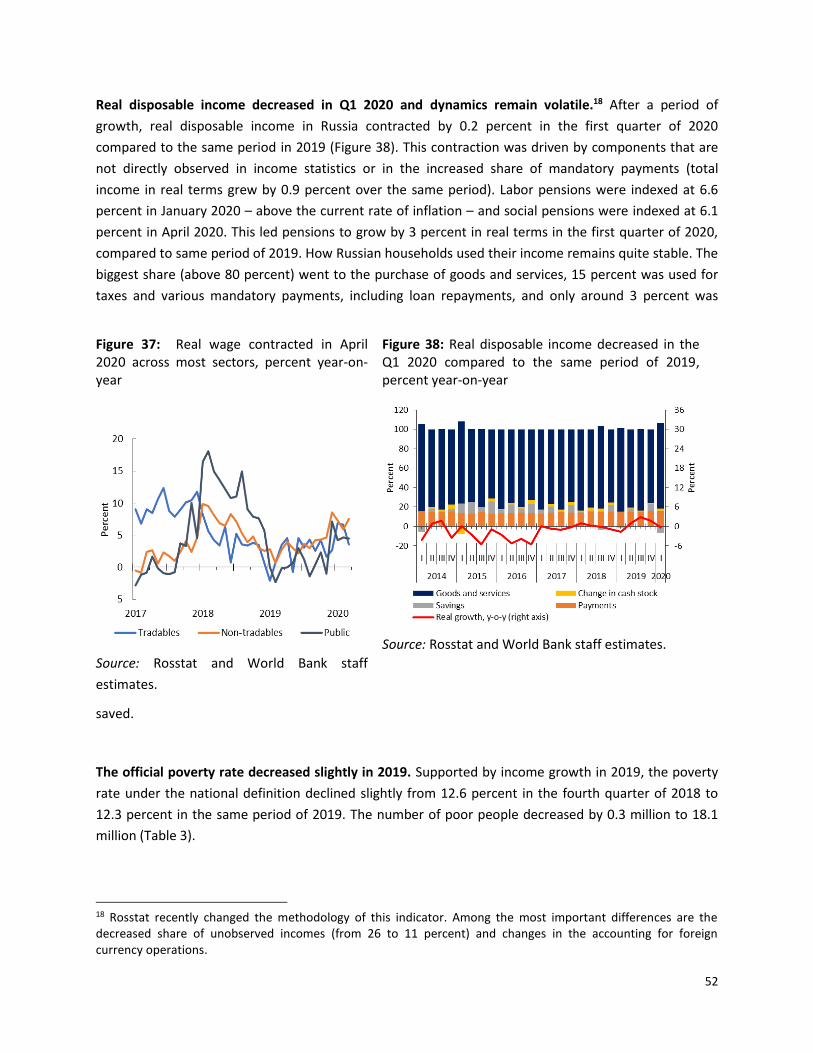
52
Real disposable income decreased in Q1 2020 and dynamics remain volatile.18 After a period of
growth, real disposable income in Russia contracted by 0.2 percent in the first quarter of 2020
compared to the same period in 2019 (Figure 38). This contraction was driven by components that are
not directly observed in income statistics or in the increased share of mandatory payments (total
income in real terms grew by 0.9 percent over the same period). Labor pensions were indexed at 6.6
percent in January 2020 – above the current rate of inflation – and social pensions were indexed at 6.1
percent in April 2020. This led pensions to grow by 3 percent in real terms in the first quarter of 2020,
compared to same period of 2019. How Russian households used their income remains quite stable. The
biggest share (above 80 percent) went to the purchase of goods and services, 15 percent was used for
taxes and various mandatory payments, including loan repayments, and only around 3 percent was
saved.
The official poverty rate decreased slightly in 2019. Supported by income growth in 2019, the poverty
rate under the national definition declined slightly from 12.6 percent in the fourth quarter of 2018 to
12.3 percent in the same period of 2019. The number of poor people decreased by 0.3 million to 18.1
million (Table 3).
18 Rosstat recently changed the methodology of this indicator. Among the most important differences are the decreased share of unobserved incomes (from 26 to 11 percent) and changes in the accounting for foreign currency operations.
Figure 37: Real wage contracted in April 2020 across most sectors, percent year-on-year
Source: Rosstat and World Bank staff
estimates.
Figure 38: Real disposable income decreased in the Q1 2020 compared to the same period of 2019, percent year-on-year
Source: Rosstat and World Bank staff estimates.
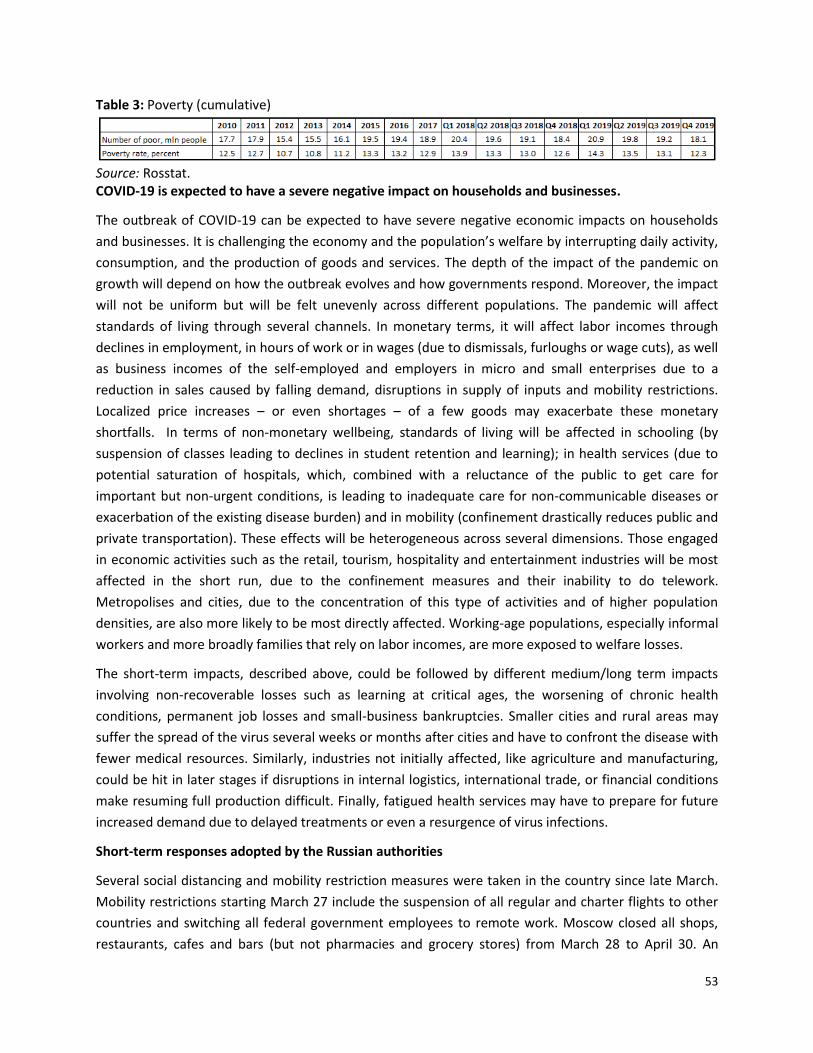
53
Table 3: Poverty (cumulative)
Source: Rosstat. COVID-19 is expected to have a severe negative impact on households and businesses.
The outbreak of COVID-19 can be expected to have severe negative economic impacts on households
and businesses. It is challenging the economy and the population’s welfare by interrupting daily activity,
consumption, and the production of goods and services. The depth of the impact of the pandemic on
growth will depend on how the outbreak evolves and how governments respond. Moreover, the impact
will not be uniform but will be felt unevenly across different populations. The pandemic will affect
standards of living through several channels. In monetary terms, it will affect labor incomes through
declines in employment, in hours of work or in wages (due to dismissals, furloughs or wage cuts), as well
as business incomes of the self-employed and employers in micro and small enterprises due to a
reduction in sales caused by falling demand, disruptions in supply of inputs and mobility restrictions.
Localized price increases – or even shortages – of a few goods may exacerbate these monetary
shortfalls. In terms of non-monetary wellbeing, standards of living will be affected in schooling (by
suspension of classes leading to declines in student retention and learning); in health services (due to
potential saturation of hospitals, which, combined with a reluctance of the public to get care for
important but non-urgent conditions, is leading to inadequate care for non-communicable diseases or
exacerbation of the existing disease burden) and in mobility (confinement drastically reduces public and
private transportation). These effects will be heterogeneous across several dimensions. Those engaged
in economic activities such as the retail, tourism, hospitality and entertainment industries will be most
affected in the short run, due to the confinement measures and their inability to do telework.
Metropolises and cities, due to the concentration of this type of activities and of higher population
densities, are also more likely to be most directly affected. Working-age populations, especially informal
workers and more broadly families that rely on labor incomes, are more exposed to welfare losses.
The short-term impacts, described above, could be followed by different medium/long term impacts
involving non-recoverable losses such as learning at critical ages, the worsening of chronic health
conditions, permanent job losses and small-business bankruptcies. Smaller cities and rural areas may
suffer the spread of the virus several weeks or months after cities and have to confront the disease with
fewer medical resources. Similarly, industries not initially affected, like agriculture and manufacturing,
could be hit in later stages if disruptions in internal logistics, international trade, or financial conditions
make resuming full production difficult. Finally, fatigued health services may have to prepare for future
increased demand due to delayed treatments or even a resurgence of virus infections.
Short-term responses adopted by the Russian authorities
Several social distancing and mobility restriction measures were taken in the country since late March.
Mobility restrictions starting March 27 include the suspension of all regular and charter flights to other
countries and switching all federal government employees to remote work. Moscow closed all shops,
restaurants, cafes and bars (but not pharmacies and grocery stores) from March 28 to April 30. An
54
extension of the nationwide “non-working week” was announced first until April 30 and later until May
11. New legislation imposed severe punishment, including up to five years in prison, for people
convicted of spreading false information about COVID-19 and up to seven years in prison for people
breaking mobility restriction and containment rules. As is happening globally, the adverse impact of
these confinement measures on the real economy is inevitable. In addition, the Russian economy is
facing a severe terms-of-trade shock due to the fall in oil prices. The Urals crude benchmark went from
US$53.55 on February 23 to below US$25 on March 18, before rising again to almost US$31 on May
14th. The ruble fell from US$/Rub 66.7 on February 24 to US$/Rub 72.3 on May 20). Consequently,
according to World Bank estimates, GDP is expected to decline by 6.0 percent in 2020 in the baseline
scenario and 9.6 percent in a more adverse scenario (see Outlook section).
The major challenge is the rising unemployment rate for formal-sector workers and the loss of income in
the informal sector, the self-employed and small/micro business owners. The social protection
mitigation responses currently being undertaken in Russia are crucial to counteract these effects. These
measures already include changes in social assistance, social insurance and other labor market
regulatory measures that try to protect the groups more likely to be affected by the crisis. In terms of
social assistance, the three main measures are: (i) a moratorium on cutting utility services for debts and
fines for late payments from April 1 to December 31, 2020 (ii) an automatic extension of social benefits
without the need to submit any additional information or apply to the authorities in person and (iii)
additional cash transfers for families with children, so that all families will receive cash payment of Rub
5,000 per month for each child up to 3 years old (from April to June 2020). In terms of social insurance,
the four main measures are (i) an increase in the maximum size of unemployment benefits from Rub
8,000 (US$103) to Rub 12,130 (US$157) a month and payment of the maximum size of unemployment
benefit to all employees who lost their jobs due to COVID-19 since the beginning of March for three
months, (ii) an increase in compensation for employees on sick leave — at least one minimum wage Rub
12,130 (US$157) per month until December 31, 2020; and (iii) a reduction in social insurance
contributions for small and medium-sized businesses from 30 to 15 percent on the share of wages that
is above the minimum wage. Labor market regulatory measures include: (i) waiving work permit
(“patent”) charges for labor migrants and automatically extending their work permits and (ii) extending
disability status for disabled workers and waiving the need for physical visits for new disability status
applications until October 2020. In addition, there are some region- and firm-specific policies. Some
regions introduced additional lump-sum cash payments for pensioners aged 65 and over (Rub 4,000 in
Moscow, Rub3,000 in Moscow Oblast, Rub 2,000 in Tyumen Oblast). Policies to help SMEs have also
been proposed, such as: (i) a bankruptcy moratorium for small businesses; (ii) tax holidays for small
businesses and (iii) Rub 12,130 (US$157) per month to small and medium-sized businesses for every
employee in April and May, provided the firms maintain 90 percent of their workforce. On May 10th,
additional rounds of policy measures were announced. The most salient were: (i) the self-employed and
employees of small and medium enterprises from the most affected industries will not pay Personal
Income Tax (PIT) and Social Insurance Contributions (SIC) in the second quarter of 2020; (ii) a tax
allowance equal to the Minimum Wage for the self-employed from the most affected industries, (iii)
contributory pensions are increased by 6.6 percent and social pensions by 5.1 percent; (iv) the increased
55
unemployment benefits mentioned above, with a much-simplified online procedure for applicants, will
be topped up by Rub 3,000 for each child under 18 year to be paid for three months, and (v) a lump-sum
cash payment of Rub 10,000 for each child aged 3-16 years in June and July (announced in June); (vi) an
increase in the minimum amount of the childcare allowance up to 1.5 years paid for the first child.
A preliminary assessment of the impact of the pandemic and policy responses
Assessing the poverty and distributional impact of the pandemic in 2020 is complicated because of
several confounding factors. The Russian GDP, at the end of 2019, was forecast to grow 1 percent in
2020. In January 2020, reforms were announced in social protection programs, including an extension in
the coverage of the existing means-tested child allowances for the first and second child, and the
introduction of a new means-tested allowance for children aged 3 to 7. In early March, disagreements
on production controls in the OPEC+ group precipitated a sudden decline in oil prices. In late March,
initial confinement measures were introduced and then extended, covering the months of April and
May, leading to different impacts across economic activities and locations. A preliminary assessment of
the impact of these shocks and policy responses makes use of RUSMOD, a micro-simulation model of
Russia that runs computer experiments for assessing changes in existing monetary tax-transfer policies
implemented at the federal level for a nationally representative sample of the population (see Annex 1
for details).
According to the simulations, the economic decline due to the pandemic would have increased the
poverty rate by 2.8 percentage points from what would have been the baseline projection for 2020,
from 12.0 to 14.8 percent in the scenario of moderate income shock, and by 4.3 percentage points to
16.3 percent in case of severe income shock. The measures adopted in January, targeted to poor
families with children, and the additional measures taken in March-June to cope with the economic
impact of the pandemic, do not fully compensate this increase in poverty. The projection for 2020 ends
with a 12.2 percent poverty rate (0.2 percentage points above the baseline scenario) in case of
moderate shock (Figure 39, panel A) and with 13.4 poverty rate (1.4 percentage points above the
baseline) in case of severe income shock (Figure 39, panel B).
However, these findings need to be interpreted with caution. One group that may not get adequate
coverage from these compensatory measures are the informal workers. This would undermine the
estimated anti-poverty effect. The estimates are also subject to actual implementation, which would
depend on many different factors. For example, a simulation scenario assumes current take-up rates of
unemployment insurance where only 25 percent of beneficiaries get the benefit, but the actual take-up
might be different. Child allowances, of which some are means-tested, tend to have a better take-up
rate. Tax exemptions and subsidies to SMEs are new measures and it is difficult to ascertain their take-
up rates. If any of these policies have even lower take-up rates than in the simulations, because of
administrative or other logistical complications, the poverty rate could end up above the forecasts. The
analysis also hypothesizes a contained impact of the crises on metropolitan areas and large urban
centers, and the spread of the pandemic is somehow controlled and short- lived, with limited ripple
effects on rural areas and small cities.
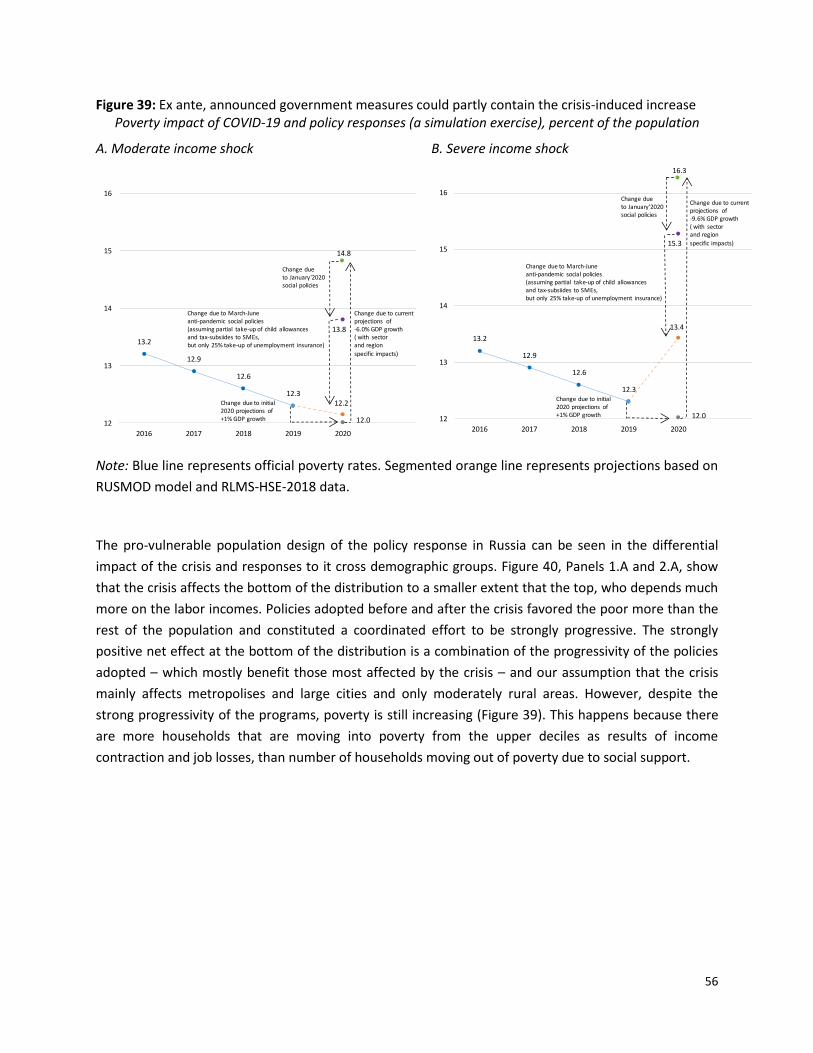
56
Figure 39: Ex ante, announced government measures could partly contain the crisis-induced increase Poverty impact of COVID-19 and policy responses (a simulation exercise), percent of the population
A. Moderate income shock
B. Severe income shock
Note: Blue line represents official poverty rates. Segmented orange line represents projections based on
RUSMOD model and RLMS-HSE-2018 data.
The pro-vulnerable population design of the policy response in Russia can be seen in the differential
impact of the crisis and responses to it cross demographic groups. Figure 40, Panels 1.A and 2.A, show
that the crisis affects the bottom of the distribution to a smaller extent that the top, who depends much
more on the labor incomes. Policies adopted before and after the crisis favored the poor more than the
rest of the population and constituted a coordinated effort to be strongly progressive. The strongly
positive net effect at the bottom of the distribution is a combination of the progressivity of the policies
adopted – which mostly benefit those most affected by the crisis – and our assumption that the crisis
mainly affects metropolises and large cities and only moderately rural areas. However, despite the
strong progressivity of the programs, poverty is still increasing (Figure 39). This happens because there
are more households that are moving into poverty from the upper deciles as results of income
contraction and job losses, than number of households moving out of poverty due to social support.
13.2
12.9
12.6
12.312.2
12.0
14.8
13.8
12
13
14
15
16
2016 2017 2018 2019 2020
Change due to initial 2020 projections of+1% GDP growth
Change due to January'2020social policies
Change due to current projections of -6.0% GDP growth( with sector and region
specific impacts)
Change due to March-June anti-pandemic social policies(assuming partial take-up of child allowances and tax-subsiides to SMEs, but only 25% take-up of unemployment insurance)
13.2
12.9
12.6
12.3
13.4
12.0
16.3
15.3
12
13
14
15
16
2016 2017 2018 2019 2020
Change due to initial 2020 projections of+1% GDP growth
Change due to January'2020social policies
Change due to current projections of -9.6% GDP growth( with sector and region
specific impacts)
Change due to March-June anti-pandemic social policies(assuming partial take-up of child allowances and tax-subsiides to SMEs, but only 25% take-up of unemployment insurance)
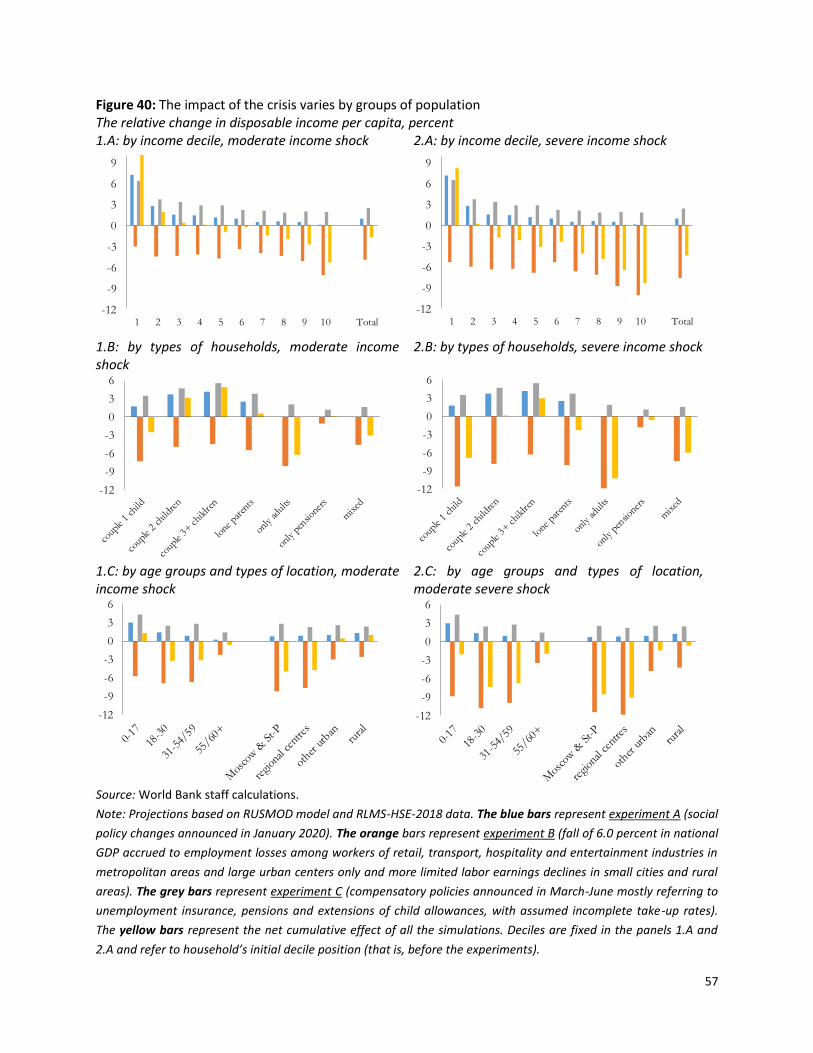
57
Figure 40: The impact of the crisis varies by groups of population The relative change in disposable income per capita, percent 1.A: by income decile, moderate income shock
2.A: by income decile, severe income shock
1.B: by types of households, moderate income shock
2.B: by types of households, severe income shock
1.C: by age groups and types of location, moderate income shock
2.C: by age groups and types of location, moderate severe shock
Source: World Bank staff calculations.
Note: Projections based on RUSMOD model and RLMS-HSE-2018 data. The blue bars represent experiment A (social
policy changes announced in January 2020). The orange bars represent experiment B (fall of 6.0 percent in national
GDP accrued to employment losses among workers of retail, transport, hospitality and entertainment industries in
metropolitan areas and large urban centers only and more limited labor earnings declines in small cities and rural
areas). The grey bars represent experiment C (compensatory policies announced in March-June mostly referring to
unemployment insurance, pensions and extensions of child allowances, with assumed incomplete take-up rates).
The yellow bars represent the net cumulative effect of all the simulations. Deciles are fixed in the panels 1.A and
2.A and refer to household’s initial decile position (that is, before the experiments).
-12
-9
-6
-3
0
3
6
9
1 2 3 4 5 6 7 8 9 10 Total
-12
-9
-6
-3
0
3
6
9
1 2 3 4 5 6 7 8 9 10 Total
-12
-9
-6
-3
0
3
6
-12
-9
-6
-3
0
3
6
-12
-9
-6
-3
0
3
6
-12
-9
-6
-3
0
3
6
58
If the crisis affects more intensely the incomes in rural areas, the net effect will be more neutral across
the income distribution, but the programs are still progressive and favoring the poorest groups of the
population. Figure 40 (Panels 1.B and 2.B) illustrates that the policy changes announced in January 2020,
with their focus on extending the coverage and the benefit level of child allowances, only benefit
families with children. These are groups known to have higher poverty rates than the rest of the
population, so an extension in coverage and sufficiency in these programs is expected to have a
progressive, poverty-reducing impact. On the other hand, the expansion of unemployment insurance
and tax reductions to the self-employed and to small and medium firms has a more pervasive impact
and can be detected across family types, age-groups and locations. Pensioners who are most likely not
working, and hence cannot benefit from unemployment insurance or tax assistance, benefit from the
increases in pensions (panels 1.C and 2.C). The net effect (under simulation assumptions) protects
families with two and more children as well as single parents in case of moderate shock and only
families with three children in case of severe shock. All other groups see a decline in disposable income
even despite the measures adopted.
This simulation exercise hypothesizes a contained impact of the crises upon metropolitan areas and
large urban centers. This is an optimistic, short-term scenario that assumes that the spread of the virus
is somehow controlled (Figure 40, Panel 1.C) and the pandemic is short-lived, with limited ripple effects
on rural areas in case of moderate shock. In case of a more severe shock, all types of locations are
affected negatively (Figure 40, Panel 2.C). If in the medium to long term, the pandemic proves more
difficult to control and the crisis affects other industries and locations, the impact and the necessary
responses will need to be reevaluated and, as indicated before, could have a deeper impact across
different groups.
Beyond the short term: A more substantive agenda of social protection reforms
The current system would need to be strengthened as part of the short-term COVID-19 pandemic
mitigation responses as well as part of post-pandemic investment towards modernization of the safety
net. Russia spends around 3.2 percent of GDP on social-assistance programs, which at face value is
double the global average of 1.6 percent and well above the spending in its regional group (2.2 percent).
However, the social-assistance system in Russia does not necessarily prioritize the poor. Overall, only 0.4
percent of GDP spending is directed to means-tested programs (compared to an 0.5 percent average in
the EU, ranging from 0.1 in Bulgaria and 1.4 percent in the Netherlands). Mitigating the impact of the
COVID-19 crisis on the poor and vulnerable is attainable using the current welfare system, but it needs
strengthening along two dimensions: its coverage of the poor has to be expanded and its generosity
needs to be increased. Before the crisis, the poor received only 10 percent of social assistance transfers.
Even when covered, they receive insufficient support to move out of poverty. The level of means-tested
benefits is small: a poor person receives on average around 1/3 of the poverty gap.
The measures adopted to increase allowances for children that are targeted to families in the bottom of
the distribution are in the direction of proposed reforms (that is, increased targeted coverage and
generosity) and seem to have an important effect upon reduction (as indicated in the simulations
59
above). Adjustments to other programs such as “Poverty benefits,”19 which covers around 7 percent of
the population, can also have immediate results. Allocating more resources to means-tested programs
such as the Social Contract Program, improving the means test, administrative processes and increasing
the value of benefits to the poor can make a more effective COVID-19 mitigation response as well as
contribute towards longer-term national goals of poverty reduction. In the short and long-term, utilizing
the potential of the safety net would not only provide a forceful countermeasure to mitigate the impact
of the crisis, it would also strengthen the authority of the Government, create a lasting positive
perception among the population and mitigate the economic downturn by stimulating the economy.
In sum, the current system in Russia could be strengthened with improvements sequenced to prioritize
temporary COVID-19 responses while undertaking systematic modernization as an investment for the
future. The post-pandemic objectives of the proposed measures would be to get the safety net system
to attain the following features. First, it should be adaptive, that is to make it more shock-responsive
and to act as an automatic stabilization mechanism anticipating regular shocks with the means of
targeting and distributing relief to those affected. An example is Germany, where programs like GMI and
Kurzarbeit automatically scale up and down in response to shocks. Second, to be integrated, that is
using a casework-based system that relies on a comprehensive assessment of each individual family, it
needs to determine a package of assistance that integrates cash assistance, labor activation and social
services to facilitate permanent graduation out of poverty and to minimize benefit dependency. An
example of this is the Netherlands, where the situation of each family is used to define a package of
assistance that includes activation and social services. And third, it needs to be efficient, effective and
sustainable and aim for a performance that yields a high rate of short- and long-term poverty reduction
per unit of spending. This efficiency in many countries that have strong means-test oriented safety nets
are also generous enough to lift people out of poverty (e.g. Brazil, Portugal and the Nordic countries).
The other area that demands strengthening is social services ─ community-based social services, crisis
centers, sheltered homes, and centers offering non-residential services such as social support, day-care
centers and specialized institutions such as homes for the elderly with mental disabilities and homes for
children deprived of parental care. These are a central element to the COVID-19 response. In the
immediate term, there is an urgent need to increase the existing capacity of social services. This
translates to more financing and human resources. For example, extra budget and effort will be needed
to address immediate COVID-19 preventive needs at residential elderly care and other facilities
supporting vulnerable groups. Such support could include additional financing to local governments or
directly to institutions such as orphanages, residential and health-care facilities. The measures would
include increased pay, additional staff, further financial and material resources such as protective gear,
and new safety protocols. Some of these measures have been adopted, such as the extra pay for
medical staff and the mobilization of medical students to work in hospitals. But in the longer term, there
is a need for Russia to invest in modern tools for profiling families for different types of social services so
they efficiently and effectively use these services, and in a system that ensures that the supply of social
services matches the demand for different types of support to avoid gaps in the types of services
19 Regional programs, usually means-tested, targeted to the poorest population.

60
needed, but also to avoid the exclusion of groups that require such support.
61
PART 2. Outlook: A deep recession looms
The pandemic will push the global economy into recession, with a projected contraction of 5.2 percent
in 2020 — the worst rate in post-war history.20 Any numerical forecast for the period ahead, however, is
subject to unprecedented levels of uncertainty. With oil prices averaging US$32/bbl in 2020, the
baseline scenario suggests a contraction of the Russian GDP of 6.0 percent with a moderate recovery in
2021-2022. Even with positive, projected GDP growth ahead, GDP levels in 2022 would have barely
caught up to pre-pandemic levels. In a more adverse scenario, the GDP could contract by 9.6 percent in
2020 and recover by a marginal 0.1 percent in 2021. Risks are firmly tilted to the downside and include a
more protracted pandemic and hence a prolongation of containment measures, a further drop in
commodity prices, and a slower recovery due to lasting impacts on consumers and firms and disruptions
in global value chains. Pre-existing financial-sector vulnerabilities could be amplified by the pandemic. In
the medium term, banks' asset quality is expected to deteriorate across the corporate, SME and retail
sectors, leading to pressure on profitability and capital.
Global outlook
Lockdowns and other stringent containment measures are successfully slowing the spread of the
virus. The flattened curve of new infections is helping to reduce the stress on the capacity of health
systems. At the same time, these containment measures have sharply reduced economic activity
(Baldwin and Weder di Mauro 2020; Gourinchas 2020; Eichenbaum, Rebelo, and Trabandt 2020). Their
gradual removal is expected to pave the way for a partial recovery in the second half of the year. Based
on these assumptions, the world economy is projected to contract by 5.2 percent in 2020. If this forecast
is realized, the fall in global output would be significantly more than double that of the 2009 global
recession. Output is envisioned to rebound in 2021 (+4.2 percent), as the economic effects of the
pandemic gradually fade, but not to the extent that it retained its previously expected level.
Commodity market price forecasts and risks
Oil prices are projected to average US$32/bbl in 2020 before recovering to US$38/bbl in 2021 and
US$41/bbl in 2022, a substantial downgrade from previous forecasts. The sharp downward revision to
the price forecast reflects the weakness in oil demand, which is expected to have fallen by 18 percent in
Q2 2020 and drop by 8 percent in 2020 overall — more than twice as large as any previous decline (IEA
2020). Supply is also expected to fall, with production among the three largest producers (Russia, Saudi
Arabia, and the United States) likely to be around 5mb/d lower in Q4 2020 compared to Q1 2020 (Figure
41). Oil interventions have also risen sharply, and high levels of inventories will cap any significant price
increases over the forecast.
The oil price forecast is exceptionally uncertain at present. The outlook depends critically on the speed
20 World Bank. 2020. Global Economic Prospects, June 2020. Washington, DC: World Bank.
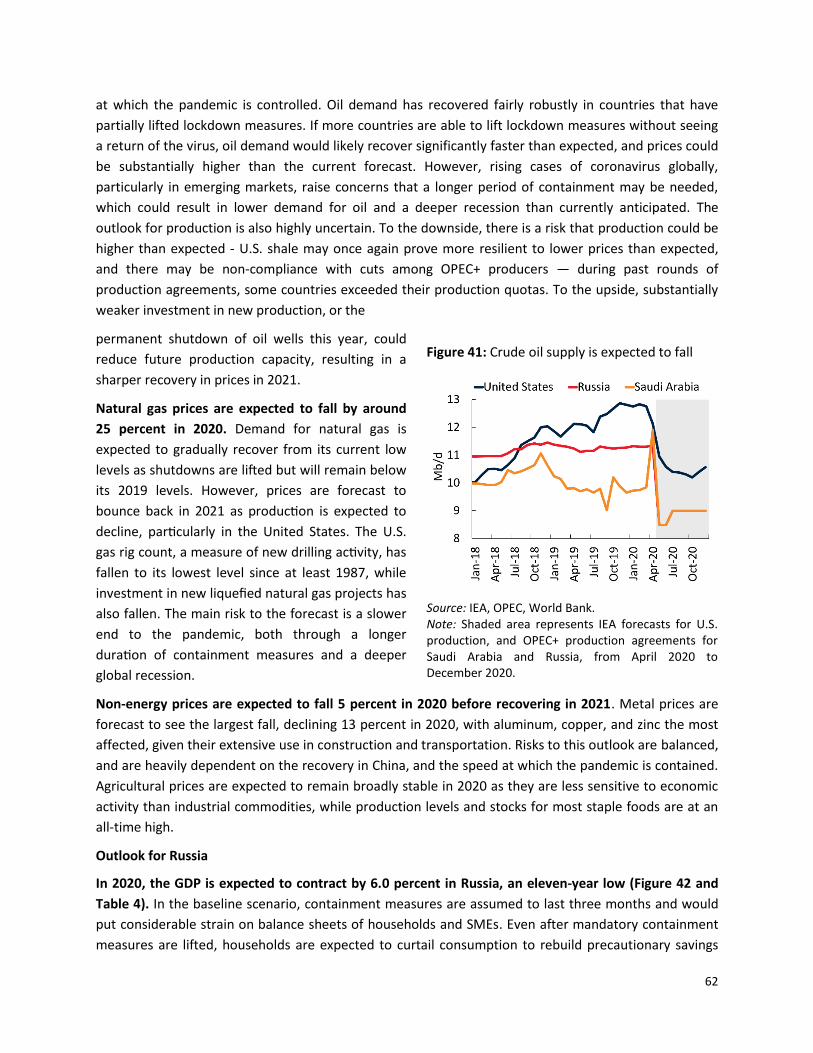
62
at which the pandemic is controlled. Oil demand has recovered fairly robustly in countries that have
partially lifted lockdown measures. If more countries are able to lift lockdown measures without seeing
a return of the virus, oil demand would likely recover significantly faster than expected, and prices could
be substantially higher than the current forecast. However, rising cases of coronavirus globally,
particularly in emerging markets, raise concerns that a longer period of containment may be needed,
which could result in lower demand for oil and a deeper recession than currently anticipated. The
outlook for production is also highly uncertain. To the downside, there is a risk that production could be
higher than expected - U.S. shale may once again prove more resilient to lower prices than expected,
and there may be non-compliance with cuts among OPEC+ producers — during past rounds of
production agreements, some countries exceeded their production quotas. To the upside, substantially
weaker investment in new production, or the
permanent shutdown of oil wells this year, could
reduce future production capacity, resulting in a
sharper recovery in prices in 2021.
Natural gas prices are expected to fall by around
25 percent in 2020. Demand for natural gas is
expected to gradually recover from its current low
levels as shutdowns are lifted but will remain below
its 2019 levels. However, prices are forecast to
bounce back in 2021 as production is expected to
decline, particularly in the United States. The U.S.
gas rig count, a measure of new drilling activity, has
fallen to its lowest level since at least 1987, while
investment in new liquefied natural gas projects has
also fallen. The main risk to the forecast is a slower
end to the pandemic, both through a longer
duration of containment measures and a deeper
global recession.
Non-energy prices are expected to fall 5 percent in 2020 before recovering in 2021. Metal prices are
forecast to see the largest fall, declining 13 percent in 2020, with aluminum, copper, and zinc the most
affected, given their extensive use in construction and transportation. Risks to this outlook are balanced,
and are heavily dependent on the recovery in China, and the speed at which the pandemic is contained.
Agricultural prices are expected to remain broadly stable in 2020 as they are less sensitive to economic
activity than industrial commodities, while production levels and stocks for most staple foods are at an
all-time high.
Outlook for Russia
In 2020, the GDP is expected to contract by 6.0 percent in Russia, an eleven-year low (Figure 42 and
Table 4). In the baseline scenario, containment measures are assumed to last three months and would
put considerable strain on balance sheets of households and SMEs. Even after mandatory containment
measures are lifted, households are expected to curtail consumption to rebuild precautionary savings
Figure 41: Crude oil supply is expected to fall
Source: IEA, OPEC, World Bank. Note: Shaded area represents IEA forecasts for U.S. production, and OPEC+ production agreements for Saudi Arabia and Russia, from April 2020 to December 2020.
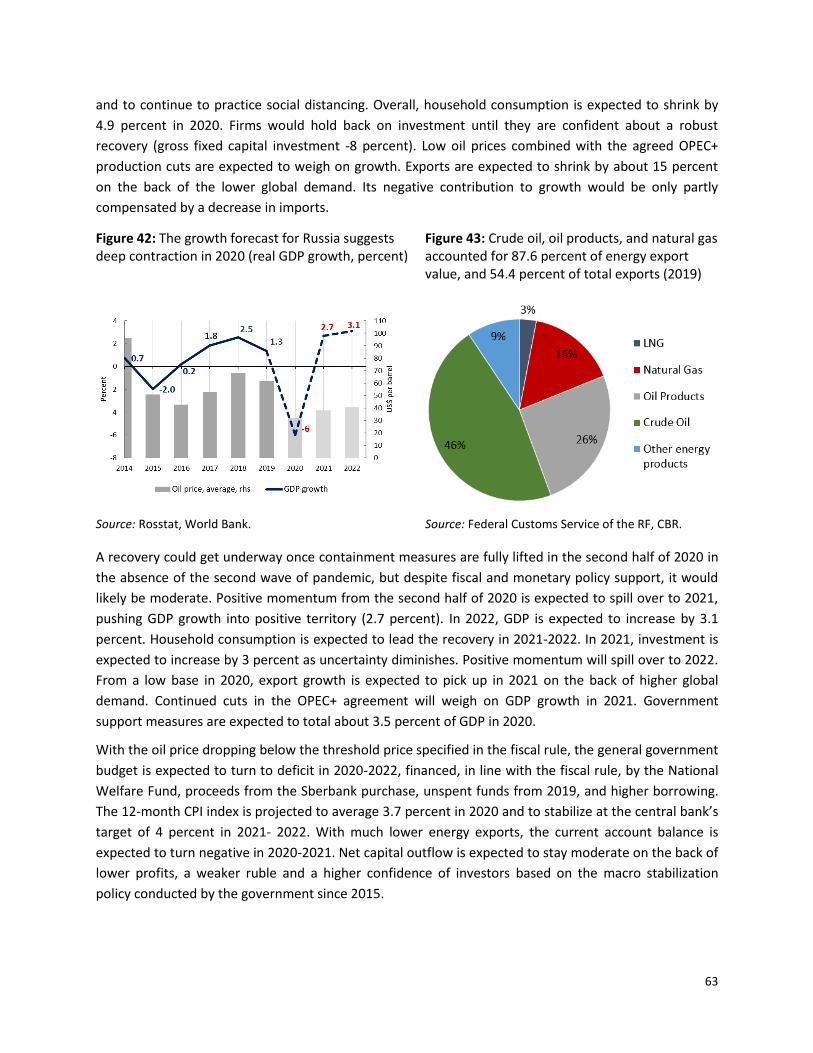
63
and to continue to practice social distancing. Overall, household consumption is expected to shrink by
4.9 percent in 2020. Firms would hold back on investment until they are confident about a robust
recovery (gross fixed capital investment -8 percent). Low oil prices combined with the agreed OPEC+
production cuts are expected to weigh on growth. Exports are expected to shrink by about 15 percent
on the back of the lower global demand. Its negative contribution to growth would be only partly
compensated by a decrease in imports.
A recovery could get underway once containment measures are fully lifted in the second half of 2020 in
the absence of the second wave of pandemic, but despite fiscal and monetary policy support, it would
likely be moderate. Positive momentum from the second half of 2020 is expected to spill over to 2021,
pushing GDP growth into positive territory (2.7 percent). In 2022, GDP is expected to increase by 3.1
percent. Household consumption is expected to lead the recovery in 2021-2022. In 2021, investment is
expected to increase by 3 percent as uncertainty diminishes. Positive momentum will spill over to 2022.
From a low base in 2020, export growth is expected to pick up in 2021 on the back of higher global
demand. Continued cuts in the OPEC+ agreement will weigh on GDP growth in 2021. Government
support measures are expected to total about 3.5 percent of GDP in 2020.
With the oil price dropping below the threshold price specified in the fiscal rule, the general government
budget is expected to turn to deficit in 2020-2022, financed, in line with the fiscal rule, by the National
Welfare Fund, proceeds from the Sberbank purchase, unspent funds from 2019, and higher borrowing.
The 12-month CPI index is projected to average 3.7 percent in 2020 and to stabilize at the central bank’s
target of 4 percent in 2021- 2022. With much lower energy exports, the current account balance is
expected to turn negative in 2020-2021. Net capital outflow is expected to stay moderate on the back of
lower profits, a weaker ruble and a higher confidence of investors based on the macro stabilization
policy conducted by the government since 2015.
Figure 42: The growth forecast for Russia suggests deep contraction in 2020 (real GDP growth, percent)
Figure 43: Crude oil, oil products, and natural gas accounted for 87.6 percent of energy export value, and 54.4 percent of total exports (2019)
Source: Rosstat, World Bank. Source: Federal Customs Service of the RF, CBR.
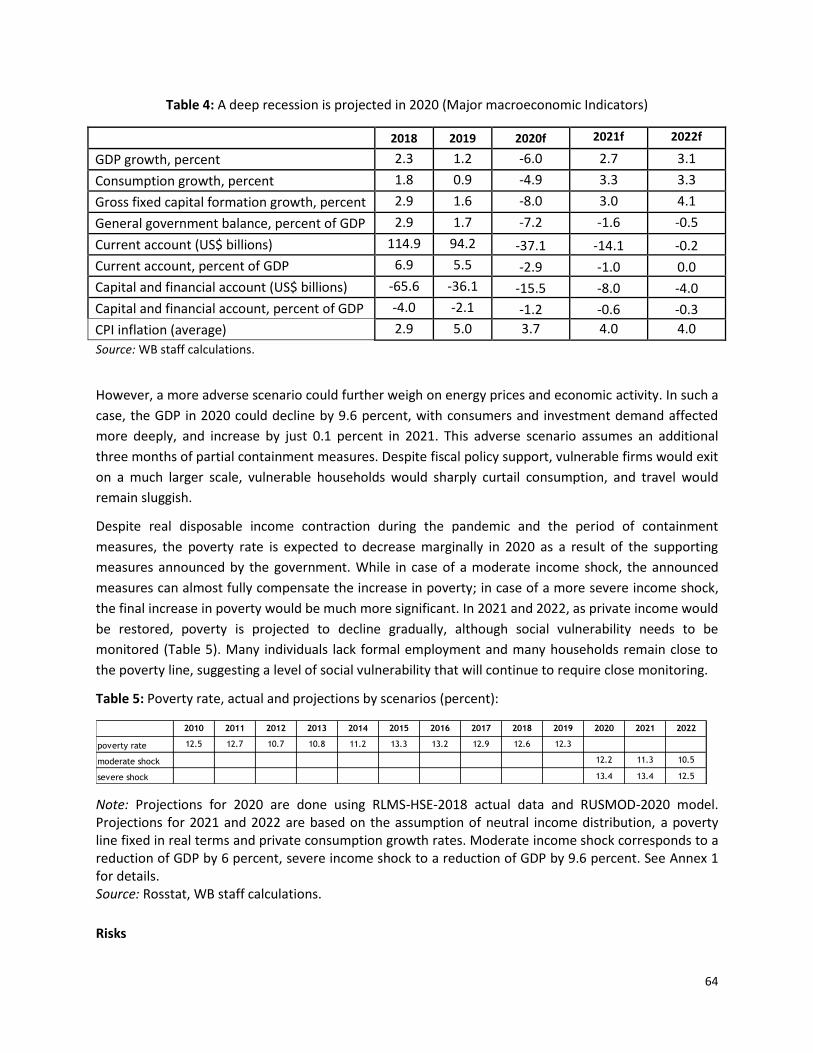
64
Table 4: A deep recession is projected in 2020 (Major macroeconomic Indicators)
2018 2019 2020f 2021f 2022f
GDP growth, percent 2.3 1.2 -6.0 2.7 3.1
Consumption growth, percent 1.8 0.9 -4.9 3.3 3.3
Gross fixed capital formation growth, percent 2.9 1.6 -8.0 3.0 4.1
General government balance, percent of GDP 2.9 1.7 -7.2 -1.6 -0.5
Current account (US$ billions) 114.9 94.2 -37.1 -14.1 -0.2
Current account, percent of GDP 6.9 5.5 -2.9 -1.0 0.0
Capital and financial account (US$ billions) -65.6 -36.1 -15.5 -8.0 -4.0
Capital and financial account, percent of GDP -4.0 -2.1 -1.2 -0.6 -0.3
CPI inflation (average) 2.9 5.0 3.7 4.0 4.0
Source: WB staff calculations.
However, a more adverse scenario could further weigh on energy prices and economic activity. In such a
case, the GDP in 2020 could decline by 9.6 percent, with consumers and investment demand affected
more deeply, and increase by just 0.1 percent in 2021. This adverse scenario assumes an additional
three months of partial containment measures. Despite fiscal policy support, vulnerable firms would exit
on a much larger scale, vulnerable households would sharply curtail consumption, and travel would
remain sluggish.
Despite real disposable income contraction during the pandemic and the period of containment
measures, the poverty rate is expected to decrease marginally in 2020 as a result of the supporting
measures announced by the government. While in case of a moderate income shock, the announced
measures can almost fully compensate the increase in poverty; in case of a more severe income shock,
the final increase in poverty would be much more significant. In 2021 and 2022, as private income would
be restored, poverty is projected to decline gradually, although social vulnerability needs to be
monitored (Table 5). Many individuals lack formal employment and many households remain close to
the poverty line, suggesting a level of social vulnerability that will continue to require close monitoring.
Table 5: Poverty rate, actual and projections by scenarios (percent):
Note: Projections for 2020 are done using RLMS-HSE-2018 actual data and RUSMOD-2020 model. Projections for 2021 and 2022 are based on the assumption of neutral income distribution, a poverty line fixed in real terms and private consumption growth rates. Moderate income shock corresponds to a reduction of GDP by 6 percent, severe income shock to a reduction of GDP by 9.6 percent. See Annex 1 for details. Source: Rosstat, WB staff calculations.
Risks
2010 2011 2012 2013 2014 2015 2016 2017 2018 2019 2020 2021 2022
poverty rate 12.5 12.7 10.7 10.8 11.2 13.3 13.2 12.9 12.6 12.3
moderate shock 12.2 11.3 10.5
severe shock 13.4 13.4 12.5
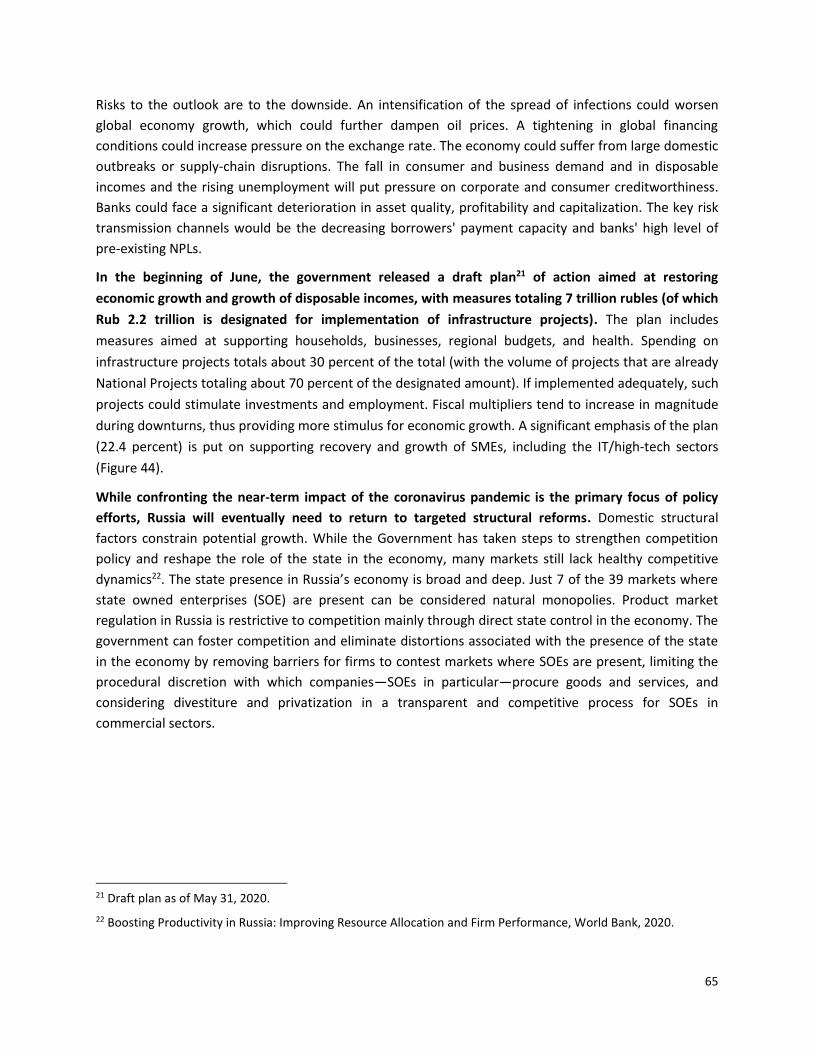
65
Risks to the outlook are to the downside. An intensification of the spread of infections could worsen
global economy growth, which could further dampen oil prices. A tightening in global financing
conditions could increase pressure on the exchange rate. The economy could suffer from large domestic
outbreaks or supply-chain disruptions. The fall in consumer and business demand and in disposable
incomes and the rising unemployment will put pressure on corporate and consumer creditworthiness.
Banks could face a significant deterioration in asset quality, profitability and capitalization. The key risk
transmission channels would be the decreasing borrowers' payment capacity and banks' high level of
pre-existing NPLs.
In the beginning of June, the government released a draft plan21 of action aimed at restoring
economic growth and growth of disposable incomes, with measures totaling 7 trillion rubles (of which
Rub 2.2 trillion is designated for implementation of infrastructure projects). The plan includes
measures aimed at supporting households, businesses, regional budgets, and health. Spending on
infrastructure projects totals about 30 percent of the total (with the volume of projects that are already
National Projects totaling about 70 percent of the designated amount). If implemented adequately, such
projects could stimulate investments and employment. Fiscal multipliers tend to increase in magnitude
during downturns, thus providing more stimulus for economic growth. A significant emphasis of the plan
(22.4 percent) is put on supporting recovery and growth of SMEs, including the IT/high-tech sectors
(Figure 44).
While confronting the near-term impact of the coronavirus pandemic is the primary focus of policy
efforts, Russia will eventually need to return to targeted structural reforms. Domestic structural
factors constrain potential growth. While the Government has taken steps to strengthen competition
policy and reshape the role of the state in the economy, many markets still lack healthy competitive
dynamics22. The state presence in Russia’s economy is broad and deep. Just 7 of the 39 markets where
state owned enterprises (SOE) are present can be considered natural monopolies. Product market
regulation in Russia is restrictive to competition mainly through direct state control in the economy. The
government can foster competition and eliminate distortions associated with the presence of the state
in the economy by removing barriers for firms to contest markets where SOEs are present, limiting the
procedural discretion with which companies—SOEs in particular—procure goods and services, and
considering divestiture and privatization in a transparent and competitive process for SOEs in
commercial sectors.
21 Draft plan as of May 31, 2020.
22 Boosting Productivity in Russia: Improving Resource Allocation and Firm Performance, World Bank, 2020.
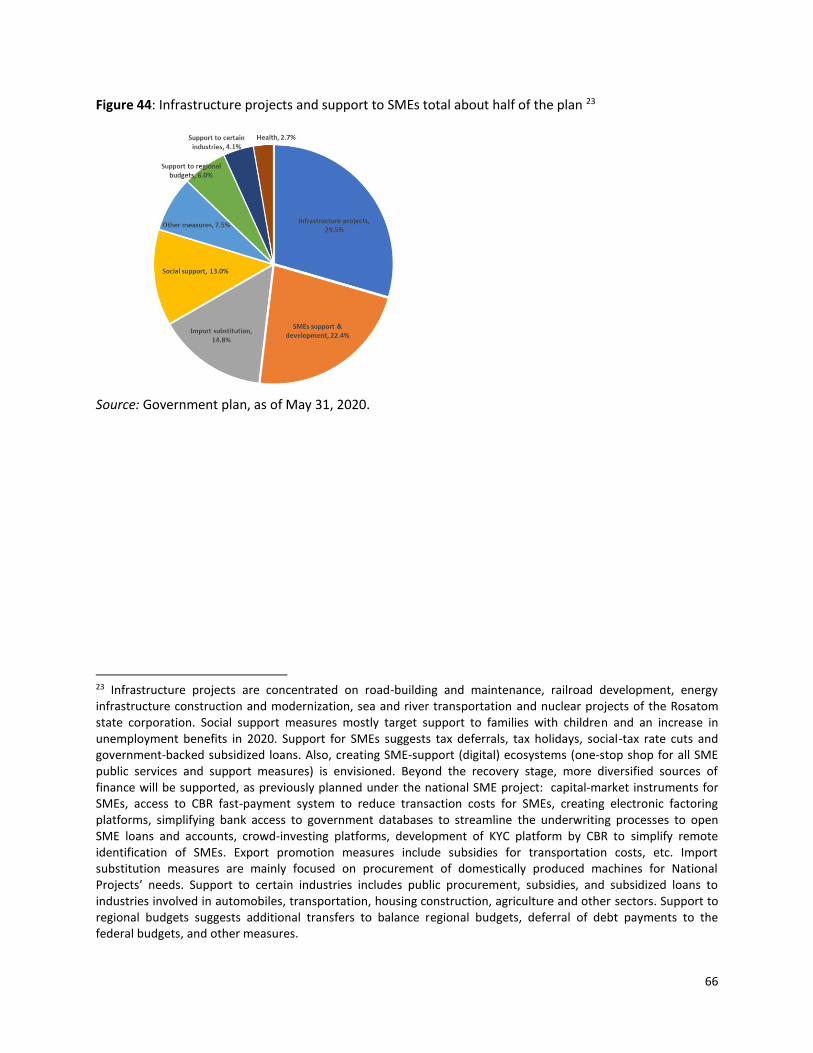
66
Figure 44: Infrastructure projects and support to SMEs total about half of the plan 23
Source: Government plan, as of May 31, 2020.
23 Infrastructure projects are concentrated on road-building and maintenance, railroad development, energy infrastructure construction and modernization, sea and river transportation and nuclear projects of the Rosatom state corporation. Social support measures mostly target support to families with children and an increase in unemployment benefits in 2020. Support for SMEs suggests tax deferrals, tax holidays, social-tax rate cuts and government-backed subsidized loans. Also, creating SME-support (digital) ecosystems (one-stop shop for all SME public services and support measures) is envisioned. Beyond the recovery stage, more diversified sources of finance will be supported, as previously planned under the national SME project: capital-market instruments for SMEs, access to CBR fast-payment system to reduce transaction costs for SMEs, creating electronic factoring platforms, simplifying bank access to government databases to streamline the underwriting processes to open SME loans and accounts, crowd-investing platforms, development of KYC platform by CBR to simplify remote identification of SMEs. Export promotion measures include subsidies for transportation costs, etc. Import substitution measures are mainly focused on procurement of domestically produced machines for National Projects’ needs. Support to certain industries includes public procurement, subsidies, and subsidized loans to industries involved in automobiles, transportation, housing construction, agriculture and other sectors. Support to regional budgets suggests additional transfers to balance regional budgets, deferral of debt payments to the federal budgets, and other measures.
67
PART 3. Education in Russia
Since the early 2000s, the Russian Federation has demonstrated a commitment to international
assessments. The Program for International Student Assessment (PISA), the Trends in International
Mathematics and Science Study (TIMSS), the International Reading Literacy Study (PIRLS), and the
Human Capital Index (HCI) have all indicated that Russia has reached an improved level of performance.
However, further systemic improvements can still be made, such as teaching practices that would foster
21st century skills development, support for students from low socio-economic groups, and the reduction
of disparities in returns to education between Russian regions (Box 5).
Education has been a priority of government investment, as reflected in the national projects. Though
there is room to increase overall spending on education, the main challenge at this time concerns the
effectiveness, efficiency, and equity of public expenditures. National-project goals need to be carefully
crafted and easily measured and identified at the regional and local levels to capture Russia’s diversity.
The implementation of projects in regions often requires close support from the national government
beyond financial support, especially in regions that have administrative capacity challenges. At all levels
of government in a data-driven age, a greater focus on evidence-based decision-making will be helpful,
including research on the impact evaluation of programs such as P5-10024 and WorldSkills.25
The COVID-19 crisis has caused a significant change to traditional education. While some countries are
better prepared than others, students, teachers, and administrators have all suddenly found a need to
drastically alter their mode of teaching and learning as countries enforce social distancing and close
schools. With many students experiencing learning losses, the crisis is also an opportunity to critically
reflect on the education systems and how to rebuild them as more resilient, equitable, and evidence-
driven than they were before. Russia has the potential to take the next step in improving its education
system since it has built a strong foundation.
The Russian higher education system is progressing in line with international developments. It performs
on par with notable higher education systems worldwide, as is visible from its progress in international
university rankings and the increased demand from international students who choose to study in Russia.
At the same time, there are critical systemic challenges and clear areas worthy of improvement,
including: relaxing rigid regulations, developing compelling strategies for internationalization, and
moving away from the concentration of funds on a small number of universities.
The systemic analyses, reforms, and internationalization of education have helped Russia become a
leader in education performance. Nevertheless, Russia could improve by: (i) revising its policies and
improving the accessibility of learning for all students; (ii) decreasing regional disparities in education
quality and opportunity with targeted programs for the vulnerable, and overall improvements of the
curriculum aligned with 21st century learning; (iii) improving the supervision and implementation of
This section was produced by Tigran Shmis, Denis Nikolaev, Maria Ustinova, Polina Zavalina and Suhas Parandekar. 24 https://www.5top100.ru/en/ 25 https://worldskills.ru/
68
federal projects; and (iv) further developing a higher education system that is internationally competitive
and nationally engaged.
1. The importance of education in Russia and long-term positioning for stronger economic growth
Education is a significant contributor to Russia’s human capital. Russia is ranked 34th in the World
Bank’s Human Capital Index, and Russian students are in the top 10 in the world in terms of Harmonized
Learning Outcomes (a measure of their performance in different international assessments of
mathematics, reading and science). Systemic analyses, reforms, and the internationalization of
education have helped Russia become one of the leading countries in education outcomes. Russia both
contributes to, and benefits from, participating in the global education community. The forward-looking
approach for Russia is to use the strong foundation of fundamental skills and build up the skills of the
future.
There remain systemic issues with 21 st -century skills, which are critical for the future labor force. Russia
has been demonstrating the largest negative distance between collaborative problem-solving in the
Programme for International Student Assessment (PISA) 2015 and average PISA performance. That is,
Russia is doing well in terms of basic cognitive competencies, but this not matched by outcomes on skills
deemed critical for the future economy. While the education attainment in Russia is high as
benchmarked internationally, its quality and relevance at vocational and tertiary levels require
attention.26 In Russian regions, there remain disparities and skills mismatches between the supply and
demand sides of the labor market. For example, premiums to education range from 10 percent (Karelia
Republic) to 38 percent (Altai Republic) at the university level, and from 10 percent to 21 percent at the
vocational secondary level. The Russian education system may take a significant step forward in
preparing the professionals and workers with the skill set required for living and working in the 21st
century.
COVID-19-related school closures are estimated to lead to a learning loss of one-third to half of the
Russian school year. If schools remain closed for five months this year, the learning loss of the average
student could reach 16 PISA points in reading (despite current compensatory measures such as online
learning and educational TV broadcasting). These losses are higher than those estimated for OECD and
EU countries. Moreover, there are distributional issues: while students from the top quintile could lose
about 14 PISA points, those in the bottom quintile could lose 18 points. These 18 points translate into a
loss compared with missing one-half of the year’s learning. The five-month closure of Russian schools is
estimated to reduce marginal future earnings by about 2.5 percent per year over a student’s working
life. Longer closures would have a larger impact.
Learning results put Russia among the top global performers
The Russian Federation is the highest-ranked country in the world in terms of 4th Grade reading
achievement. The International Reading Literacy Study (PIRLS) measures primary school reading. In
PIRLS-2016, Russian 10-year-old students demonstrated better results than their peers from 50 other
26 https://wol.iza.org/articles/the-labor-market-in-russia/long
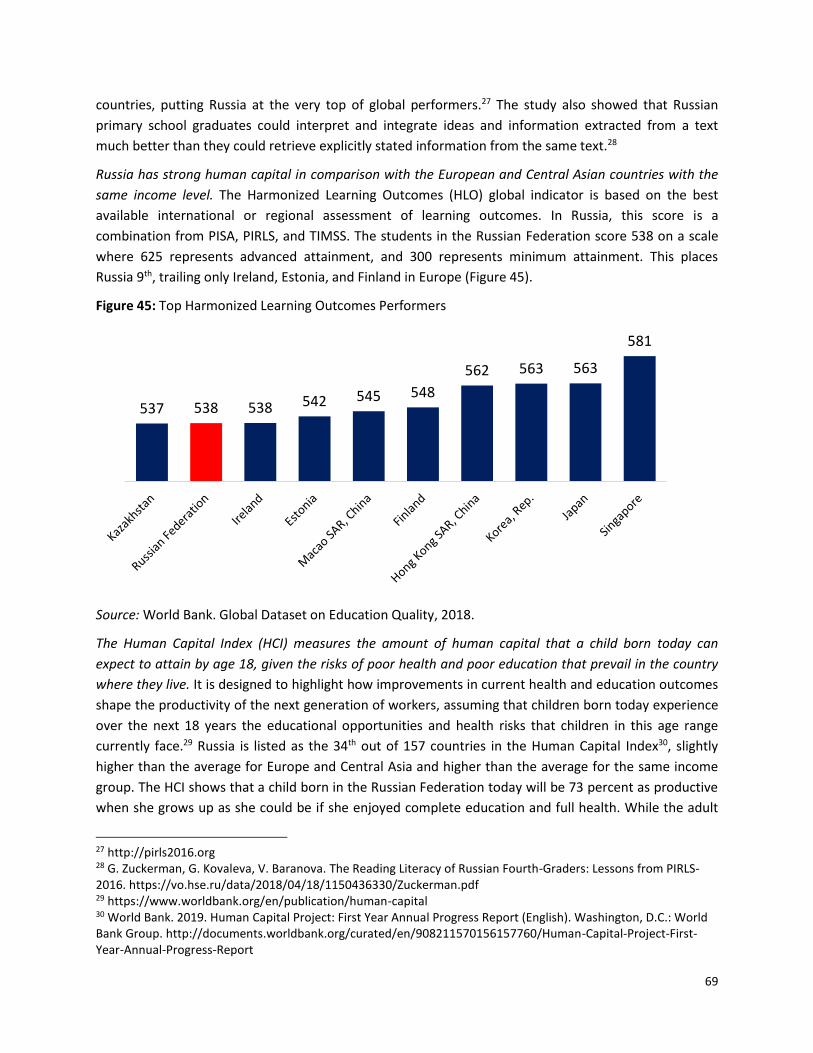
69
countries, putting Russia at the very top of global performers.27 The study also showed that Russian
primary school graduates could interpret and integrate ideas and information extracted from a text
much better than they could retrieve explicitly stated information from the same text.28
Russia has strong human capital in comparison with the European and Central Asian countries with the
same income level. The Harmonized Learning Outcomes (HLO) global indicator is based on the best
available international or regional assessment of learning outcomes. In Russia, this score is a
combination from PISA, PIRLS, and TIMSS. The students in the Russian Federation score 538 on a scale
where 625 represents advanced attainment, and 300 represents minimum attainment. This places
Russia 9th, trailing only Ireland, Estonia, and Finland in Europe (Figure 45).
Figure 45: Top Harmonized Learning Outcomes Performers
Source: World Bank. Global Dataset on Education Quality, 2018.
The Human Capital Index (HCI) measures the amount of human capital that a child born today can
expect to attain by age 18, given the risks of poor health and poor education that prevail in the country
where they live. It is designed to highlight how improvements in current health and education outcomes
shape the productivity of the next generation of workers, assuming that children born today experience
over the next 18 years the educational opportunities and health risks that children in this age range
currently face.29 Russia is listed as the 34th out of 157 countries in the Human Capital Index30, slightly
higher than the average for Europe and Central Asia and higher than the average for the same income
group. The HCI shows that a child born in the Russian Federation today will be 73 percent as productive
when she grows up as she could be if she enjoyed complete education and full health. While the adult
27 http://pirls2016.org 28 G. Zuckerman, G. Kovaleva, V. Baranova. The Reading Literacy of Russian Fourth-Graders: Lessons from PIRLS-2016. https://vo.hse.ru/data/2018/04/18/1150436330/Zuckerman.pdf 29 https://www.worldbank.org/en/publication/human-capital 30 World Bank. 2019. Human Capital Project: First Year Annual Progress Report (English). Washington, D.C.: World Bank Group. http://documents.worldbank.org/curated/en/908211570156157760/Human-Capital-Project-First-Year-Annual-Progress-Report
537 538 538 542 545 548
562 563 563
581
70
survival rate is low for men in Russia, school indicators represented in HLO are in the top performers'
category.
The Russian Federation in recent years has made steady progress in standardized international
assessments such as the Program of International Student Assessment (PISA) and the Trends in
International Mathematics and Science Study (TIMSS). These results demonstrate that Russian students
perform on par in traditional subjects compared to their international peers. Since the 2000s, the
Russian Federation has shown increasingly positive performance in PISA over its seven cycles.31 In 2018,
Russian students’ mathematical literacy reached the OECD average (488/489 points). Russian students
scored slightly below average in science (479/489) and reading (487/489).32
Performance in the TIMSS since 1995 shows fourth- and eighth-grade Russian students achieve
consistently high results in mathematics and science. This puts Russia in the top quarter of the results.33
Analysis by the World Bank of TIMSS and PISA data indicates that Russia has less of an equity34 problem
in education compared to other European countries. The PISA 2015 data shows that Russia has one of
the lowest gaps in the educational achievements between the students from families with lowest ESCS
and highest ESCS. Russia is among the top performers in equity, and exemplifies a rare case of progress
in this area.35Russian system was improving in this category over several rounds of PISA The difference
in PISA 2015 Scores Between Top and Bottom Socioeconomic Quintiles is almost twice less than the EU
average.
The data also shows that the Russian education system provides more equitable opportunity for
students: the study of PISA 2015 revealed that students with good motivation calibration36 from the
bottom quartile able to leapfrog their PISA performance. The students in the lowest socio-economic
quartile, who are well-calibrated, perform as well or very close to those in the highest socio-economic
quartile who are poorly calibrated.
Russia’s performance in international assessments is good, and the recent PISA 2018 report puts Russia
in a category of countries with an increasingly positive performance in PISA over seven rounds. This
continuous effort allowed Russia to build its own robust national assessment system in education and
support the sustainable growth of student outcomes. However, there are categories of performance
that require special attention, and they involve the skills that will define tomorrow’ economy.
Issues with 21st-century skills development in Russia
31 OECD: PISA 2018. Insights and interpretations. https://bit.ly/2ReXuav 32 Краткие результаты исследования PISA-2018. https://bit.ly/2RdDN2N 33 IEA: TIMSS 2015 Results. http://timss2015.org/timss-2015/science/student-achievement/ 34 Education equity in this paper means more equal distribution of educational performance between the socio-economic groups. 35 Shmis, Tigran; Parandekar, Suhas D. 2018. Education Equity in the Russian Federation: Summary Report (English). Washington, D.C.: World Bank Group.http://documents.worldbank.org/curated/en/139291530189329351/Education-Equity-in-the-Russian-Federation-Summary-Report 36 A measure of a student’s ability to recognize motivation in others, or the extent to which the student’s definition of motivation agrees with the standard definition.
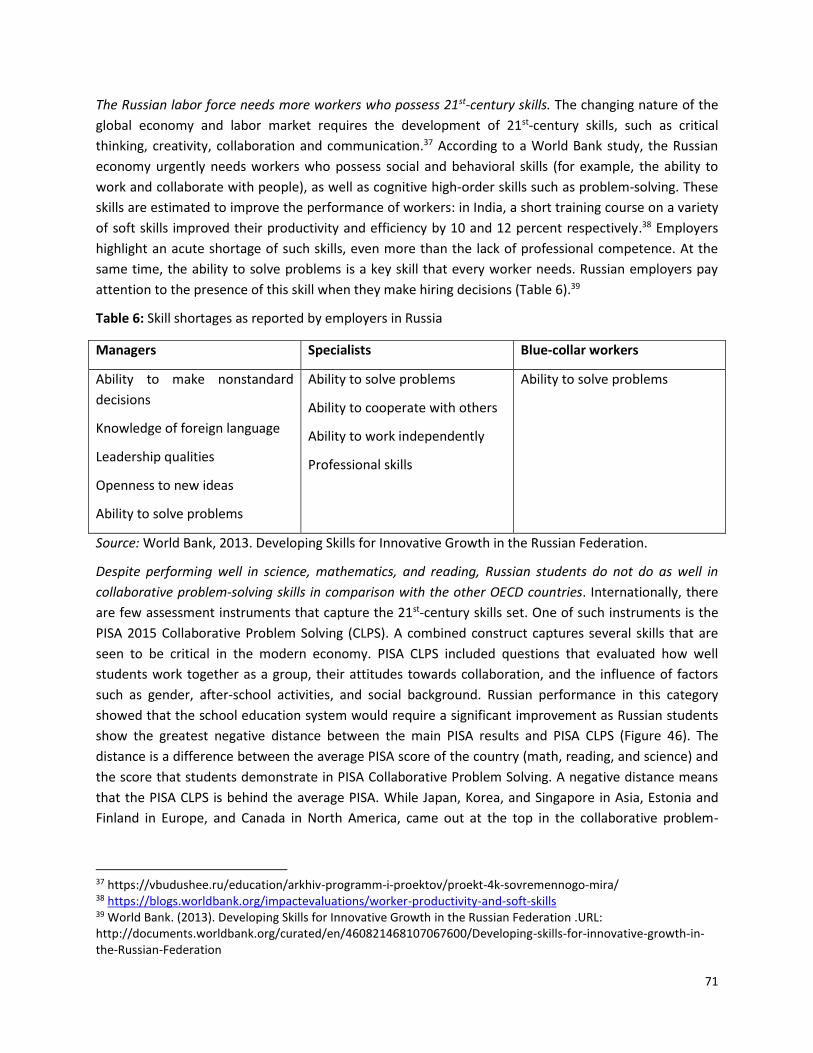
71
The Russian labor force needs more workers who possess 21st-century skills. The changing nature of the
global economy and labor market requires the development of 21st-century skills, such as critical
thinking, creativity, collaboration and communication.37 According to a World Bank study, the Russian
economy urgently needs workers who possess social and behavioral skills (for example, the ability to
work and collaborate with people), as well as cognitive high-order skills such as problem-solving. These
skills are estimated to improve the performance of workers: in India, a short training course on a variety
of soft skills improved their productivity and efficiency by 10 and 12 percent respectively.38 Employers
highlight an acute shortage of such skills, even more than the lack of professional competence. At the
same time, the ability to solve problems is a key skill that every worker needs. Russian employers pay
attention to the presence of this skill when they make hiring decisions (Table 6).39
Table 6: Skill shortages as reported by employers in Russia
Managers Specialists Blue-collar workers
Ability to make nonstandard
decisions
Knowledge of foreign language
Leadership qualities
Openness to new ideas
Ability to solve problems
Ability to solve problems
Ability to cooperate with others
Ability to work independently
Professional skills
Ability to solve problems
Source: World Bank, 2013. Developing Skills for Innovative Growth in the Russian Federation.
Despite performing well in science, mathematics, and reading, Russian students do not do as well in
collaborative problem-solving skills in comparison with the other OECD countries. Internationally, there
are few assessment instruments that capture the 21st-century skills set. One of such instruments is the
PISA 2015 Collaborative Problem Solving (CLPS). A combined construct captures several skills that are
seen to be critical in the modern economy. PISA CLPS included questions that evaluated how well
students work together as a group, their attitudes towards collaboration, and the influence of factors
such as gender, after-school activities, and social background. Russian performance in this category
showed that the school education system would require a significant improvement as Russian students
show the greatest negative distance between the main PISA results and PISA CLPS (Figure 46). The
distance is a difference between the average PISA score of the country (math, reading, and science) and
the score that students demonstrate in PISA Collaborative Problem Solving. A negative distance means
that the PISA CLPS is behind the average PISA. While Japan, Korea, and Singapore in Asia, Estonia and
Finland in Europe, and Canada in North America, came out at the top in the collaborative problem-
37 https://vbudushee.ru/education/arkhiv-programm-i-proektov/proekt-4k-sovremennogo-mira/ 38 https://blogs.worldbank.org/impactevaluations/worker-productivity-and-soft-skills 39 World Bank. (2013). Developing Skills for Innovative Growth in the Russian Federation .URL: http://documents.worldbank.org/curated/en/460821468107067600/Developing-skills-for-innovative-growth-in-the-Russian-Federation
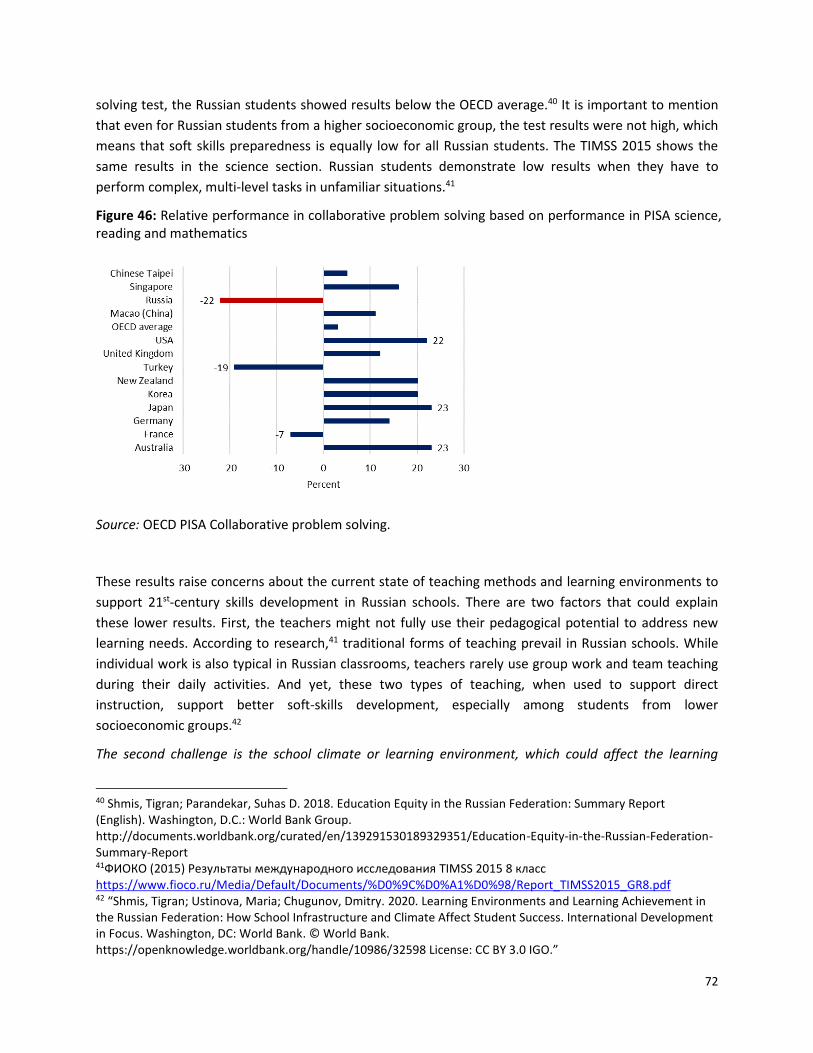
72
solving test, the Russian students showed results below the OECD average.40 It is important to mention
that even for Russian students from a higher socioeconomic group, the test results were not high, which
means that soft skills preparedness is equally low for all Russian students. The TIMSS 2015 shows the
same results in the science section. Russian students demonstrate low results when they have to
perform complex, multi-level tasks in unfamiliar situations.41
Figure 46: Relative performance in collaborative problem solving based on performance in PISA science, reading and mathematics
Source: OECD PISA Collaborative problem solving.
These results raise concerns about the current state of teaching methods and learning environments to
support 21st-century skills development in Russian schools. There are two factors that could explain
these lower results. First, the teachers might not fully use their pedagogical potential to address new
learning needs. According to research,41 traditional forms of teaching prevail in Russian schools. While
individual work is also typical in Russian classrooms, teachers rarely use group work and team teaching
during their daily activities. And yet, these two types of teaching, when used to support direct
instruction, support better soft-skills development, especially among students from lower
socioeconomic groups.42
The second challenge is the school climate or learning environment, which could affect the learning
40 Shmis, Tigran; Parandekar, Suhas D. 2018. Education Equity in the Russian Federation: Summary Report (English). Washington, D.C.: World Bank Group. http://documents.worldbank.org/curated/en/139291530189329351/Education-Equity-in-the-Russian-Federation-Summary-Report 41ФИОКО (2015) Результаты международного исследования TIMSS 2015 8 класс https://www.fioco.ru/Media/Default/Documents/%D0%9C%D0%A1%D0%98/Report_TIMSS2015_GR8.pdf 42 “Shmis, Tigran; Ustinova, Maria; Chugunov, Dmitry. 2020. Learning Environments and Learning Achievement in the Russian Federation: How School Infrastructure and Climate Affect Student Success. International Development in Focus. Washington, DC: World Bank. © World Bank. https://openknowledge.worldbank.org/handle/10986/32598 License: CC BY 3.0 IGO.”
73
outcomes and soft-skills development related to communication and collaboration. Research like PISA
indicates a prevalence of bullying and anxiety among Russian students. According to PISA 2018, the
sense of belonging to a school in Russia was one of the lowest among PISA-participating countries and
economies (-0.39 PISA Index, rank 71/75). Russian students also believe less in their ability to perform,
especially facing adversity, compared to their peers from the other PISA-participating countries (-0.3
PISA Index, rank 75/77). The percentage of Russian students who reported being bullied at least a few
times a month (includes any type of bullying act) is one of the highest in the world (36.6 percent, rank
7/78).43
Inequity and regional disparities in Russia
According to international assessments, Russian students show the lowest achievement gap between
students from the highest and lowest socioeconomic groups. The comparison of achievement by
students from the lowest socioeconomic quintile with those the highest quintile in the OECD and
European Union countries showed a difference of nearly 100 PISA points. This indicates that students
who came from well-off families with high levels of family wealth, parental education, and high-status
occupation tended to score 100 PISA points higher for science, mathematics, and reading. That 100-
point difference is equivalent to one standard deviation or, according to the OECD, about three years of
instruction. A gap is present in Russian students as well, but it constitutes almost half of the European
average and ranks Russia ahead of all other European PISA countries in terms of the smallest disparity
gap. Similarly, the share of poor performers from the poorest quintile in Russia was 29.1 percent. This
proportion in Russia is lower compared to other countries. For instance, the share of poor performers
from the poorest quintile in Brazil and Finland in PISA 2015 mathematics is 90 and 60.2 percent,
respectively.44 According to PISA 2018, socioeconomic status explains 13% of the variance in reading
performance in the Russian Federation (OECD average: 12 percent). The average difference between
advantaged and disadvantaged students in reading is 96 points, compared to an average of 89 in OECD
countries. However, 12 percent of disadvantaged students are academically resilient (OECD average: 11
percent).45
While regional differences in traditional-subject performance are low, the regional disparities in
collaborative problem-solving skills appear worrying. PISA results indicate differences in performance in
the collaborative problem-solving skills component among Russian regions. Some regions showed very
low results; for example, the North Caucasus would be similar to the performance of Thailand or
Mexico. It could be explained that the academic performance of Russian students differentiates based
on the family’s background and is correlated with the type and size of settlements, making schools in big
43 OECD. Russian Federation. Student Performance. 2018. https://gpseducation.oecd.org/CountryProfile?primaryCountry=RUS&treshold=10&topic=PI 44 Shmis, Tigran; Parandekar, Suhas D. 2018. Education Equity in the Russian Federation: Summary Report (English). Washington, D.C.: World Bank Group. http://documents.worldbank.org/curated/en/139291530189329351/Education-Equity-in-the-Russian-Federation-Summary-Report 45 OECD. Russian Federation. PISA-2018 student’s performance. https://gpseducation.oecd.org/CountryProfile?primaryCountry=RUS&treshold=10&topic=PI
74
centers more attractive and successful.46
There is no systematic policy approach to support weaker institutions of general education and students
from the lowest socioeconomic groups in the achievement of better learning outcomes. The decisions
on providing financial or in-kind support are usually focused among the best-performing institutions or
targeting the students with the highest learning achievements.
Current studies show that the introduction of group work and team teaching may improve the learning
outcomes of students, especially from the lowest socioeconomic groups. A new World Bank study on
learning environments in the Russian Federation suggests that innovative teaching styles positively
affect student learning outcomes. Team teaching, in which a team of teachers works with a large group
of students, and group work, which is the arrangement of students into smaller groups for discussions
and joint activities, are positively correlated with the learning outcomes of students, especially from the
lower socio-economic group. The use of these two approaches may yield improvements equivalent to
almost one additional year of learning.47
Overall, Russia’s commitment to international assessments and building of a coherent national
assessment system has helped advance student learning. With Russia’s accumulated knowledge in
international assessments, it is increasingly becoming a center of excellence and expertise in the area of
student assessment and education reform. Russia supports an Education Aid for Development (READ)
program that helps countries improve their assessment systems while at the same time builds Russia’s
capacity in assessment and international expertise. This way, Russian experts learn from the actual
implementation of reforms in other countries and develop Russia’s capacity through the delivery of
international aid in education (http://www.readprogram.org).
2. Better and smarter education has been a focus of government policies
The Russian Federation spends nearly 3.6 percent of its GDP on education.48 Within the education
sector, spending on general education and vocational education grew from 2015-2020, while spending
for higher education declined.49
Government commitment towards education is also demonstrated by looking at the implementation of
strategic national programs announced in December 2019. These strategic programs are of high
importance and define the national policies announce by the president. All regions implement these
46 Zakharov et all. Social and Territorial Inequity of Educational Outcomes in Russia. What Do PISA Findings Tell Us? 47 “Shmis, Ustinova, Chugunov (2020) Learning Environments and Learning Achievement in the Russian Federation: How School Infrastructure and Climate Affect Student Success. International Development in Focus. Washington, DC: World Bank. © World Bank. https://openknowledge.worldbank.org/handle/10986/32598 License: CC BY 3.0 IGO.” 48 Russian Statistical Yearbook 2019 from Rosstat, available at https://www.gks.ru/storage/mediabank/Ejegodnik_2019.pdf, pg. 187 49 In the federal budget for 2020, 127 billion rubles are allocated to general education (including pre-school, primary and secondary), for more than 23 million students. General education spending increased from Rub 59 billion in 2015 (in constant 2020 rubles using Rosstat GDP deflator), an increase of 115 percent. The relevant figures for other levels of education are (i) vocational education Rub 37 billion; nearly 3 million students; 231% spending growth; (ii) higher education: Rub 599 billion; 4 million students; 8% spending drop.
75
programs with significant level of accountability. Education received a substantive allocation of 785
billion Rubles (about US$ 12 bln.) for federal projects from 2018-2024. The largest of the educational
programs are (i) Modern School (Rub295 billion); (ii) Young Professionals in Vocational Education
(Rub156 billion); (iii) Export of Education (Rub108 billion); (iv) Success for Every Child (Rub81 billion);
and Digital Learning Environments (Rub80 billion). Some of these programs have been analyzed,
including Modern Schools and Digital Learning Environments,53 Success for Every Child50 and the
WorldSkills part of Young Professionals in Vocational Education.51
These projects represent the government’s effort to improve the critical elements of the education
system in Russia. The Modern School program aims to alleviate the double and sometimes triple shifts in
Russian schools (when children attend schools by shifts, that is, morning and afternoon) by expanding
the number of schools and school places in Russia. The project was also designed to create new types of
learning environments and infrastructure solutions across diverse Russian regions and develop
guidelines for modern Russian schools. Investments in school and the learning environment positively
impact student success by improvement of their positive attitude towards learning and achieving better
education outcomes.53
Success for Every Child has a number of components related to extra-curricular activities, which include
both traditional and non-traditional activities. There is causal evidence that relates participation in
extra-curricular activities to cognitive achievement as measured by a student’s class grade.57 One
element of increasing importance as an extra-curricular activity is coding as a means to acquire
computational thinking skills. Increasingly, children need to learn to code, not to work as programmers,
but for the same reasons that we want them to learn language and mathematics – to be literate citizens
of the 21st century.52
The WorldSkills program seeks to make vocational careers attractive to young people through well-
publicized regional, national, and global competitions. Recent research demonstrated that students in
Russia more often choose vocational track at the end of lower secondary education, which supports
investment in the WorldSkills program.53
Regional disparities in Russia are one of the most important issues to address for the country’s future
success and sustained improvement of education outcomes. There remain regional disparities and skills
mismatches between the supply and demand sides of the labor market. For example, premiums to
education range from 10 percent (Karelia Republic) to 38 percent (Altai Republic) at the university level,
and from 10 to 21 percent at the vocational secondary level. To better devise policies for the regions,
the regions were ranked according to labor supply quantity and quality (percentage of the labor force
with higher education and the average Unified State Examination [EGE] score) and labor demand
quantity (measured by the share of regional income derived from relatively labor-intensive industries,
50 http://documents.worldbank.org/curated/en/341991561976813788/Russian-Federation-Doing-Extra-Curricular-Education-Blending-Traditional-and-Digital-Activities-for-Equitable-Learning; 51 https://www.kp.ru/daily/27085/4157447/; 52 The World Bank’s book “Coding for Children: An Essential 21st Century Literacy” is available in both English and Russian languages at https://elibrary.worldbank.org/doi/abs/10.1596/31528. 53 http://documents.worldbank.org/curated/en/947511544685131252/Education-Equity-in-the-Russian-Federation-Summary-Report
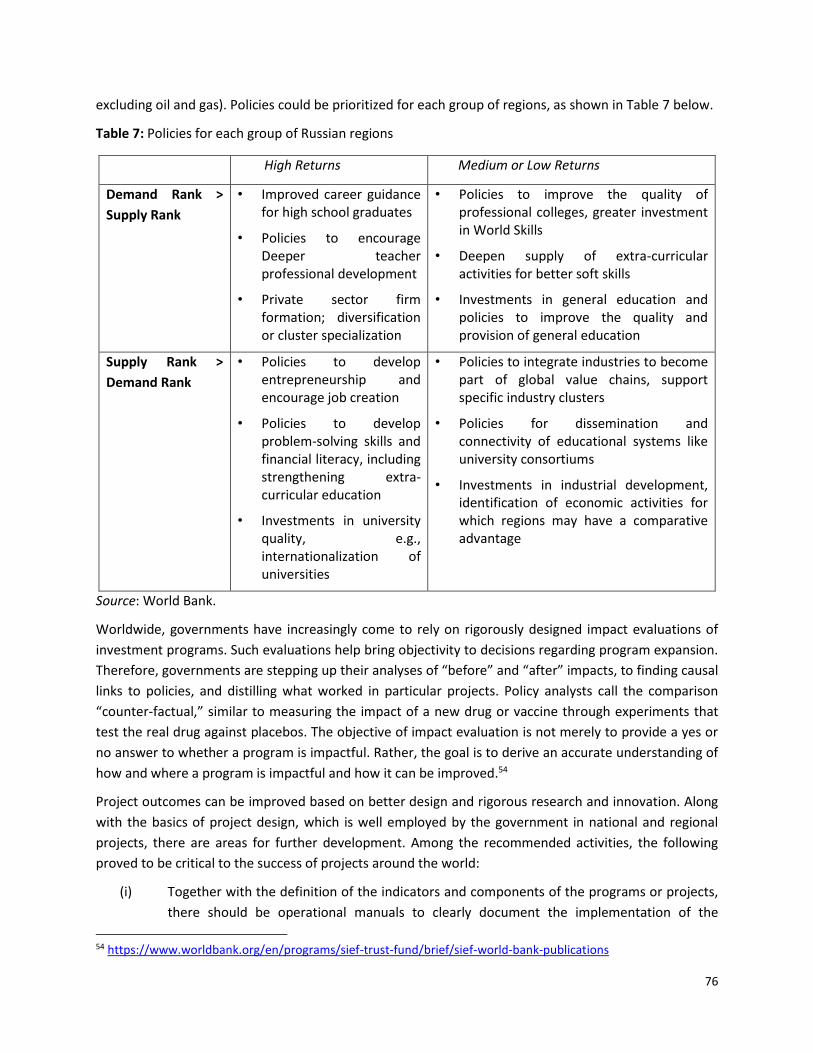
76
excluding oil and gas). Policies could be prioritized for each group of regions, as shown in Table 7 below.
Table 7: Policies for each group of Russian regions
High Returns Medium or Low Returns
Demand Rank >
Supply Rank
• Improved career guidance for high school graduates
• Policies to encourage Deeper teacher professional development
• Private sector firm formation; diversification or cluster specialization
• Policies to improve the quality of professional colleges, greater investment in World Skills
• Deepen supply of extra-curricular activities for better soft skills
• Investments in general education and policies to improve the quality and provision of general education
Supply Rank >
Demand Rank
• Policies to develop entrepreneurship and encourage job creation
• Policies to develop problem-solving skills and financial literacy, including strengthening extra-curricular education
• Investments in university quality, e.g., internationalization of universities
• Policies to integrate industries to become part of global value chains, support specific industry clusters
• Policies for dissemination and connectivity of educational systems like university consortiums
• Investments in industrial development, identification of economic activities for which regions may have a comparative advantage
Source: World Bank.
Worldwide, governments have increasingly come to rely on rigorously designed impact evaluations of
investment programs. Such evaluations help bring objectivity to decisions regarding program expansion.
Therefore, governments are stepping up their analyses of “before” and “after” impacts, to finding causal
links to policies, and distilling what worked in particular projects. Policy analysts call the comparison
“counter-factual,” similar to measuring the impact of a new drug or vaccine through experiments that
test the real drug against placebos. The objective of impact evaluation is not merely to provide a yes or
no answer to whether a program is impactful. Rather, the goal is to derive an accurate understanding of
how and where a program is impactful and how it can be improved.54
Project outcomes can be improved based on better design and rigorous research and innovation. Along
with the basics of project design, which is well employed by the government in national and regional
projects, there are areas for further development. Among the recommended activities, the following
proved to be critical to the success of projects around the world:
(i) Together with the definition of the indicators and components of the programs or projects,
there should be operational manuals to clearly document the implementation of the
54 https://www.worldbank.org/en/programs/sief-trust-fund/brief/sief-world-bank-publications
77
program;
(ii) A policy research program with the involvement of experts from leading universities should
be instituted so that learning from implementation is maximized and corrective actions are
taken when required; if possible, the research programs should include scientifically valid
impact evaluation as part of the design;
(iii) Citizen engagement in a time of “big data” and government-wide transparency initiatives
will be very useful to support implementation. Portals like https://bus.gov.ru/ provide
opportunities for citizens to provide feedback to providers, but the circle needs to be
completed with feedback to citizens about corrective action taken by providers;
(iv) The private sector role may be leveraged in the project guidelines across all the projects.
While the overall design of a national program does provide a role for the private sector,
there is room for the private sector role to be strengthened mostly as a competitive boost
to all providers, whether from the public or private sectors.
Overall, the existing set of federally funded education projects represents a bold move to change the
approach to funding distribution for a more focused work of finances. It could also be improved with
lessons from international best practice.
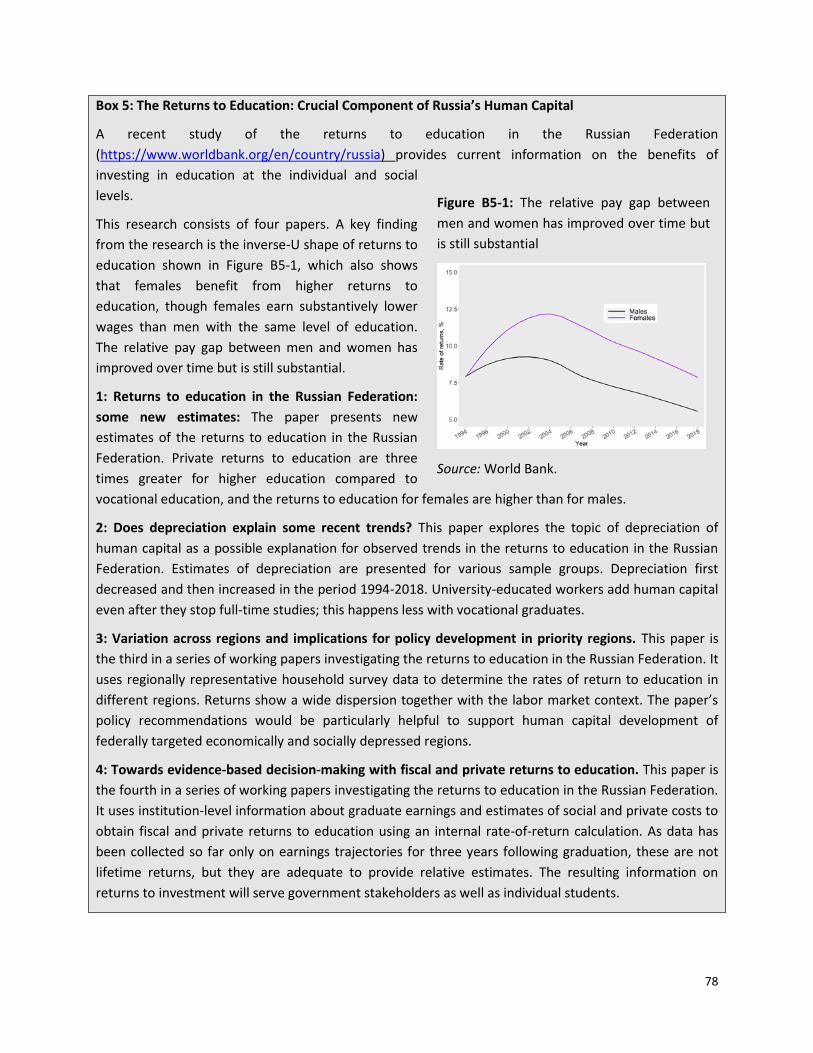
78
Box 5: The Returns to Education: Crucial Component of Russia’s Human Capital
A recent study of the returns to education in the Russian Federation
(https://www.worldbank.org/en/country/russia) provides current information on the benefits of
investing in education at the individual and social
levels.
This research consists of four papers. A key finding
from the research is the inverse-U shape of returns to
education shown in Figure B5-1, which also shows
that females benefit from higher returns to
education, though females earn substantively lower
wages than men with the same level of education.
The relative pay gap between men and women has
improved over time but is still substantial.
1: Returns to education in the Russian Federation:
some new estimates: The paper presents new
estimates of the returns to education in the Russian
Federation. Private returns to education are three
times greater for higher education compared to
vocational education, and the returns to education for females are higher than for males.
2: Does depreciation explain some recent trends? This paper explores the topic of depreciation of
human capital as a possible explanation for observed trends in the returns to education in the Russian
Federation. Estimates of depreciation are presented for various sample groups. Depreciation first
decreased and then increased in the period 1994-2018. University-educated workers add human capital
even after they stop full-time studies; this happens less with vocational graduates.
3: Variation across regions and implications for policy development in priority regions. This paper is
the third in a series of working papers investigating the returns to education in the Russian Federation. It
uses regionally representative household survey data to determine the rates of return to education in
different regions. Returns show a wide dispersion together with the labor market context. The paper’s
policy recommendations would be particularly helpful to support human capital development of
federally targeted economically and socially depressed regions.
4: Towards evidence-based decision-making with fiscal and private returns to education. This paper is
the fourth in a series of working papers investigating the returns to education in the Russian Federation.
It uses institution-level information about graduate earnings and estimates of social and private costs to
obtain fiscal and private returns to education using an internal rate-of-return calculation. As data has
been collected so far only on earnings trajectories for three years following graduation, these are not
lifetime returns, but they are adequate to provide relative estimates. The resulting information on
returns to investment will serve government stakeholders as well as individual students.
Figure B5-1: The relative pay gap between
men and women has improved over time but
is still substantial
Source: World Bank.
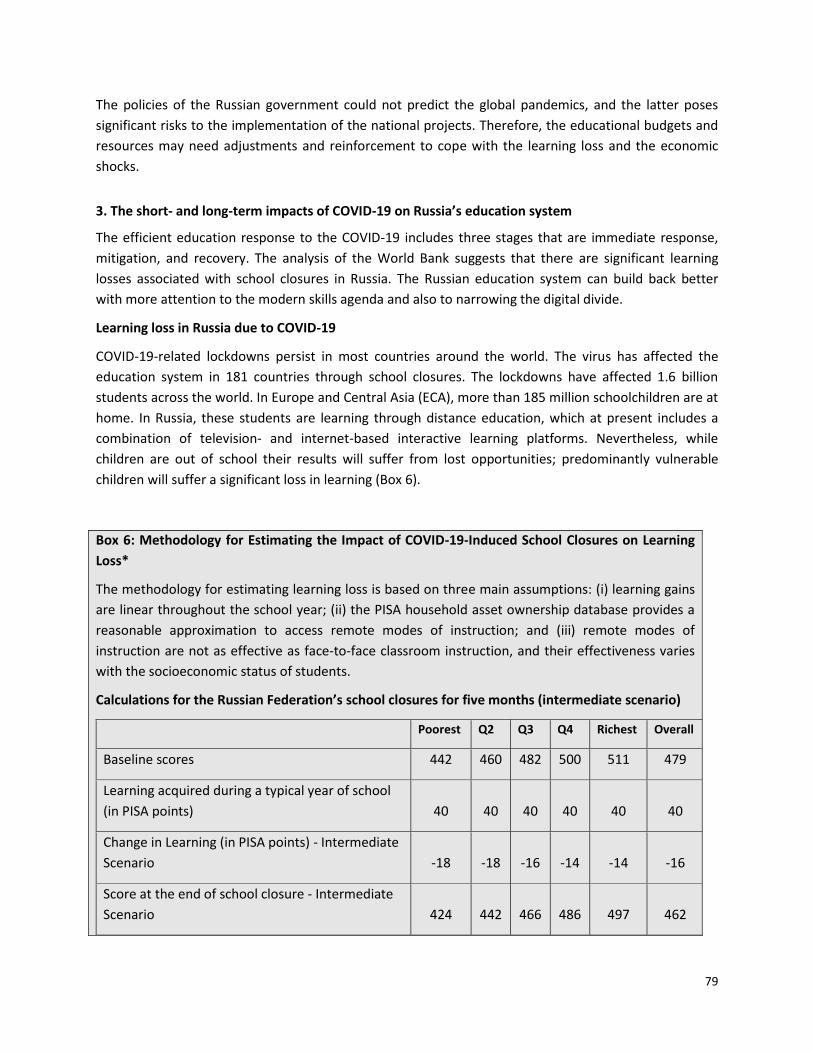
79
The policies of the Russian government could not predict the global pandemics, and the latter poses
significant risks to the implementation of the national projects. Therefore, the educational budgets and
resources may need adjustments and reinforcement to cope with the learning loss and the economic
shocks.
3. The short- and long-term impacts of COVID-19 on Russia’s education system
The efficient education response to the COVID-19 includes three stages that are immediate response,
mitigation, and recovery. The analysis of the World Bank suggests that there are significant learning
losses associated with school closures in Russia. The Russian education system can build back better
with more attention to the modern skills agenda and also to narrowing the digital divide.
Learning loss in Russia due to COVID-19
COVID-19-related lockdowns persist in most countries around the world. The virus has affected the
education system in 181 countries through school closures. The lockdowns have affected 1.6 billion
students across the world. In Europe and Central Asia (ECA), more than 185 million schoolchildren are at
home. In Russia, these students are learning through distance education, which at present includes a
combination of television- and internet-based interactive learning platforms. Nevertheless, while
children are out of school their results will suffer from lost opportunities; predominantly vulnerable
children will suffer a significant loss in learning (Box 6).
Box 6: Methodology for Estimating the Impact of COVID-19-Induced School Closures on Learning
Loss*
The methodology for estimating learning loss is based on three main assumptions: (i) learning gains
are linear throughout the school year; (ii) the PISA household asset ownership database provides a
reasonable approximation to access remote modes of instruction; and (iii) remote modes of
instruction are not as effective as face-to-face classroom instruction, and their effectiveness varies
with the socioeconomic status of students.
Calculations for the Russian Federation’s school closures for five months (intermediate scenario)
Poorest Q2 Q3 Q4 Richest Overall
Baseline scores 442 460 482 500 511 479
Learning acquired during a typical year of school
(in PISA points) 40 40 40 40 40 40
Change in Learning (in PISA points) - Intermediate
Scenario -18 -18 -16 -14 -14 -16
Score at the end of school closure - Intermediate
Scenario 424 442 466 486 497 462
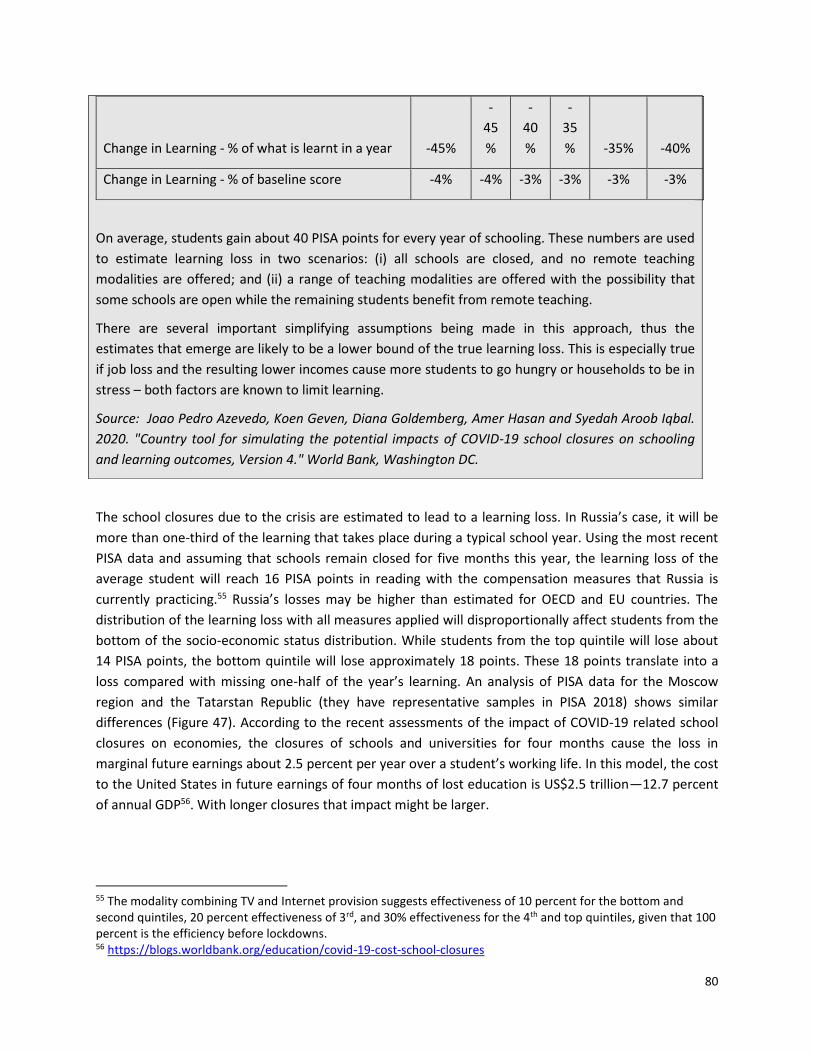
80
The school closures due to the crisis are estimated to lead to a learning loss. In Russia’s case, it will be
more than one-third of the learning that takes place during a typical school year. Using the most recent
PISA data and assuming that schools remain closed for five months this year, the learning loss of the
average student will reach 16 PISA points in reading with the compensation measures that Russia is
currently practicing.55 Russia’s losses may be higher than estimated for OECD and EU countries. The
distribution of the learning loss with all measures applied will disproportionally affect students from the
bottom of the socio-economic status distribution. While students from the top quintile will lose about
14 PISA points, the bottom quintile will lose approximately 18 points. These 18 points translate into a
loss compared with missing one-half of the year’s learning. An analysis of PISA data for the Moscow
region and the Tatarstan Republic (they have representative samples in PISA 2018) shows similar
differences (Figure 47). According to the recent assessments of the impact of COVID-19 related school
closures on economies, the closures of schools and universities for four months cause the loss in
marginal future earnings about 2.5 percent per year over a student’s working life. In this model, the cost
to the United States in future earnings of four months of lost education is US$2.5 trillion—12.7 percent
of annual GDP56. With longer closures that impact might be larger.
55 The modality combining TV and Internet provision suggests effectiveness of 10 percent for the bottom and second quintiles, 20 percent effectiveness of 3rd, and 30% effectiveness for the 4th and top quintiles, given that 100 percent is the efficiency before lockdowns. 56 https://blogs.worldbank.org/education/covid-19-cost-school-closures
Change in Learning - % of what is learnt in a year -45%
-
45
%
-
40
%
-
35
% -35% -40%
Change in Learning - % of baseline score -4% -4% -3% -3% -3% -3%
On average, students gain about 40 PISA points for every year of schooling. These numbers are used
to estimate learning loss in two scenarios: (i) all schools are closed, and no remote teaching
modalities are offered; and (ii) a range of teaching modalities are offered with the possibility that
some schools are open while the remaining students benefit from remote teaching.
There are several important simplifying assumptions being made in this approach, thus the
estimates that emerge are likely to be a lower bound of the true learning loss. This is especially true
if job loss and the resulting lower incomes cause more students to go hungry or households to be in
stress – both factors are known to limit learning.
Source: Joao Pedro Azevedo, Koen Geven, Diana Goldemberg, Amer Hasan and Syedah Aroob Iqbal.
2020. "Country tool for simulating the potential impacts of COVID-19 school closures on schooling
and learning outcomes, Version 4." World Bank, Washington DC.
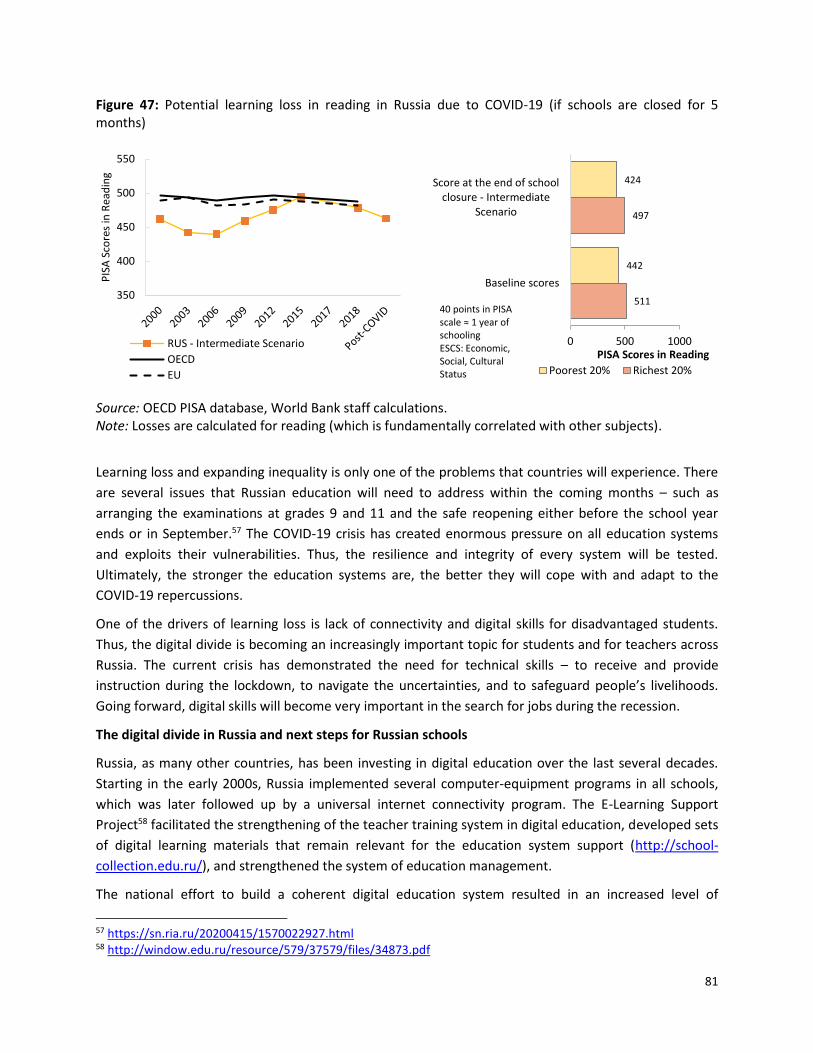
81
Figure 47: Potential learning loss in reading in Russia due to COVID-19 (if schools are closed for 5 months)
Source: OECD PISA database, World Bank staff calculations. Note: Losses are calculated for reading (which is fundamentally correlated with other subjects).
Learning loss and expanding inequality is only one of the problems that countries will experience. There
are several issues that Russian education will need to address within the coming months – such as
arranging the examinations at grades 9 and 11 and the safe reopening either before the school year
ends or in September.57 The COVID-19 crisis has created enormous pressure on all education systems
and exploits their vulnerabilities. Thus, the resilience and integrity of every system will be tested.
Ultimately, the stronger the education systems are, the better they will cope with and adapt to the
COVID-19 repercussions.
One of the drivers of learning loss is lack of connectivity and digital skills for disadvantaged students.
Thus, the digital divide is becoming an increasingly important topic for students and for teachers across
Russia. The current crisis has demonstrated the need for technical skills – to receive and provide
instruction during the lockdown, to navigate the uncertainties, and to safeguard people’s livelihoods.
Going forward, digital skills will become very important in the search for jobs during the recession.
The digital divide in Russia and next steps for Russian schools
Russia, as many other countries, has been investing in digital education over the last several decades.
Starting in the early 2000s, Russia implemented several computer-equipment programs in all schools,
which was later followed up by a universal internet connectivity program. The E-Learning Support
Project58 facilitated the strengthening of the teacher training system in digital education, developed sets
of digital learning materials that remain relevant for the education system support (http://school-
collection.edu.ru/), and strengthened the system of education management.
The national effort to build a coherent digital education system resulted in an increased level of
57 https://sn.ria.ru/20200415/1570022927.html 58 http://window.edu.ru/resource/579/37579/files/34873.pdf
350
400
450
500
550
PIS
A S
core
s in
Rea
din
g
RUS - Intermediate Scenario
OECD
EU
511
497
442
424
0 500 1000
Baseline scores
Score at the end of schoolclosure - Intermediate
Scenario
PISA Scores in Reading
Poorest 20% Richest 20%
40 points in PISA scale ≈ 1 year of schoolingESCS: Economic, Social, Cultural Status
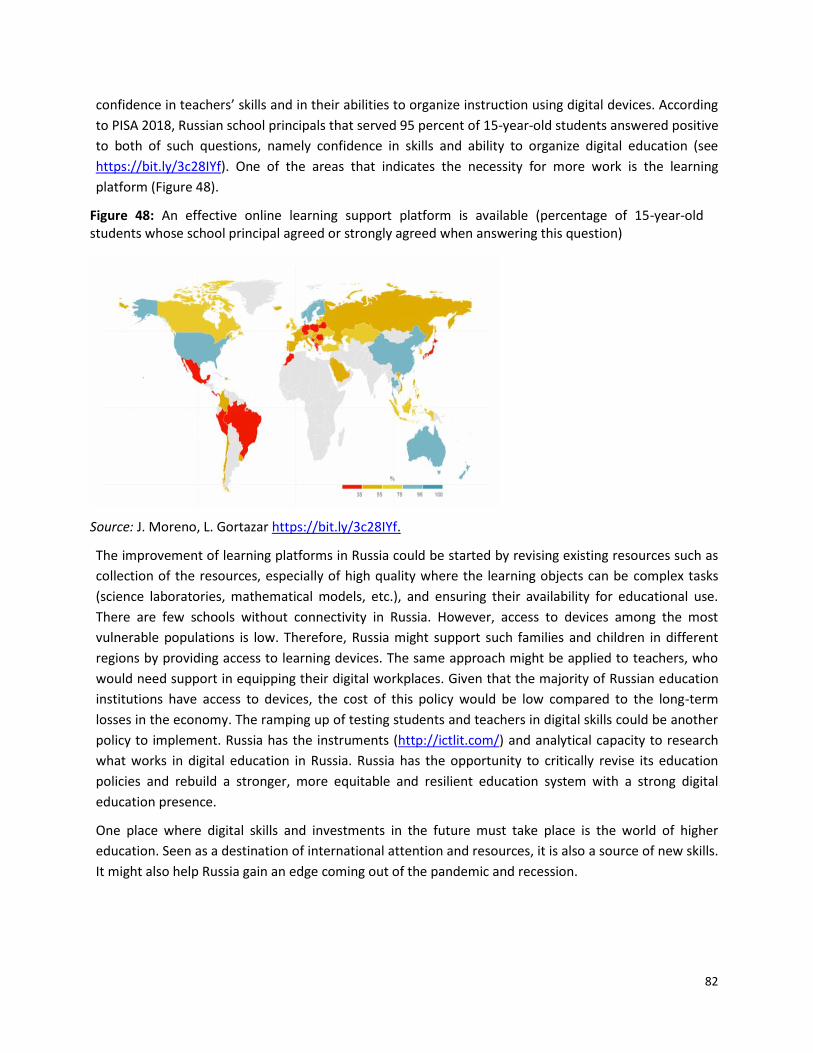
82
confidence in teachers’ skills and in their abilities to organize instruction using digital devices. According
to PISA 2018, Russian school principals that served 95 percent of 15-year-old students answered positive
to both of such questions, namely confidence in skills and ability to organize digital education (see
https://bit.ly/3c28IYf). One of the areas that indicates the necessity for more work is the learning
platform (Figure 48).
Figure 48: An effective online learning support platform is available (percentage of 15-year-old students whose school principal agreed or strongly agreed when answering this question)
Source: J. Moreno, L. Gortazar https://bit.ly/3c28IYf.
The improvement of learning platforms in Russia could be started by revising existing resources such as
collection of the resources, especially of high quality where the learning objects can be complex tasks
(science laboratories, mathematical models, etc.), and ensuring their availability for educational use.
There are few schools without connectivity in Russia. However, access to devices among the most
vulnerable populations is low. Therefore, Russia might support such families and children in different
regions by providing access to learning devices. The same approach might be applied to teachers, who
would need support in equipping their digital workplaces. Given that the majority of Russian education
institutions have access to devices, the cost of this policy would be low compared to the long-term
losses in the economy. The ramping up of testing students and teachers in digital skills could be another
policy to implement. Russia has the instruments (http://ictlit.com/) and analytical capacity to research
what works in digital education in Russia. Russia has the opportunity to critically revise its education
policies and rebuild a stronger, more equitable and resilient education system with a strong digital
education presence.
One place where digital skills and investments in the future must take place is the world of higher
education. Seen as a destination of international attention and resources, it is also a source of new skills.
It might also help Russia gain an edge coming out of the pandemic and recession.
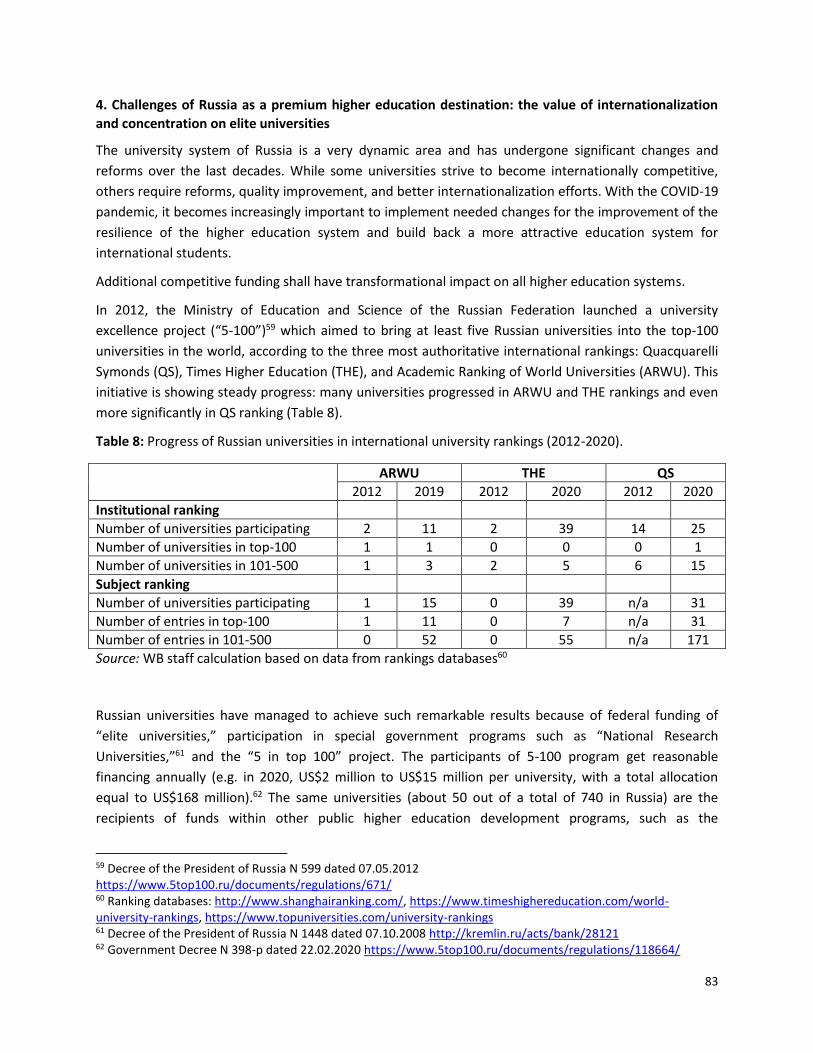
83
4. Challenges of Russia as a premium higher education destination: the value of internationalization
and concentration on elite universities
The university system of Russia is a very dynamic area and has undergone significant changes and
reforms over the last decades. While some universities strive to become internationally competitive,
others require reforms, quality improvement, and better internationalization efforts. With the COVID-19
pandemic, it becomes increasingly important to implement needed changes for the improvement of the
resilience of the higher education system and build back a more attractive education system for
international students.
Additional competitive funding shall have transformational impact on all higher education systems.
In 2012, the Ministry of Education and Science of the Russian Federation launched a university
excellence project (“5-100”)59 which aimed to bring at least five Russian universities into the top-100
universities in the world, according to the three most authoritative international rankings: Quacquarelli
Symonds (QS), Times Higher Education (THE), and Academic Ranking of World Universities (ARWU). This
initiative is showing steady progress: many universities progressed in ARWU and THE rankings and even
more significantly in QS ranking (Table 8).
Table 8: Progress of Russian universities in international university rankings (2012-2020).
ARWU THE QS
2012 2019 2012 2020 2012 2020
Institutional ranking
Number of universities participating 2 11 2 39 14 25
Number of universities in top-100 1 1 0 0 0 1
Number of universities in 101-500 1 3 2 5 6 15
Subject ranking
Number of universities participating 1 15 0 39 n/a 31
Number of entries in top-100 1 11 0 7 n/a 31
Number of entries in 101-500 0 52 0 55 n/a 171
Source: WB staff calculation based on data from rankings databases60
Russian universities have managed to achieve such remarkable results because of federal funding of
“elite universities,” participation in special government programs such as “National Research
Universities,”61 and the “5 in top 100” project. The participants of 5-100 program get reasonable
financing annually (e.g. in 2020, US$2 million to US$15 million per university, with a total allocation
equal to US$168 million).62 The same universities (about 50 out of a total of 740 in Russia) are the
recipients of funds within other public higher education development programs, such as the
59 Decree of the President of Russia N 599 dated 07.05.2012 https://www.5top100.ru/documents/regulations/671/ 60 Ranking databases: http://www.shanghairanking.com/, https://www.timeshighereducation.com/world-university-rankings, https://www.topuniversities.com/university-rankings 61 Decree of the President of Russia N 1448 dated 07.10.2008 http://kremlin.ru/acts/bank/28121 62 Government Decree N 398-p dated 22.02.2020 https://www.5top100.ru/documents/regulations/118664/
84
construction of student campuses (financed by the federal project “Export of Education” 63); the creation
of Scientific Educational Centers (financed by the national project “Science”64); and other government
initiatives.
Even though the funds are distributed on a competitive basis, which seems to be a reasonable support
mechanism, unfortunately, the selection criteria, which are merit-based, are favorable to the best ones,
which makes these universities a kind of “elite club,” similar to the Ivy League in the USA. International
best practice indicates that supporting only elite universities does not lead to improvements in the
overall higher education system.65 Frequently, when elite universities become stronger, other
universities become weaker, which makes national higher education systems less competitive
internationally.66
Higher education financing in Russia is not low, meaning that all the universities receive enough support
for maintenance based on the per-capita formula, but universities still lack funds for development
purposes. Indeed, some federal programs were created to develop non-elite universities (e.g. “Regional
Flagship Universities”67 or “Universities as Hubs for Innovations”68), but both of them were not
supported with adequate funding.
Today, the Russian government urges all universities in the country to improve research and education
results regardless of the level of their capacity and financial potential. The main areas of enhancement
expected from universities are: (i) increase research productivity (counted by the number of publications
and citation index); (ii) closer collaboration with employers to update curricula based on their needs; (iii)
introduction of new teaching and learning methods to develop soft skills; and (iv) innovating curricula
and developing individual learning paths.
All these positive incentives face significant challenges because they lack funding and face barriers at the
federal level. Many of these obstacles may be accounted by the delayed implementation of the
European Bologna process69 despite it being signed in 2003.70
There are a few guidelines that Russia could follow to significantly improve the quality of its higher
education provision, such as: (i) raising its research productivity by increasing staff hours allocated to
research as opposed to teaching (a typical professor’s annual workload in an average Russian university
is about 1,000 hours, with a maximum of 36 hours per week,71 compared to an annual maximum of 550
63 http://government.ru/info/35566/ 64 http://government.ru/info/35565/ 65 https://assets.publishing.service.gov.uk/government/uploads/system/uploads/attachment_data/file/80188/Higher-Education.pdf, https://www.universityworldnews.com/post.php?story=20180927104004479 66 See: http://www.oecd.org/education/imhe/46953521.pdf, https://assets.publishing.service.gov.uk/government/uploads/system/uploads/attachment_data/file/80188/Higher-Education.pdf, https://www.universityworldnews.com/post.php?story=20180927104004479, etc. 67 http://flagshipuniversity.ru/ 68 http://centervuz.ru/ 69 The Bologna Process is a mechanism promoting intergovernmental cooperation between 48 European countries in the field of higher education. See: https://ec.europa.eu/education/policies/higher-education/bologna-process-and-european-higher-education-area_en 70 http://www.ehea.info/media.ehea.info/file/2003_Berlin/28/4/2003_Berlin_Communique_English_577284.pdf 71 Order of MoES N 1601 dated 22.12.2014, Annex 1 https://base.garant.ru/70878632/
85
hours in the UK72); (ii) improving collaboration with employers by developing relevant curricula for
business needs and introducing occupational standards as a mandatory part of the educational
curriculum73; (iii) introducing new teaching and learning practices with sufficient financial support to
improve student soft skills. Fostering project-based work in most Russian universities74 as a method of
developing soft skills (such as collaboration, teamwork, communication, problem-solving, conflict
management, and others); (iv) and innovating curricula and developing individual learning paths by
updating the federal higher education standards. The current regulations do not provide enough
flexibility to universities and that affects their academic autonomy. At the same time, Russia can use the
experience of the European countries that are moving away from the standards in higher education
towards more flexible Dublin descriptors,75 which provide an initial set of learning outcomes for
curriculum development and leave more autonomy to universities.76
Finally, Russian elite universities are improving their position in the international rankings because of
significant financial support. However, the overall higher education system faces rigid legislation and
receives insufficient help due to a lack of funds allocated to ambitious reforms. Balancing the current
system may bring more value to the Russian education system and, ultimately, to further raise the
profile of Russian education as equitable and relevant to the needs of citizens and the economy.
International students in Russian universities: the numbers are growing but the strategy is lacking
The Russian Federation has one of the fastest-growing higher education systems in terms of attracting
international students. According to the OECD, in 2017, Russia ranked among the world’s top countries
for international students and took 4th place after the USA, the UK, and Australia with a total share of
international students of 6 percent (OECD 2019, Table B6.377).
In order to take the next steps and improve the effectiveness of the program on attracting international
students to Russia, it is important to better understand the root causes of this success. After the collapse
of the Soviet Union, many post-Soviet countries underwent a period of crisis and, as a result, lessened
the capacity of their higher education systems. Nowadays, many students from Commonwealth of
Independent States (CIS) countries prefer to go to Russia for their studies. The share of CIS students in
the overall number of international students is more than 70 percent (It was 79 percent in 201578). Since
the middle of the twentieth century, Russia has been a traditional destination for obtaining a higher
education degree for students from many countries in Asia, Africa, and the Middle East. Since 2012, the
Ministry of Science and Higher Education (MoSHE, called before 2018 the Ministry of Education and
Science) has annually reviewed university efficiency, and the number of international students is one of
72 https://www.ucu.org.uk/media/335/University-of-South-Wales-academic-workload-model-Dec-14/pdf/usw_academicworkloadmodel.pdf 73 Federal Law “On Education”. Article 11, p. 7. http://static.kremlin.ru/media/acts/files/0001201212300007.pdf 74 Project based learning. Practices of implementation in universities. Moscow, Skolkovo, 2018. https://bit.ly/2VHNZTZ 75 http://ecahe.eu/w/index.php/Dublin_Descriptors, http://www.aqu.cat/doc/doc_24496811_1.pdf 76 https://www.university-autonomy.eu/dimensions/academic/
78 Academic mobility of international students in Russia. Moscow, HSE, 2016. https://ioe.hse.ru/data/2016/08/04/1119531130/%D0%A4%D0%9E7.pdf
86
the major performance indicators. Finally, the cost of living and studying in Russia is often considerably
lower compared to G7 countries and other top destinations for international students (especially after
2014), notably for professions in high demand like health care.
Yet even though Russia is doing well in attracting international students, the capacity of the national
higher education system to integrate more students from abroad is far from being fully utilized. In 2017,
only 4 percent of students came from other countries (as compared to 21 percent in Australia, 18
percent in the UK, 10 percent in France and 8 percent in Germany) and 96 percent were Russian citizens.
One of the main reasons for this is that Russian universities still do not fully realize the benefit to
increasing the number of international students.
The federal project “Export of Education” proposes several objectives: (i) to raise global competitiveness
and the reputation of the Russian Federation; (ii) to promote the “soft power” of Russian external
policy; and (iii) to increase the funding received from international students.
While the first two goals are not so relevant to the higher education system itself, the third is far from
being attained. Incomes from higher education provided to international students in Russia are low if
compared to other top recipient countries. In 2018, Russia gained only about Rub 30.6 billion (the
equivalent of US$0.5 billion)79 from the direct economic impact80 of international students. By
comparison, in 2016 the UK had about US$12 billion of direct economic impact from international
students; Australia, US$9 billion; France and Germany, around US$6 billion; and Canada, US$4 billion.81
These countries have comparable numbers of international students and earn 8-25 times more than
Russia. This proves that a revenue increase is not the main objective of the Russian policy in attracting
international students.
Russia could do more to attract international students. While the education attainment in Russia is high
as compared with OECD countries, this attainment does not translate into relevant skills. The earlier
mentioned study of the World Bank on relevance of skills to the labor market (see footnote 44) proves
this point. A study in ECA Skills, not just Diplomas82 had this topic at its center. Although the Russian
labor market lacks a highly qualified labor force,83 Russia does not provide possibilities for employment
to foreign graduates of its universities. When their student visa expire, new work visas and work permits
are hard to get, as the procedure and requirements are complicated. Russia does not use international
students as means of raising the overall quality of the higher education system, which is one of the main
objectives of internationalization in the world (e.g. Norway84, Germany85), or contributing to the
79 Export of Russian Educational Services. Statistical collection. https://sociocenter.info/ru/docs/stat-compilations/export-of-russian-educational-services 80 Direct economic impact of international students – amount of money which students are contributing directly to their universities (tuition fees). 81 https://studyportals.com/intelligence/global-impact-of-international-students/ 82 http://documents.worldbank.org/curated/en/281131468337867775/Skills-not-just-diplomas-managing-education-for-results-in-Eastern-Europe-and-Central-Asia 83 Order of the Ministry of Labor and Social Protection N 734н dated 25.11.2019 https://www.garant.ru/products/ipo/prime/doc/73476436/ 84 https://khrono.no/files/2019/11/12/International_Students_in_Norway.pdf 85 https://wenr.wes.org/2019/10/how-germany-became-an-international-study-destination-of-global-scale
87
educational process in the classroom (e.g. USA86, UK87). Although Russia creates graduate communities
abroad (through Rossotrudnichestvo88) for those who finished Russian universities, this investment looks
more like a representational expense89 and does not yield any long-term benefit. Such communities are
not involved in economic, research, and financial cooperation with Russia. This indicates that the
“reputational” objective of attracting international students is not fully achieved. The absence of a clear
federal strategy could exacerbate other challenges to the sustainable development of university
internationalization in Russia, such as (i) cross-agency cooperation, (ii) administrative barriers, and (iii)
learning environment.
All the issues listed above demonstrate that Russia could benefit from a clear national strategy for
internationalization. Developing it will require effort not only from the authorities, but also from
universities, who should define their own interest in raising the number of their international students.
This would benefit the Russian government, universities as well as students. Such a strategy will be even
more needed under the mid-term COVID-19 perspective, when the competition for international
students will surge.
Many aspects of internationalization in the higher education sector worldwide have been and will
continue to be severely impacted by the pandemic, most of all regarding inbound and outbound student
mobility. Going forward, study abroad programs in which students participate for a semester or even
shorter periods may encounter significant issues, as students assess possible risks and challenges related
to such experiences and might face funding difficulties.90 However, despite the crisis having a severe
negative impact on various aspects of internationalization, international cooperation among countries
and higher education institutions is needed as much now as ever. Russia, which aims to nearly triple the
number of its international students by 2025, has to find new solutions and mitigation activities to
decrease the impact of the crisis. This might include improving the quality of programs while in
lockdowns, expanding domestic internationalization efforts, and internationalizing online delivery.91
Conclusion
The Russian Federation possesses a high-quality education system that is recognized internationally.
Russia’s sustained growth in international standing is a result of continuous reforms and improvements
and the building of a robust national assessment system. All these reforms to the education sector were
86 https://www.hindawi.com/journals/edri/2015/202753/ 87 https://www.russellgroup.ac.uk/media/5679/rg-evidence-to-mac-commission-on-international-students-jan-2018.pdf 88 Federal Agency for the Commonwealth of Independent States Affaires, Compatriots Living Abroad, and International Humanitarian Cooperation http://rs.gov.ru/en 89 See Rossotrudnichestvo report for 2018 (p. 10) http://rs.gov.ru/uploads/document/file/11228/%D0%94%D0%BE%D0%BA%D0%BB%D0%B0%D0%B4%202018%20%D0%B3%D0%BE%D0%B4.pdf 90 Tertiary Education and COVID-19: Impact and Mitigation Strategies in Europe and Central Asia. http://pubdocs.worldbank.org/en/783451590702592897/ECA-TE-and-COVID-19-long-FINAL-25May20.pdf 91 The COVID-19 Crisis Response: Supporting tertiary education for continuity, adaptation, and innovation. http://pubdocs.worldbank.org/en/621991586463915490/WB-Tertiary-Ed-and-Covid-19-Crisis-for-public-use-April-9.pdf
88
supported by the attention and financial support of the government.
However, the following trends in education sector development appear worrying and call for the
revision of policy priorities:
• There are regional disparities in the returns on education and collaborative problem-solving
skills learning outcomes, which brings into question the efficiency and targeting of existing
public support programs to the educational institutions. These disparities could be reduced by,
in addition to improving connectivity in lagging regions, ensuring more equitable access to
quality learning. Traditional education approaches in regions could be improved by more diverse
teaching and learning practices, stimulating learning environments in schools, and more
extracurricular opportunities for vulnerable students enabling better resilience, motivation, and
creativity.
• Further development of independent education-quality assurance systems is very important.
The authorities should focus on how to use the results of these independent assessments to
strengthen and support the work of weaker regions, institutions, or particular groups of
students. This could be a set of specially targeted programs, guidelines (including coaching
programs for teaching staff), or a collection of best practices. The authorities should work to
stimulate inter-regional exchange and the collaboration of the educational institutions on this
topic.
• Russia will need to tackle the issue of learning loss related to COVID-19 and protect the
education system from potential budget decreases. National education expenses are already
lower than the OECD average and Russia cannot afford further reductions to its education
budget. On the contrary, to mitigate the pandemic’s impact during lockdown, more support to
families and teachers is needed. The learning recovery and accelerated learning programs will
need to be established and planned when schools reopen with a focus on vulnerable students.
• The COVID-19 crisis will widen the achievement gap between socioeconomic groups in Russia,
and the government may need to develop specific programs, protecting the most vulnerable
and providing them with diverse opportunities. This relates to the digital divide and government
measures to ensure that all students and teachers benefit from educational learning platforms.
• Russia needs a clear national strategy for internationalization in higher education. Authorities
should choose areas of specific attention and universities and should work to increase the
numbers of international students. Such a strategy is even more needed under the COVID-19
pandemic, when in the mid-term perspective, the competition for international students will
grow significantly.
• Elite universities in Russia are improving their position in the international rankings because of
significant financial support. However, the overall higher education system faces rigid legislation
and a lack of funds allocated to ambitious reforms.
• Russia lacks the evidence base necessary to tackle these challenges, because the impact of
current federal programs in education isn’t rigorously evaluated. Such impact evaluation could
89
help to revise existing education policies and make them more efficient in terms of the impact
per ruble spent. They can also help to reach students from low socioeconomic groups and
further improve equity.
Systemic analysis, reforms, and the internationalization of education have helped Russia become one of
the leading countries in education performance. As the Russian education system moves toward the
development of a 21st-century economy, it is critical to reevaluate foundational systems, improve
teacher training and curriculum and foster creativity. Russia benefits from participating in the global
education community and through this process also willingly shares its developments and expertise –
policy choices that have generated positive outcomes. The current response to COVID-19 crisis could
also be an opportunity to tackle structural imbalances of Russian education and speed up the needed
reforms.
90
Annex Annex 1: Methodology for Estimating the Distributional Impact of COVID-19 Crisis and the Social
Measures.
RUSMOD was built on the EUROMOD platform, using the Russian Longitudinal Monitoring Survey (see
Matytsin, Popova and Freije, 2019; and Popova 2012). It defines a baseline scenario using the pre-
pandemic projections of +1 percent of GDP growth in 2020 and defines three experiments.
• Experiment A assesses the distributional effect of social policy changes announced in January
2020. In particular, it includes simulation of the following measures: (i) an increase in coverage
of the allowance for the first and second child (including, in each case, children up to 3 years of
age in households with income below 200 percent of the regional Subsistence Minimum Level
(SML) and (ii) a new allowance for children aged 3 to 7 in households with income below 100
percent of SML.
• Experiment B examines the effect of the declines in household income due to the pandemic
crisis and the non-working days introduced in many Russian regions in April-May 2020.
Experiment B was done under two scenarios of household income contraction to reflect the two
scenarios of GDP contraction (baseline of 6 percent and severe of 9.6 percent):
o Moderate income shock: universal contraction of labor incomes by 5 percent and 25
percent job loss in affected sectors (transport, hospitality, retail and entertainment).
This corresponds to a decline in average labor income of8 percent.
o Severe income shock: universal contraction of labor incomes by 8 percent and 35
percent job loss in the affected sectors. This corresponds to a decline in average labor
incomes of 12 percent.
• Experiment C measures the distributional impact of social policies related to the pandemic (in
particular, changes to child allowances and Social Security contributions for SMEs). It includes
the following measures: (i) a cash payment, from April to June 2020, of Rub5,000 per month for
each child up to 3 years, (ii) a lumpsum payment of Rub10,000 for all children aged 3-16 years;
(iii) an increase in the size of childcare allowance for the first child up to 1.5 years for non-
working parents; (iv) cash payments for pensioners aged 65+ of Rub 4,000 in Moscow (Rub3,000
in Moscow Oblast); (v) a 6.6 percent increase in contributory pensions and a 5.1 percent
increase in social pensions; (vi) reduced social contributions rates for those employees of small
and medium enterprises (SME) whose earnings are over the Minimum Wage (Rub12,130
rubles), with reduced rates of 10 percent for pensions contributions, 0 percent for social
insurance contributions and 5 percent for healthcare contributions; (vii) a tax allowance equal to
the Minimum Wage for the self-employed in the most affected sectors; (viii) cancelation of
income taxes and social insurance contributions in the second quarter of 2020 for those
employed at SMEs in the affected sectors; (ix) an increase in the maximum size of
unemployment benefit up to the Minimum Wage; (x) a new unemployment benefit equal to the
Minimum Wage for those who became unemployed within the four industries and location
types indicated above, with additional top-ups of 3,000 rubles for each dependent child;
91
• There are assumptions on the take-up for the new benefits. For example, the unemployment
benefit take-up is assumed to be 25 percent (current share of those who receive unemployment
benefits in total unemployment is 15-20 percent), while the universal child benefits are assumed
to be received by 75 percent of the eligible population.
There are a number of other assumptions that drive the results of the model. Among those are no
behavioral response, namely individuals and household do not change their economic behavior due
to changes in taxes and transfers. This assumption is mostly explained by the short-term nature of
this assessment that does not allow to quickly change the labor market behavior. Another important
assumption is that economic incidence of all taxes, including labor taxes, completely falls on
workers. In reality, the economic incidence is spread between the workers and employers and thus
the positive effect of SIC and tax reduction might be smaller and thus the results of social measures
simulations could be seen as upper bound.