Embed Size (px)
Citation preview
Russia in the Global Economic Storm
Based on Russian Economic Report No. 18www.worldbank.org/ru
Zeljko BogeticLead Economist for Russia
Wednesday, May 6, 2009
European Policy Centre
Brussels
I. The global economic storm
II. Russia’s storm• Initial conditions• External shocks• Economic impact• Social and regional impacts
III. Policy response
IV. What more can be done?
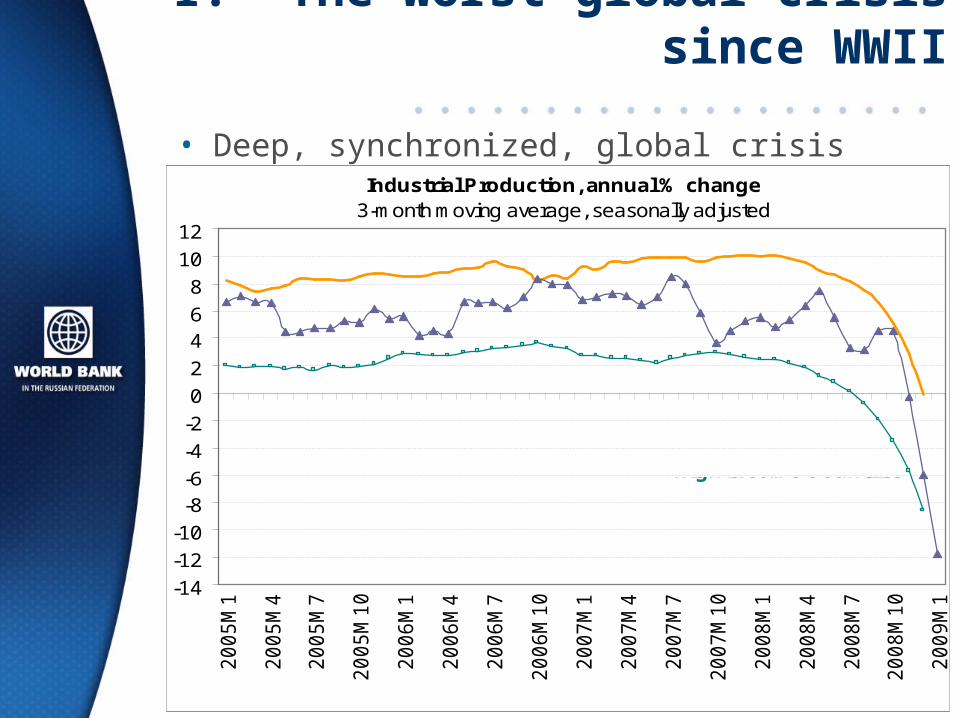
I. The worst global crisis since WWII
• Deep, synchronized, global crisis with financial crisisIndustrial Production, annual % change
3-month moving average, seasonally adjusted
-14
-12
-10
-8-6
-4
-2
0
2
46
8
10
122
00
5M
1
20
05
M4
20
05
M7
20
05
M1
0
20
06
M1
20
06
M4
20
06
M7
20
06
M1
0
20
07
M1
20
07
M4
20
07
M7
20
07
M1
0
20
08
M1
20
08
M4
20
08
M7
20
08
M1
0
20
09
M1
Sources: IMF, Datastream Thomson and World Bank
High Income Countries
Russia
Developing Countries
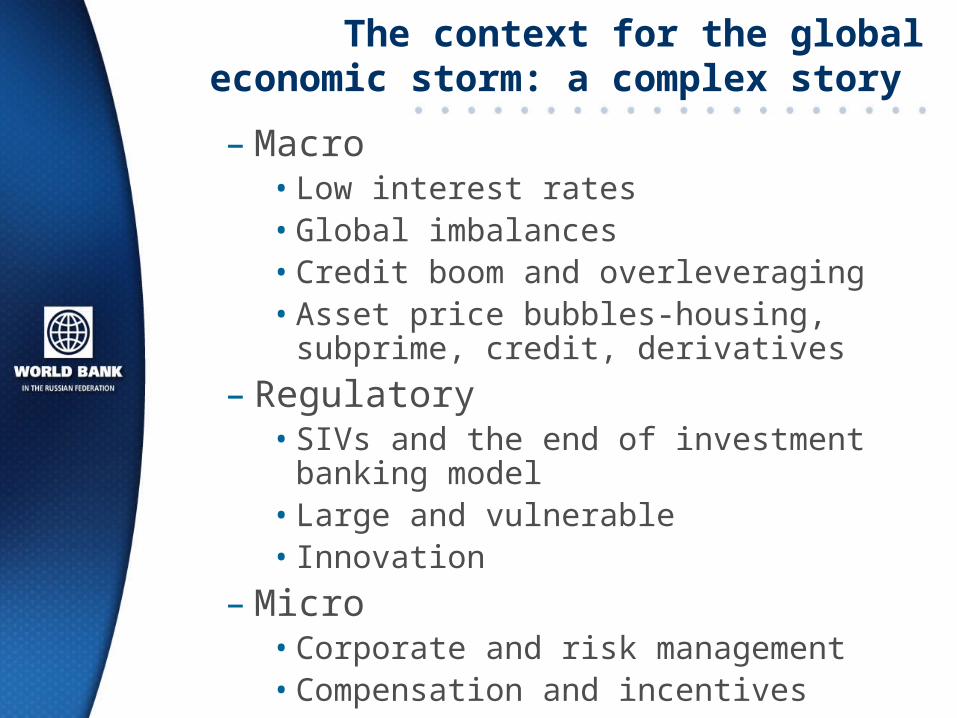
The context for the global economic storm: a complex story
– Macro • Low interest rates• Global imbalances• Credit boom and overleveraging• Asset price bubbles-housing, subprime, credit,
derivatives
– Regulatory• SIVs and the end of investment banking model• Large and vulnerable• Innovation
– Micro• Corporate and risk management• Compensation and incentives
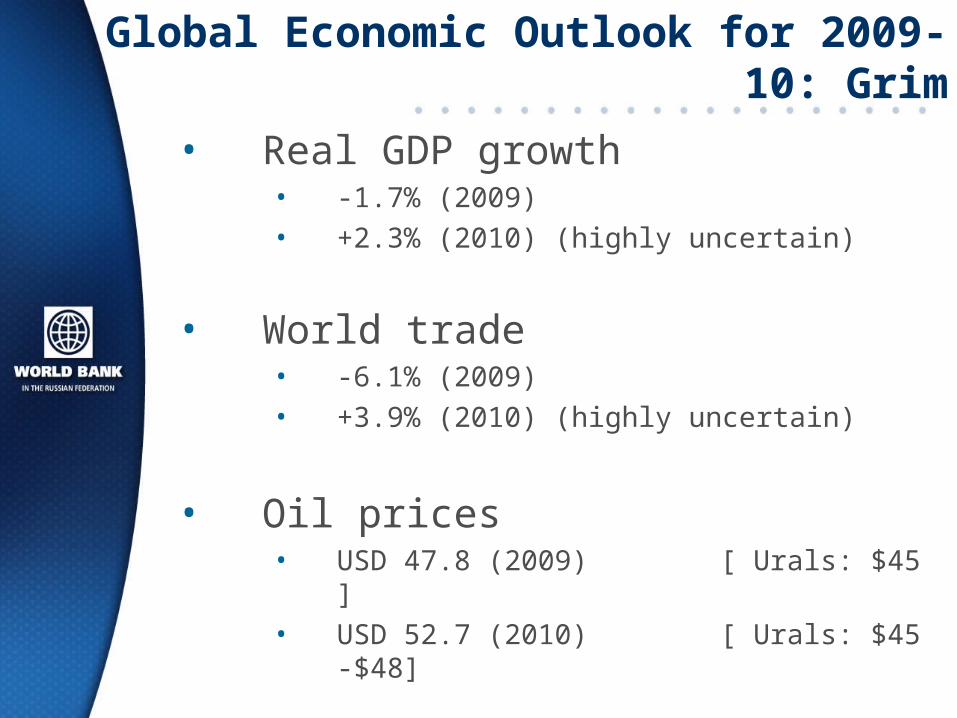
Global Economic Outlook for 2009-10: Grim
• Real GDP growth• -1.7% (2009)
• +2.3% (2010) (highly uncertain)
• World trade• -6.1% (2009)
• +3.9% (2010) (highly uncertain)
• Oil prices• USD 47.8 (2009) [ Urals: $45 ]
• USD 52.7 (2010) [ Urals: $45 -$48]
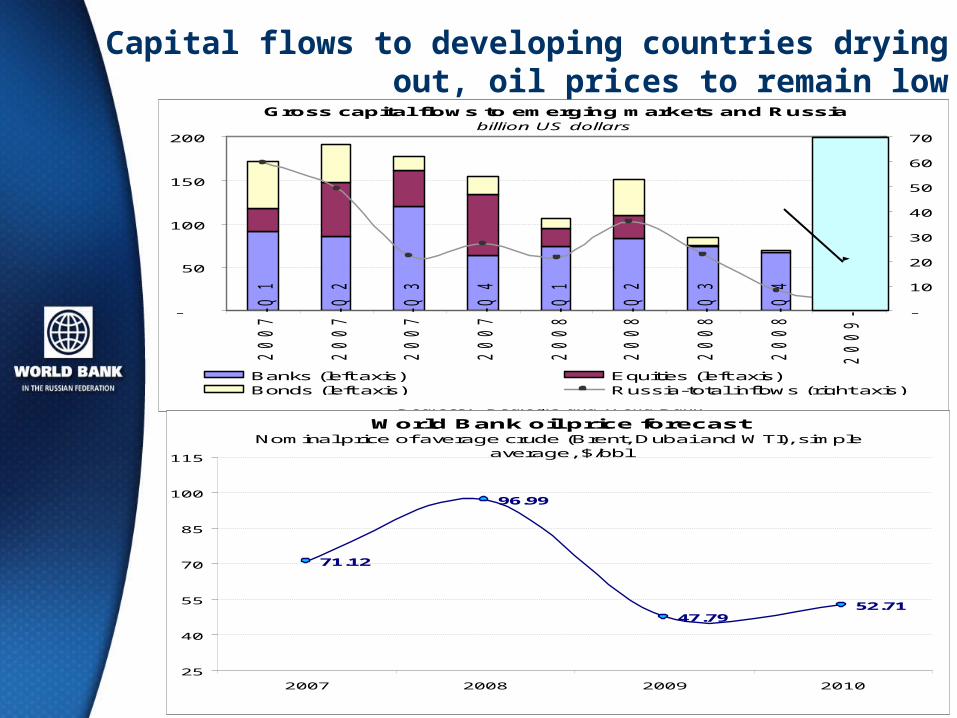
Capital flows to developing countries drying out, oil prices to remain low
Gross capital flows to emerging markets and Russiabillion US dollars
-
50
100
150
200
20
07
-Q
1
20
07
-Q
2
20
07
-Q
3
20
07
-Q
4
20
08
-Q
1
20
08
-Q
2
20
08
-Q
3
20
08
-Q
4
20
09
-Q
1*
-
10
20
30
40
50
60
70
Banks (left axis) Equities (left axis)Bonds (left axis) Russia-total inflows (right axis)
Sources: Dealogic and World Bank
*Jan-2009 on
quarterly basis
World Bank oil price forecastNominal price of average crude (Brent, Dubai and WTI), simple
average, $/bbl
71.12
96.99
47.7952.71
25
40
55
70
85
100
115
2007 2008 2009 2010
Source: World Bank
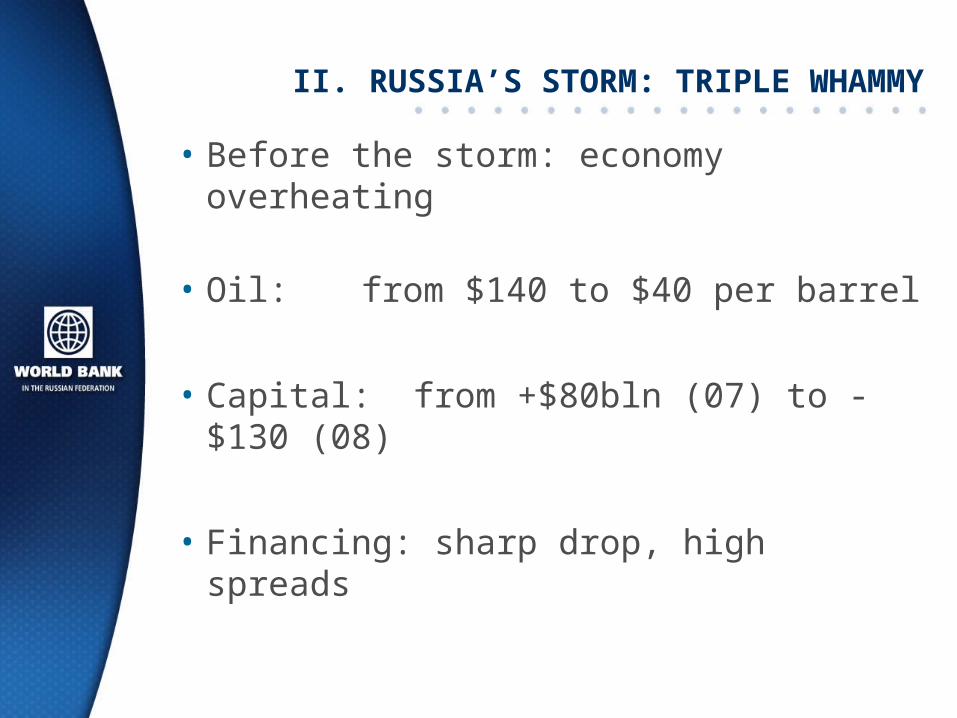
II. RUSSIA’S STORM: TRIPLE WHAMMY
• Before the storm: economy overheating
• Oil: from $140 to $40 per barrel
• Capital: from +$80bln (07) to -$130 (08)
• Financing: sharp drop, high spreads
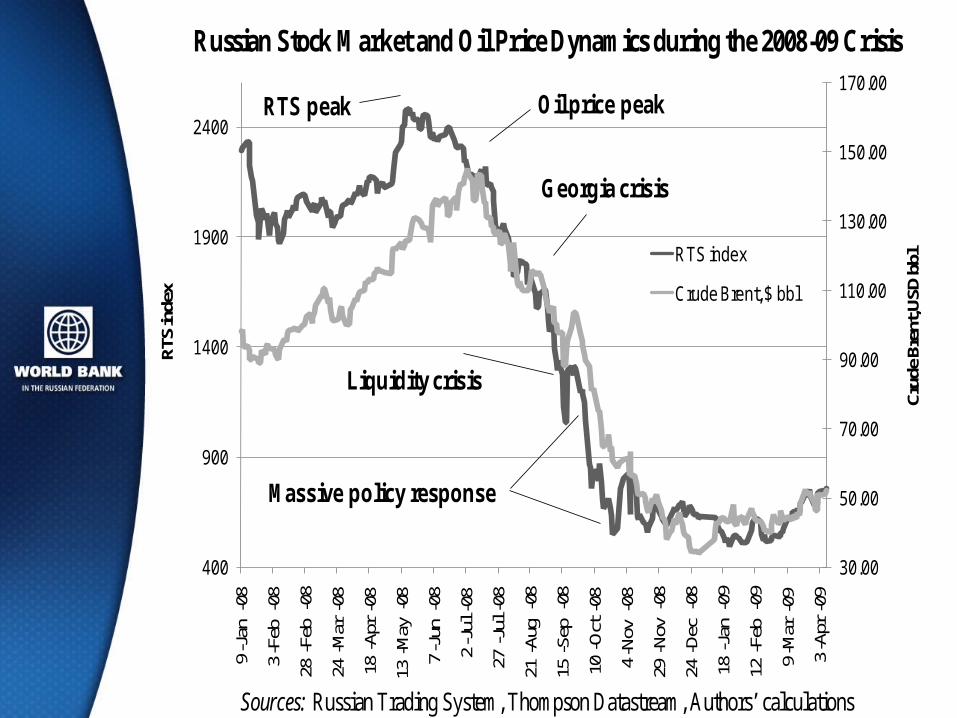
Russian Stock Market and Oil Price Dynamics during the 2008-09 Crisis
30.00
50.00
70.00
90.00
110.00
130.00
150.00
170.00
400
900
1400
1900
2400
9-J
an-0
8
3-F
eb-0
8
28-F
eb-0
8
24-M
ar-0
8
18-A
pr-0
8
13-M
ay-0
8
7-J
un-0
8
2-J
ul-0
8
27-J
ul-0
8
21-A
ug-0
8
15-S
ep-0
8
10-O
ct-0
8
4-N
ov-0
8
29-N
ov-0
8
24-D
ec-0
8
18-J
an-0
9
12-F
eb-0
9
9-M
ar-0
9
3-A
pr-0
9
Cru
de B
rent
, USD
bbl
RTS
inde
x
RTS index
Crude Brent, $ bbl
RTS peak Oil price peak
Georgia crisis
Liquidity crisis
Massive policy response
Sources: Russian Trading System, Thompson Datastream, Authors’ calculations
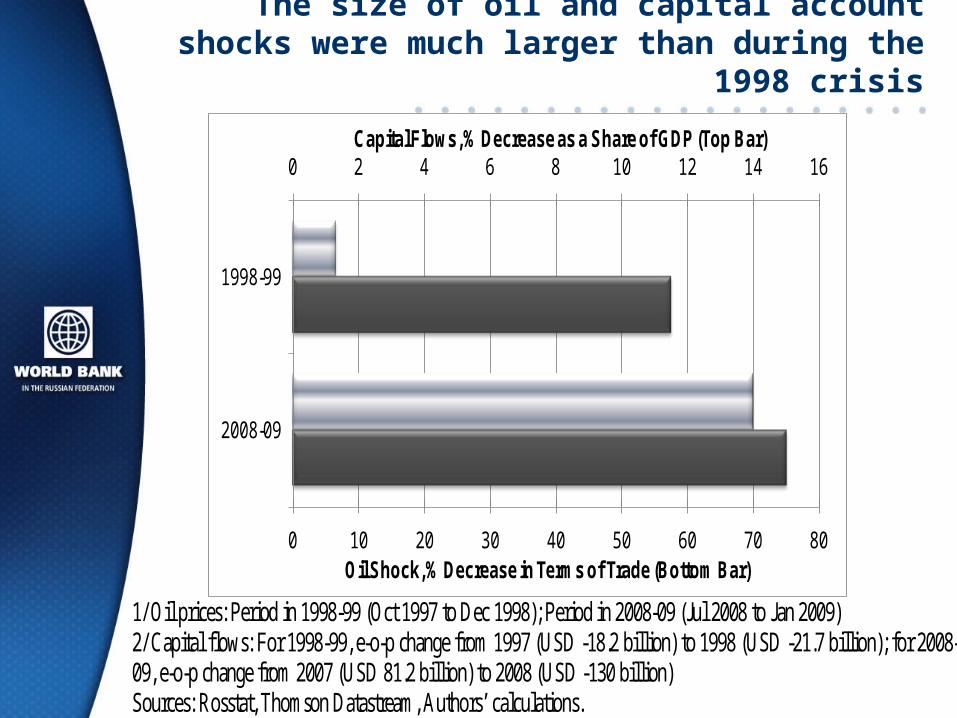
The size of oil and capital account shocks were much larger than during the 1998 crisis
0 10 20 30 40 50 60 70 80
0 2 4 6 8 10 12 14 16
1998-99
2008-09
Oil Shock, % Decrease in Terms of Trade (Bottom Bar)
Capital Flows, % Decrease as a Share of GDP (Top Bar)
1/ Oil prices: Period in 1998-99 (Oct 1997 to Dec 1998); Period in 2008-09 (Jul 2008 to Jan 2009) 2/ Capital flows: For 1998-99, e-o-p change from 1997 (USD -18.2 billion) to 1998 (USD -21.7 billion); for 2008-09, e-o-p change from 2007 (USD 81.2 billion) to 2008 (USD -130 billion) Sources: Rosstat, Thomson Datastream, Authors’ calculations.
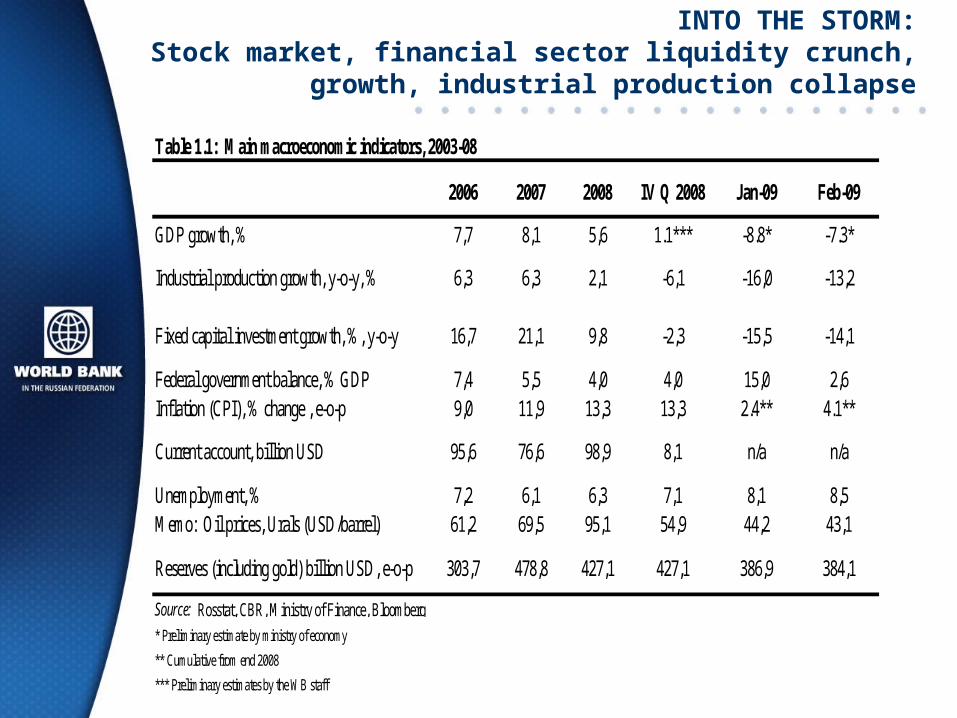
INTO THE STORM: Stock market, financial sector liquidity crunch,
growth, industrial production collapse
2006 2007 2008 IV Q 2008 Jan-09 Feb-09
GDP growth, % 7,7 8,1 5,6 1.1*** -8.8* -7.3*
Industrial production growth, y-o-y, % 6,3 6,3 2,1 -6,1 -16,0 -13,2
Fixed capital investment growth, %, y-o-y 16,7 21,1 9,8 -2,3 -15,5 -14,1
Federal government balance, % GDP 7,4 5,5 4,0 4,0 15,0 2,6Inflation (CPI), % change , e-o-p 9,0 11,9 13,3 13,3 2.4** 4.1**
Current account, billion USD 95,6 76,6 98,9 8,1 n/a n/a
Unemployment, % 7,2 6,1 6,3 7,1 8,1 8,5Memo: Oil prices, Urals (USD/barrel) 61,2 69,5 95,1 54,9 44,2 43,1
Reserves (including gold) billion USD, e-o-p 303,7 478,8 427,1 427,1 386,9 384,1
Source: Rosstat, CBR, Ministry of Finance, Bloomberg
* Preliminary estimate by ministry of economy
** Cumulative from end 2008
*** Preliminary estimates by the WB staff
Table 1.1: Main macroeconomic indicators, 2003-08
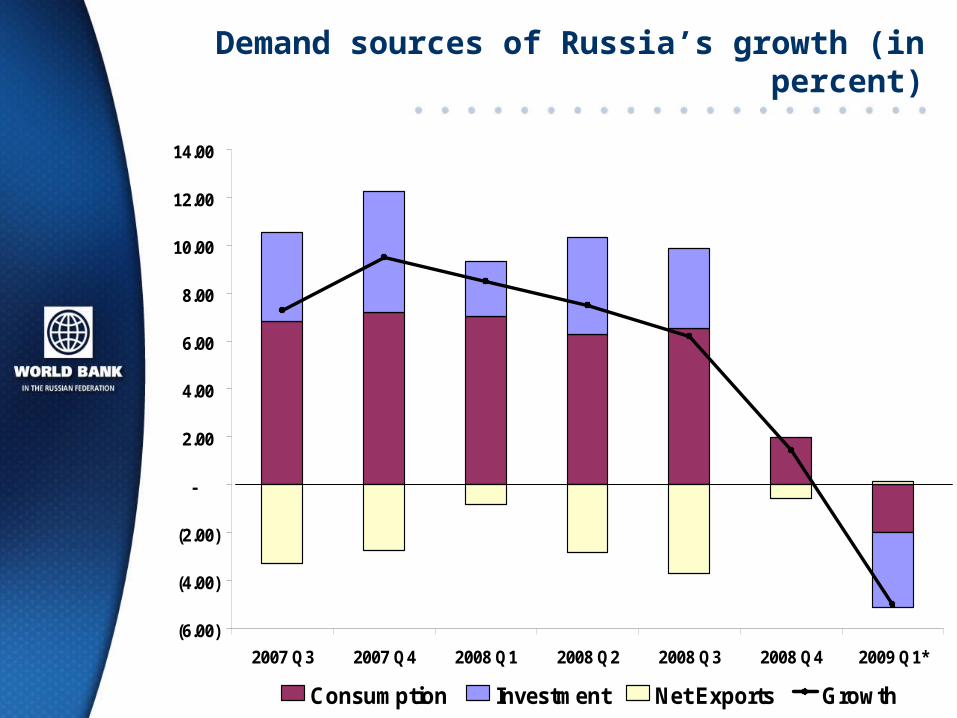
Demand sources of Russia’s growth (in percent)
(6.00)
(4.00)
(2.00)
-
2.00
4.00
6.00
8.00
10.00
12.00
14.00
2007 Q3 2007 Q4 2008 Q1 2008 Q2 2008 Q3 2008 Q4 2009 Q1*
Consumption Investment Net Exports Growth
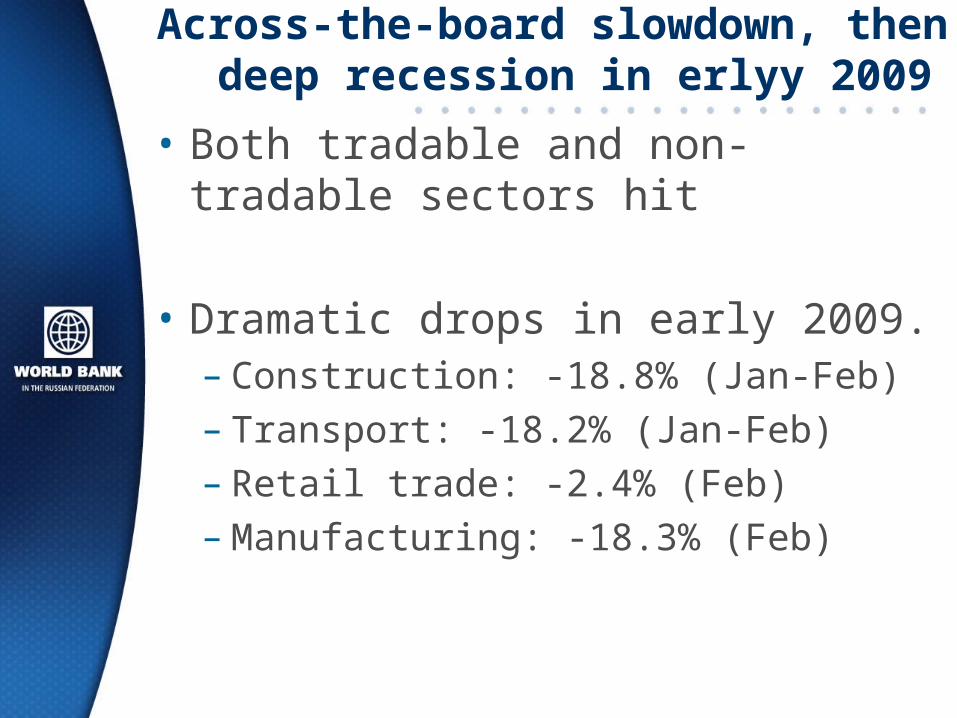
Across-the-board slowdown, then deep recession in erlyy 2009
• Both tradable and non-tradable sectors hit
• Dramatic drops in early 2009. – Construction: -18.8% (Jan-Feb)– Transport: -18.2% (Jan-Feb)– Retail trade: -2.4% (Feb)– Manufacturing: -18.3% (Feb)
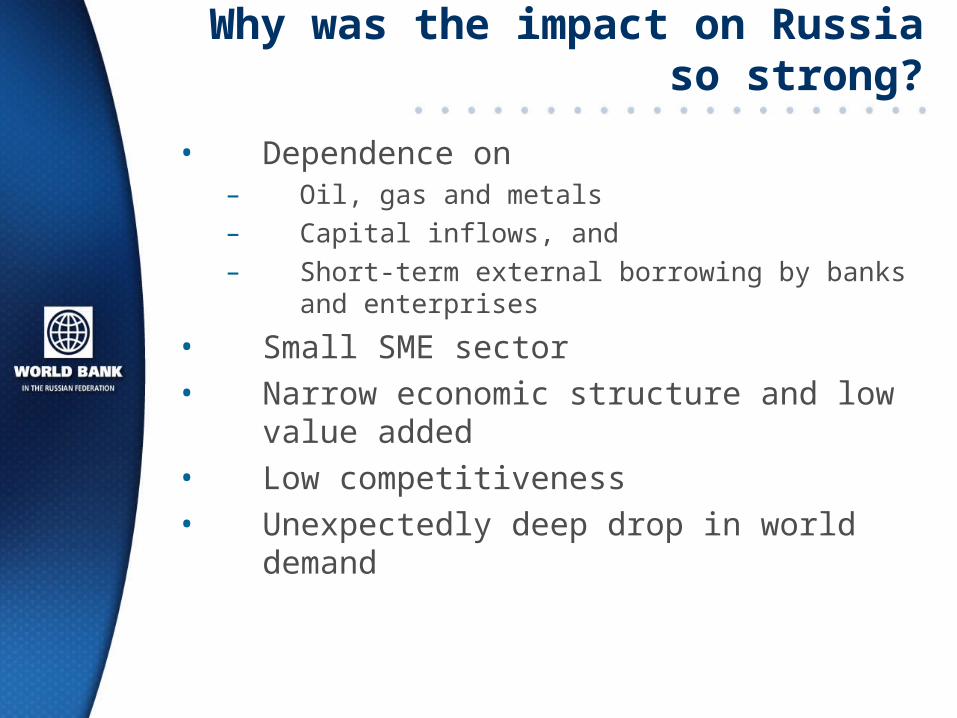
Why was the impact on Russia so strong?
• Dependence on– Oil, gas and metals
– Capital inflows, and
– Short-term external borrowing by banks and enterprises
• Small SME sector
• Narrow economic structure and low value added
• Low competitiveness
• Unexpectedly deep drop in world demand
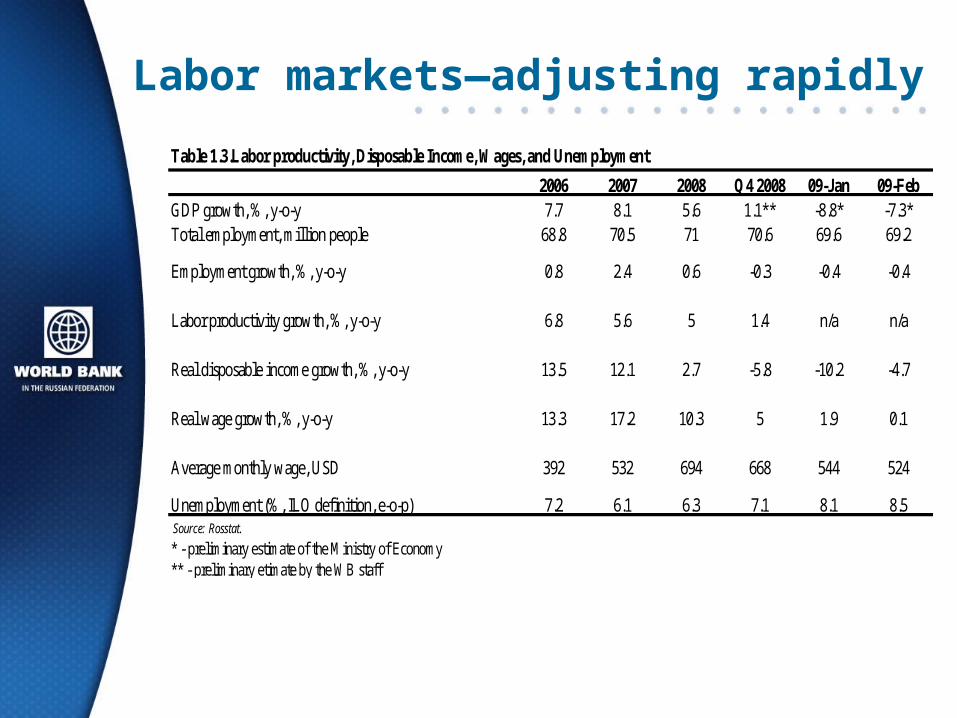
Labor markets—adjusting rapidly
Table 1.3.Labor productivity, Disposable Income, Wages, and Unemployment
2006 2007 2008 Q4 2008 09-Jan 09-FebGDP growth, %, y-o-y 7.7 8.1 5.6 1.1** -8.8* -7.3*Total employment, million people 68.8 70.5 71 70.6 69.6 69.2
Employment growth, %, y-o-y 0.8 2.4 0.6 -0.3 -0.4 -0.4
Labor productivity growth, %, y-o-y 6.8 5.6 5 1.4 n/a n/a
Real disposable income growth, %, y-o-y 13.5 12.1 2.7 -5.8 -10.2 -4.7
Real wage growth, %, y-o-y 13.3 17.2 10.3 5 1.9 0.1
Average monthly wage, USD 392 532 694 668 544 524
Unemployment (%, ILO definition, e-o-p) 7.2 6.1 6.3 7.1 8.1 8.5 Source: Rosstat.
* - preliminary estimate of the Ministry of Economy ** - preliminary etimate by the WB staff
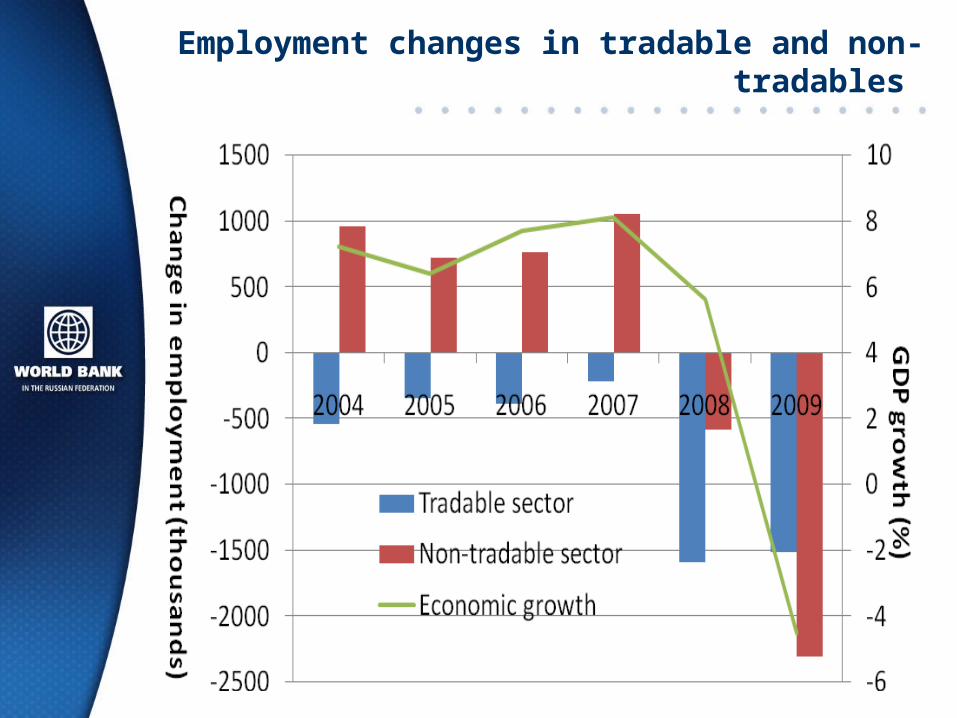
Employment changes in tradable and non-tradables
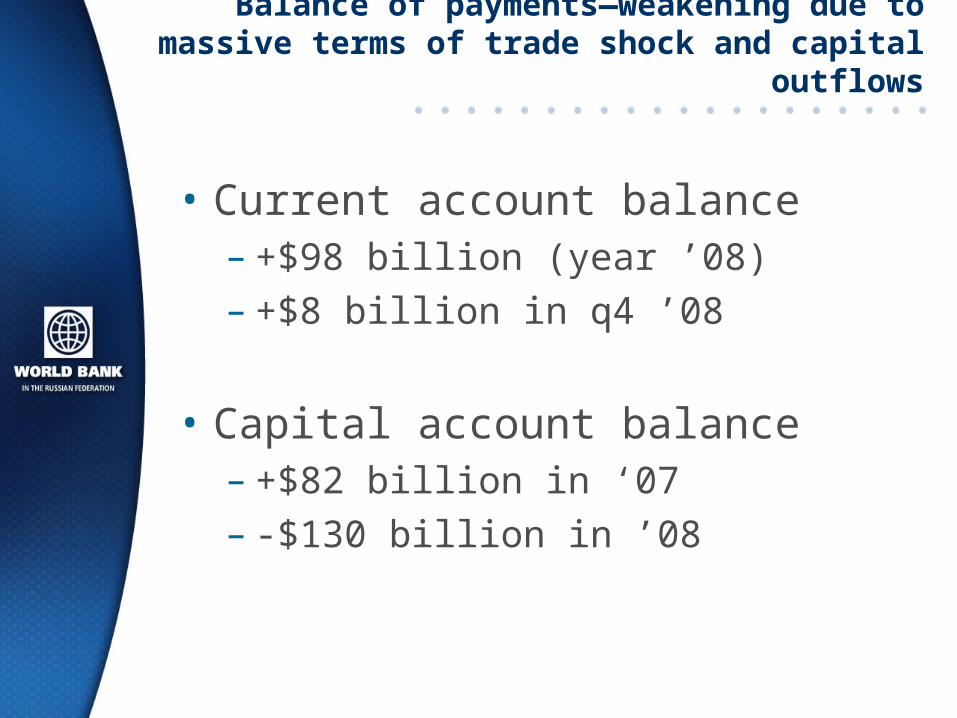
Balance of payments—weakening due to massive terms of trade shock and capital outflows
• Current account balance– +$98 billion (year ’08)– +$8 billion in q4 ’08
• Capital account balance– +$82 billion in ‘07 – -$130 billion in ’08
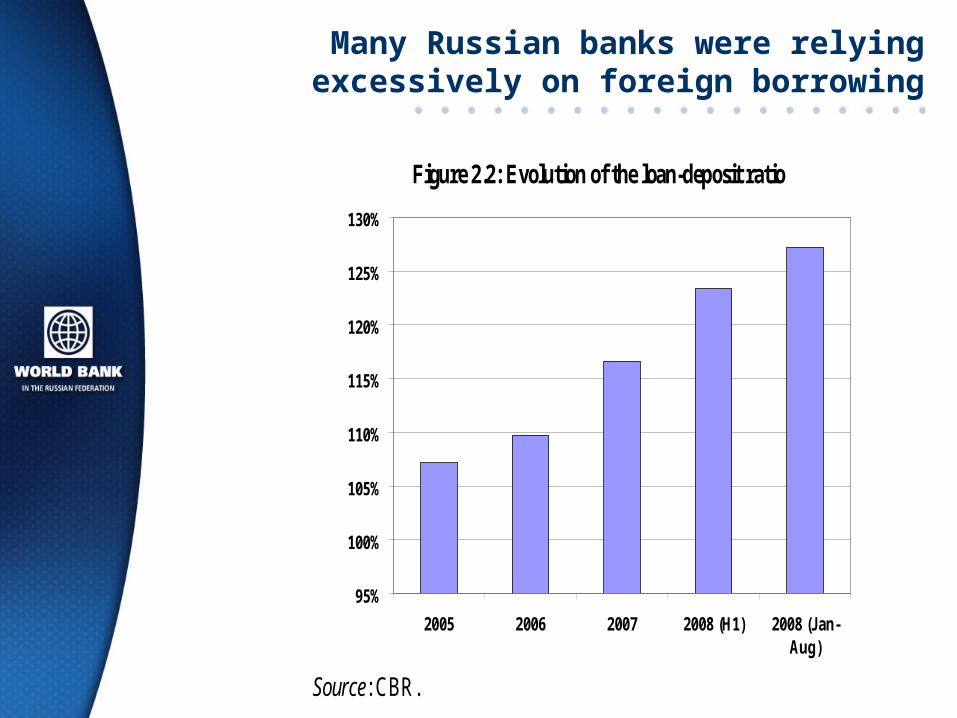
Many Russian banks were relying excessively on foreign borrowing
Figure 2.2: Evolution of the loan-deposit ratio
95%
100%
105%
110%
115%
120%
125%
130%
2005 2006 2007 2008 (H1) 2008 (Jan-Aug)
Source: CBR.
Monetary-Exchange and Fiscal policy—aiming to limit the impact of the crisis
• Monetary-exchange policy: – Initially supporting liquidity– Now supporting ruble, preserving reserves– Blance of risks shifted from inflation to real
economy and social sectors
• Fiscal policy:– Fiscal support to banks and enterprises
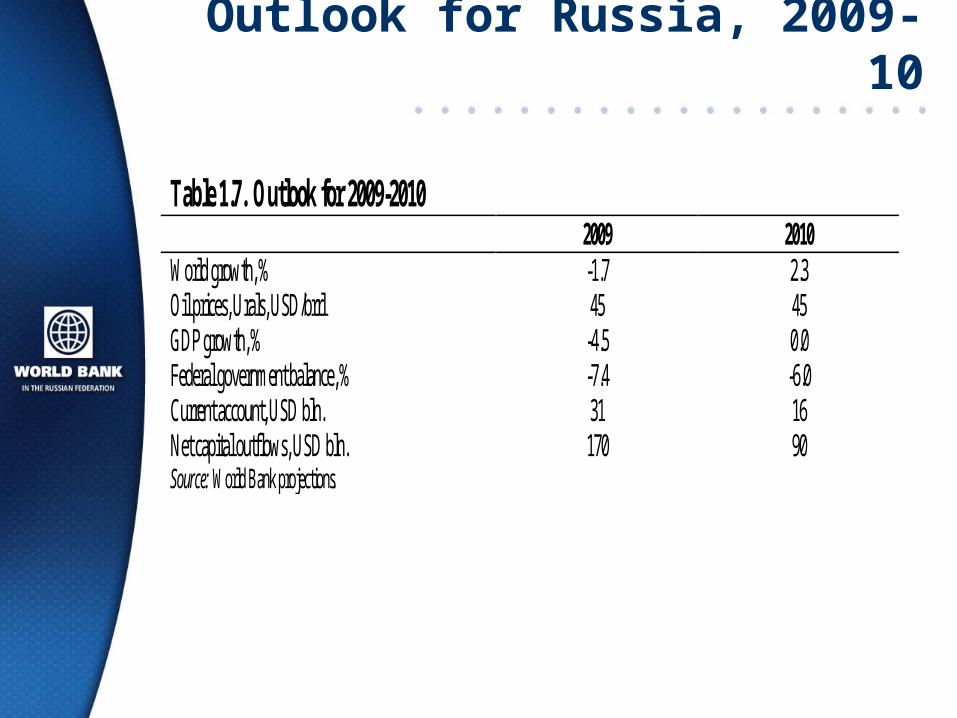
Outlook for Russia, 2009-10
Table 1.7. Outlook for 2009-2010 2009 2010 World growth, % -1.7 2.3 Oil prices, Urals, USD/brrl 45 45 GDP growth, % -4.5 0.0 Federal government balance, % -7.4 -6.0 Current account, USD bln. 31 16 Net capital outflows, USD bln. 170 90 Source: World Bank projections.
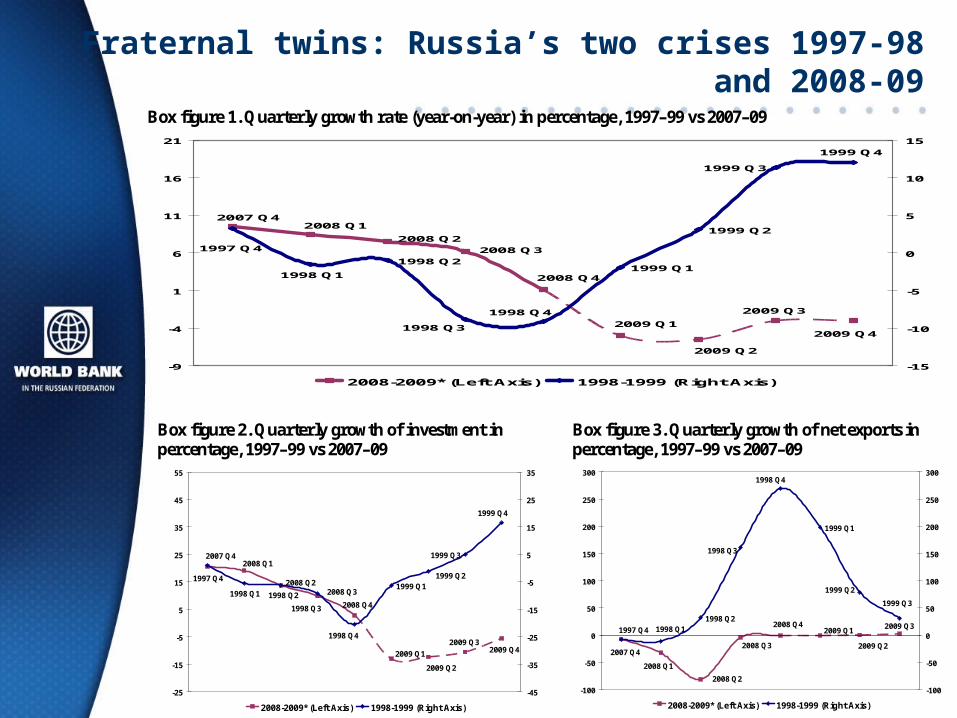
Fraternal twins: Russia’s two crises 1997-98 and 2008-09 Box figure 1. Quarterly growth rate (year-on-year) in percentage, 1997–99 vs 2007–09
2008 Q3
2008 Q4
2009 Q1
2009 Q2
2009 Q4
2009 Q3
2008 Q12007 Q4
2008 Q2
1998 Q21999 Q1
1999 Q2
1997 Q4
1998 Q3
1998 Q4
1998 Q1
1999 Q4
1999 Q3
-9
-4
1
6
11
16
21
-15
-10
-5
0
5
10
15
2008-2009* (Left Axis) 1998-1999 (Right Axis)
Box figure 2. Quarterly growth of investment in percentage, 1997–99 vs 2007–09
2008 Q4
2008 Q32008 Q2
2007 Q42008 Q1
2009 Q32009 Q4
2009 Q2
2009 Q1
1999 Q11999 Q2
1998 Q2
1997 Q4
1999 Q3
1999 Q4
1998 Q1
1998 Q4
1998 Q3
-25
-15
-5
5
15
25
35
45
55
-45
-35
-25
-15
-5
5
15
25
35
2008-2009* (Left Axis) 1998-1999 (Right Axis)
Box figure 3. Quarterly growth of net exports in percentage, 1997–99 vs 2007–09
2008 Q3
2008 Q4
2008 Q2
2007 Q4
2008 Q1
2009 Q3
2009 Q2
2009 Q1
1998 Q2
1999 Q1
1999 Q3
1998 Q1
1998 Q4
1998 Q3
1997 Q4
1999 Q2
-100
-50
0
50
100
150
200
250
300
-100
-50
0
50
100
150
200
250
300
2008-2009* (Left Axis) 1998-1999 (Right Axis)
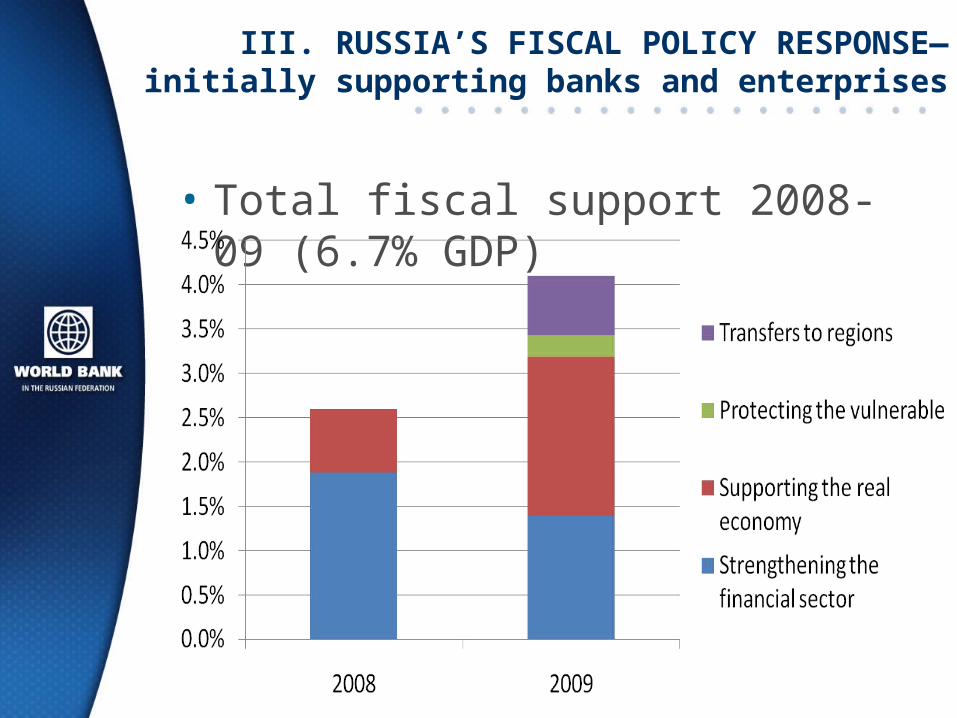
III. RUSSIA’S FISCAL POLICY RESPONSE—initially supporting banks and enterprises
• Total fiscal support 2008-09 (6.7% GDP)
Support to the financial system
• Total support to fin sector 2008-09 (% GDP)
• Total 3.3
– Subordinated loans: 2.3
– Recapitalization 1.0
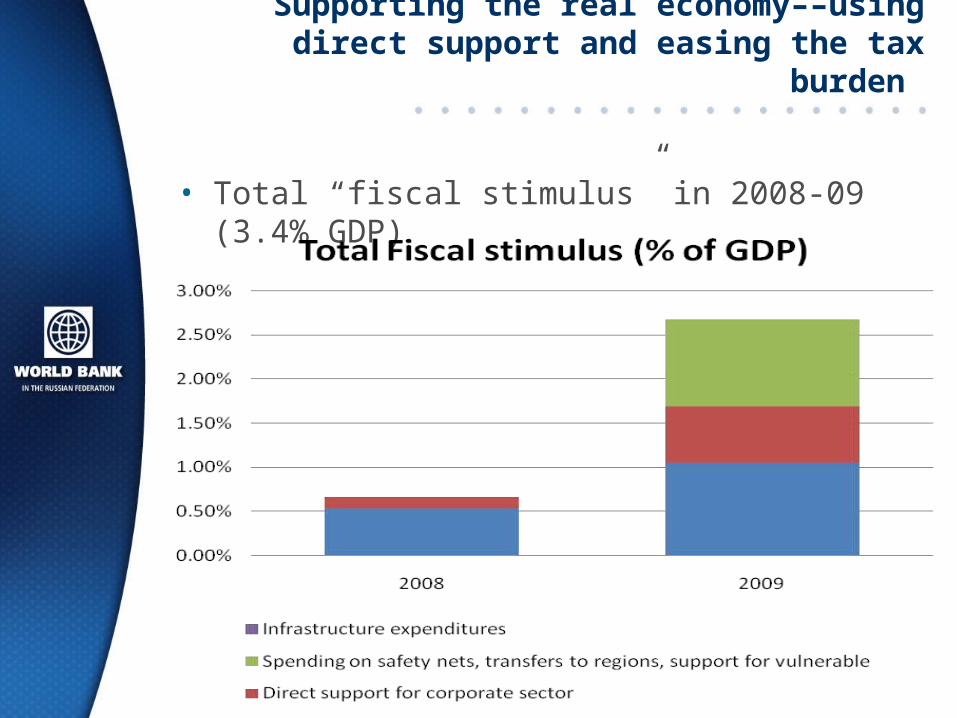
Supporting the real economy––using direct support and easing the tax burden
• Total “fiscal stimulus” in 2008-09 (3.4% GDP)
Some features of fiscal support to enterprises
• Emphasis on tax reduction
• Limited infrastructure spending
• Limited support to SMEs
• Limited interventions in the labor market
• Potential support to “strategic enterprises
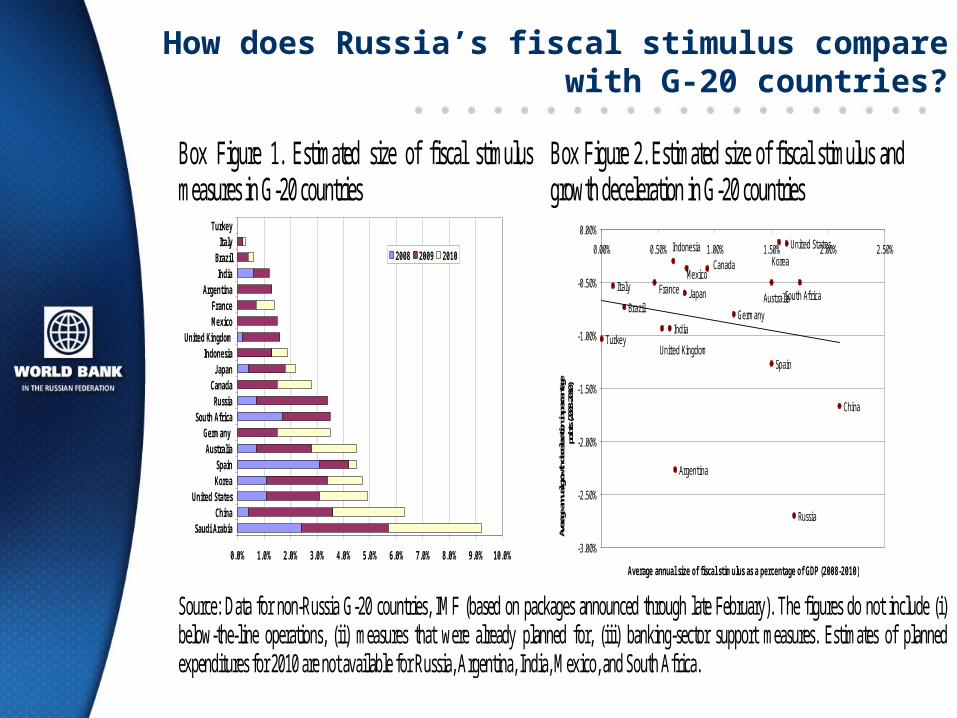
How does Russia’s fiscal stimulus compare with G-20 countries?
Box Figure 1. Estimated size of fiscal stimulus measures in G-20 countries
0.0% 1.0% 2.0% 3.0% 4.0% 5.0% 6.0% 7.0% 8.0% 9.0% 10.0%
Saudi ArabiaChina
United StatesKoreaSpain
AustraliaGermany
South AfricaRussia
CanadaJapan
IndonesiaUnited Kingdom
MexicoFrance
ArgentinaIndia
BrazilItaly
Turkey
2008 2009 2010
Box Figure 2. Estimated size of fiscal stimulus and growth deceleration in G-20 countries
United States
United KingdomTurkey
Spain
South Africa
Russia
MexicoKorea
J apanItaly
Indonesia
IndiaGermany
France
China
Canada
BrazilAustralia
Argentina
-3.00%
-2.50%
-2.00%
-1.50%
-1.00%
-0.50%
0.00%
0.00% 0.50% 1.00% 1.50% 2.00% 2.50%
Average annual size of fiscal stimulus as a percentage of GDP (2008-2010)Av
erage
annu
al gro
wth d
ecele
ration
in pe
rcenta
ge
point
s (20
08-20
10)
Source: Data for non-Russia G-20 countries, IMF (based on packages announced through late February). The figures do not include (i) below-the-line operations, (ii) measures that were already planned for, (iii) banking-sector support measures. Estimates of planned expenditures for 2010 are not available for Russia, Argentina, India, Mexico, and South Africa.
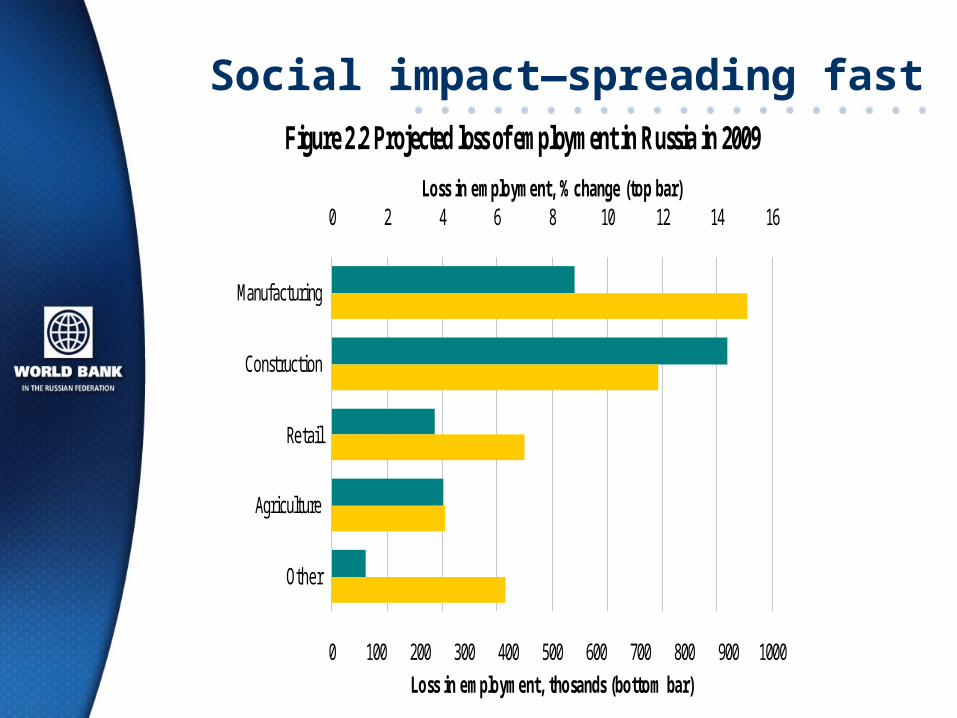
Social impact—spreading fast
Figure 2.2 Projected loss of employment in Russia in 2009
0 2 4 6 8 10 12 14 16
Manufacturing
Construction
Retail
Agriculture
Other
Loss in employment, % change (top bar)
0 100 200 300 400 500 600 700 800 900 1000Loss in employment, thosands (bottom bar)
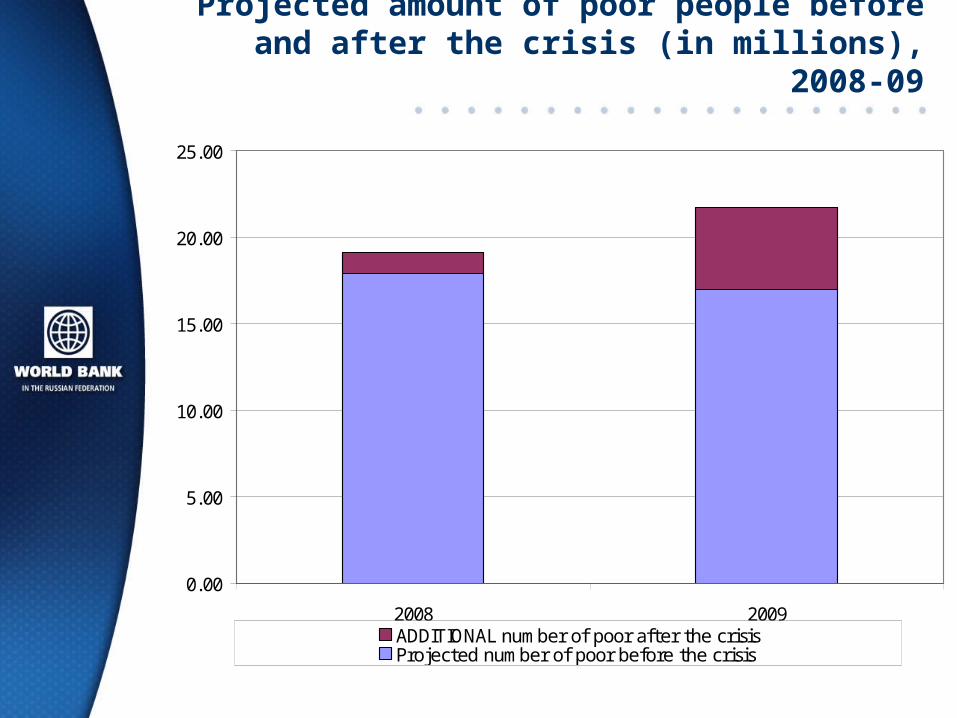
Projected amount of poor people before and after the crisis (in millions), 2008-09
0.00
5.00
10.00
15.00
20.00
25.00
2008 2009ADDITIONAL number of poor after the crisisProjected number of poor before the crisis
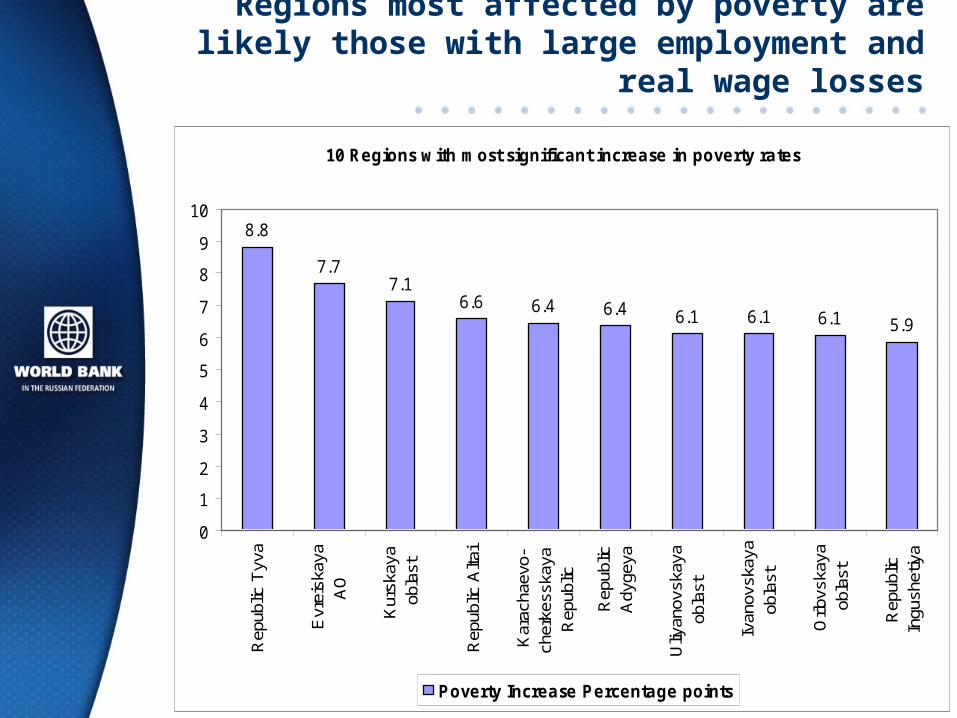
Regions most affected by poverty are likely those with large employment and real wage losses
10 Regions with most significant increase in poverty rates
8.8
7.77.1
6.6 6.4 6.4 6.1 6.1 6.1 5.9
0
1
2
3
4
5
6
7
8
9
10
Rep
ublic
Tyv
a
Evr
eisk
aya
AO
Kur
skay
aob
last
Rep
ublic
Alta
i
Kar
acha
evo-
cher
kess
kaya
Rep
ublic
Rep
ublic
Ady
geya
Uliy
anov
skay
aob
last
Ivan
ovsk
aya
obla
st
Orlo
vska
yaob
last
Rep
ublic
Ingu
shet
iya
Poverty Increase Percentage points
What more can be done?
• Targeting households, infrastructure, and small and medium enterprises
• Additional social package must be:
– Affordable
– Cost efficient in alleviating poverty
– Scaleable
– Using exisiting SSN mechanisms
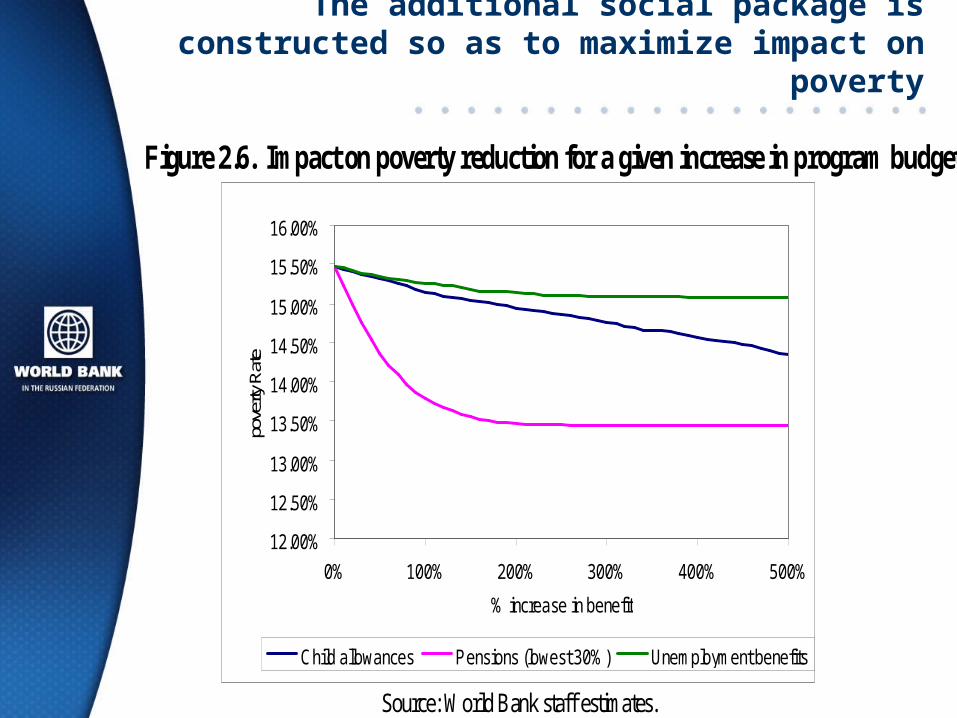
The additional social package is constructed so as to maximize impact on poverty
Figure 2.6. Impact on poverty reduction for a given increase in program budget
12.00%
12.50%
13.00%
13.50%
14.00%
14.50%
15.00%
15.50%
16.00%
0% 100% 200% 300% 400% 500%
% increase in benefit
pove
rty R
ate
Child allowances Pensions (lowest 30%) Unemployment benefits
Source: World Bank staff estimates.
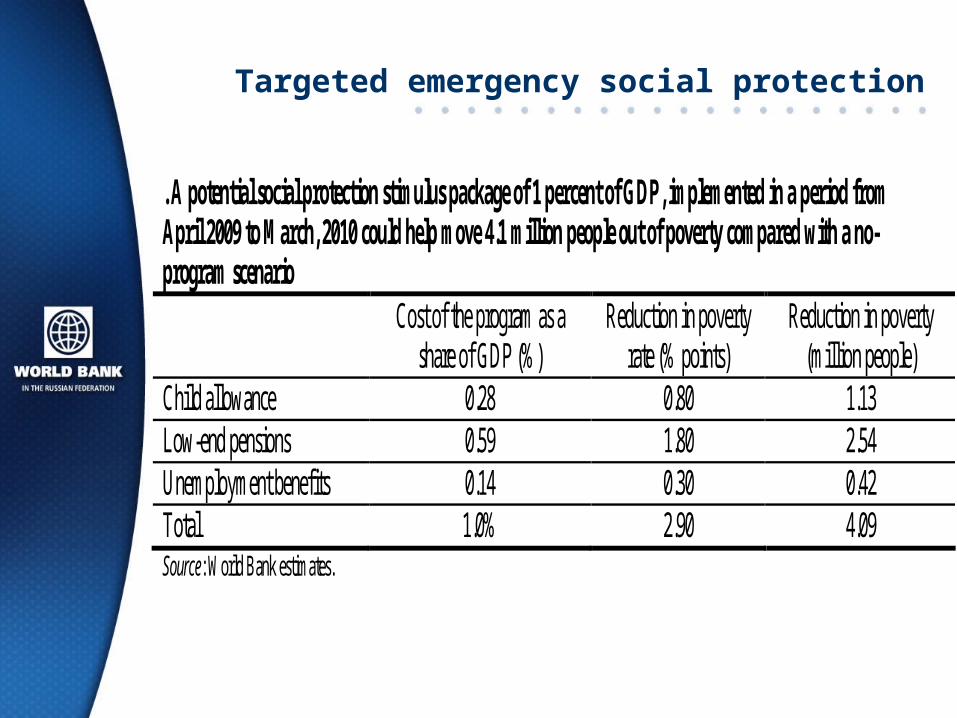
Targeted emergency social protection
. A potential social protection stimulus package of 1 percent of GDP, implemented in a period from April 2009 to March, 2010 could help move 4.1 million people out of poverty compared with a no-program scenario Cost of the program as a
share of GDP (%) Reduction in poverty
rate (% points) Reduction in poverty
(million people) Child allowance 0.28 0.80 1.13 Low-end pensions 0.59 1.80 2.54 Unemployment benefits 0.14 0.30 0.42 Total 1.0% 2.90 4.09 Source: World Bank estimates.
What more?
IN SUM, we propose in the short-term:
• Social protection package (1% of GDP)
• Infrastructure and SMEs (0.5% of GDP)
• And…
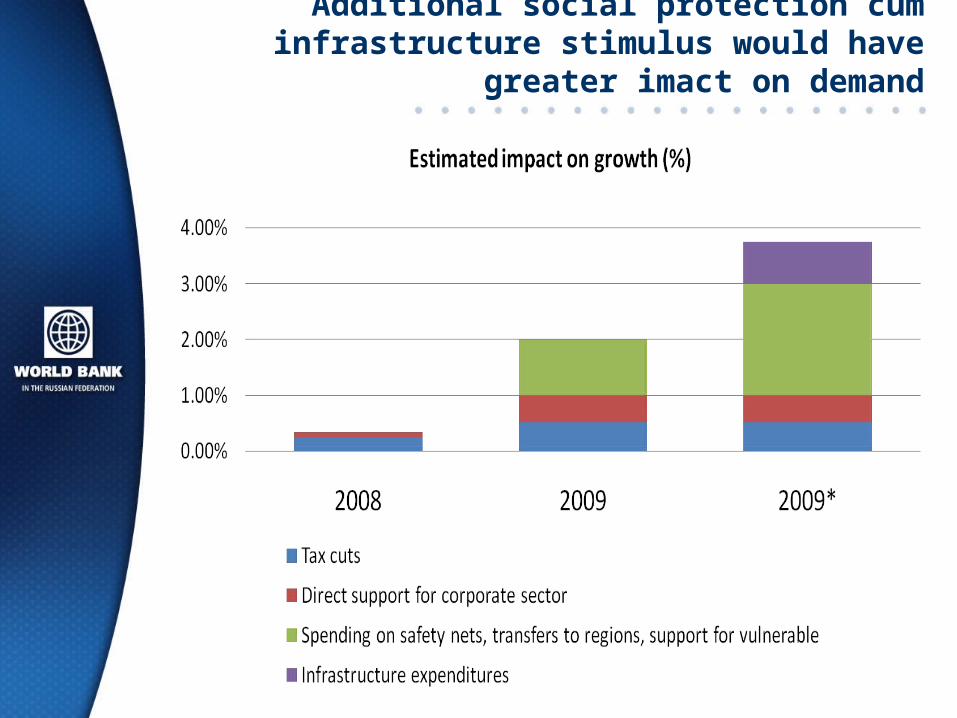
Additional social protection cum infrastructure stimulus would have greater imact on demand
Back to the future: Accelerating structural reforms
– Banking sector modernization– Public administration and governance
reform– Improving investment climate– Infrastructure – WTO agenda– Improving effectiveness and targeting of the
safety net
DOWNSIDE RISKS FOR THE WORLD ECONOMY AND RUSSIA REMAIN
• Social impact and social tensions
• Second round effect on financial sector
• Prolonged depression of global demand
• Therefore:– policy must be vigilant, flexible and ready to
respond quickly – In a downside scenario, well designed and
implemented public works programs may be needed.
• Relevance for other countries?