Embed Size (px)
Citation preview
ROOT GROWTH DYNAMICS AND CONSTRAINTS ON ABOVE GROUND GROWTH AND YIELD OF WALNUTS Bruce Lampinen, Louise Comas, Loreto Contador, Janine Hasey, Carolyn DeBuse, John Edstrom, Sam Metcalf, and William Stewart ABSTRACT There are three components to this project. The first is a minirhizotron root growth study that was installed to monitor seasonal root growth patterns in an existing Chandler pruning and irrigation trial. The peak in root growth occurred in late June in both the fourth and fifth growing seasons. In the fourth growing season, initiation of roots was greatest in the minimal pruned treatment and in the fifth growing season root initiation was greatest in the heavily pruned treatments. The peak of root growth in the minimally and heavily pruned treatments tended to be at a shallower depth compared to the peak in both the deficit and untrained/unpruned treatments. The root growth patterns observed were quite different from those in the Walnut Production Manual. Our results showed a single peak occurring right between the two peaks in the manual. The second component is a clonal rootstock replant trial that was initiated in a Howard orchard which had lost hundreds of trees to the yellow Howard problem. The third component is a a new experiment that was planted in the winter of 2013 which is looking at different rootstock and scion interactions as influenced by irrigation with the goal of understanding the yellow Howard problem. These experiments are providing some of the first field level observations of root growth patterns in walnut orchards over the season as well as with depth. PROBLEM AND ITS SIGNIFICANCE Optimization of walnut management under current and future climates requires better knowledge of root growth dynamics and root growth interactions with aboveground growth. Several current problems in walnut cultivation, such as canopy yellowing in years with wet springs and increased pathogenesis of soil borne pathogens with soil moisture (Lampinen et al., 1994), may be due to constraints on fine root growth and functioning. In Yuba and Sutter Counties where the yellowing problem was acute in 2011, yellow-leafed trees comprised 30% of many orchards. Observations collected during the 2006 and 2011 season suggest that yellow-leafed trees either had overall stunted root systems or lacked ephemeral fine roots that function in nutrient uptake and appeared unable to resume growth within the same growing season after wet spring conditions ceased (see Fig. 1). There is a need to understand if root growth (or subsequent re-growth if spring roots are lost to wet conditions) is genetically controlled by rootstocks, scions, or interactions between rootstocks and scions to insure that proper recommendations are made for new plantings of current and new clonal rootstocks and scions. Better information of root dynamics could open possibilities of making a broad range of advancements to orchard management as well as provide solutions for current problems such as the yellowing Howard problem.
California Walnut Board 171 Walnut Research Reports 2013
Patterns of walnut root growth commonly found in text books are based on limited data sets (e.g. Root Physiology and Rootstock Characteristics chapter in Walnut Production Manual, 1998) and likely vary for different cultivars, management, and sites. Fundamental aspects of environmental and plant controls over root dynamics and function have begun to be explored (Tierney et al., 2003; Comas et al., 2005; Basile et al., 2007) but many open questions remain especially on conditions that constrain root growth (Basile et al., 2007; Comas et al., 2010). Recent advances in techniques have made it easier to study roots (e.g. Comas et al., 2000; Zeng et al., 2008). This project provides actual root growth data for walnuts under field conditions as influenced by pruning treatments, soil moisture, and temperature. OBJECTIVES Using one existing walnut trial, one cooperating grower orchard and one new experiment, we propose to address the following questions:
1. Is there plasticity in the seasonal timing of root growth to canopy and irrigation management? Is the timing of root growth responsive to plant demands or constrained by soil moisture and temperature? (added a minirhizotron study in 2011 to an on-going pruning + irrigation trial at Nickels Soil Lab)
2. Is the degree of canopy yellowing determined by the scion? (grafting 3 scions in 2011 on previously yellow Howard trees in a Howard orchard planted in 2005 with a cooperator in Sutter County). This objective was modified since the original yellow Howard tree root systems were compromised enough that the grafts would not take. The objective was changed to a yellow Howard replant trial in the same orchard with 20 individual tree replications each of Paradox seedling, RX1, Vlach and VX211 rootstocks which were fall budded to Howard in 2013.
3. Is canopy yellowing after wet springs due to root losses in saturated soils and/or constraints on root growth? Is the timing and quantity of root growth (and re-growth if root death occurs from wet springs) determined by rootstocks, scions, or interactions between rootstocks and scions? Do root dynamics vary among rootstocks differing in vigor and Phytophthora resistance? Is the sensitivity to yellowing of particular scion/rootstock combinations due to restrictions in their graft union (i.e. do rootstocks/scion combinations differ in hydraulic conductance across their graft union)? (new experiment at the Plant Sciences department field facility was planted in March 2013).
PROCEDURES Experiment 1: This part of the project was overlaid on an existing project funded as part of the Orchard Management Project (Debuse, Edstrom, Hasey and Lampinen- Walnut Hedgerow Pruning and Training Trial). The current project added minirhizotron camera assessment of root growth in the Chandler pruning and irrigation trial that was planted in 2008. In March 2011, minirhizotron tubes were installed in the Chandlers on seedling Paradox rootstock under three pruning treatments (unpruned, minimally and heavily pruned) with conventional irrigation and one treatment of minimally pruned trees under deficit irrigation at Nickels Soil Lab (55” tubes; 4 treatments x 5 blocks x 2 tubes = 40 tubes). Root observation tubes 55” long were installed in
California Walnut Board 172 Walnut Research Reports 2013
this experiment because this orchard has trees planted on a 12” berm and because pruning and irrigation in other systems have been show to affect the vertical distribution of roots down to 3’ (Comas et al., 2005). Root growth in the soil berm and down to a soil depth of 24” will be monitored. Two trees in each treatment (total of 8 trees) also have soil temperature and moisture monitored at three depths (12, 24 and 36”) adjacent to minirhizotron tubes. Aboveground measures taken as part of the existing experiment (canopy light interception, midday stem water potential, trunk growth, and yield) will be related to root growth patterns. Experiment 2: In 2011, scion growth and signs of yellowing were monitored on new grafts on trees that had yellow canopies in 2010 in a 65 acre 5-year-old Howard orchard in Sutter County. Yellow trees in this orchard were determined to have limited fine and woody roots in 2010. A minimum of eighteen trees of uniform size with yellow canopies in 2010 were randomly selected and grafted in 2011 with one of three scions: Howard, Chandler and Tulare. The goal is to see if any of these scions grow better on Paradox rootstock where Howards were previously yellow and stunted. The root systems in this trial proved to be too compromised to support the scion growth so this experiment was abandoned. Instead, a trial was initiated in the same Howard on Paradox orchard which was planted in 2005 and has lost hundreds of trees to the yellow Howard problem. Twenty individual tree replications were planted in March 2013 with each of four rootstocks (Paradox seedling, RX1, Vlach and VX211). They were budded in the fall of 2013.. Experiment 3: A new experiment to quantify scion growth as well as root growth with a minirhizotron camera for Howard and Chandler grafted on VX211, RX1, Northen California Black, and seedling Paradox rootstocks, growing under conventional and wet spring soil conditions was planted in March 2013 (see Fig. 10 for site map). Trees were grown in a commercial nursery and were planted in February 2013 at the UC-Davis Plant Sciences experimental fields. Root growth is being monitored in minirhizotron tubes (3’ tubes; 2 tubes x 5 blocks x 8 scion/rootstock combinations x 2 treatments = 160 tubes). Root growth down to a soil depth of 24” is monitored. The experimental unit for each scion/rootstock combination and treatment in each block is a group of 4 trees with the middle two trees designated as experimental trees and one buffer tree on either end. A buffer row was planted on either side of the experiment. Canopy development will be followed through the season using the mobile platform light bar starting in 2014. Stem water potential will be measured throughout the season. Onset of canopy yellowing will be monitored on a weekly basis. Trunk diameter will be measured the first spring and each fall thereafter. Three Howard on seedling Paradox under conventional and wet conditions (6 trees in total) will have soil temperature and moisture monitored at three depths each, adjacent to the minirhizotron tubes. Flushes of root growth will be related to aboveground growth and water status. The experiment will be followed for two years. At the end of two years, one tree of each treatment and block (80 trees total) will be excavated and a 3’ wide 4’ deep soil profile will be mapped for fine and woody root distribution. Eight seedlings of Howard, Chandler and Tulare grafted on VX211, RX1, J. hindsii, and seedling Paradox rootstocks (12 scion/rootstock combinations) will be grown for one year in a random arrangement on end rows of the larger experiment with one buffer tree at the end of each row. These trees will be harvested at the end of the second year for measurements of stem hydraulic conductance above, below and across the graft union to determine if rootstock, graft union, or scion hydraulic conductance limits hydraulic conductance of the tree.
California Walnut Board 173 Walnut Research Reports 2013
Because there was a large amount of variability in tree size as received from the nursery, a decision was made to concentrate on establishing trees in 2013 and not to impose differential irrigation treatments until the 2014 season. In addition, to variability in tree size, many of the guard trees had to be planted as clonal rootstocks and field grafted during the 2013 season. Art Ruble from Dave Wilson Nursery worked to teach us how to do in-season green grafting. This technique can be done from about June through July or even into August with success. The technique is essentially analogous to using normal dormant grafts but instead currently season shoots (from at least 16” back from the growing tip) are used for grafting. A piece of green shoot with two to three buds is grafted and then immediately completely wrapped with Buddy Tape (Shigyo Company, 12335 Viking Way, Truckee, CA 96161) or painted with a solution of Doc Farwell’s Seal and Heal (Farwell Products, Wenatchee, WA 98801) diluted 1:1 with water to keep them from drying out. We had a higher success rate with Buddy tape than with Doc Farwell’s Seal and Heal. These grafts started growing in as little as 7 days. Three Irrometer dataloggers (each with seven Watermark soil moisture sensors at 8, 16 and 24” depths, and one temperature sensor at 16” depth) were installed in three reps of the Howard on Paradox seedling normal water treatments. In addition, three irrometer dataloggers with similar configurations were installed in three reps of the Howard on seedling Paradox excess water treatments. Watermark and soil temperature probe configurations are shown in Fig. 11. In addition to these loggers, three eKo wireless irrigation controllers with three Watermark sensors on each were installed in two reps with sensors again in the Howard on Paradox seedling normal and excessive water treatments. Soil moisture data from these eKo nodes can be accessed via the internet. In addition, latch valves were installed to allow control of the irrigation system from the internet or from an iPhone. An additional experiment was carried out in the guard rows on the east and west edge of the trial as well as near the southern edge of the trial. This consisted of four treatments with different heading heights at the time of planting. T1, T2, T3 and T4 were cut to approximately 3, 6, 9 or 12 buds (left full height from the nursery) respectively. These treatments were repeated 3 times on Howard on Northern California Black, 8 times on Chandler on Northern California Black, 2 times on Tulare on Northern California Black and 2 times on Tulare on VX211. The uneven numbers of reps on the different rootstock and scion combinations are because these were the only trees we could get to fill in these guard rows. Measurements described above (height, distance to each internode and the number of leaflets at each position were also carried out on the height of heading trial. RESULTS AND DISCUSSION Experiment 1. In 2013, midday stem water potential tended to be the least stressed in the unpruned treatment on most dates and the minimally pruned deficit tended to be the most stressed but there were no significant treatment differences on any date in 2013 (Fig. 1). Root growth was extensive in all of the treatments and it appeared that the depth of the tubes captured the range of depth of root growth since root growth ceased near the lowest tube depth in 2011 (Fig. 2). The root growth patterns with depth in all treatments tended to have two peaks in 2011 (Fig. 2). This may have been due to the placement of the minirhizotron tubes in relation to
California Walnut Board 174 Walnut Research Reports 2013

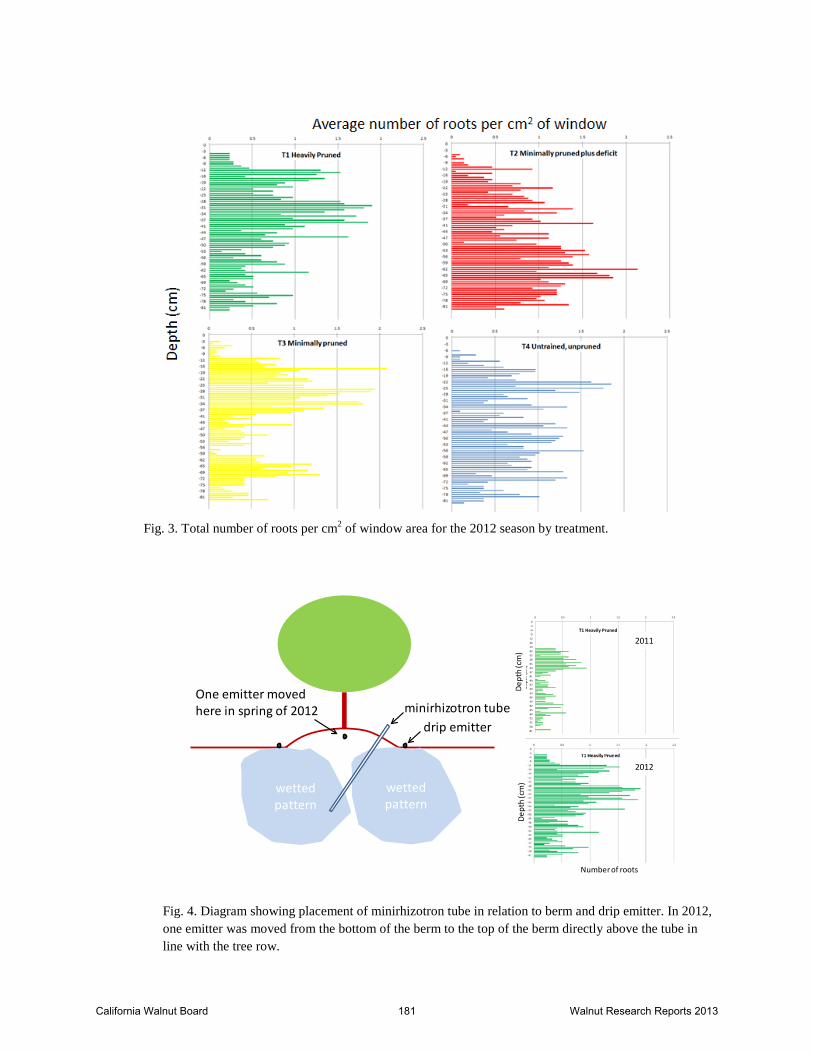
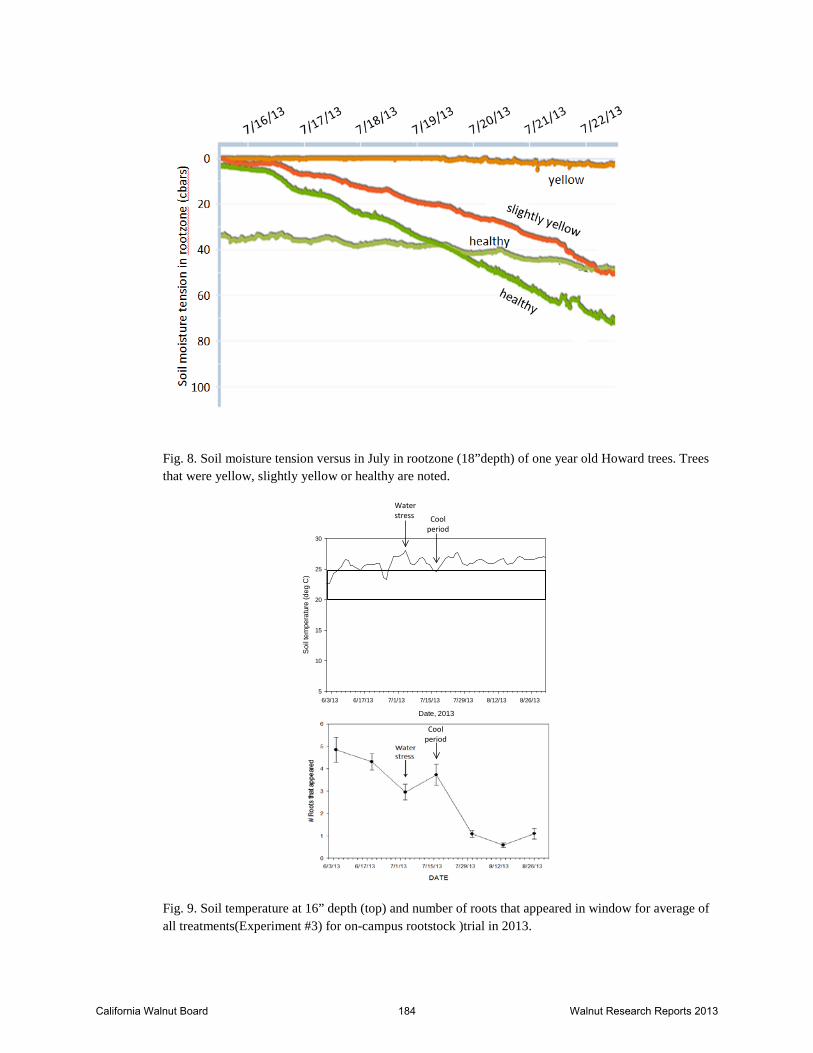
the berm and the double line drip irrigation system (Fig. 4). This likely resulted in the minirhizotron tube crossing from the influence of the drip emitters on one side of the berm to the influence of those on the other side of the berm. In 2012, one emitter was moved to the top of the berm to wet the area in the middle (Fig. 4). This appeared to eliminate the problem to a large degree (Figure 2). The peak in root production occurred in late June in 2011 and 2012 and was highest for the minimal pruned treatment in 2011 and for the heavily pruned treatment in 2012 (Fig. 3). The minimal treatment with deficit (T2) tended to have a slighter later date of peak root production in 2012 and root production continued into fall at a slightly higher rate than in the other treatments (Fig. 3). In general, root growth tended to be shallower in the minimal and heavily pruned treatments compared to the minimal pruned plus deficit and untrained/unpruned treatments win 2012 (Fig. 3). Root images for the 2013 season had not been processed at the time of report writing since we decided to concentrate on the images from the on-campus trial first (see results for Experiment 3). Temperatures in May and early June 2011 were unusually cool and skies were largely overcast so soil temperature warming was likely later than normal under these conditions. Soil temperature patterns over the season were similar for the different treatments in 2011 (Fig. 5). The fastest rate of increase in soil temperature occurred during June, the same period when secondary growth is increasing. Based on published walnut root growth data, the maximum root growth occurred at 22°C (72°F) (Kuhns et.al, 1985) and 24°C (75°F)(Haas, 1939). Soil temperatures at all depths reached 22°C by early June and were in the 22-24°C range only for a brief period before remaining above 24°C until the end of September in 2011 (Fig. 6). In 2012, mid-summer soil temperatures were somewhat lower than in 2011, likely because of the increased shading of the soil surface that occurs with increasing canopy growth (Fig. 7). In 2012, soil temperatures reached 22°C in early May and stayed in the 22-24°C range for a substantially longer period of time and were really only above the ideal range from mid-July through August (Fig. 7). In 2013, the root zone soil temperature was in the 22-24°C from early May through mid-September (Fig. 8). As midday canopy light interception increased from ~40% in 2011 to 50-55% in 2012 and to 60-65% in 2013 the soil temperatures continued to decline until they reached the ideal 22-24°C range by 2013. These data suggest that high soil temperature may be limiting root growth mid-summer in years 1-5 in a drip irrigated orchard such as this. Excessive soil temperatures may be a factor in establishment of walnut orchards until canopy cover provides shade to keep soil temperatures moderated during mid-summer. Experiment 2: In spring 2011, ten own rooted Howard trees were planted in sites where yellow Howard trees had been removed in a Sutter County and Yuba County site. They all survived although most have grown slowly and were pruned back in 2012 to form a strong trunk. In fall 2010, several yellow Howard trees in a similar condition were selected to be grafted in spring 2011. In spring 2011, these trees varied from dead to healthy so instead we selected 16 trees that had healthy Paradox suckers in the spring. Five trees each were grafted to Chandler and Tulare scions and six trees grafted to Howard scions in the spring. Most grafts failed and suckers collapsed. Apparently, even though the suckers appeared healthy in the spring, the root systems were too compromised to sustain the grafts.
California Walnut Board 175 Walnut Research Reports 2013

The 2013 Howard clonal replant trial results are shown in Table 1. By Dec. 2013, trees on Vlach had the largest circumference and were significantly larger than the VX211 and Paradox seedling (Table 1). The greatest increase in circumference from June to December 2013 was in Vlach and VX211 (Table 1). Twenty percent of the Paradox seedling trees died while none of the clonal rootstocks were lost (Table 1). Experiment 3- This experiment was planted in March 2013. The soil is a Rincon silty clay loam and tree spacing is 12’ down the tree row and 15’ between rows. The trial was planted at a high density because the plan is to run the trial for about 3 years only. The main trial has six replications of each of 14 treatment combinations. Because of the great variability in tree size as received from the nurseries, water management was quite difficult. Initially, the experiment was set up with three irrigation sets but because they had different numbers of trees in one of the three irrigation sets, these trees received approximately 20% more water through June (three irrigation events). At this time, the sprinkler heads were changed to ones with smaller output to allow the entire experiment to be irrigated at one time which lead to much better water distribution uniformity across the trial. However, the 4 rows that received the 20% additional water for the first three irrigations did not grow nearly as well as the rest of the trial. Many of the trees stopped growing from excessive wetness in the root zone and some did not grow again all season. Fig. 8 shows the data from 4 soil moisture sensors at a depth of 18” in the rootzone beneath trees that were healthy, slightly yellow or yellow. The wetter the soil was, the worse the tree growth. Differential irrigation treatments will be implemented in the spring of 2014. The excess water treatment will use the irrigation system to mimic rainfall patterns that occurred during previous seasons when the yellow Howard problem was prevalent. In early October 2013, we measured the height, distance to each internode, and the number of leaflets at each position on all data trees in the trial (total of 166 trees). These data are currently being analyzed in relation to soil moisture and plant water potential data to assess the impacts of both excessively wet conditions as well as dry conditions on internode elongation and cessation of growth in first year walnuts. Minirhizotron measurements were started in June 2013 and done approximately every two weeks through November and then frequency was reduced to once per month over the winter. Reading will resume every other week in April, 2015. The average root growth for Experiment 3 for all treatments for the 2013 season is shown in Fig. 9- bottom graph. Root growth during the June- September period was likely impacted by the soil temperatures which were above the optimal during this period (Fig. 9- top graph). The dip in root growth in early July was likely due to a period of water stress that was imposed to try to slow growth of the larger trees and allow smaller ones to catch up. For the height of heading trial, first year results were quite variable due to the fact that half of the trees were in one of the four rows impacted by the excess early season water. However, it did not appear that heading the trees had any beneficial impact in overcoming the water problems. A
California Walnut Board 176 Walnut Research Reports 2013

headed and unheaded tree from the row that received excess water are shown in Fig. 13. The headed and unheaded tree both were stunted and grew to the same final height. The four heading heights for a rep of the Chandler on Northern California Black is shown in Fig. 14. The unheaded tree was the tallest while the three trees that were headed to different heights were all similar in height. Finally, both reps of the unheaded and trees that were headed to 3 buds are shown in Fig. 15. The combined data for all varieties and rootstocks is shown in Table 2. The trees that were headed to 3 buds were significantly shorter than the other three treatments while the other three treatments were not significantly different in height (Table 2). PRELIMINARY CONCLUSIONS This trial is providing root growth data for walnut that appear to contradict the root growth data in the Walnut Production manual. The peak in root growth in both seasons occurred in late June and we did not see a substantial later season peak in root production. There is some indication that excessive soil temperatures may be playing a role in limiting root growth, particularly in young walnut orchards. Water management during late May through early July may be particularly critical in young, developing orchards since root and canopy growth are both occurring at a rapid rate during this period. It is unclear how these conditions would differ with flood versus sprinkler irrigation compared to the double line drip used in the current study. More research is needed to investigate the role of different types of irrigation systems on soil temperature and root growth. The yellow Howard clonal rootstock trial has just completed the first season and will be continued. After one year, the growth of the rootstocks ranked Vlach>RX1>VX211>Paradox seedling. Twenty percent of the Paradox seedling died during the first season while none of the clonal selections died. Preliminary results from the height of heading trial suggest that under the conditions of this trial, there is no benefit associated with heading the trees at the time of planting. The concept of heading the trees is based on the idea that you are bringing the shoot and root into balance due to the loss of roots that occurs during the harvest process at the nursery. However, the initial root growth occurs largely from stored carbohydrate reserves and when you head the tree, much of this stored reserve is removed.
California Walnut Board 177 Walnut Research Reports 2013
REFERENCES
Basile B, Bryla DR, Salsman ML, Marsal J, Cirillo C, Johnson RS, Dejong TM. 2007. Growth patterns and morphology of fine roots of size-controlling and invigorating peach rootstocks. Tree Physiology 27(2): 231-241.
Comas LH, Anderson LJ, Dunst RM, Lakso AN, Eissenstat DM. 2005. Canopy and environmental control of root dynamics in a long-term study of concord grape. New Phytologist 167(3): 829-840.
Comas LH, Bauerle TL, Eissenstat DM. 2010. Biological and environmental factors controlling root dynamics and function: Effects of root ageing and soil moisture. Australian Journal of Grape and Wine Research 16: 131-137.
Comas LH, Eissenstat DM, Lakso AN. 2000. Assessing root death and root system dynamics in a study of grape canopy pruning. New Phytologist 147(1): 171-178.
Hass, A.R.C. 1939. Root temperature effects on the growth of walnut and avocado seedlings. California Avocado Association 1939 Yearbook.
Kuhns, M.R., M.R. Garrett, H.E. Teskey, R.O. and T.M. Hinckley. 1985. Root growth of black walnut trees related to soil temperature, soil water potential, and leaf water potential. Forest Science, 31: 67-629.
Tierney GL, Fahey TJ, Groffman PM, Hardy JP, Fitzhugh RD, Driscoll CT, Yavitt JB. 2003. Environmental control of fine root dynamics in a northern hardwood forest. Global Change Biology 9(5): 670-679.
Zeng G, Birchfield ST, Wells CE. 2008. Automatic discrimination of fine roots in minirhizotron images. New Phytologist 177(2): 549-557.
California Walnut Board 178 Walnut Research Reports 2013

Table 1. Diameter of budded rootstock in June and December 2013 as well as percent survival after first growing season for Experiment #2 (yellow Howard replant trial near Yuba City).
Rootstock
June 11, 2013
diameter (cm)
December 9, 2013
diameter (cm)
% change in diameter
% survival
Vlach (yellow) 1.64 a 1.79 a 9.1 a 100 a
RX1 (red) 1.67 a 1.68 ab 0.6 b 100 a
VX211 (blue) 1.46 b 1.60 b 9.5 a 100 a
Paradox seedling (white) 1.24 c 1.24 c 0.6 b 80 b
Table 2. 2013 height of heading trial results for all varieties and rootstocks combined.
Heading treatment
Height at planting
(mm)
Height Oct. 2013
(mm)
Diam. at planting
(mm)
Diam. Oct. 2013
(mm)
Number of shoots that broke
T1- 3 buds 24.0 d 94.7 b 33.2 a 43.7 a 3.3 b
T2- 6 buds 33.7 c 114.0 a 34.1 a 47.9 a 5.5 a
T3- 9 buds 45.5 b 124.1 a 32.6 a 56.8 a 5.6 a
T4- 12 buds 52.3 a 130.6 a 34.2 a 47.1 a 6.7 a
California Walnut Board 179 Walnut Research Reports 2013

Average number of roots per cm2 of window
Dept
h (c
m)
0 0.5 1 1.5 2 2.50
-3-6-9
-12-16-19-22-25-28-31-34-37-41-44-47-50-53-56-59-62-65-69-72-75-78-81
p (
)
T1 Heavily Pruned
Fig.1. Midday stem water potential for pruning treatments in Experiment #1 for the 2013 season. There were no significant treatment differences on any date in 2013.
Fig. 2. Total number of roots per cm2 of window area for the 2011 season by treatment.
California Walnut Board 180 Walnut Research Reports 2013
0 0.5 1 1.5 2 2.50
-3-6-9
-12-16-19-22-25-28-31-34-37-41-44-47-50-53-56-59-62-65-69-72-75-78-81
Dep
th (c
m)
T1 Heavily Pruned
wetted pattern
wetted pattern
minirhizotron tubedrip emitter
Dept
h (c
m)
Number of roots
One emitter moved here in spring of 2012
Dept
h (c
m)
2011
2012
Fig. 3. Total number of roots per cm2 of window area for the 2012 season by treatment.
Fig. 4. Diagram showing placement of minirhizotron tube in relation to berm and drip emitter. In 2012, one emitter was moved from the bottom of the berm to the top of the berm directly above the tube in line with the tree row.
California Walnut Board 181 Walnut Research Reports 2013
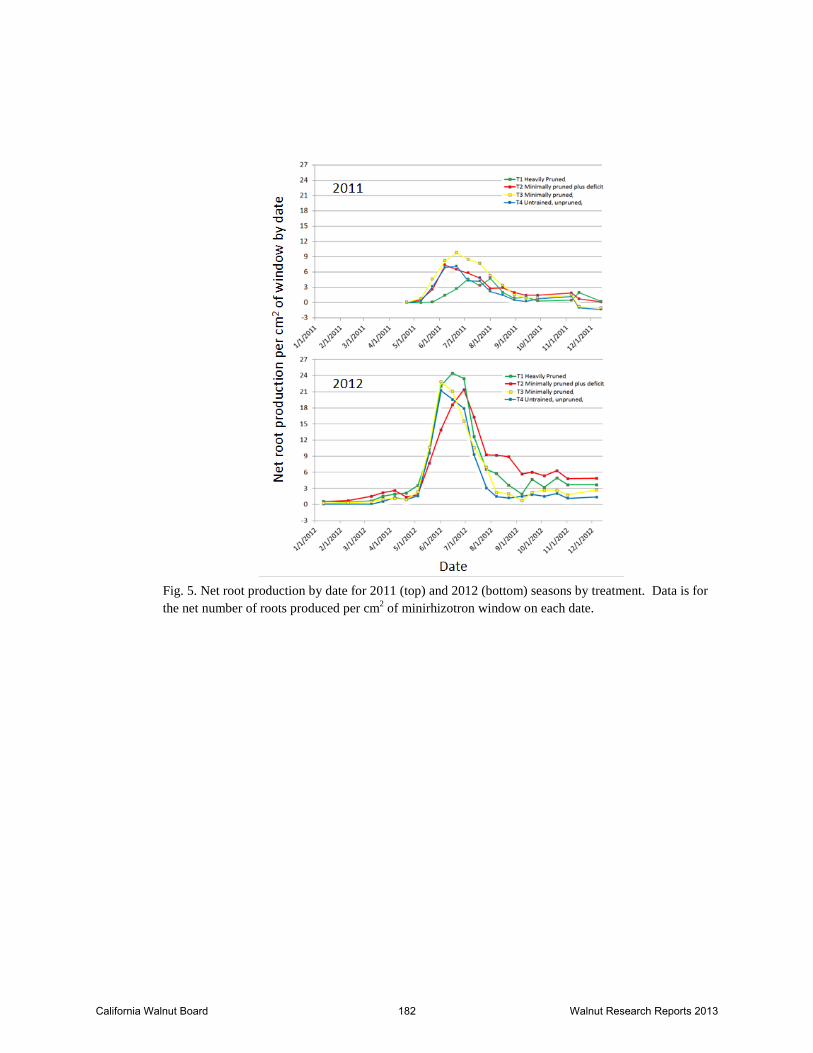
Fig. 5. Net root production by date for 2011 (top) and 2012 (bottom) seasons by treatment. Data is for the net number of roots produced per cm2 of minirhizotron window on each date.
California Walnut Board 182 Walnut Research Reports 2013

T3- Minimal pruned
Date, 2011
1/1/2011 3/1/2011 5/1/2011 7/1/2011 9/1/2011 11/1/20110
5
10
15
20
25
30 T4- Untrained, unpruned
1/1/2011 3/1/2011 5/1/2011 7/1/2011 9/1/2011 11/1/2011
Soil
tem
pera
ture
(deg
C)
0
5
10
15
20
25
30
122436
T2- Minimal pruned plus deficit
0
5
10
15
20
25
30T1- Heavily pruned
0
5
10
15
20
25
30
T1- heavily pruned
Soil
tem
pera
ture
(deg
C)
0
5
10
15
20
25
30 T2- minimally pruned plus deficit
0
5
10
15
20
25
30
T3- minimally pruned
12/1/2011 2/1/2012 4/1/2012 6/1/2012 8/1/2012 10/1/20120
5
10
15
20
25
30 T4- untrained, unpruned
12/1/2011 2/1/2012 4/1/2012 6/1/2012 8/1/2012 10/1/20120
5
10
15
20
25
30
122436
Date, 2012
Fig. 6. 2011 seasonal pattern of soil temperature at depths of 12”, 24” and 36” adjacent to the minirhizotron tubes. Each line is the average of two temperature sensors for each treatment and depth. Lines at 22°C (72°F) and 24°C (75°F) bracket the temperature where maximum root growth occurs in walnut based on literature.
Fig. 7. 2012 seasonal pattern of soil temperature at depths of 12”, 24” and 36” adjacent to the minirhizotron tubes. Each line is the average of two temperature sensors for each treatment and depth. Lines at 22°C (72°F) and 24°C (75°F) bracket the temperature where maximum root growth occurs in walnut based on literature.
California Walnut Board 183 Walnut Research Reports 2013
Date, 2013
6/3/13 6/17/13 7/1/13 7/15/13 7/29/13 8/12/13 8/26/13
Soi
l tem
pera
ture
(deg
C)
5
10
15
20
25
30
Waterstress Cool
period
Cool period
Fig. 8. Soil moisture tension versus in July in rootzone (18”depth) of one year old Howard trees. Trees that were yellow, slightly yellow or healthy are noted.
Fig. 9. Soil temperature at 16” depth (top) and number of roots that appeared in window for average of all treatments(Experiment #3) for on-campus rootstock )trial in 2013.
California Walnut Board 184 Walnut Research Reports 2013
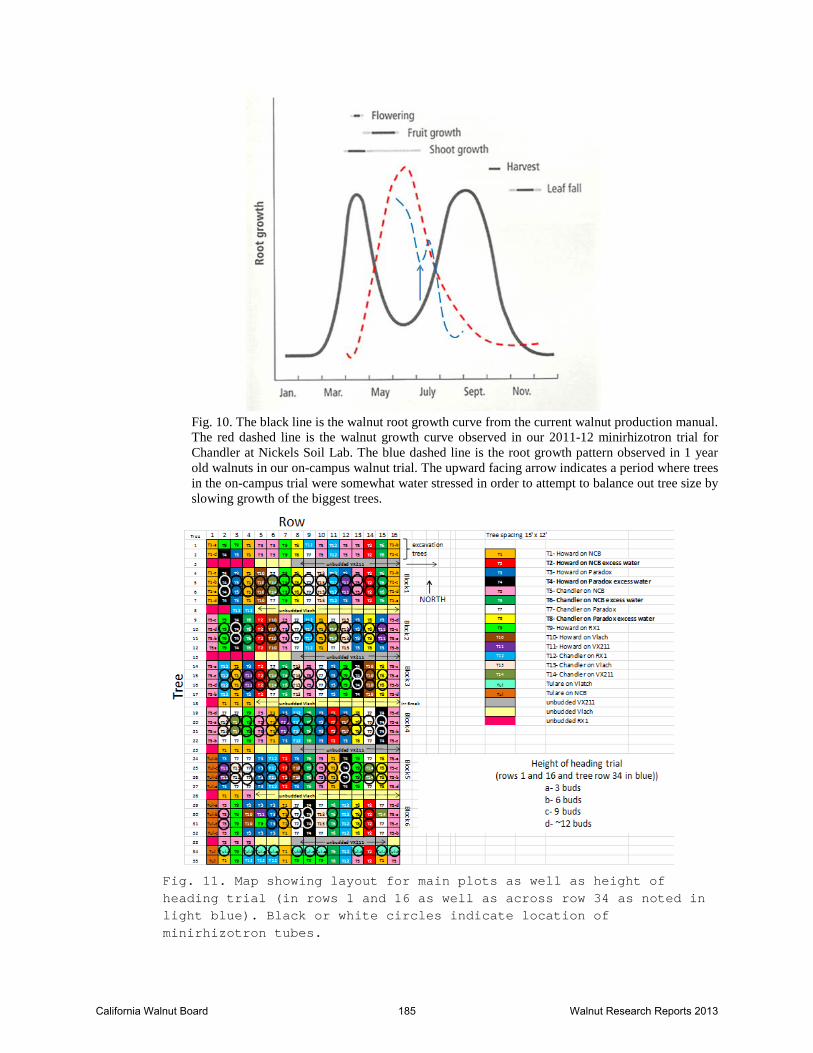
Fig. 10. The black line is the walnut root growth curve from the current walnut production manual. The red dashed line is the walnut growth curve observed in our 2011-12 minirhizotron trial for Chandler at Nickels Soil Lab. The blue dashed line is the root growth pattern observed in 1 year old walnuts in our on-campus walnut trial. The upward facing arrow indicates a period where trees in the on-campus trial were somewhat water stressed in order to attempt to balance out tree size by slowing growth of the biggest trees.
Fig. 11. Map showing layout for main plots as well as height of heading trial (in rows 1 and 16 as well as across row 34 as noted in light blue). Black or white circles indicate location of minirhizotron tubes.
California Walnut Board 185 Walnut Research Reports 2013
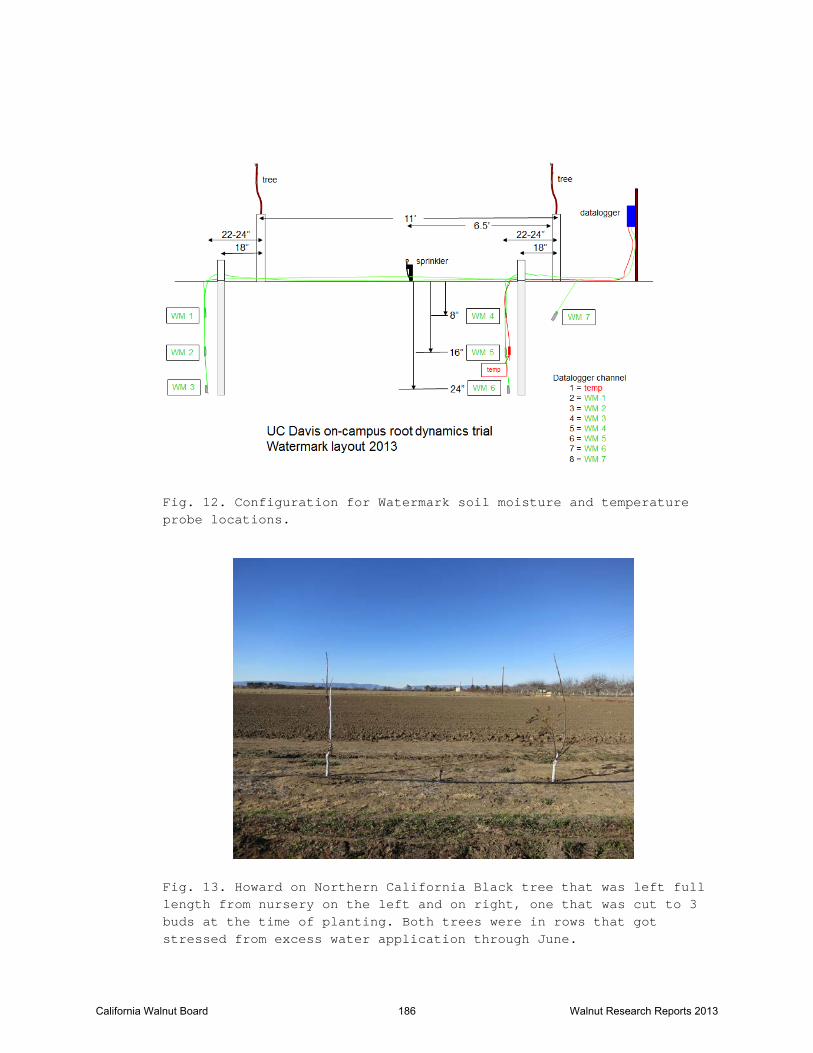
Fig. 12. Configuration for Watermark soil moisture and temperature probe locations.
Fig. 13. Howard on Northern California Black tree that was left full length from nursery on the left and on right, one that was cut to 3 buds at the time of planting. Both trees were in rows that got stressed from excess water application through June.
California Walnut Board 186 Walnut Research Reports 2013

Fig. 14. Chandler on Northern Califoria Black that were headed to different heights at planting as described.
Fig. 15. Tulare on Vlach that were left at height they arrived from nursery on left and trees that were headed to 3 buds on the right.
California Walnut Board 187 Walnut Research Reports 2013