Embed Size (px)
Citation preview
1
Côte d’Ivoire’s Binding Constraints to Economic Growth
A joint study prepared in by:
Government of Côte d’Ivoire and the Millennium Challenge Corporation
2015
Government of Côte d’Ivoire:
Alban Ahoure, Lead Economist Olivier Gaddah, Economist Aida N’Diaye, Côte d’Ivoire Team Lead
Groupe de Travail
Ministère auprès du Premier Ministre chargé du Budget (MPMB) Institut National de la Statistique (INS) Ecole Nationale de Statistiques et d’Economie Appliquée (ENSEA) Bureau National d’Etudes Techniques et de Développement (BNETD) Centre de Promotion des Investissements en Côte d’Ivoire (CEPICI) Chambre de Commerce et d’Industrie de Côte d’Ivoire (CCI-CI)
Millennium Challenge Corporation:
Brad Cunningham, Economist Carolyn Perrin, Economist Deborah Ou-Yang, Policy Advisor Melissa Adams, Gender and Social Inclusion Lead Kiari Liman-Tinguiri, Gender and Social Inclusion Zaidoon Khouri, Private Sector Lead David Weld, Country Team Lead With assistance from USAID: Lisa Ortiz, E3 Division Chief
Note: No views expressed should be considered official positions of any of the organizations with representation on the technical teams.
2
Table of Contents
Cote d’Ivoire Constraints Analysis - Executive Summary ......................................................................4
Cote d’Ivoire Constraints Analysis Full Report ................................................................................... 12
1. Background and Country Context .............................................................................................. 12
Geography and Demographics ...................................................................................................... 12
History of Economic Growth in Côte d’Ivoire ................................................................................. 12
Inclusiveness of Growth ................................................................................................................ 14
Economic Structure ....................................................................................................................... 15
Investment trends ......................................................................................................................... 17
Macro-Economic Management and Risk ....................................................................................... 18
Political Instability – A Historical Constraint................................................................................... 19
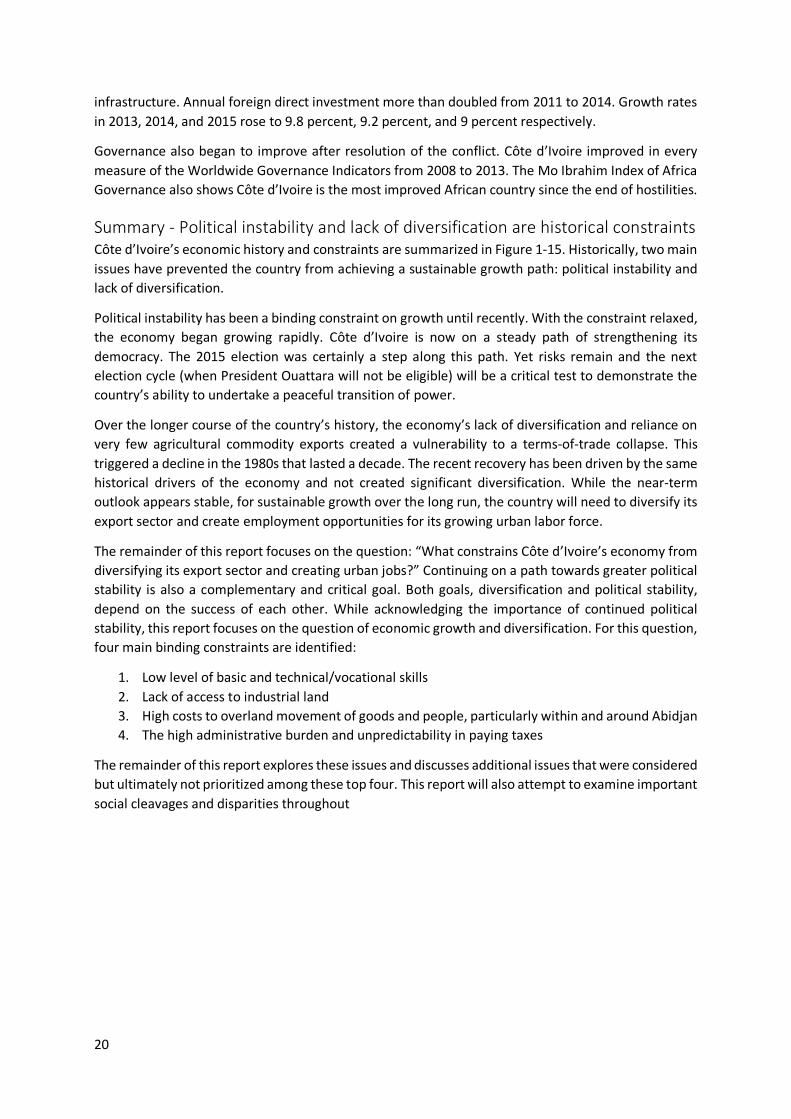
Summary - Political instability and lack of diversification are historical constraints ........................ 20
2. Access to Finance ...................................................................................................................... 22
History of Côte d’Ivoire’s Financial Sector...................................................................................... 23
Constraint indicators ..................................................................................................................... 23
Supporting institutions .................................................................................................................. 24
Conclusion .................................................................................................................................... 25
3. Human Capital .......................................................................................................................... 26
Côte d’Ivoire’s education overview ............................................................................................... 26
Testing education as a constraint to economic growth .................................................................. 27
Gender dimension of education constraint ................................................................................... 29
Health dimension of educational constraint .................................................................................. 30
Conclusion – Human capital is low and a constraint to investment and growth ............................. 31
4. Infrastructure ............................................................................................................................ 32
Road Transportation throughout Côte d’Ivoire .............................................................................. 32
Transportation within Abidjan ....................................................................................................... 34
Airports, Ports, and other transport connectivity .......................................................................... 35
Access to Electricity....................................................................................................................... 36
Access to Clean Water................................................................................................................... 38
Availability of Information and Communication Technology (ICT) .................................................. 39
Conclusion .................................................................................................................................... 39
5. Access to Land .......................................................................................................................... 40
High rationing of industrial and high prices in secondary markets ................................................. 40
Conclusion .................................................................................................................................... 41
6. Micro Risks and Taxation ........................................................................................................... 42
3
The de jure tax burden .................................................................................................................. 42
Tax Administration costs ............................................................................................................... 43
Conclusion .................................................................................................................................... 44
References ........................................................................................................................................ 45
4
Cote d’Ivoire Constraints Analysis - Executive Summary The Millennium Challenge Corporation (MCC) is a U.S. Government foreign aid agency whose mission is reducing poverty through economic growth in carefully selected countries that demonstrate a commitment to just and democratic governance, economic freedom, and investments in their own citizens. Cote d’Ivoire was selected as eligible for a Threshold Program by the MCC Board in December, 2014 and then a Compact in December, 2015. This report summarizes the constraints analysis process, country context, and four binding constraints to economic growth in Côte d’Ivoire.
The Constraints Analysis Process
The constraints analysis is conducted during the first phase of engagement between MCC and a partner country to identify the most binding constraints to private investment and entrepreneurship, which are thereby limiting economic growth. The constraints analysis report applies the growth diagnostics methodology, originally outlined by Hausmann, Rodrik, and Velasco (2005) which has since been adopted and further developed by MCC among other international organizations. The methodology looks for signals in a country’s economy that a particular input needed for growth is especially limiting – i.e., binding on such growth.
A joint MCC and Government of Côte d’Ivoire team conducted desk research, interviews, and consultations between February and July 2015 in Abidjan, Yamoussoukro, and Bouaké with government officials, civil society organizations, private sector firms, agricultural cooperatives, women’s groups, and other development partners. The Government of Côte d’Ivoire also created an advisory group (Groupe de Travail) comprised of representatives of various government ministries to provide the MCC and Côte d’Ivoire technical teams with regular guidance and feedback on the constraints analysis process and preliminary findings.
Country Context
The first step of undertaking a constraints analysis is to understand a country’s unique context. Each country’s individual growth history and challenge will inform the subsequent analysis of potential constraints.
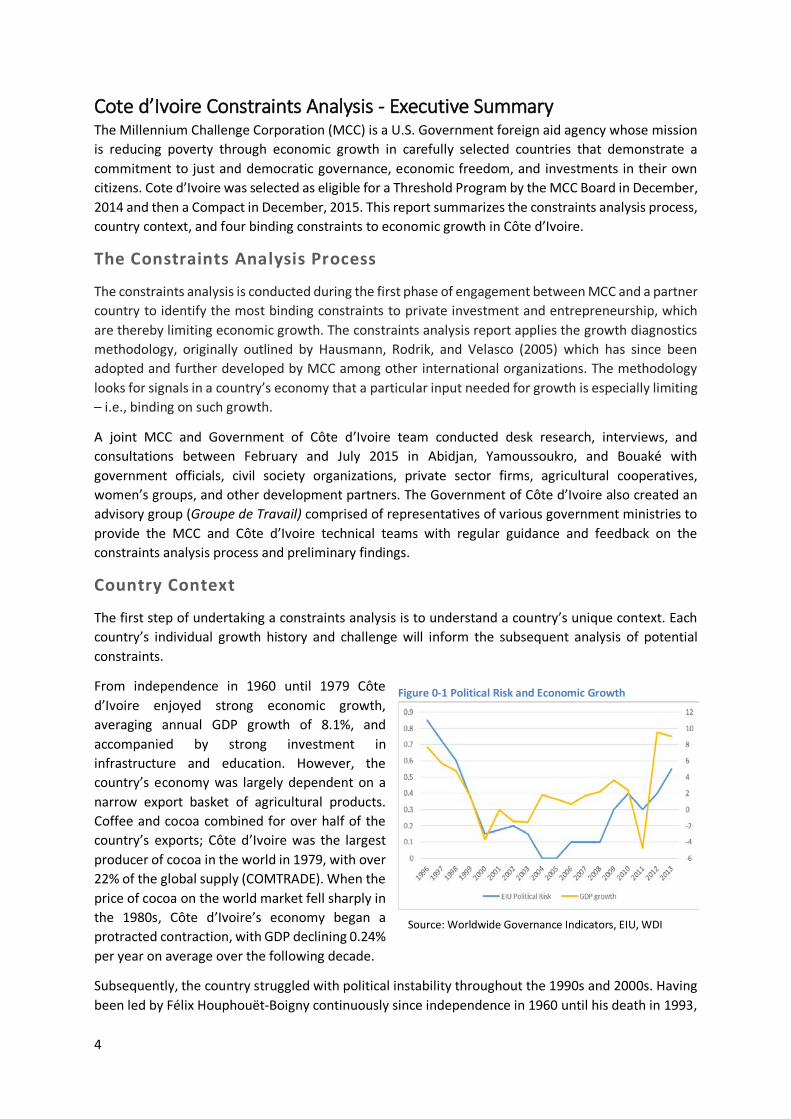
From independence in 1960 until 1979 Côte d’Ivoire enjoyed strong economic growth, averaging annual GDP growth of 8.1%, and accompanied by strong investment in infrastructure and education. However, the country’s economy was largely dependent on a narrow export basket of agricultural products. Coffee and cocoa combined for over half of the country’s exports; Côte d’Ivoire was the largest producer of cocoa in the world in 1979, with over 22% of the global supply (COMTRADE). When the price of cocoa on the world market fell sharply in the 1980s, Côte d’Ivoire’s economy began a protracted contraction, with GDP declining 0.24% per year on average over the following decade.
Subsequently, the country struggled with political instability throughout the 1990s and 2000s. Having been led by Félix Houphouët-Boigny continuously since independence in 1960 until his death in 1993,
Figure 0-1 Political Risk and Economic Growth
Source: Worldwide Governance Indicators, EIU, WDI
5
the country had not developed a long history of democratic transitions of power. In 1999, a military coup d’état overthrew the government and the country began a period of prolonged political instability. The instability deepened into a civil war and the division of the country between the north and the south from the end of 2002 until early 2007. Following a disputed presidential election in November 2010, in which the incumbent, Laurent Gbagbo, refused to acknowledge defeat to Alassane Ouattara, the country again fell into political instability. After six months of conflict, resulting in more than 1,000 deaths and the internal displacement of close to one million people1, resolution was reached and Gbagbo was removed from power in April 2011.
Political stability has improved following the settlement in 2012. The improved stability was further evidenced by a peaceful election in 2015. Improved stability together with strong prices for cocoa have allowed the country’s economy to begin to recover from years of decline. Growth rates have averaged 9% per year from 2012 to 2015.
While agriculture will continue to be an essential component of Côte d’Ivoire’s economy, the economy cannot grow while continuing to depend so heavily on agriculture commodities alone. Currently, cocoa accounts for approximately 35% of Côte d’Ivoire’s exports, which is a higher share than at any point during the 1960s and 1970s. While there has been some recent diversification into rubber, cashews, cotton, and bananas, export diversity remains low in Côte d’Ivoire, which exposes the country to risks from fluctuations in the prices of its main agricultural commodities. Cote d’Ivoire’s economy is also highly dependent on trade, with exports as a share of GDP at 43%. Because exports are both significant and concentrated in very few commodities, the risk to the economy from declining international prices for its exports is high.
As a result, continued structural transformation via the development of export-oriented industries and/or services that can compete internationally will be critical to diversify sources of foreign exchange, provide economic stability, and support future economic growth. Some of this transformation has begun, with ship repair, cosmetics, garments, and soap earning a growing (but still small) share of exports. A continued expansion of the manufacturing sector will also serve to create needed urban jobs to address growing urban poverty and unemployment.
Côte d’Ivoire’s economic decline from the 1980s through the 1990s dramatically increased the country’s poverty rate, from 10% in 1985 to 48.9% in 2008. Today, poverty is more prevalent in rural areas of the country, especially in regions in the northwest bordering Guinea and Mali and in the northeast bordering Burkina Faso and Ghana. However, the gap between rural and urban poverty has narrowed from 2008 to 2015, with urban poverty on the rise and rural poverty falling.2
Socioeconomic and gender based inequalities remain an important aspect of the national context.3 While Côte d’Ivoire has made multiple international commitments to improve the status of women and girls and has established government agencies to promote women’s rights, significant gender-based disparities remain. The World Economic Forum’s Global Gender Gap Report quantifies the magnitude of gender-based disparities across four key areas – health, education, the economy and politics. In the 2014 report, Côte d’Ivoire ranked 136 out of 142 countries worldwide, the second lowest rank in Africa and only slightly ahead of Iran.4 With regards to economic opportunities for women, the
2 2015 Household Survey 2 2015 Household Survey 3 République de Côte d’Ivoire. Analyse de la Situation de l’Enfant en Côte d’Ivoire, 2014. 4 World Economic Forum, Gender Global Gap Report, 2014
6
African Development Bank ranks Côte d’Ivoire 49th out of 52 African countries.5 The low social status of Ivorian women and girls is rooted in inequitable gender norms and was further exacerbated by the political crisis and its resulting gender-based violence, disruption of basic social services, and massive displacement of people.6
Binding Constraints to Growth
Building on the above understanding of Côte d’Ivoire’s economic context, the team identified four binding constraints to economic growth that, if alleviated, should provide greater resilience to commodity price swings and drive sustained reduction in poverty:
1. Low level of basic and technical/vocational skills 2. Lack of access to industrial land 3. High costs to overland movement of goods and people, particularly within and around Abidjan 4. The high administrative burden and unpredictability in paying taxes
1 - Low level of basic education and technical/vocational skills. Côte d’Ivoire’s educational system was weakened during the political instability of the late 1990s and 2000s. School enrollment and the quality of education declined. Among the French-speaking African countries that participated in the Analysis Programme of the CONFEMEN Education Systems (PASEC) test in 2008, Côte d’Ivoire scored the worst in Mathematics and below average in French. 7
Since 1980, no country with literacy rates as low as Côte d’Ivoire’s has achieved a GDP per capita higher than Côte d’Ivoire’s current level. Evidence on literacy rates from the 2014 national census confirms that Côte d’Ivoire’s education system is under achieving, with only 44 percent of the total population literate and significant gender disparity (51 percent men, 37 percent women8). The youth (age 16 – 24) literacy rate of 48 percent suggests the system is not improving rapidly.9
Analysis of the returns to education in Côte d’Ivoire suggests that educated workers are in high demand in the economy, with returns to education consistently above the world average over the last fifteen years. In the 2008 household survey, overall returns to education were 11.3 percent per additional year of schooling. Returns from higher education, at 25 percent, ranked in the 95th percentile among countries worldwide.10 Analysis of the 2012 employment survey confirmed that returns are highest in tertiary education, including technical/vocational education. During consultations, firms also frequently identified the need for technical/vocational skills.
Low literacy and numeracy and the poor performance of the primary and secondary education system may be an underlying contributor to the limited availability of university-educated and technically/vocationally trained workers in Côte d’Ivoire. Another possible contributor to low educational outcomes is the poor performance of Côte d’Ivoire’s health system. Life expectancy at birth is just over 50 years, and the burden of malaria and diarrhea are also above regional averages. These health issues may increase absenteeism and constrain student performance.
5 African Development Bank, African Gender Equality Index, 2015 6 République de Côte d’Ivoire, Analyse de la Situation de l’Enfant en Côte d’Ivoire 20147 http://www.confemen.org/wp-content/uploads/2013/09/RAPPORT_CI-final.pdf 7 http://www.confemen.org/wp-content/uploads/2013/09/RAPPORT_CI-final.pdf 8 Preliminary results, 2014 national census 9 2012 DHS survey 10 Worldwide sample compiled by Montenegro and Patrinos (2014).
7
Reforms aimed at improving Côte d’Ivoire’s education system are ongoing. Government spending in the sector has also increased in recent years, and the country recently announced a universal schooling initiative. To achieve this goal, the Government has planned to improve educational infrastructure and recruit 20,000 new teachers.11 These efforts have led to some improvement. Enrollment in primary education has increased from 74 percent in 2008 to 90 percent in 2014.12 But much work remains to be done; in 2014, enrollment in secondary education was only 40 percent.13
2 - Lack of access to industrial land. Much of the land in Côte d’Ivoire is managed under customary law and is owned communally. While there is a limited market for privately owned land in urban areas, the quantity of available land is insufficient to meet the needs of large industrial operations. Most manufacturing and industrial operations therefore lease land within industrial zones owned by the government.
The three industrial zones in Abidjan, in which most of the country’s industries operate, are at full occupancy. The government currently has more than 50 applications from businesses looking to invest within these zones that they cannot satisfy.14 Investment in large industrial projects have had to be turned away or delayed because of the unavailability of land. In response to high demand and to help pay for infrastructure maintenance within industrial zones, the government has increased the price per square meter to lease industrial land from less than $0.20 to over $6. This brings the official price of industrial land in line with regional comparators; however, the quasi-legal secondary market for industrial leases can demand prices ten times higher at over $60 per square meter (ECOWAS Business Climate Study, 2013).
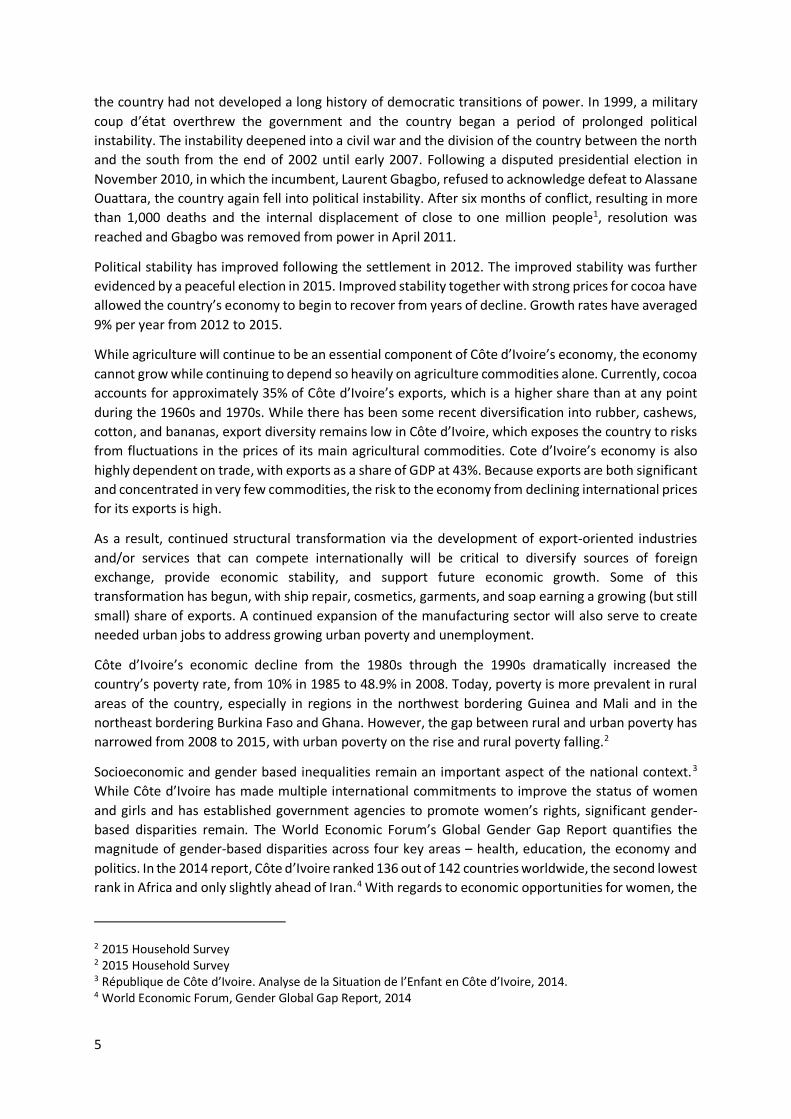
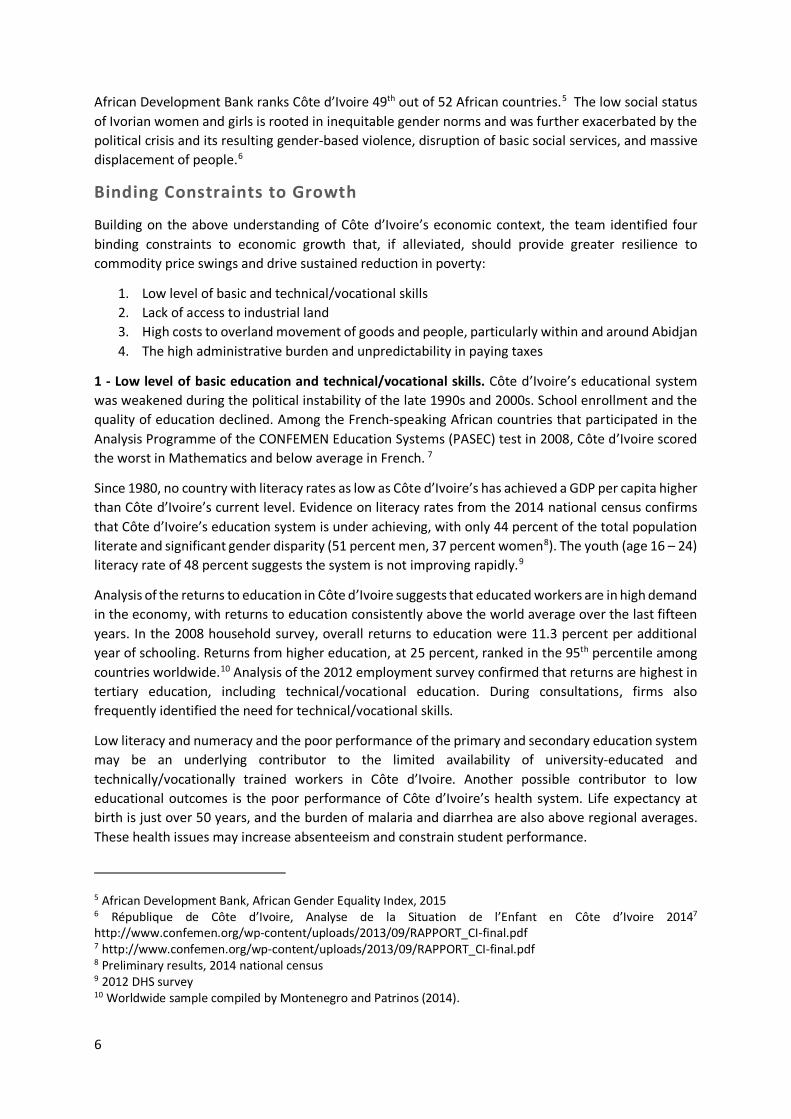
In order to obtain access to land, some firms have located in the industrial zones of Yamoussoukro, two hours north of Abidjan. Consultations with the private sector revealed that locating outside of Abidjan negatively impacts firms’ competitiveness due to increased transport costs, lack of availability of supplier networks, lack of financial services, the lower skilled workforce available, and the need to travel to Abidjan to conduct most interactions with the government.
The government is actively working to increase the supply of industrial land through the development of the new PK-24 industrial zone on the outskirts of Abidjan. The government recently concluded negotiations to acquire the first 50 hectares of land from customary owners.15 With 940 hectares planned, the industrial zone would be the largest in Côte d’Ivoire. The Ministry of Industry and Mines plans a public-private partnership (PPP) approach over three successive stages to develop and manage the zone.
11 IMF review, June 2015 12 UNESCO, Country Profile Côte d’Ivoire http://www.uis.unesco.org/DataCentre/Pages/country-profile.aspx?code=CIV®ioncode=40540 13 UNESCO, Country Profile Côte d’Ivoire 14 Jean-Marie Ackah, President of the Union des Grandes Entreprises Industrielles 15http://www.industrie.gouv.ci/index.php/article/remise-cheques-detenteurs-droits-coutumiers-zone-industrielle-pk24
Figure 0-2 Industrial Zones in Abidjan (in red)
Source: Ministry of Industry and Commerce
8
3 - Difficulty of moving goods and people. During the 1960s and 1970s, Côte d’Ivoire invested in a road network that provided connectivity for most Ivorians. Today, more than 32 percent of Côte d’Ivoire’s population lives within two kilometers of an all-season road, which is above the average for middle-income countries.
While the quantity of roads is not a constraint, the quality of the road network has been in decline throughout the period of instability. According to Agence Nationale de Gestion des Routes (Ageroute), 75 percent of roads now exceed their expected 15 years lifespan.16 As a result, 26% of the road network has travel speeds reduced to below 35km/h. During heavy rains, road connections can become impassable, especially those to the agricultural port of San Pedro in the west of the country.17
Transportation appears to be most binding within Abidjan, where rapid population growth, exacerbated by the wave of migration from the north and west regions of Côte d’Ivoire into Abidjan after the political crisis of 2002-2007, has led to increasing congestion. In 2013, firms in Abidjan were more likely than firms located in other parts of the country to report transportation as a constraint, 45 percent compared to 25 percent.18 Household survey data indicates that residents of Abidjan have higher commuting expenses than in most other African cities, including Lagos and Nairobi.19
Many factors come together to make transport in Abidjan difficult. The geography of the city, surrounded by lagoons, means traffic through the city must travel over one of three bridges, creating bottlenecks. In addition, Abidjan’s public bus system has been in decline since 2000 while the use of taxis has increased to meet transportation needs, contributing to greater numbers of vehicles on the road. Truck traffic has also grown in Abidjan alongside growth in the port, which is located in the center of the city. The planned expansion of the port, to more than double current capacity, will put further strain on Abidjan’s transport infrastructure and, in turn, increase congestion in Abidjan, constraining the efficiency of the port.
4 - Administrative burden and unpredictability of paying taxes. The complexity of tax policy imposes a significant compliance burden on firms. Among firms in the 2013 Cellule d’Analyse de Politiques Economiques du Cires (CAPEC) survey, tax administration was the second most frequently reported constraint. Similarly, in the 2013 Enterprise Survey, firms reported one of the highest compliance burdens and rates of interaction with tax officials in the world. There was also high variation in frequency of these interactions across firms; some reported more than 20 interactions and others up to 100 over the course of a year.20
The Doing Business Indicators show that, among African countries, Côte d’Ivoire has the highest number of tax payments required. This further reflects the high administrative burden and complexity of Côte d’Ivoire’s tax code. The International Monetary Fund (IMF) also notes the increasing complexity of interaction with tax officials: “The opening of 353 new local offices (in 2012 and 2013) and the priority still given to property tax collection has resulted in the multiplication of tax files and points of contact for the taxpayers as well as in an increase of compliance costs.”21
16 http://www.ageroute.ci/gestion-du-reseaux/le-reseaux-routier/etatevolution 17http://af.reuters.com/article/investingNews/idAFKBN0F91II20140704, http://af.reuters.com/article/investingNews/idAFKBN0NQ0I120150505 18 CAPEC Survey, 2013 19 Kumar and Barrett, “Stuck in Traffic: Urban Transport in Africa” (2008) 20 2009 Enterprise Surveys 21 IMF, Fiscal Affairs Department, Project Proposal for External Financing of TA Activities, Côte D’Ivoire: Organization (Module 4) and Enforcement (Module 6), January 2014
9
In addition to the complexity and administrative burden, the financial burden of taxation is also problematic. The total tax rate in Côte d’Ivoire is relatively high, at 52 percent of profits (World Bank 2015 Doing Business Indicators). Direct profit taxes are modest, however, and the high rate is driven mainly by payroll and other taxes (e.g. taxes on equipment, vehicles, advertising, licensing, business license, etc.).
Despite the high total taxation rate, tax revenue actually collected has been modest at around 14 percent of GDP. The complexity and cost of compliance may impact the government’s ability to raise revenue. The IMF estimates non-compliance at 18 percent for large firms, 40 percent for small- and medium-sized enterprises (SMEs) and a value-added tax (VAT) collection that is 20 percent below potential. Thus reducing the complexity of the tax code need not reduce revenue collection, which is an important objective of the government as tax revenues are low at only 16 percent of GDP.
This constraint appears to have been undergoing improvement during the writing of this report. In particular, arrears in VAT reimbursement made significant progress. However, other elements of tax administration, including corporate income tax and the proliferation of government fees, remain problematic.
Other Notable Constraints
The intent of the constraints analysis is to prioritize the most critical and binding problems for economic growth. There are, of course, additional issues that affect growth but that are not considered to be the most binding. That is not to say the issues are not important or that there would be no growth or welfare benefit to addressing them, merely that that the benefit from addressing the most binding constraints is larger for growth. The team considered many additional issues that were potentially binding constraints including the following.
Customs: In the 2009 World Bank Enterprise Survey, firms reported severe delays in customs. Since then, indicators on customs operations, such as the Logistics Performance Index, have been improving, but are still low. In 2013, the government contracted to streamline and automate certain customs operations. Despite achievements like the implementation of a single window trade portal,22 the potential remains for customs to become a binding constraint in the future if progress is not continued. Customs also interacts with several of the constraints outlined above. Transportation of goods can be delayed by customs and unpredictable application of customs taxes and fees by officials likely contributes to firms’ perception of tax administration as a constraint.
Rural Land Rights: Ownership of almost all rural land in Côte d’Ivoire is managed under customary rules. The revised land law of 1998 attempted to formalize the system, but implementation of the law has been minimal. Despite the lack of formal land tenure, the agricultural sector has experienced double-digit growth recently and diversified into cotton and cashews. Farmers also feel secure enough in their land rights to invest in perennials and tree crops such as cocoa. Customary land rules generally exclude women as well as non-indigenous ethnic groups from ownership and can be a particular constraint to their inclusion in rural incomes.
Finance: Before the coup and civil war, Côte d’Ivoire was a regional hub of financial activity. The amount of credit flowing within the economy, real lending rates, and competitiveness of the sector all led the region. The financial system stagnated during the political instability of the 1990s and 2000s. While it is in the process of recovering, it has not yet caught up to its potential and likely still constrains
23 Côte d’Ivoire National Statistics Institute
10
some investment in Côte d’Ivoire. In addition to the needed catch-up, government borrowing during the first years of the recovery likely crowded out the private sector and further constrained access to finance. However, the sector has been growing rapidly. New banks have been entering the market, with 24 banks operating in Côte d’Ivoire in 2014. Lending rates are just 1-2 points higher than the regional average and, at less than a 10% real interest rate, compare favorably for a country of Côte d’Ivoire’s level of economic development and remaining political fragility.
Energy: Côte d’Ivoire has an extensive electricity network, moderate electricity prices, and generally reliable service. Yet, reliability varies across cities, and firms in some locations cite electricity as an obstacle to their activities. Significant investment (up to 200MW per year) will be needed to keep up with projected demand and to rehabilitate and/or replace aging infrastructure. Building on a strong history of private sector participation in the energy sector – Côte d’Ivoire was the first sub-Saharan African country to turn to independent power producers (IPPs) in the 1980s – the country has plans to source much of its generation needs from private investment. While the sector will need to maintain a fast pace of investment to avoid becoming a constraint, electricity is not currently a binding constraint that holds back private investment.
Conclusion
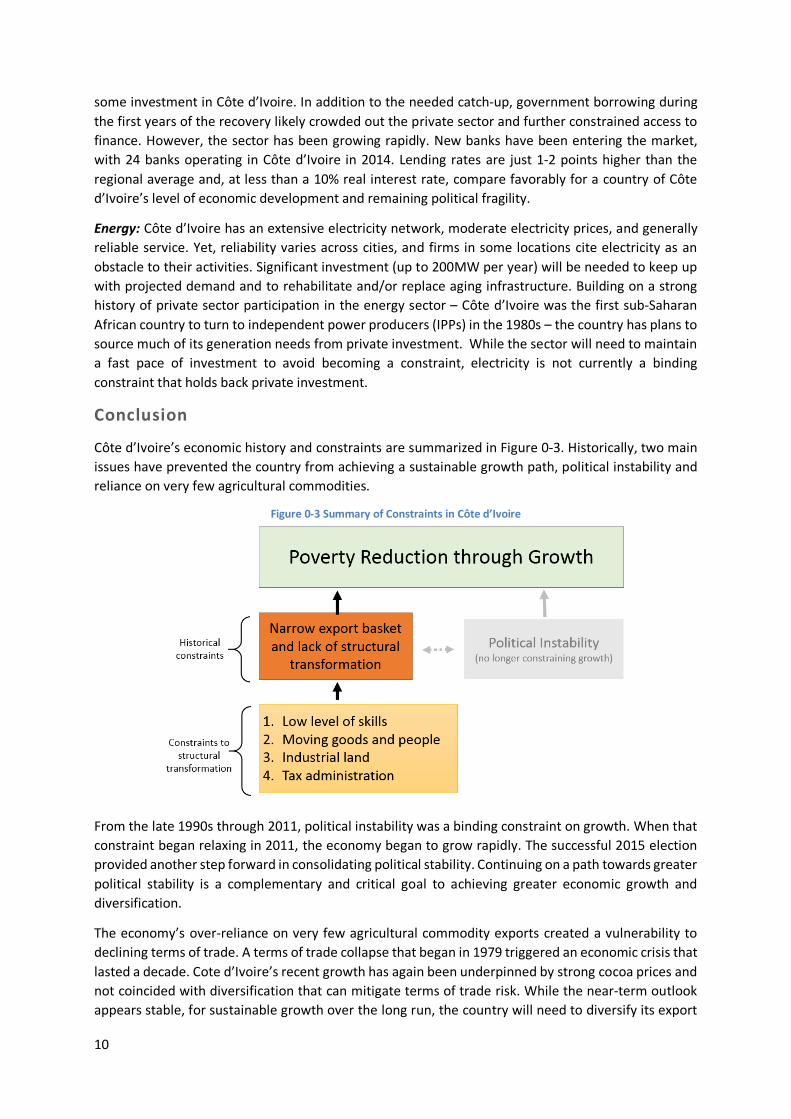
Côte d’Ivoire’s economic history and constraints are summarized in Figure 0-3. Historically, two main issues have prevented the country from achieving a sustainable growth path, political instability and reliance on very few agricultural commodities.
Figure 0-3 Summary of Constraints in Côte d’Ivoire
From the late 1990s through 2011, political instability was a binding constraint on growth. When that constraint began relaxing in 2011, the economy began to grow rapidly. The successful 2015 election provided another step forward in consolidating political stability. Continuing on a path towards greater political stability is a complementary and critical goal to achieving greater economic growth and diversification.
The economy’s over-reliance on very few agricultural commodity exports created a vulnerability to declining terms of trade. A terms of trade collapse that began in 1979 triggered an economic crisis that lasted a decade. Cote d’Ivoire’s recent growth has again been underpinned by strong cocoa prices and not coincided with diversification that can mitigate terms of trade risk. While the near-term outlook appears stable, for sustainable growth over the long run, the country will need to diversify its export
11
sector and create employment opportunities for its growing urban labor force. Each goal – diversification and political stability – depends on the success of the other.
Therefore, this report focuses on the question: “What constrains Côte d’Ivoire’s economy from diversifying its export sector and creating urban jobs?” The four binding constraints to this question are:
1. Low level of basic and technical/vocational skills 2. Lack of access to industrial land 3. High costs to overland movement of goods and people, particularly within and around Abidjan 4. The high administrative burden and unpredictability in paying taxes
The full report discusses these in depth as well as examines other potential constraints not prioritized among these top four.
12
Cote d’Ivoire Constraints Analysis Full Report
1. Background and Country Context This chapter presents an overview of Côte d’Ivoire’s geography, demography, and economic history. Understanding Côte d’Ivoire’s unique economic context helps to inform the examination of its potential constraints to sustainable economic growth and development.
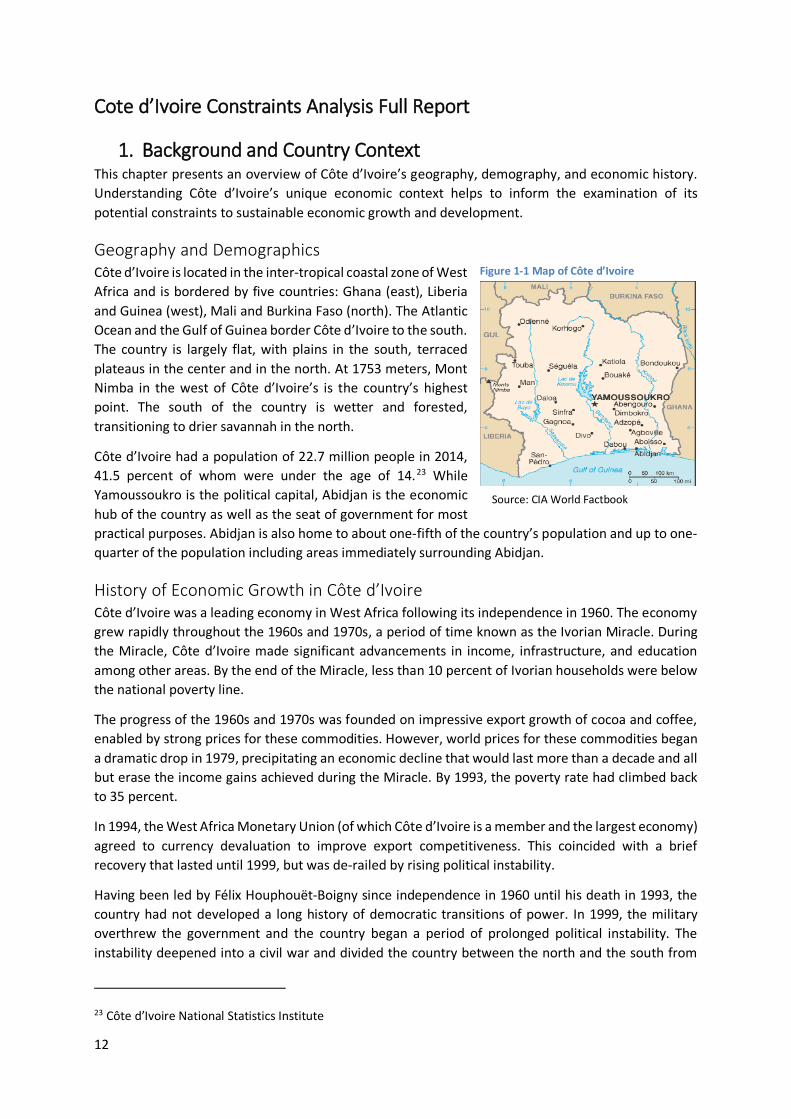
Geography and Demographics Côte d’Ivoire is located in the inter-tropical coastal zone of West Africa and is bordered by five countries: Ghana (east), Liberia and Guinea (west), Mali and Burkina Faso (north). The Atlantic Ocean and the Gulf of Guinea border Côte d’Ivoire to the south. The country is largely flat, with plains in the south, terraced plateaus in the center and in the north. At 1753 meters, Mont Nimba in the west of Côte d’Ivoire’s is the country’s highest point. The south of the country is wetter and forested, transitioning to drier savannah in the north.
Côte d’Ivoire had a population of 22.7 million people in 2014, 41.5 percent of whom were under the age of 14.23 While Yamoussoukro is the political capital, Abidjan is the economic hub of the country as well as the seat of government for most practical purposes. Abidjan is also home to about one-fifth of the country’s population and up to one-quarter of the population including areas immediately surrounding Abidjan.
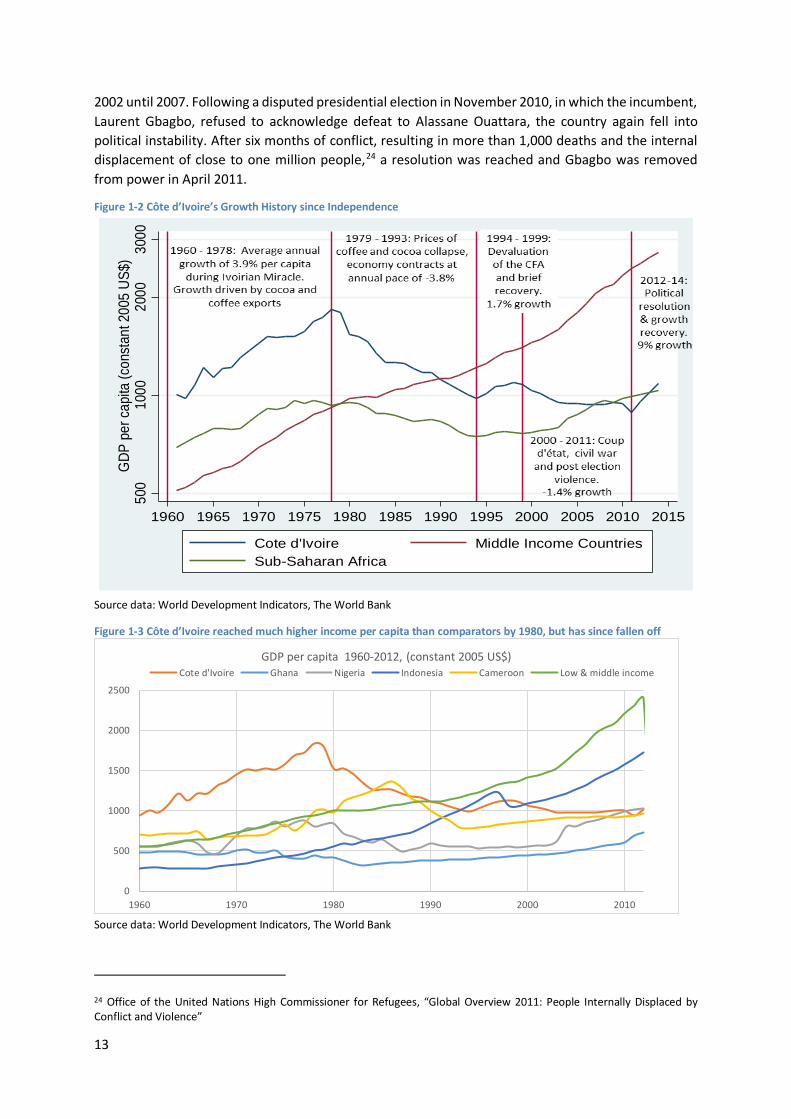
History of Economic Growth in Côte d’Ivoire Côte d’Ivoire was a leading economy in West Africa following its independence in 1960. The economy grew rapidly throughout the 1960s and 1970s, a period of time known as the Ivorian Miracle. During the Miracle, Côte d’Ivoire made significant advancements in income, infrastructure, and education among other areas. By the end of the Miracle, less than 10 percent of Ivorian households were below the national poverty line.
The progress of the 1960s and 1970s was founded on impressive export growth of cocoa and coffee, enabled by strong prices for these commodities. However, world prices for these commodities began a dramatic drop in 1979, precipitating an economic decline that would last more than a decade and all but erase the income gains achieved during the Miracle. By 1993, the poverty rate had climbed back to 35 percent.
In 1994, the West Africa Monetary Union (of which Côte d’Ivoire is a member and the largest economy) agreed to currency devaluation to improve export competitiveness. This coincided with a brief recovery that lasted until 1999, but was de-railed by rising political instability.
Having been led by Félix Houphouët-Boigny since independence in 1960 until his death in 1993, the country had not developed a long history of democratic transitions of power. In 1999, the military overthrew the government and the country began a period of prolonged political instability. The instability deepened into a civil war and divided the country between the north and the south from
23 Côte d’Ivoire National Statistics Institute
Figure 1-1 Map of Côte d’Ivoire
Source: CIA World Factbook
13
2002 until 2007. Following a disputed presidential election in November 2010, in which the incumbent, Laurent Gbagbo, refused to acknowledge defeat to Alassane Ouattara, the country again fell into political instability. After six months of conflict, resulting in more than 1,000 deaths and the internal displacement of close to one million people,24 a resolution was reached and Gbagbo was removed from power in April 2011.
Figure 1-2 Côte d’Ivoire’s Growth History since Independence
Source data: World Development Indicators, The World Bank
Figure 1-3 Côte d’Ivoire reached much higher income per capita than comparators by 1980, but has since fallen off
Source data: World Development Indicators, The World Bank
24 Office of the United Nations High Commissioner for Refugees, “Global Overview 2011: People Internally Displaced by Conflict and Violence”
500
1000
2000
3000
GDP
per
capi
ta (c
onst
ant 2
005
US$)
1960 1965 1970 1975 1980 1985 1990 1995 2000 2005 2010 2015
Cote d'Ivoire Middle Income CountriesSub-Saharan Africa
0
500
1000
1500
2000
2500
1960 1970 1980 1990 2000 2010
GDP per capita 1960-2012, (constant 2005 US$)Cote d'Ivoire Ghana Nigeria Indonesia Cameroon Low & middle income
14
Political stability has improved following an agreement among the political parties in 2012 on the democratic and electoral process moving forward. The improved stability was further evidenced by a peaceful election in 2015. Improved stability together with strong prices for cocoa have allowed the country’s economy to begin to recover from years of decline. Growth rates averaged 9 percent per year from 2012 to 2015.
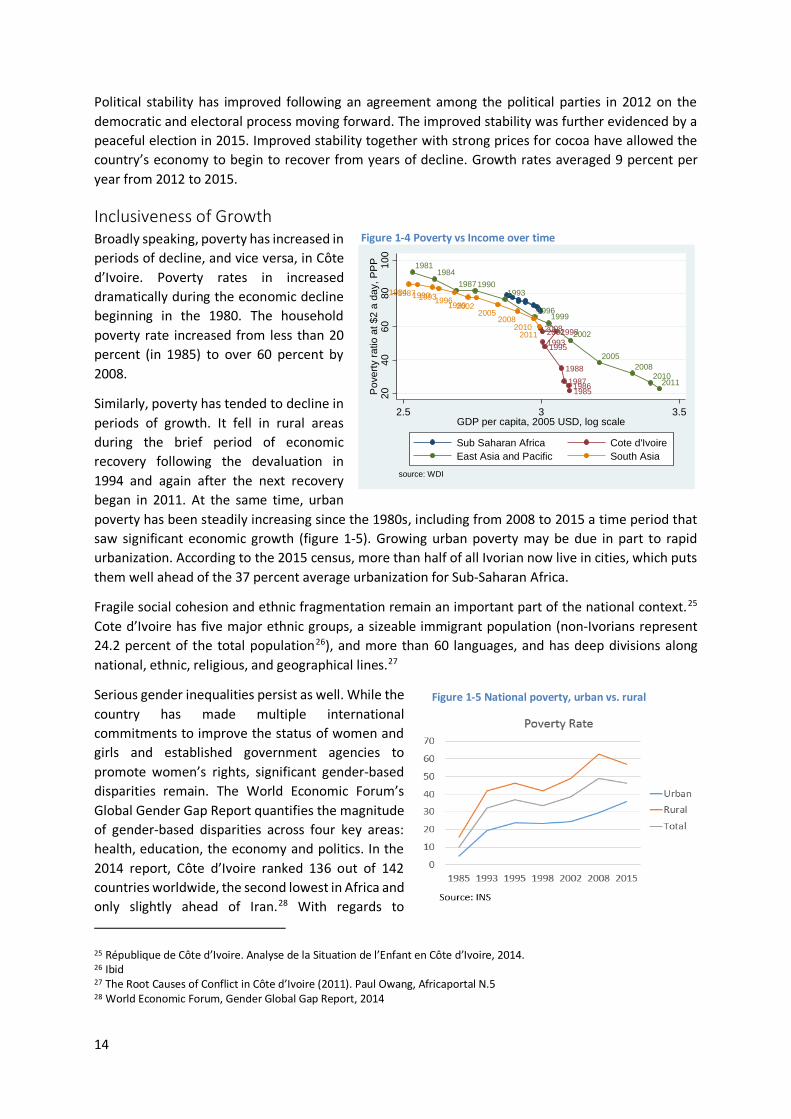
Inclusiveness of Growth Broadly speaking, poverty has increased in periods of decline, and vice versa, in Côte d’Ivoire. Poverty rates in increased dramatically during the economic decline beginning in the 1980. The household poverty rate increased from less than 20 percent (in 1985) to over 60 percent by 2008.
Similarly, poverty has tended to decline in periods of growth. It fell in rural areas during the brief period of economic recovery following the devaluation in 1994 and again after the next recovery began in 2011. At the same time, urban poverty has been steadily increasing since the 1980s, including from 2008 to 2015 a time period that saw significant economic growth (figure 1-5). Growing urban poverty may be due in part to rapid urbanization. According to the 2015 census, more than half of all Ivorian now live in cities, which puts them well ahead of the 37 percent average urbanization for Sub-Saharan Africa.
Fragile social cohesion and ethnic fragmentation remain an important part of the national context.25 Cote d’Ivoire has five major ethnic groups, a sizeable immigrant population (non-Ivorians represent 24.2 percent of the total population26), and more than 60 languages, and has deep divisions along national, ethnic, religious, and geographical lines.27
Serious gender inequalities persist as well. While the country has made multiple international commitments to improve the status of women and girls and established government agencies to promote women’s rights, significant gender-based disparities remain. The World Economic Forum’s Global Gender Gap Report quantifies the magnitude of gender-based disparities across four key areas: health, education, the economy and politics. In the 2014 report, Côte d’Ivoire ranked 136 out of 142 countries worldwide, the second lowest in Africa and only slightly ahead of Iran.28 With regards to
25 République de Côte d’Ivoire. Analyse de la Situation de l’Enfant en Côte d’Ivoire, 2014. 26 Ibid 27 The Root Causes of Conflict in Côte d’Ivoire (2011). Paul Owang, Africaportal N.5 28 World Economic Forum, Gender Global Gap Report, 2014
1985198619871988
19931995
199820022008
19811984
198719901993
19961999
2002
20052008
20102011
19841987199019931996199920022005
20082010
2011
2040
6080
100
Pov
erty
ratio
at $
2 a
day,
PP
P
2.5 3 3.5GDP per capita, 2005 USD, log scale
Sub Saharan Africa Cote d'IvoireEast Asia and Pacific South Asia
source: WDI
Figure 1-4 Poverty vs Income over time
Figure 1-5 National poverty, urban vs. rural
15
economic opportunities for women, the African Development Bank ranks Côte d’Ivoire near the bottom at 49 out of 52 African countries.29 The low social status of Ivorian women and girls is rooted in inequitable gender norms and was further exacerbated by the political crisis and resulting gender-based violence, disruption of basic social services, and massive displacement.30
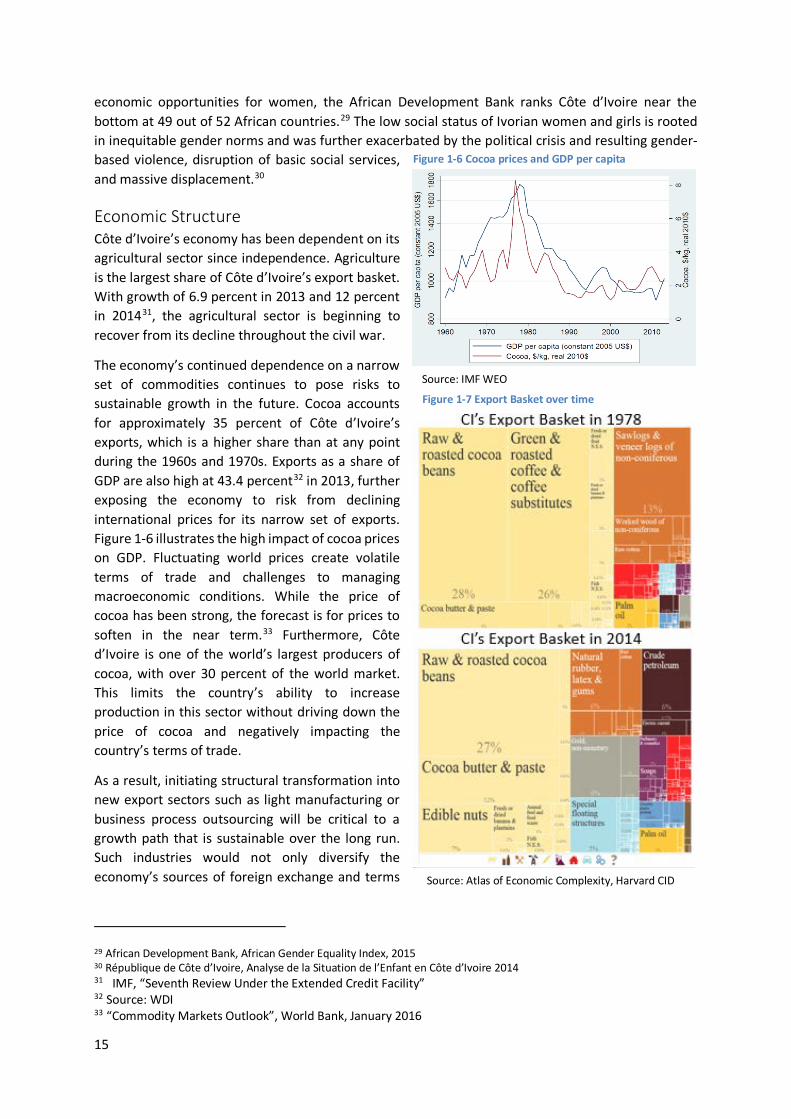
Economic Structure Côte d’Ivoire’s economy has been dependent on its agricultural sector since independence. Agriculture is the largest share of Côte d’Ivoire’s export basket. With growth of 6.9 percent in 2013 and 12 percent in 201431, the agricultural sector is beginning to recover from its decline throughout the civil war.
The economy’s continued dependence on a narrow set of commodities continues to pose risks to sustainable growth in the future. Cocoa accounts for approximately 35 percent of Côte d’Ivoire’s exports, which is a higher share than at any point during the 1960s and 1970s. Exports as a share of GDP are also high at 43.4 percent32 in 2013, further exposing the economy to risk from declining international prices for its narrow set of exports. Figure 1-6 illustrates the high impact of cocoa prices on GDP. Fluctuating world prices create volatile terms of trade and challenges to managing macroeconomic conditions. While the price of cocoa has been strong, the forecast is for prices to soften in the near term.33 Furthermore, Côte d’Ivoire is one of the world’s largest producers of cocoa, with over 30 percent of the world market. This limits the country’s ability to increase production in this sector without driving down the price of cocoa and negatively impacting the country’s terms of trade.
As a result, initiating structural transformation into new export sectors such as light manufacturing or business process outsourcing will be critical to a growth path that is sustainable over the long run. Such industries would not only diversify the economy’s sources of foreign exchange and terms
29 African Development Bank, African Gender Equality Index, 2015 30 République de Côte d’Ivoire, Analyse de la Situation de l’Enfant en Côte d’Ivoire 2014 31 IMF, “Seventh Review Under the Extended Credit Facility” 32 Source: WDI 33 “Commodity Markets Outlook”, World Bank, January 2016
Figure 1-7 Export Basket over time
Source: Atlas of Economic Complexity, Harvard CID
Figure 1-6 Cocoa prices and GDP per capita
Source: IMF WEO
16
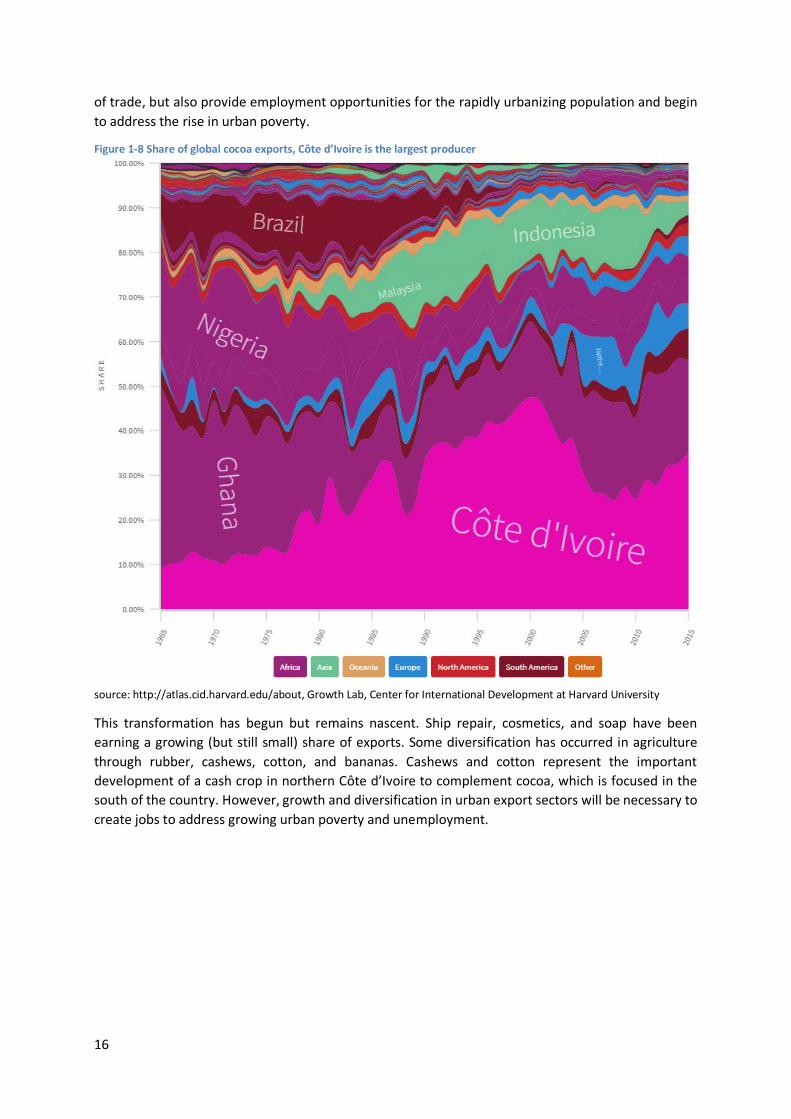
of trade, but also provide employment opportunities for the rapidly urbanizing population and begin to address the rise in urban poverty.
Figure 1-8 Share of global cocoa exports, Côte d’Ivoire is the largest producer
source: http://atlas.cid.harvard.edu/about, Growth Lab, Center for International Development at Harvard University
This transformation has begun but remains nascent. Ship repair, cosmetics, and soap have been earning a growing (but still small) share of exports. Some diversification has occurred in agriculture through rubber, cashews, cotton, and bananas. Cashews and cotton represent the important development of a cash crop in northern Côte d’Ivoire to complement cocoa, which is focused in the south of the country. However, growth and diversification in urban export sectors will be necessary to create jobs to address growing urban poverty and unemployment.
17
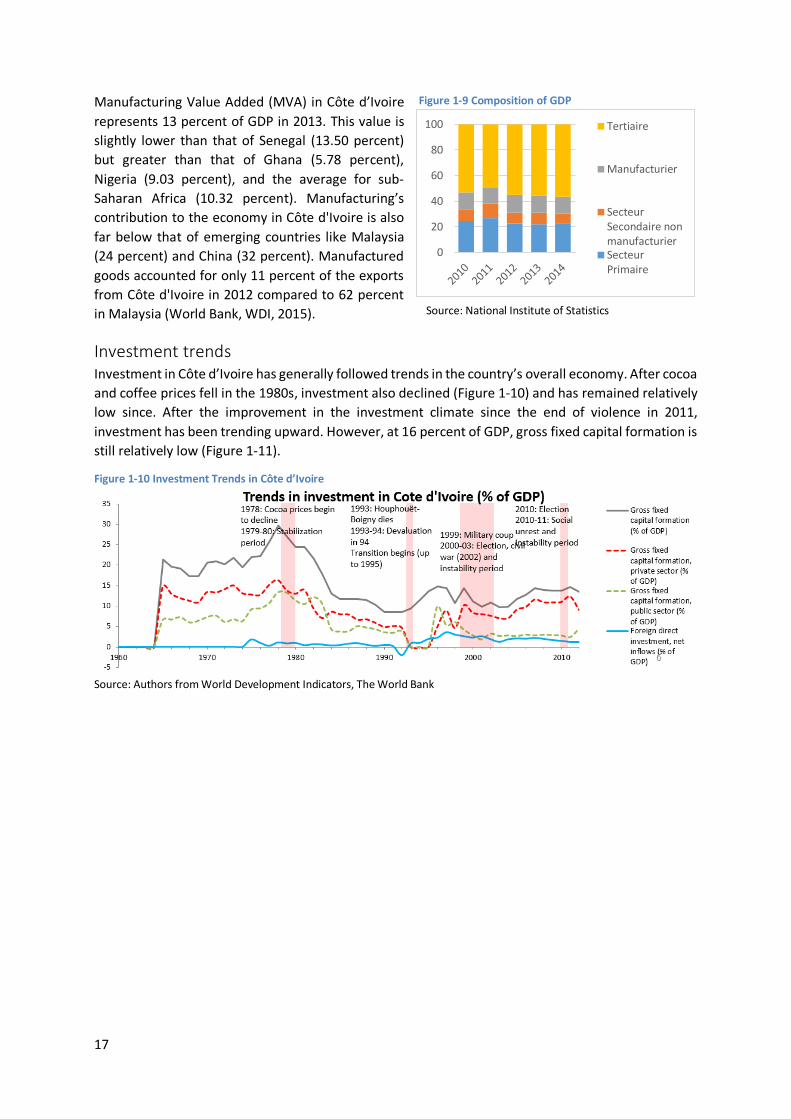
Manufacturing Value Added (MVA) in Côte d’Ivoire represents 13 percent of GDP in 2013. This value is slightly lower than that of Senegal (13.50 percent) but greater than that of Ghana (5.78 percent), Nigeria (9.03 percent), and the average for sub-Saharan Africa (10.32 percent). Manufacturing’s contribution to the economy in Côte d'Ivoire is also far below that of emerging countries like Malaysia (24 percent) and China (32 percent). Manufactured goods accounted for only 11 percent of the exports from Côte d'Ivoire in 2012 compared to 62 percent in Malaysia (World Bank, WDI, 2015).
Investment trends Investment in Côte d’Ivoire has generally followed trends in the country’s overall economy. After cocoa and coffee prices fell in the 1980s, investment also declined (Figure 1-10) and has remained relatively low since. After the improvement in the investment climate since the end of violence in 2011, investment has been trending upward. However, at 16 percent of GDP, gross fixed capital formation is still relatively low (Figure 1-11).
Figure 1-10 Investment Trends in Côte d’Ivoire
Source: Authors from World Development Indicators, The World Bank
Figure 1-9 Composition of GDP
0
20
40
60
80
100 Tertiaire
Manufacturier
SecteurSecondaire nonmanufacturierSecteurPrimaire
Source: National Institute of Statistics
18
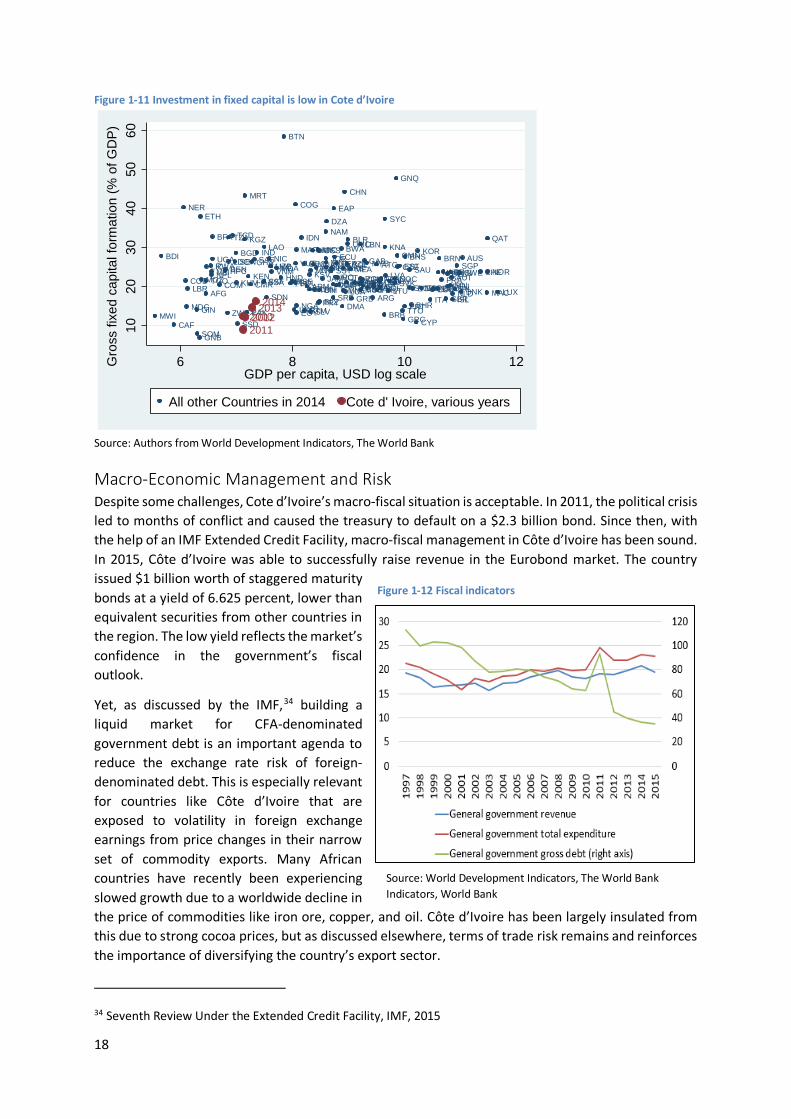
Figure 1-11 Investment in fixed capital is low in Cote d’Ivoire
Source: Authors from World Development Indicators, The World Bank
Macro-Economic Management and Risk Despite some challenges, Cote d’Ivoire’s macro-fiscal situation is acceptable. In 2011, the political crisis led to months of conflict and caused the treasury to default on a $2.3 billion bond. Since then, with the help of an IMF Extended Credit Facility, macro-fiscal management in Côte d’Ivoire has been sound. In 2015, Côte d’Ivoire was able to successfully raise revenue in the Eurobond market. The country issued $1 billion worth of staggered maturity bonds at a yield of 6.625 percent, lower than equivalent securities from other countries in the region. The low yield reflects the market’s confidence in the government’s fiscal outlook.
Yet, as discussed by the IMF,34 building a liquid market for CFA-denominated government debt is an important agenda to reduce the exchange rate risk of foreign-denominated debt. This is especially relevant for countries like Côte d’Ivoire that are exposed to volatility in foreign exchange earnings from price changes in their narrow set of commodity exports. Many African countries have recently been experiencing slowed growth due to a worldwide decline in the price of commodities like iron ore, copper, and oil. Côte d’Ivoire has been largely insulated from this due to strong cocoa prices, but as discussed elsewhere, terms of trade risk remains and reinforces the importance of diversifying the country’s export sector.
34 Seventh Review Under the Extended Credit Facility, IMF, 2015
AFG
ALB ARB ARE
ARGARM
ATGAUS
AUT
AZEBDI
BELBEN
BFA
BGD
BGR
BHR
BHS
BIH
BLR
BLZ
BOL BRA
BRB
BRN
BTN
BWA
CAF
CANCEB
CHECHL
CHN
CMRCOD
COG
COL
COMCRICSS
CYP
CZE
DEU
DMA
DNKDOM
DZAEAP
ECA ECS
ECU
EGY
EMUESP
EST
ETH
EUUFINFRA
GAB
GBR
GEOGHA
GIN
GNB
GNQ
GRC
GRDGTM
GUY
HKGHND
HPC
HRVHUN
IDN
IND
IRL
IRN
IRQ
ISLISR
ITA
JAM
JOR
KAZKEN
KGZ
KHM
KNA KOR
KSVLAC
LAO LBN
LBR LCALCN
LDCLIC LMC
LMY
LTU LUX
LVA
MAC
MAR
MDA
MDG
MEA
MEX
MIC
MKDMLIMNA
MNE
MNGMOZ
MRT
MUS
MWI
MYS
NAM
NER
NGA
NIC
NLD
NOCNORNPL
OMNOSS
PAK
PER
PHL POL
PRTPRY
PSE
QAT
ROURUS
RWASAS
SAU
SDN
SEN SGP
SLV
SOM
SRB
SSA
SSD
SSFSST
SVKSVN
SWE
SYC
TCD
TGOTHA
TTO
TUN TUR
TZA
UGA
UKR
UMC
URY
UZBVCT
VNMVUT
ZAF
ZWE201020112012
20132014
1020
3040
5060
Gro
ss fi
xed
capi
tal f
orm
atio
n (%
of G
DP)
6 8 10 12GDP per capita, USD log scale
All other Countries in 2014 Cote d' Ivoire, various years
Figure 1-12 Fiscal indicators
Source: World Development Indicators, The World Bank Indicators, World Bank
19
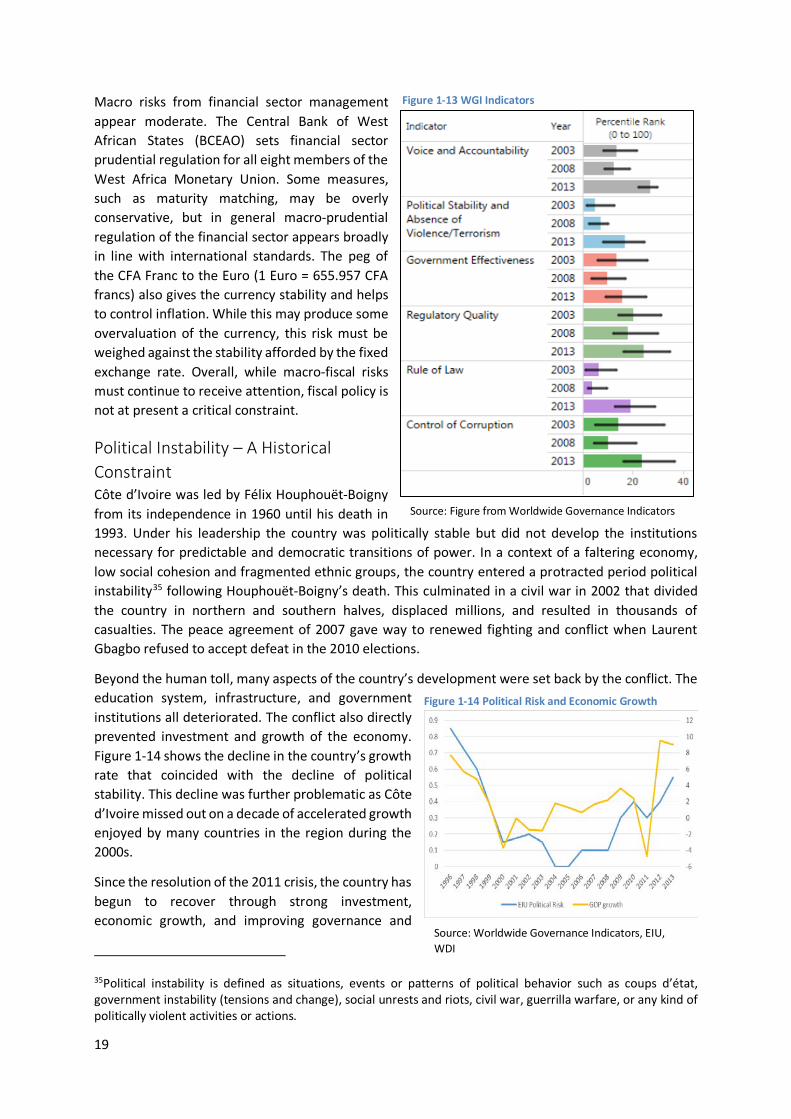
Macro risks from financial sector management appear moderate. The Central Bank of West African States (BCEAO) sets financial sector prudential regulation for all eight members of the West Africa Monetary Union. Some measures, such as maturity matching, may be overly conservative, but in general macro-prudential regulation of the financial sector appears broadly in line with international standards. The peg of the CFA Franc to the Euro (1 Euro = 655.957 CFA francs) also gives the currency stability and helps to control inflation. While this may produce some overvaluation of the currency, this risk must be weighed against the stability afforded by the fixed exchange rate. Overall, while macro-fiscal risks must continue to receive attention, fiscal policy is not at present a critical constraint.
Political Instability – A Historical Constraint Côte d’Ivoire was led by Félix Houphouët-Boigny from its independence in 1960 until his death in 1993. Under his leadership the country was politically stable but did not develop the institutions necessary for predictable and democratic transitions of power. In a context of a faltering economy, low social cohesion and fragmented ethnic groups, the country entered a protracted period political instability35 following Houphouët-Boigny’s death. This culminated in a civil war in 2002 that divided the country in northern and southern halves, displaced millions, and resulted in thousands of casualties. The peace agreement of 2007 gave way to renewed fighting and conflict when Laurent Gbagbo refused to accept defeat in the 2010 elections.
Beyond the human toll, many aspects of the country’s development were set back by the conflict. The education system, infrastructure, and government institutions all deteriorated. The conflict also directly prevented investment and growth of the economy. Figure 1-14 shows the decline in the country’s growth rate that coincided with the decline of political stability. This decline was further problematic as Côte d’Ivoire missed out on a decade of accelerated growth enjoyed by many countries in the region during the 2000s.
Since the resolution of the 2011 crisis, the country has begun to recover through strong investment, economic growth, and improving governance and
35Political instability is defined as situations, events or patterns of political behavior such as coups d’état, government instability (tensions and change), social unrests and riots, civil war, guerrilla warfare, or any kind of politically violent activities or actions.
Figure 1-13 WGI Indicators
Source: Figure from Worldwide Governance Indicators
Figure 1-14 Political Risk and Economic Growth
Source: Worldwide Governance Indicators, EIU, WDI
20
infrastructure. Annual foreign direct investment more than doubled from 2011 to 2014. Growth rates in 2013, 2014, and 2015 rose to 9.8 percent, 9.2 percent, and 9 percent respectively.
Governance also began to improve after resolution of the conflict. Côte d’Ivoire improved in every measure of the Worldwide Governance Indicators from 2008 to 2013. The Mo Ibrahim Index of Africa Governance also shows Côte d’Ivoire is the most improved African country since the end of hostilities.
Summary - Political instability and lack of diversification are historical constraints Côte d’Ivoire’s economic history and constraints are summarized in Figure 1-15. Historically, two main issues have prevented the country from achieving a sustainable growth path: political instability and lack of diversification.
Political instability has been a binding constraint on growth until recently. With the constraint relaxed, the economy began growing rapidly. Côte d’Ivoire is now on a steady path of strengthening its democracy. The 2015 election was certainly a step along this path. Yet risks remain and the next election cycle (when President Ouattara will not be eligible) will be a critical test to demonstrate the country’s ability to undertake a peaceful transition of power.
Over the longer course of the country’s history, the economy’s lack of diversification and reliance on very few agricultural commodity exports created a vulnerability to a terms-of-trade collapse. This triggered a decline in the 1980s that lasted a decade. The recent recovery has been driven by the same historical drivers of the economy and not created significant diversification. While the near-term outlook appears stable, for sustainable growth over the long run, the country will need to diversify its export sector and create employment opportunities for its growing urban labor force.
The remainder of this report focuses on the question: “What constrains Côte d’Ivoire’s economy from diversifying its export sector and creating urban jobs?” Continuing on a path towards greater political stability is also a complementary and critical goal. Both goals, diversification and political stability, depend on the success of each other. While acknowledging the importance of continued political stability, this report focuses on the question of economic growth and diversification. For this question, four main binding constraints are identified:
1. Low level of basic and technical/vocational skills 2. Lack of access to industrial land 3. High costs to overland movement of goods and people, particularly within and around Abidjan 4. The high administrative burden and unpredictability in paying taxes
The remainder of this report explores these issues and discusses additional issues that were considered but ultimately not prioritized among these top four. This report will also attempt to examine important social cleavages and disparities throughout
21
Figure 1-15 Summary of Constraints in Côte d’Ivoire
22
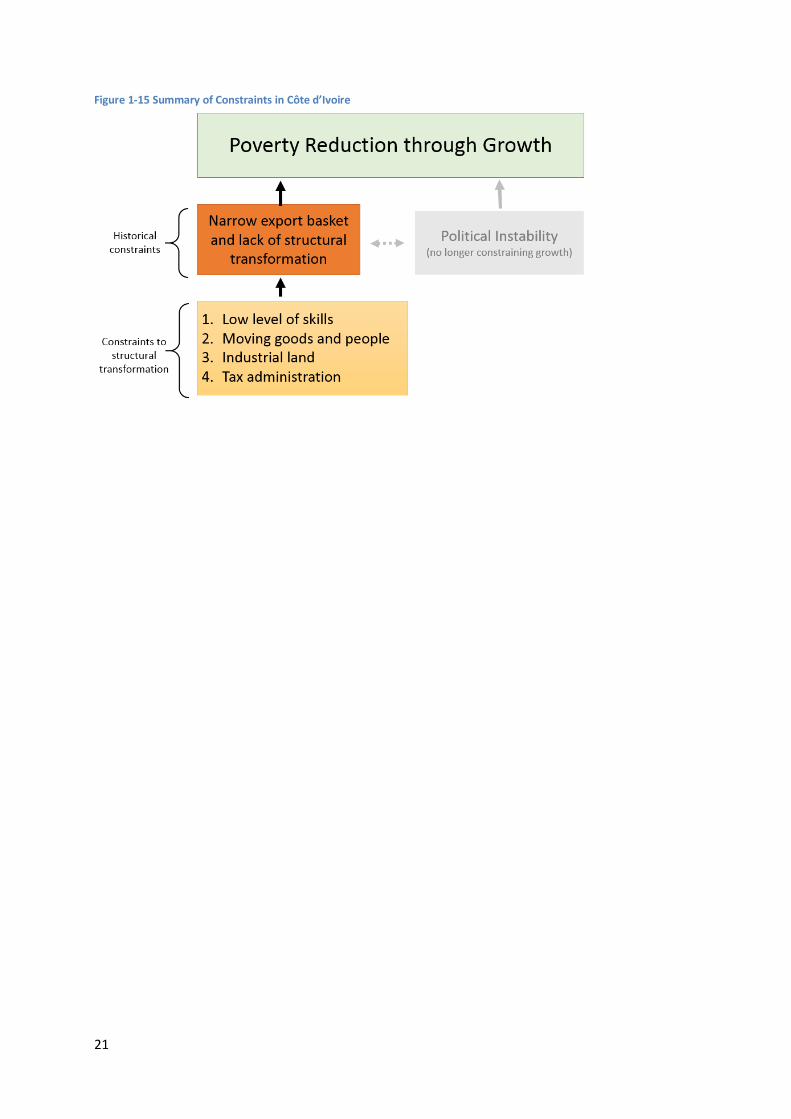
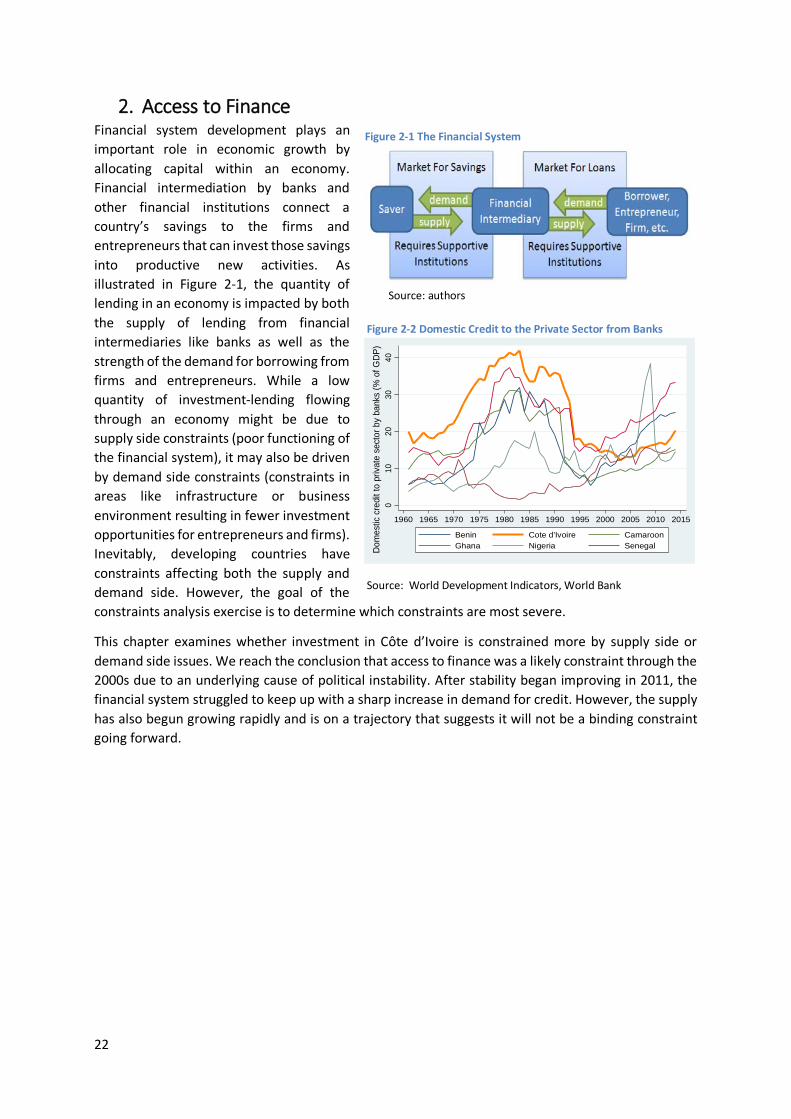
2. Access to Finance Financial system development plays an important role in economic growth by allocating capital within an economy. Financial intermediation by banks and other financial institutions connect a country’s savings to the firms and entrepreneurs that can invest those savings into productive new activities. As illustrated in Figure 2-1, the quantity of lending in an economy is impacted by both the supply of lending from financial intermediaries like banks as well as the strength of the demand for borrowing from firms and entrepreneurs. While a low quantity of investment-lending flowing through an economy might be due to supply side constraints (poor functioning of the financial system), it may also be driven by demand side constraints (constraints in areas like infrastructure or business environment resulting in fewer investment opportunities for entrepreneurs and firms). Inevitably, developing countries have constraints affecting both the supply and demand side. However, the goal of the constraints analysis exercise is to determine which constraints are most severe.
This chapter examines whether investment in Côte d’Ivoire is constrained more by supply side or demand side issues. We reach the conclusion that access to finance was a likely constraint through the 2000s due to an underlying cause of political instability. After stability began improving in 2011, the financial system struggled to keep up with a sharp increase in demand for credit. However, the supply has also begun growing rapidly and is on a trajectory that suggests it will not be a binding constraint going forward.
010
2030
40D
omes
tic c
redi
t to
priv
ate
sect
or b
y ba
nks
(% o
f GD
P)
1960 1965 1970 1975 1980 1985 1990 1995 2000 2005 2010 2015
Benin Cote d'Ivoire CamaroonGhana Nigeria Senegal
Figure 2-2 Domestic Credit to the Private Sector from Banks
Source: World Development Indicators, World Bank
Figure 2-1 The Financial System
Source: authors
23
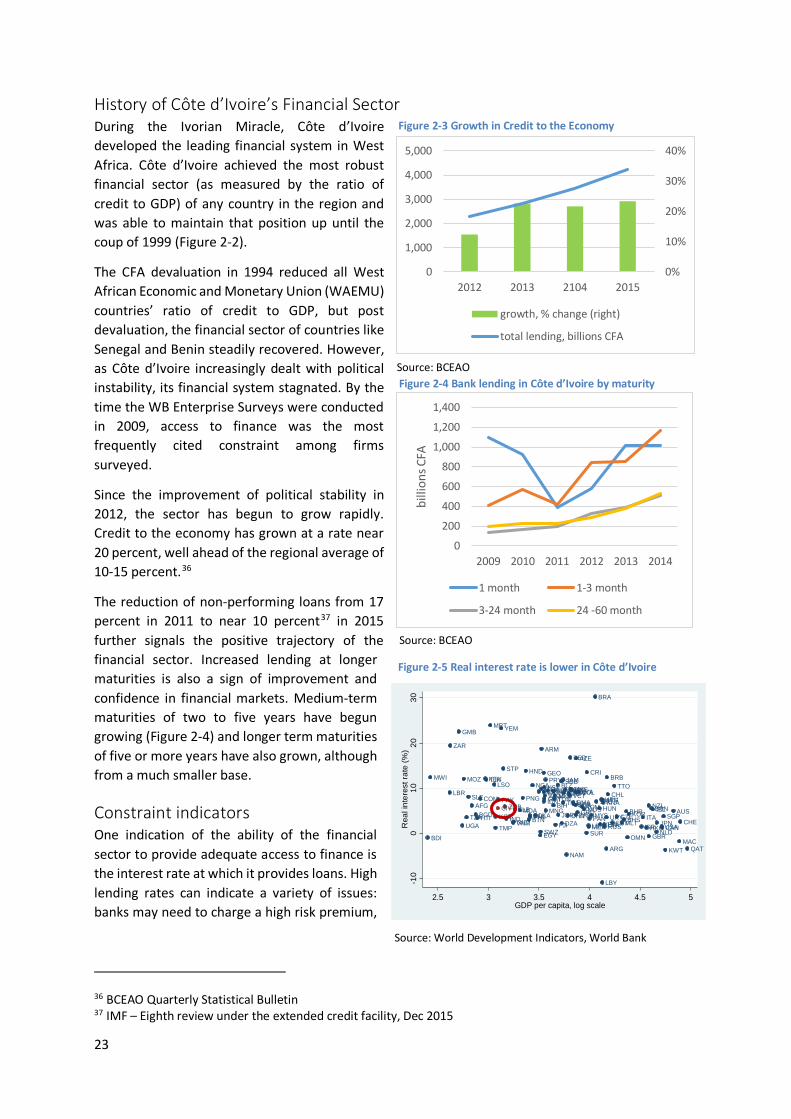
History of Côte d’Ivoire’s Financial Sector During the Ivorian Miracle, Côte d’Ivoire developed the leading financial system in West Africa. Côte d’Ivoire achieved the most robust financial sector (as measured by the ratio of credit to GDP) of any country in the region and was able to maintain that position up until the coup of 1999 (Figure 2-2).
The CFA devaluation in 1994 reduced all West African Economic and Monetary Union (WAEMU) countries’ ratio of credit to GDP, but post devaluation, the financial sector of countries like Senegal and Benin steadily recovered. However, as Côte d’Ivoire increasingly dealt with political instability, its financial system stagnated. By the time the WB Enterprise Surveys were conducted in 2009, access to finance was the most frequently cited constraint among firms surveyed.
Since the improvement of political stability in 2012, the sector has begun to grow rapidly. Credit to the economy has grown at a rate near 20 percent, well ahead of the regional average of 10-15 percent.36
The reduction of non-performing loans from 17 percent in 2011 to near 10 percent37 in 2015 further signals the positive trajectory of the financial sector. Increased lending at longer maturities is also a sign of improvement and confidence in financial markets. Medium-term maturities of two to five years have begun growing (Figure 2-4) and longer term maturities of five or more years have also grown, although from a much smaller base.
Constraint indicators One indication of the ability of the financial sector to provide adequate access to finance is the interest rate at which it provides loans. High lending rates can indicate a variety of issues: banks may need to charge a high risk premium,
36 BCEAO Quarterly Statistical Bulletin 37 IMF – Eighth review under the extended credit facility, Dec 2015
Figure 2-5 Real interest rate is lower in Côte d’Ivoire
AFG
AGOALB
ARG
ARM
ATG
AUS
AZE
BDI
BGDBGR
BHRBHS
BIH
BLZ
BOL
BRA
BRB
BRN
BTN
BWA
CANCHE
CHL
CHN
COLCOM
CPV
CRI
CZE
DMA
DOM
DZA
EGY
ESTFJI
FSM
GBR
GEO
GMB
GRD
GTMGUY
HKG
HND
HRV
HTIHUN
IDN
IND
IRQ
ISL
ISRITA
JAM
JORJPN
KEN
KGZ
KNA
KOR
KSV
KWT
LBN
LBR
LBY
LCALKA
LSO
LVA
MAC
MDA
MDV
MEX
MKD
MLT
MNE
MNG
MOZ
MRT
MUS
MWI
MYS
NAM
NGA
NICNLD
NZL
OMN
PAK
PAN
PER
PHL
PNG
PRY
QAT
ROM
RUSSGP
SLB
SLE
SRB
STP
SURSWZ
SYCTHA
TJK
TMP
TON
TTO
TZAUGA
UKR
URYUSA
VCT
VENVNM
WSM
YEM
ZAF
ZAR
ZMBCIV
-10
010
2030
Rea
l int
eres
t rat
e (%
)
2.5 3 3.5 4 4.5 5GDP per capita, log scale
Source: World Development Indicators, World Bank
0%
10%
20%
30%
40%
0
1,000
2,000
3,000
4,000
5,000
2012 2013 2104 2015
growth, % change (right)
total lending, billions CFA
Source: BCEAO
Figure 2-3 Growth in Credit to the Economy
Source: BCEAO
Figure 2-4 Bank lending in Côte d’Ivoire by maturity
0
200
400
600
800
1,000
1,200
1,400
2009 2010 2011 2012 2013 2014
billi
ons C
FA
1 month 1-3 month
3-24 month 24 -60 month
24
are able to charge higher rates due to a lack of competition in the sector, or face limited available savings.
In Côte d’Ivoire, the median lending rate of 10 to 11 percent over the last few years is close to the regional average of 9.5 percent. While consultations and surveys reveal that firms find these rates to be high, it would be unusual for a country at Côte d’Ivoire’s level of development and post-conflict status to have much lower rates. After discounting for inflation, Côte d’Ivoire’s real interest rate (Figure 2-5.) is actually lower than an international comparison of countries at a similar level of GDP per capita.
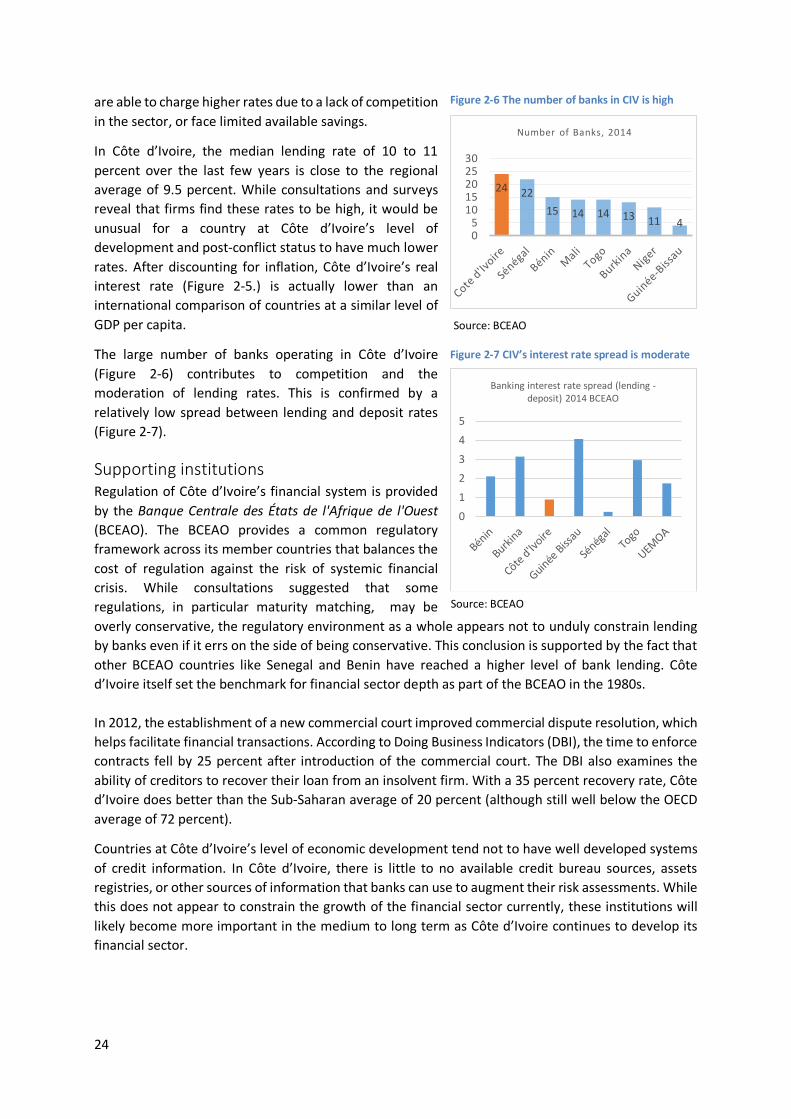
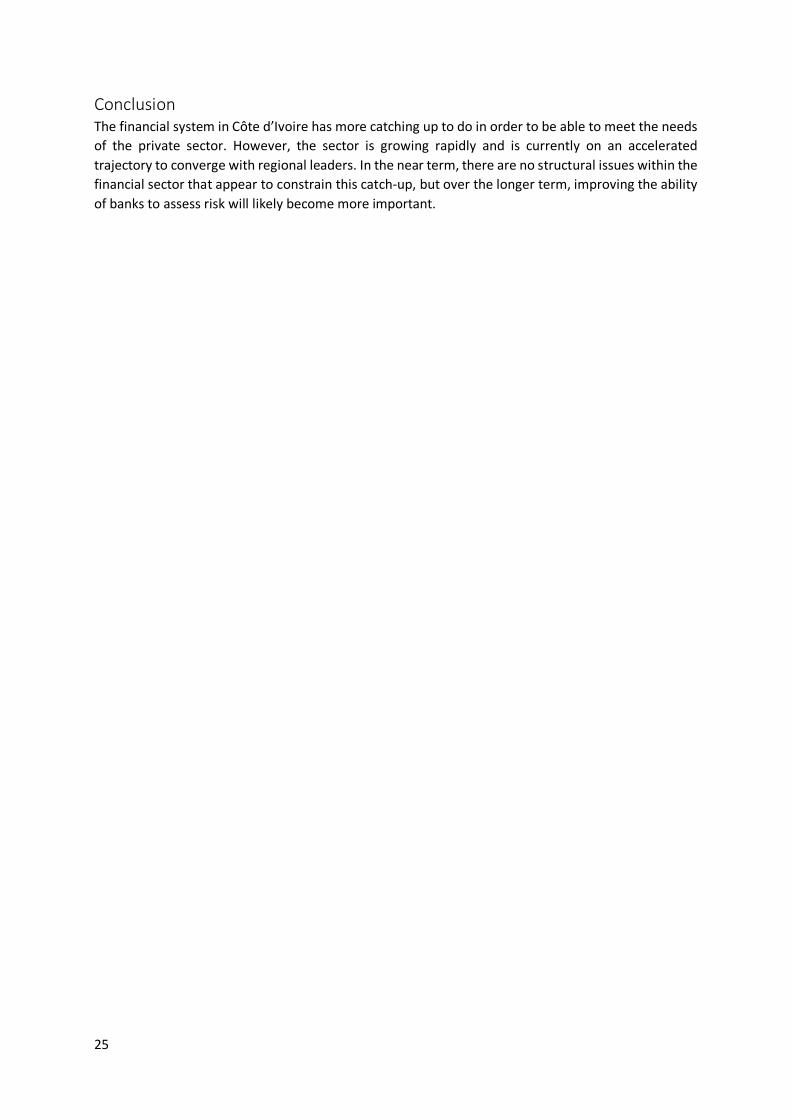
The large number of banks operating in Côte d’Ivoire (Figure 2-6) contributes to competition and the moderation of lending rates. This is confirmed by a relatively low spread between lending and deposit rates (Figure 2-7).
Supporting institutions Regulation of Côte d’Ivoire’s financial system is provided by the Banque Centrale des États de l'Afrique de l'Ouest (BCEAO). The BCEAO provides a common regulatory framework across its member countries that balances the cost of regulation against the risk of systemic financial crisis. While consultations suggested that some regulations, in particular maturity matching, may be overly conservative, the regulatory environment as a whole appears not to unduly constrain lending by banks even if it errs on the side of being conservative. This conclusion is supported by the fact that other BCEAO countries like Senegal and Benin have reached a higher level of bank lending. Côte d’Ivoire itself set the benchmark for financial sector depth as part of the BCEAO in the 1980s. In 2012, the establishment of a new commercial court improved commercial dispute resolution, which helps facilitate financial transactions. According to Doing Business Indicators (DBI), the time to enforce contracts fell by 25 percent after introduction of the commercial court. The DBI also examines the ability of creditors to recover their loan from an insolvent firm. With a 35 percent recovery rate, Côte d’Ivoire does better than the Sub-Saharan average of 20 percent (although still well below the OECD average of 72 percent).
Countries at Côte d’Ivoire’s level of economic development tend not to have well developed systems of credit information. In Côte d’Ivoire, there is little to no available credit bureau sources, assets registries, or other sources of information that banks can use to augment their risk assessments. While this does not appear to constrain the growth of the financial sector currently, these institutions will likely become more important in the medium to long term as Côte d’Ivoire continues to develop its financial sector.
Source: Authors based on data from
Figure 2-6 The number of banks in CIV is high
24 2215 14 14 13 11 4
05
1015202530
Number of Banks, 2014
Source: BCEAO
Figure 2-7 CIV’s interest rate spread is moderate
012345
Banking interest rate spread (lending -deposit) 2014 BCEAO
Source: BCEAO
25
Conclusion The financial system in Côte d’Ivoire has more catching up to do in order to be able to meet the needs of the private sector. However, the sector is growing rapidly and is currently on an accelerated trajectory to converge with regional leaders. In the near term, there are no structural issues within the financial sector that appear to constrain this catch-up, but over the longer term, improving the ability of banks to assess risk will likely become more important.
26
3. Human Capital Human capital is the set of knowledge, skills, talents, and experiences accumulated by workers that are used in economic production. When adequate human capital is not available in an economy, it can be a major constraint to economic growth. In addition to problems within the education system, poor health can affect the ability of students to learn and reduce the accumulation of human capital. This chapter examines to what degree the level of human capital in Côte d’Ivoire is constraining economic development.
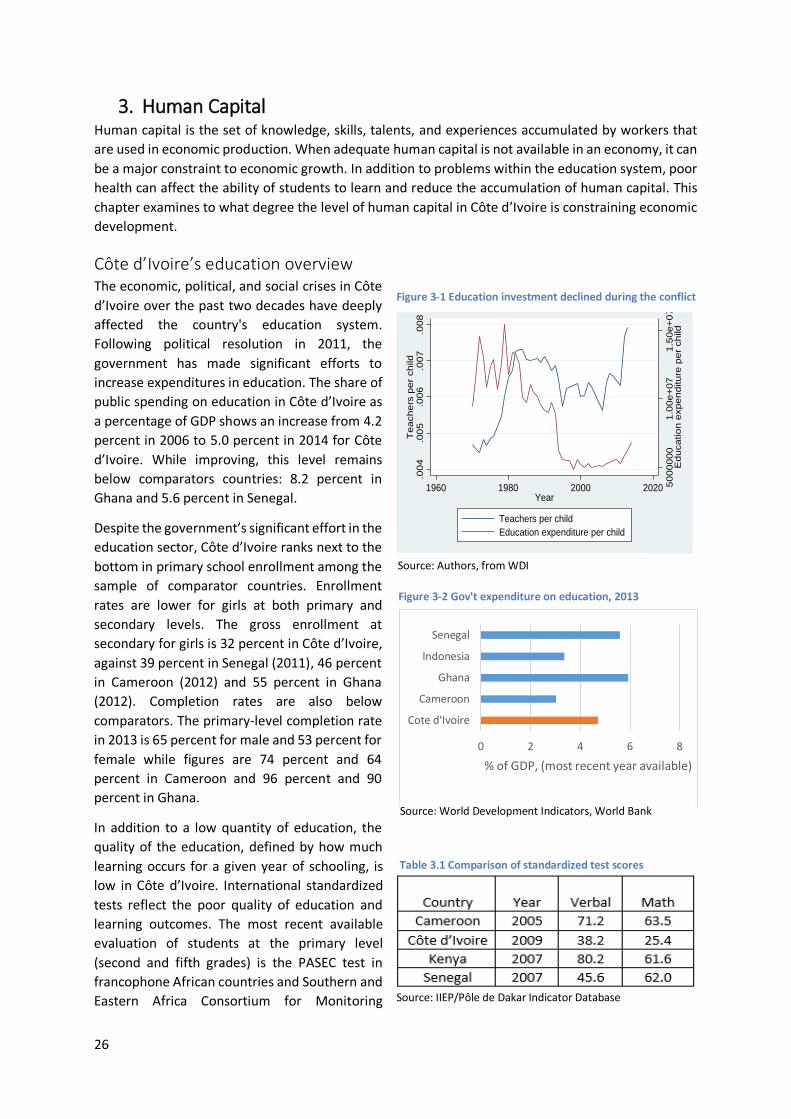
Côte d’Ivoire’s education overview The economic, political, and social crises in Côte d’Ivoire over the past two decades have deeply affected the country's education system. Following political resolution in 2011, the government has made significant efforts to increase expenditures in education. The share of public spending on education in Côte d’Ivoire as a percentage of GDP shows an increase from 4.2 percent in 2006 to 5.0 percent in 2014 for Côte d’Ivoire. While improving, this level remains below comparators countries: 8.2 percent in Ghana and 5.6 percent in Senegal.
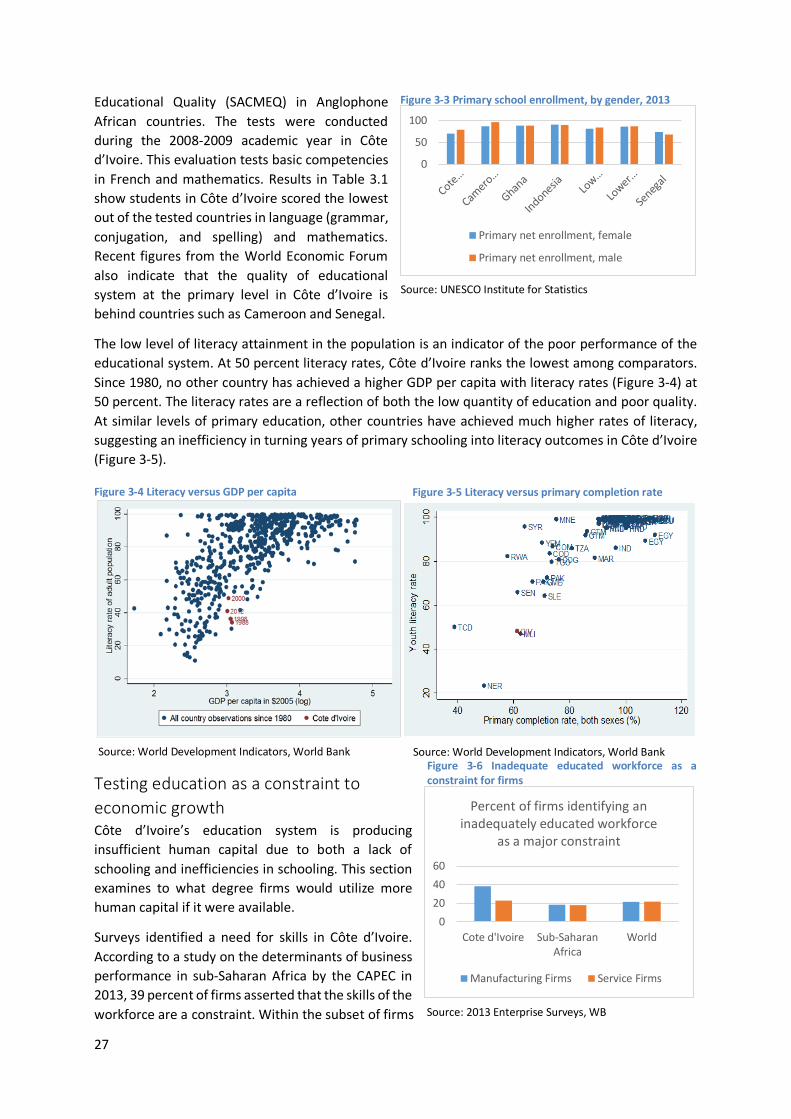
Despite the government’s significant effort in the education sector, Côte d’Ivoire ranks next to the bottom in primary school enrollment among the sample of comparator countries. Enrollment rates are lower for girls at both primary and secondary levels. The gross enrollment at secondary for girls is 32 percent in Côte d’Ivoire, against 39 percent in Senegal (2011), 46 percent in Cameroon (2012) and 55 percent in Ghana (2012). Completion rates are also below comparators. The primary-level completion rate in 2013 is 65 percent for male and 53 percent for female while figures are 74 percent and 64 percent in Cameroon and 96 percent and 90 percent in Ghana.
In addition to a low quantity of education, the quality of the education, defined by how much learning occurs for a given year of schooling, is low in Côte d’Ivoire. International standardized tests reflect the poor quality of education and learning outcomes. The most recent available evaluation of students at the primary level (second and fifth grades) is the PASEC test in francophone African countries and Southern and Eastern Africa Consortium for Monitoring Source: IIEP/Pôle de Dakar Indicator Database
Table 3.1 Comparison of standardized test scores
5000
000
1.00
e+07
1.50
e+07
Edu
catio
n ex
pend
iture
per
chi
ld
.004
.005
.006
.007
.008
Tea
cher
s pe
r ch
ild
1960 1980 2000 2020Year
Teachers per childEducation expenditure per child
Source: Authors, from WDI
Figure 3-1 Education investment declined during the conflict
0 2 4 6 8
Cote d'Ivoire
Cameroon
Ghana
Indonesia
Senegal
% of GDP, (most recent year available)
Figure 3-2 Gov't expenditure on education, 2013
Source: World Development Indicators, World Bank
27
Educational Quality (SACMEQ) in Anglophone African countries. The tests were conducted during the 2008-2009 academic year in Côte d’Ivoire. This evaluation tests basic competencies in French and mathematics. Results in Table 3.1 show students in Côte d’Ivoire scored the lowest out of the tested countries in language (grammar, conjugation, and spelling) and mathematics. Recent figures from the World Economic Forum also indicate that the quality of educational system at the primary level in Côte d’Ivoire is behind countries such as Cameroon and Senegal.
The low level of literacy attainment in the population is an indicator of the poor performance of the educational system. At 50 percent literacy rates, Côte d’Ivoire ranks the lowest among comparators. Since 1980, no other country has achieved a higher GDP per capita with literacy rates (Figure 3-4) at 50 percent. The literacy rates are a reflection of both the low quantity of education and poor quality. At similar levels of primary education, other countries have achieved much higher rates of literacy, suggesting an inefficiency in turning years of primary schooling into literacy outcomes in Côte d’Ivoire (Figure 3-5).
Testing education as a constraint to economic growth Côte d’Ivoire’s education system is producing insufficient human capital due to both a lack of schooling and inefficiencies in schooling. This section examines to what degree firms would utilize more human capital if it were available.
Surveys identified a need for skills in Côte d’Ivoire. According to a study on the determinants of business performance in sub-Saharan Africa by the CAPEC in 2013, 39 percent of firms asserted that the skills of the workforce are a constraint. Within the subset of firms
Figure 3-4 Literacy versus GDP per capita
Source: World Development Indicators, World Bank
Figure 3-5 Literacy versus primary completion rate
Source: World Development Indicators, World Bank
0
50
100
Primary net enrollment, female
Primary net enrollment, male
Figure 3-3 Primary school enrollment, by gender, 2013
Source: UNESCO Institute for Statistics
0204060
Cote d'Ivoire Sub-SaharanAfrica
World
Percent of firms identifying an inadequately educated workforce
as a major constraint
Manufacturing Firms Service Firms
Figure 3-6 Inadequate educated workforce as a constraint for firms
Source: 2013 Enterprise Surveys, WB
28
surveyed in the industrial sector, 49 percent report that available competences are a major constraint to their activities. This may reflect a situation where firms in the industry that are more dependent on technical skills are not thriving in the economy. The 2009 World Bank Enterprise Survey found similar results.
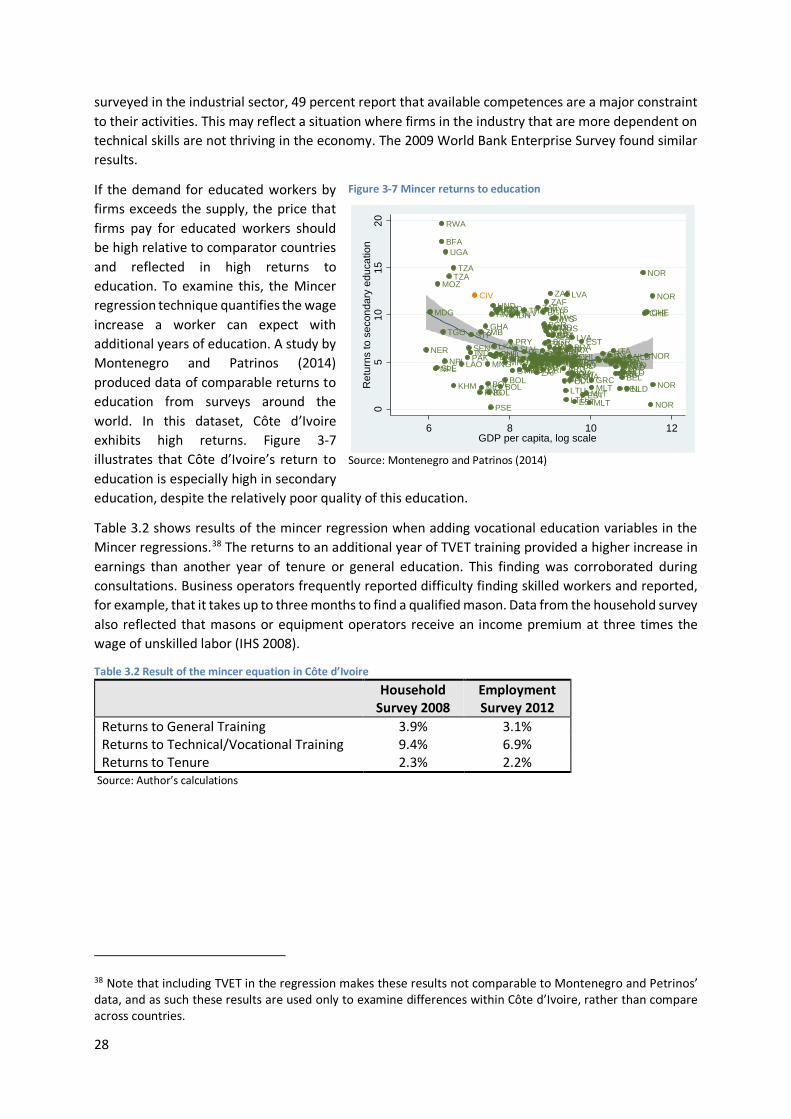
If the demand for educated workers by firms exceeds the supply, the price that firms pay for educated workers should be high relative to comparator countries and reflected in high returns to education. To examine this, the Mincer regression technique quantifies the wage increase a worker can expect with additional years of education. A study by Montenegro and Patrinos (2014) produced data of comparable returns to education from surveys around the world. In this dataset, Côte d’Ivoire exhibits high returns. Figure 3-7 illustrates that Côte d’Ivoire’s return to education is especially high in secondary education, despite the relatively poor quality of this education.
Table 3.2 shows results of the mincer regression when adding vocational education variables in the Mincer regressions.38 The returns to an additional year of TVET training provided a higher increase in earnings than another year of tenure or general education. This finding was corroborated during consultations. Business operators frequently reported difficulty finding skilled workers and reported, for example, that it takes up to three months to find a qualified mason. Data from the household survey also reflected that masons or equipment operators receive an income premium at three times the wage of unskilled labor (IHS 2008).
Table 3.2 Result of the mincer equation in Côte d’Ivoire Household
Survey 2008 Employment Survey 2012
Returns to General Training 3.9% 3.1% Returns to Technical/Vocational Training 9.4% 6.9% Returns to Tenure 2.3% 2.2%
Source: Author’s calculations
38 Note that including TVET in the regression makes these results not comparable to Montenegro and Petrinos’ data, and as such these results are used only to examine differences within Côte d’Ivoire, rather than compare across countries.
Figure 3-7 Mincer returns to education
ARGARGARGARG
BEL
BEL
BELBELBOLBOL
BOLBOL
BRABRABRABRA
BGRBGRBGR
BGRBGR
BFA
KHM
CHLCHLCOLCOLCOLCOLCOLCRICRIDOM
DOMDOMDOMECUECUECUECUECU
SLV
SLV
ESTEST
EST
EST
FRAFRAFRAFRA
FRA
GHA
GRCGRC
GRCGRC
GRCGTM
HNDHNDHNDHND
IND
IDNIDNIDN
ITAITAITAITAITA
LAOLVA
LVA
LVA
LVA
LTULTU
MDGMYS
MYSMYS
MLTMLT
MLT
MUSMUSMUSMUS
MEXMEXMEXMNGMNG
MNG
MOZ
NPLNPL NLD
NLDNLD
NLD
NLD
NIC
NER
NOR
NOR
NOR
NOR
NOR
PAK
PAN
PANPANPANPAN
PNG
PRY
PRYPRYPRYPERPERPER
PERPERPHLPHLPHLPHL
POL
POLPOLPOLPOL
RWA
STPSEN SRB
SLE ZAF
ZAFZAFZAF
LKALKA
CHECHE
TZATZA
THA
THA
TGO
TURTURTUR
UGA
USAURYURYURYURYURY
PSE
ZMB
CIV
05
1015
20R
etur
ns to
sec
onda
ry e
duca
tion
6 8 10 12GDP per capita, log scale
Source: Montenegro and Patrinos (2014)
29
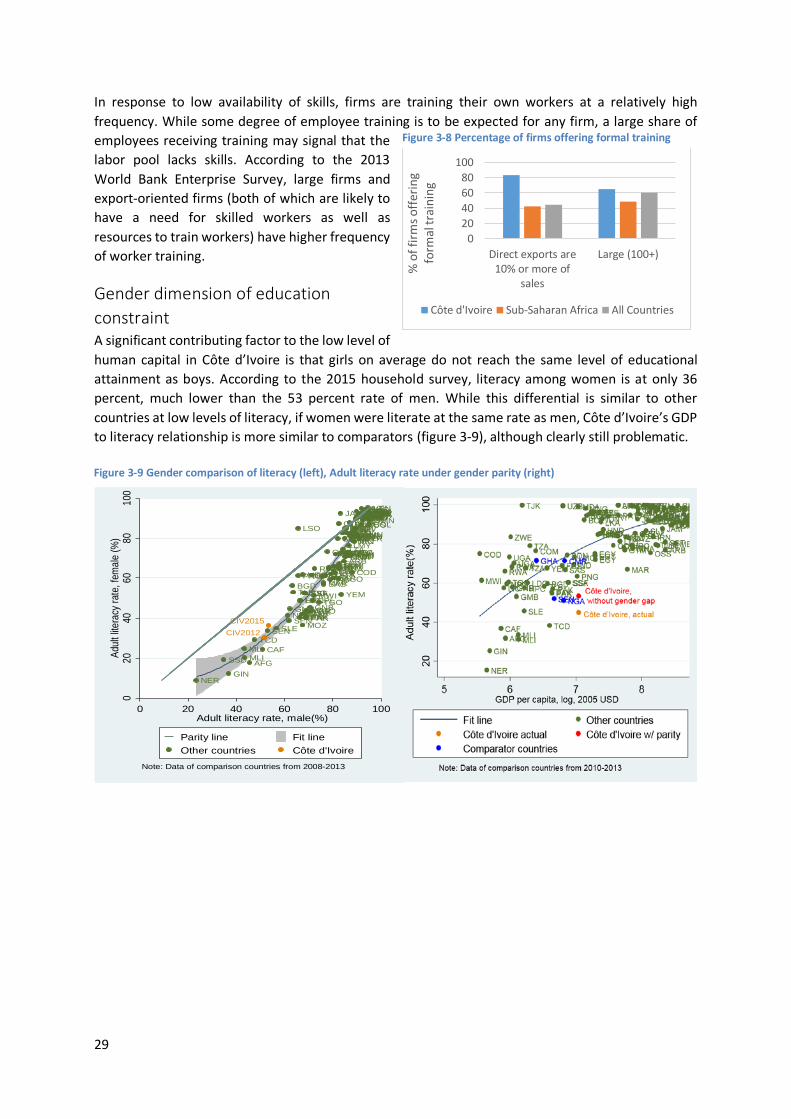
In response to low availability of skills, firms are training their own workers at a relatively high frequency. While some degree of employee training is to be expected for any firm, a large share of employees receiving training may signal that the labor pool lacks skills. According to the 2013 World Bank Enterprise Survey, large firms and export-oriented firms (both of which are likely to have a need for skilled workers as well as resources to train workers) have higher frequency of worker training.
Gender dimension of education constraint A significant contributing factor to the low level of human capital in Côte d’Ivoire is that girls on average do not reach the same level of educational attainment as boys. According to the 2015 household survey, literacy among women is at only 36 percent, much lower than the 53 percent rate of men. While this differential is similar to other countries at low levels of literacy, if women were literate at the same rate as men, Côte d’Ivoire’s GDP to literacy relationship is more similar to comparators (figure 3-9), although clearly still problematic.
AFG
AGO
ARB
BGD
BOLBWABRABRABRABRABRABRA
BDICPV
KHMKHMCMR
CSS
CAFTCD
COLCOLCOLCOL
COM
COD
COG
DOMDOMDOMDOM
ECU
ECUECUECUECU
EGYEGYEGY
SLVSLVSLVSLVSLV
ERIFCS
GAB
GMB
GHA
GTMGTM
GIN
GNB
GUY
HPC
HNDHNDHNDHNDHND
IND
IRNIRNIRQ
JAM LCNLAC
LDC
LSO
LMY
LIC
LMCMDG
MWI
MLIMLI
MLT
MUSMEXMEXMEXMEX
MEAMNA
MIC
MARMAR
MAR
MOZ
NPL
NER
NGA
OMNOMN
OMN
OSS
PAKPAKPAKPAKPAK
PAN
PNG
PRYPRYPRYPRIQAT
RWARWA
STP
SENSEN
SEN
SYC
SLE
SST
ZAFZAFZAFZAF
SAS
SSD
LKALKA
SSFSSA
SDN
SWZSYR
TZA
TZA
TLS
TGOTGO
TUNTUNTUN
UGAUGA
VUT
VEN
WLD
YEM
ZWE
CIV2012CIV2015
020
4060
8010
0Ad
ult lit
erac
y rat
e, fe
male
(%)
0 20 40 60 80 100Adult literacy rate, male(%)
Parity line Fit lineOther countries Côte d'Ivoire
Note: Data of comparison countries from 2008-2013
Figure 3-9 Gender comparison of literacy (left), Adult literacy rate under gender parity (right)
020406080
100
Direct exports are10% or more of
sales
Large (100+)
% o
f firm
s offe
ring
form
al tr
aini
ng
Côte d'Ivoire Sub-Saharan Africa All Countries
Figure 3-8 Percentage of firms offering formal training
30
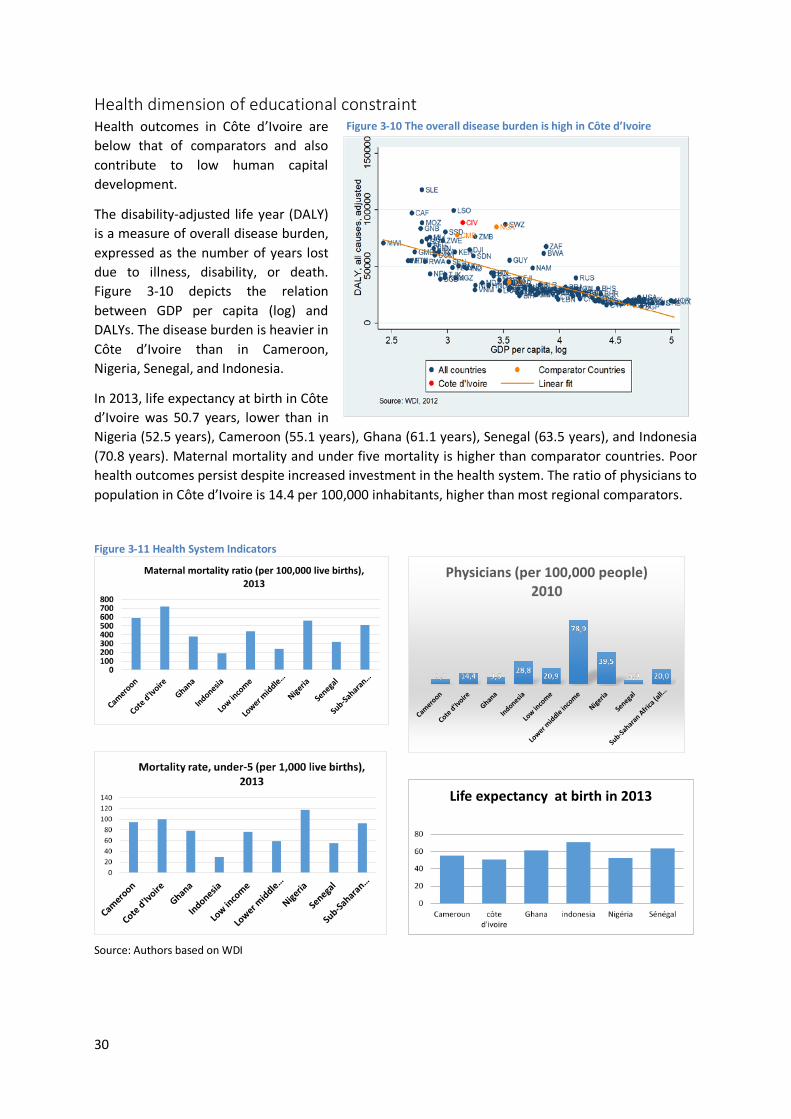
Health dimension of educational constraint Health outcomes in Côte d’Ivoire are below that of comparators and also contribute to low human capital development.
The disability-adjusted life year (DALY) is a measure of overall disease burden, expressed as the number of years lost due to illness, disability, or death. Figure 3-10 depicts the relation between GDP per capita (log) and DALYs. The disease burden is heavier in Côte d’Ivoire than in Cameroon, Nigeria, Senegal, and Indonesia.
In 2013, life expectancy at birth in Côte d’Ivoire was 50.7 years, lower than in Nigeria (52.5 years), Cameroon (55.1 years), Ghana (61.1 years), Senegal (63.5 years), and Indonesia (70.8 years). Maternal mortality and under five mortality is higher than comparator countries. Poor health outcomes persist despite increased investment in the health system. The ratio of physicians to population in Côte d’Ivoire is 14.4 per 100,000 inhabitants, higher than most regional comparators.
Figure 3-11 Health System Indicators
Source: Authors based on WDI
Figure 3-10 The overall disease burden is high in Côte d’Ivoire
31
Conclusion – Human capital is low and a constraint to investment and growth Human capital is a binding constraint due to the low quantity of students completing higher levels of education as well as the inadequate quality of basic education. Educational outcomes in Côte d’Ivoire as measured by literacy, test scores, and completion are below comparators. Internationally comparable indicators of returns to education indicate that the labor market in Côte d’Ivoire provides high rewards for educational attainment. Firm surveys confirm that there is a high demand for educated workers, especially with vocational/technical training. Overall, the economy needs more educated people to attract and generate more investment.
The poor outcomes in the health sector likely contribute to low educational attainment. Similarly, gender-based inequality reduces the educational attainment of women and results in less human capital available in the country. While these factors are important, neither can account for low human capital outcome alone, suggesting that the education system itself must also improve.
32
4. Infrastructure
Infrastructure provides multiple services that are critical for growth. Transport infrastructure provides for the mobility of goods and workers while information and communications technology (ICT) infrastructure provides for the transfer of information. Other types of infrastructure provide key inputs for production such as energy and water. This chapter examines to what degree inadequate provision of infrastructure constrains growth in Côte d’Ivoire and concludes that transport infrastructure is a binding constraint, especially through its impact on the mobility of goods and people throughout Abidjan, one of the country’s main economic engines.
Road Transportation throughout Côte d’Ivoire Following independence in 1960, the country prioritized the modernization of transport infrastructure. Significant public investment was made into road, rail, sea, and air infrastructure. However, the economic decline of the 1980s curtailed investment in the transportation network, and infrastructure quality declined across the country.
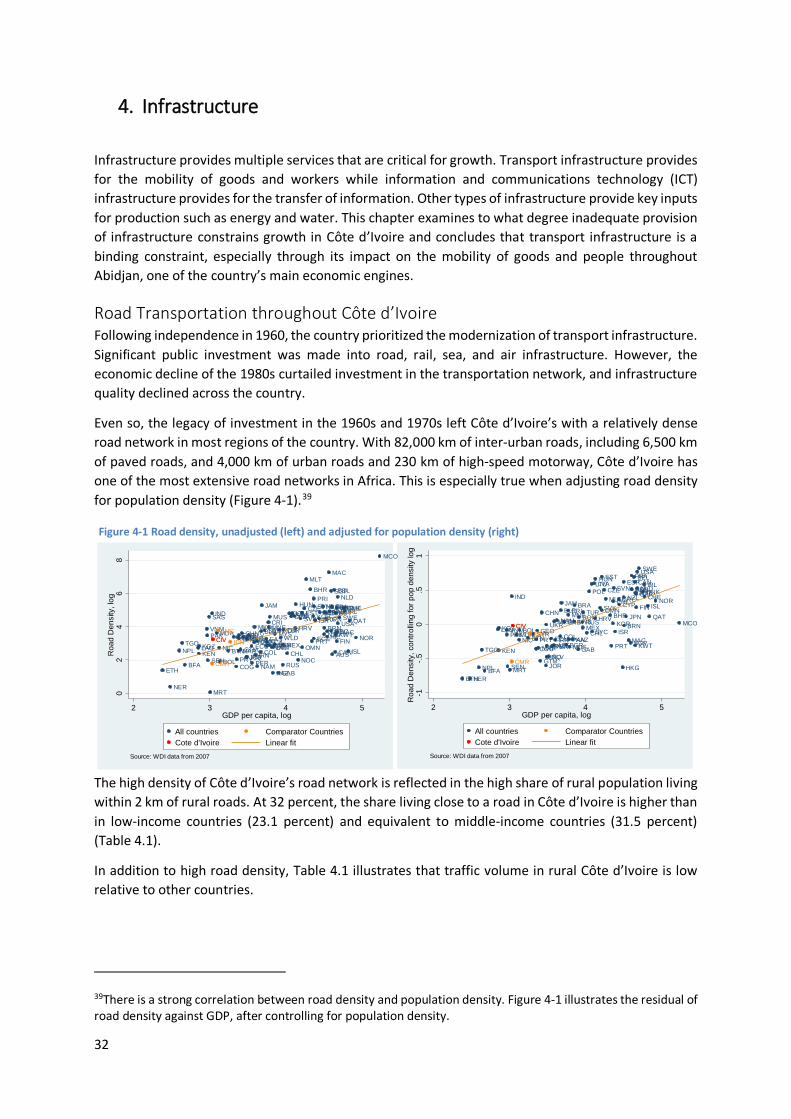
Even so, the legacy of investment in the 1960s and 1970s left Côte d’Ivoire’s with a relatively dense road network in most regions of the country. With 82,000 km of inter-urban roads, including 6,500 km of paved roads, and 4,000 km of urban roads and 230 km of high-speed motorway, Côte d’Ivoire has one of the most extensive road networks in Africa. This is especially true when adjusting road density for population density (Figure 4-1).39
The high density of Côte d’Ivoire’s road network is reflected in the high share of rural population living within 2 km of rural roads. At 32 percent, the share living close to a road in Côte d’Ivoire is higher than in low-income countries (23.1 percent) and equivalent to middle-income countries (31.5 percent) (Table 4.1).
In addition to high road density, Table 4.1 illustrates that traffic volume in rural Côte d’Ivoire is low relative to other countries.
39There is a strong correlation between road density and population density. Figure 4-1 illustrates the residual of road density against GDP, after controlling for population density.
ARM
AUSAUT
AZE
BEL
BFA
BGR
BHRBLR
BOL
BRA
BRN
BTN
CAN
CHE
CHL
CHN
COG
COL
CRICYP
CZE DEUDNK
ECU
ESPEST
ETH
FIN
FRA
GAB
GBR
GEO
GRC
GTMHKG
HRV
HUN
IND
IRL
IRN
IRQ
ISL
ISR
JAM
JOR
JPN
KAZ
KEN
KGZKOR
KWT
LAO
LTULVA
MACMAR
MCO
MDAMEX
MKD
MLT
MNE
MRT
MUS
MYSNAM
NER
NIC
NLD
NOR
NPL
NZL
OMN
PAKPAN
PER
POLPRI
PRTPRY
QATROMRUS
SEN
SGP
SLV
SRB
SVK
SVN
SWE
SYCSYR
TGO
TUR
UKR
USA
VNMCIV
CMR
IDNCIV
-1-.5
0.5
1R
oad
Den
sity
, con
trollin
g fo
r pop
den
sity
log
2 3 4 5GDP per capita, log
All countries Comparator CountriesCote d'Ivoire Linear fit
Source: WDI data from 2007
Figure 4-1 Road density, unadjusted (left) and adjusted for population density (right)
ARM
AUS
AUT
AZE
BEL
BFA
BGR
BHR
BLR
BOL
BRA
BRN
BTN CAN
CEBCHE
CHL
CHN
COG
COL
CRICYPCZE DEUDNK
EAP EASECA ECSECU
EMUESPEST
ETH
EUU
FIN
FRA
GAB
GBR
GEO
GRC
GTM
HIC
HKG
HRV
HUNIND IRL
IRNIRQISL
ISR
JAM
JOR
JPN
KAZ
KENKGZ
KOR
KWT
LACLAO LCNLMY
LTULVA
MAC
MAR
MCO
MDA
MEXMIC
MKD
MLT
MNE
MRT
MUS
MYS NAC
NAM
NER
NIC
NLD
NOC
NOR
NPL
NZLOECOED
OMN
PAKPAN
PER
POL
PRI
PRT
PRY
QATROM
RUS
SAS
SEN
SGP
SLVSRB
SVK
SVN
SWESYC
SYRTGO
TURUKRUMC
USAVNM
WLDCIV
CMR
IDN
LMCCIV
02
46
8R
oad
Den
sity
, log
2 3 4 5GDP per capita, log
All countries Comparator CountriesCote d'Ivoire Linear fit
Source: WDI data from 2007
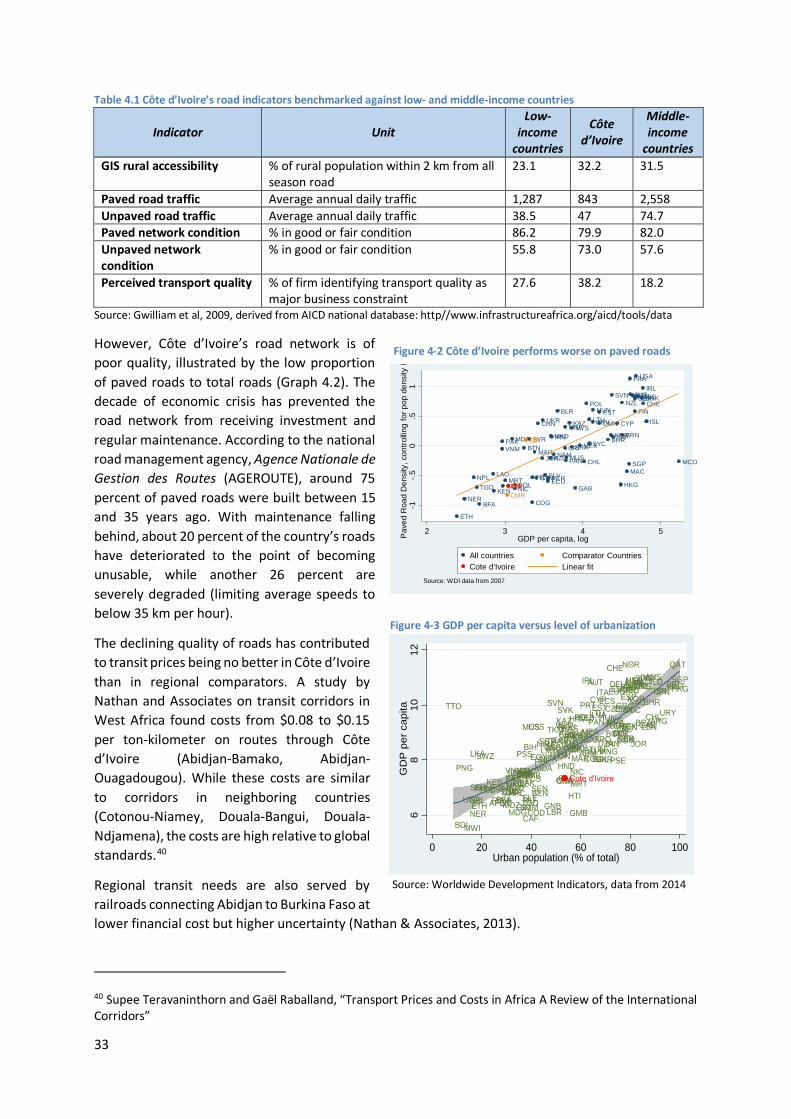
33
Table 4.1 Côte d’Ivoire’s road indicators benchmarked against low- and middle-income countries
Indicator Unit Low-
income countries
Côte d’Ivoire
Middle-income
countries GIS rural accessibility % of rural population within 2 km from all
season road 23.1 32.2 31.5
Paved road traffic Average annual daily traffic 1,287 843 2,558 Unpaved road traffic Average annual daily traffic 38.5 47 74.7 Paved network condition % in good or fair condition 86.2 79.9 82.0 Unpaved network condition
% in good or fair condition 55.8 73.0 57.6
Perceived transport quality % of firm identifying transport quality as major business constraint
27.6 38.2 18.2
Source: Gwilliam et al, 2009, derived from AICD national database: http//www.infrastructureafrica.org/aicd/tools/data
However, Côte d’Ivoire’s road network is of poor quality, illustrated by the low proportion of paved roads to total roads (Graph 4.2). The decade of economic crisis has prevented the road network from receiving investment and regular maintenance. According to the national road management agency, Agence Nationale de Gestion des Routes (AGEROUTE), around 75 percent of paved roads were built between 15 and 35 years ago. With maintenance falling behind, about 20 percent of the country’s roads have deteriorated to the point of becoming unusable, while another 26 percent are severely degraded (limiting average speeds to below 35 km per hour).
The declining quality of roads has contributed to transit prices being no better in Côte d’Ivoire than in regional comparators. A study by Nathan and Associates on transit corridors in West Africa found costs from $0.08 to $0.15 per ton-kilometer on routes through Côte d’Ivoire (Abidjan-Bamako, Abidjan-Ouagadougou). While these costs are similar to corridors in neighboring countries (Cotonou-Niamey, Douala-Bangui, Douala-Ndjamena), the costs are high relative to global standards.40
Regional transit needs are also served by railroads connecting Abidjan to Burkina Faso at lower financial cost but higher uncertainty (Nathan & Associates, 2013).
40 Supee Teravaninthorn and Gaël Raballand, “Transport Prices and Costs in Africa A Review of the International Corridors”
AUSAUT
AZE
BEL
BFA
BHR
BLR
BOL
BRA
BRN
BTN
CHE
CHL
CHN
COG
CRI
CYP
DNK
ECU
EST
ETH
FIN
FRA
GAB
GBR
GTMHKG
HRV
HUN
IRL
IRN
ISL
ISR
JOR
KAZ
KEN
KOR
LAO
LTU
MAC
MARMCO
MDAMEX
MKDMNE
MRT
MUS
MYS
NAM
NERNIC
NPL
NZL
OMN
PAK
PAN
PER
POL
PRYSEN
SGP
SLV
SVN SWE
SYCSYR
TGO
UKR
USA
VNM
CIVCMR
IDN
CIV
-1-.5
0.5
1P
aved
Roa
d D
ensi
ty, c
ontro
lling
for p
op d
ensi
ty lo
g
2 3 4 5GDP per capita, log
All countries Comparator CountriesCote d'Ivoire Linear fit
Source: WDI data from 2007
Figure 4-2 Côte d’Ivoire performs worse on paved roads
AFG
ALBARB
ARE
ARG
ARM
AUSAUT
AZE
BDI
BEL
BENBFA
BGD
BGR
BHR
BIHBLR
BOL
BRABWA
CAF
CAN
CEB
CHE
CHL
CHN
CIVCMR
COD
COG
COLCRICSS
CYPCZE
DEUDNK
DOMDZAEAPEAS
ECA
ECS
ECU
EGY
EMUESP
EST
ETH
EUU
FCS
FINFRA
GAB
GBR
GEO
GHA
GIN GMBGNB
GRC
GTM
HIC HKG
HND
HPC
HRV
HTI
HUN
IDN
IND
IRL
IRNIRQ
ISRITA
JAM JOR
JPN
KAZ
KEN KGZKHM
KORKWT
LAC
LAO
LBN
LBR
LBYLCN
LDCLIC
LKA
LMC
LMY
LSO
LTULVA
MARMDA
MDG
MEA MEX
MIC MKD
MLI
MMR
MNA MNG
MOZ
MRT
MUS
MWI
MYS
NAC
NAM
NER
NGANIC
NLD
NOC
NOR
NPL
NZLOECOED
OMN
OSS
PAK
PAN
PER
PHLPNG
POLPRT
PRYPSE
PSS
QAT
ROURUS
RWA
SAS
SAU
SDN
SEN
SGP
SLE
SLV
SOM
SRB
SSASSD
SSF
SST
SVKSVN
SWE
SWZ
TCDTGO
THA
TJK
TKM
TLS
TTO
TUN
TUR
TZAUGA
UKR
UMC
URY
USA
UZBVNM
WLDZAF
ZMB
ZWECote d'Ivoire
68
1012
GD
P p
er c
apita
0 20 40 60 80 100Urban population (% of total)
Figure 4-3 GDP per capita versus level of urbanization
Source: Worldwide Development Indicators, data from 2014
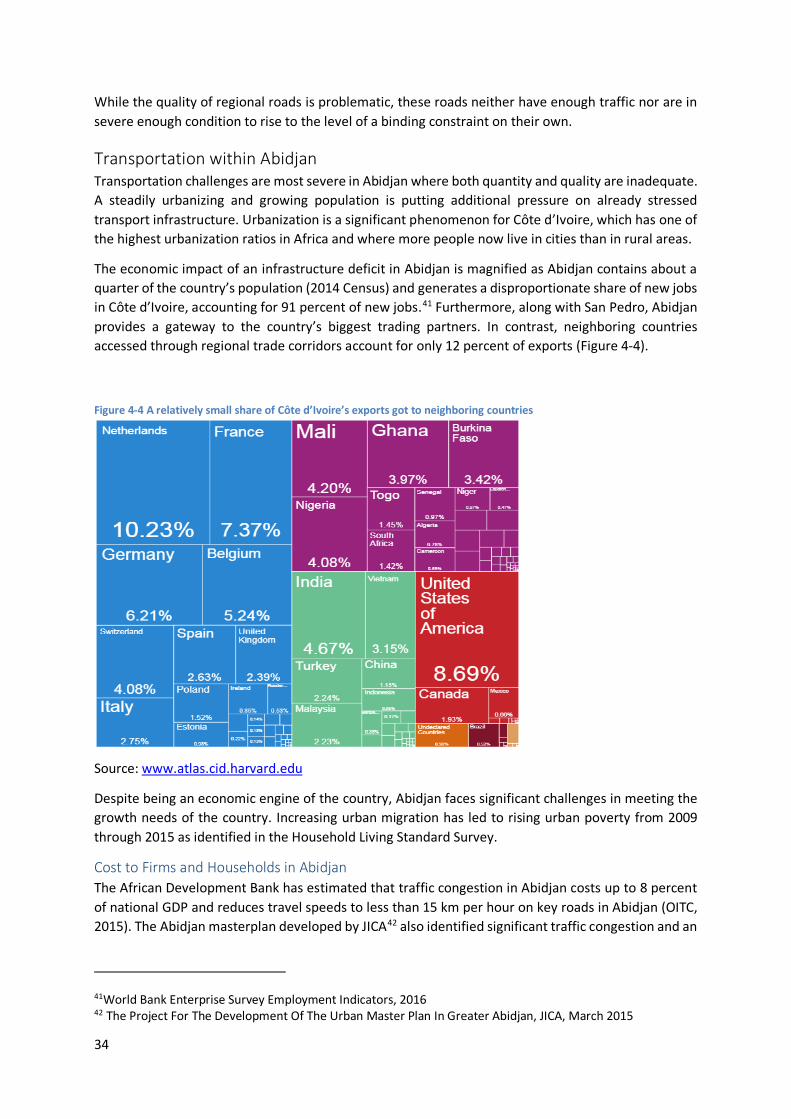
34
While the quality of regional roads is problematic, these roads neither have enough traffic nor are in severe enough condition to rise to the level of a binding constraint on their own.
Transportation within Abidjan Transportation challenges are most severe in Abidjan where both quantity and quality are inadequate. A steadily urbanizing and growing population is putting additional pressure on already stressed transport infrastructure. Urbanization is a significant phenomenon for Côte d’Ivoire, which has one of the highest urbanization ratios in Africa and where more people now live in cities than in rural areas.
The economic impact of an infrastructure deficit in Abidjan is magnified as Abidjan contains about a quarter of the country’s population (2014 Census) and generates a disproportionate share of new jobs in Côte d’Ivoire, accounting for 91 percent of new jobs.41 Furthermore, along with San Pedro, Abidjan provides a gateway to the country’s biggest trading partners. In contrast, neighboring countries accessed through regional trade corridors account for only 12 percent of exports (Figure 4-4).
Source: www.atlas.cid.harvard.edu
Despite being an economic engine of the country, Abidjan faces significant challenges in meeting the growth needs of the country. Increasing urban migration has led to rising urban poverty from 2009 through 2015 as identified in the Household Living Standard Survey.
Cost to Firms and Households in Abidjan The African Development Bank has estimated that traffic congestion in Abidjan costs up to 8 percent of national GDP and reduces travel speeds to less than 15 km per hour on key roads in Abidjan (OITC, 2015). The Abidjan masterplan developed by JICA42 also identified significant traffic congestion and an
41World Bank Enterprise Survey Employment Indicators, 2016 42 The Project For The Development Of The Urban Master Plan In Greater Abidjan, JICA, March 2015
Figure 4-4 A relatively small share of Côte d’Ivoire’s exports got to neighboring countries
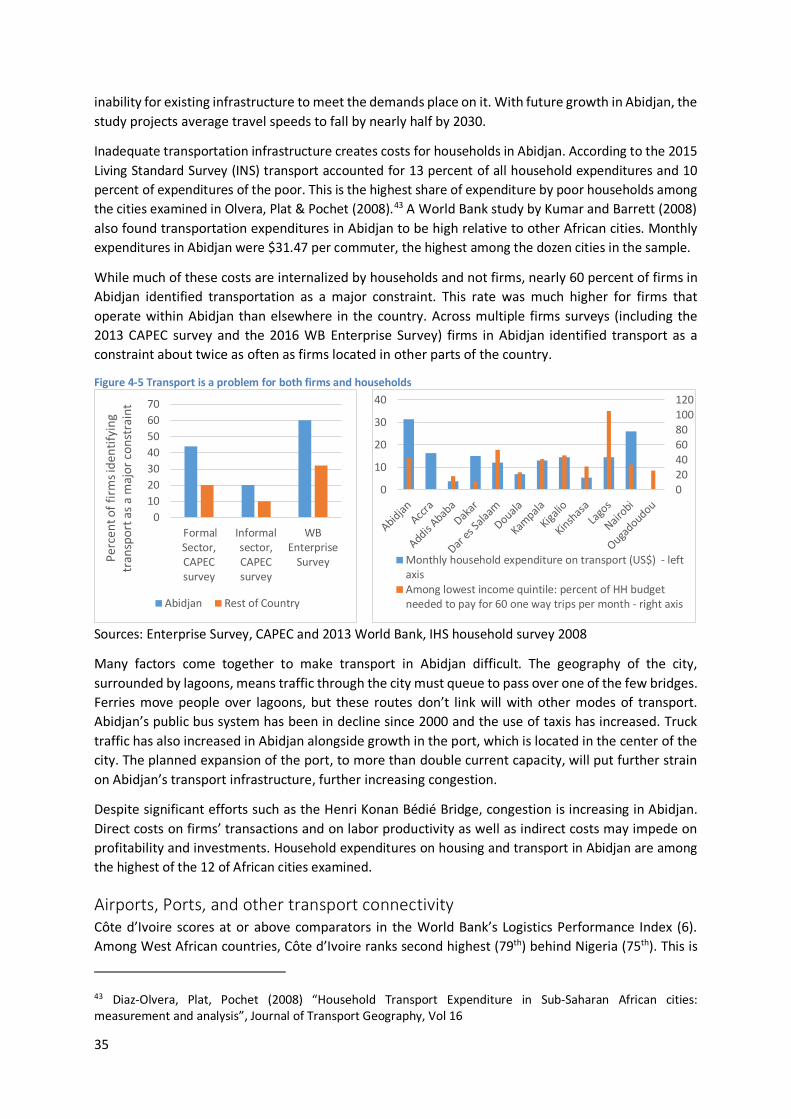
35
inability for existing infrastructure to meet the demands place on it. With future growth in Abidjan, the study projects average travel speeds to fall by nearly half by 2030.
Inadequate transportation infrastructure creates costs for households in Abidjan. According to the 2015 Living Standard Survey (INS) transport accounted for 13 percent of all household expenditures and 10 percent of expenditures of the poor. This is the highest share of expenditure by poor households among the cities examined in Olvera, Plat & Pochet (2008).43 A World Bank study by Kumar and Barrett (2008) also found transportation expenditures in Abidjan to be high relative to other African cities. Monthly expenditures in Abidjan were $31.47 per commuter, the highest among the dozen cities in the sample.
While much of these costs are internalized by households and not firms, nearly 60 percent of firms in Abidjan identified transportation as a major constraint. This rate was much higher for firms that operate within Abidjan than elsewhere in the country. Across multiple firms surveys (including the 2013 CAPEC survey and the 2016 WB Enterprise Survey) firms in Abidjan identified transport as a constraint about twice as often as firms located in other parts of the country.
Figure 4-5 Transport is a problem for both firms and households
Sources: Enterprise Survey, CAPEC and 2013 World Bank, IHS household survey 2008
Many factors come together to make transport in Abidjan difficult. The geography of the city, surrounded by lagoons, means traffic through the city must queue to pass over one of the few bridges. Ferries move people over lagoons, but these routes don’t link will with other modes of transport. Abidjan’s public bus system has been in decline since 2000 and the use of taxis has increased. Truck traffic has also increased in Abidjan alongside growth in the port, which is located in the center of the city. The planned expansion of the port, to more than double current capacity, will put further strain on Abidjan’s transport infrastructure, further increasing congestion.
Despite significant efforts such as the Henri Konan Bédié Bridge, congestion is increasing in Abidjan. Direct costs on firms’ transactions and on labor productivity as well as indirect costs may impede on profitability and investments. Household expenditures on housing and transport in Abidjan are among the highest of the 12 of African cities examined.
Airports, Ports, and other transport connectivity Côte d’Ivoire scores at or above comparators in the World Bank’s Logistics Performance Index (6). Among West African countries, Côte d’Ivoire ranks second highest (79th) behind Nigeria (75th). This is
43 Diaz-Olvera, Plat, Pochet (2008) “Household Transport Expenditure in Sub-Saharan African cities: measurement and analysis”, Journal of Transport Geography, Vol 16
010203040506070
FormalSector,CAPECsurvey
Informalsector,CAPECsurvey
WBEnterprise
SurveyPerc
ent o
f firm
s ide
ntify
ing
tran
spor
t as a
maj
or c
onst
rain
t
Abidjan Rest of Country
020406080100120
0
10
20
30
40
Monthly household expenditure on transport (US$) - leftaxisAmong lowest income quintile: percent of HH budgetneeded to pay for 60 one way trips per month - right axis
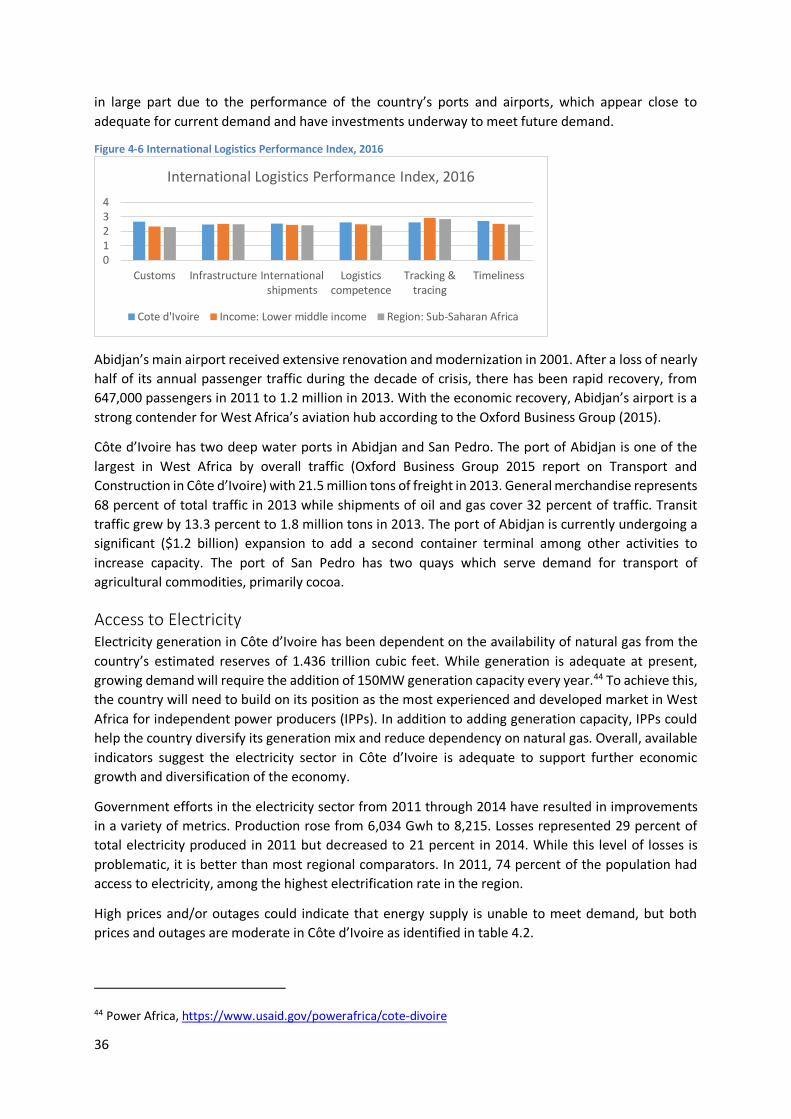
36
in large part due to the performance of the country’s ports and airports, which appear close to adequate for current demand and have investments underway to meet future demand.
Figure 4-6 International Logistics Performance Index, 2016
Abidjan’s main airport received extensive renovation and modernization in 2001. After a loss of nearly half of its annual passenger traffic during the decade of crisis, there has been rapid recovery, from 647,000 passengers in 2011 to 1.2 million in 2013. With the economic recovery, Abidjan’s airport is a strong contender for West Africa’s aviation hub according to the Oxford Business Group (2015).
Côte d’Ivoire has two deep water ports in Abidjan and San Pedro. The port of Abidjan is one of the largest in West Africa by overall traffic (Oxford Business Group 2015 report on Transport and Construction in Côte d’Ivoire) with 21.5 million tons of freight in 2013. General merchandise represents 68 percent of total traffic in 2013 while shipments of oil and gas cover 32 percent of traffic. Transit traffic grew by 13.3 percent to 1.8 million tons in 2013. The port of Abidjan is currently undergoing a significant ($1.2 billion) expansion to add a second container terminal among other activities to increase capacity. The port of San Pedro has two quays which serve demand for transport of agricultural commodities, primarily cocoa.
Access to Electricity Electricity generation in Côte d’Ivoire has been dependent on the availability of natural gas from the country’s estimated reserves of 1.436 trillion cubic feet. While generation is adequate at present, growing demand will require the addition of 150MW generation capacity every year.44 To achieve this, the country will need to build on its position as the most experienced and developed market in West Africa for independent power producers (IPPs). In addition to adding generation capacity, IPPs could help the country diversify its generation mix and reduce dependency on natural gas. Overall, available indicators suggest the electricity sector in Côte d’Ivoire is adequate to support further economic growth and diversification of the economy.
Government efforts in the electricity sector from 2011 through 2014 have resulted in improvements in a variety of metrics. Production rose from 6,034 Gwh to 8,215. Losses represented 29 percent of total electricity produced in 2011 but decreased to 21 percent in 2014. While this level of losses is problematic, it is better than most regional comparators. In 2011, 74 percent of the population had access to electricity, among the highest electrification rate in the region.
High prices and/or outages could indicate that energy supply is unable to meet demand, but both prices and outages are moderate in Côte d’Ivoire as identified in table 4.2.
44 Power Africa, https://www.usaid.gov/powerafrica/cote-divoire
01234
Customs Infrastructure Internationalshipments
Logisticscompetence
Tracking &tracing
Timeliness
International Logistics Performance Index, 2016
Cote d'Ivoire Income: Lower middle income Region: Sub-Saharan Africa
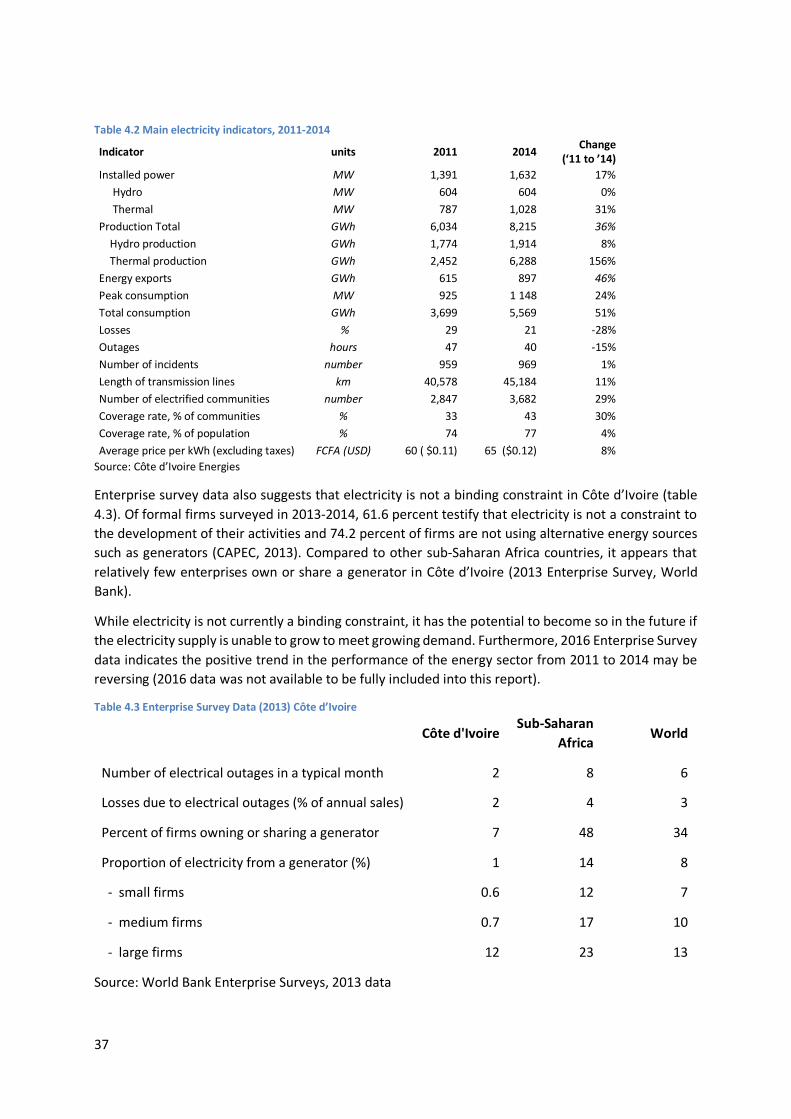
37
Table 4.2 Main electricity indicators, 2011-2014
Indicator units 2011 2014 Change (‘11 to ’14)
Installed power MW 1,391 1,632 17% Hydro MW 604 604 0% Thermal MW 787 1,028 31% Production Total GWh 6,034 8,215 36% Hydro production GWh 1,774 1,914 8% Thermal production GWh 2,452 6,288 156% Energy exports GWh 615 897 46% Peak consumption MW 925 1 148 24% Total consumption GWh 3,699 5,569 51% Losses % 29 21 -28% Outages hours 47 40 -15% Number of incidents number 959 969 1% Length of transmission lines km 40,578 45,184 11% Number of electrified communities number 2,847 3,682 29% Coverage rate, % of communities % 33 43 30% Coverage rate, % of population % 74 77 4% Average price per kWh (excluding taxes) FCFA (USD) 60 ( $0.11) 65 ($0.12) 8%
Source: Côte d’Ivoire Energies
Enterprise survey data also suggests that electricity is not a binding constraint in Côte d’Ivoire (table 4.3). Of formal firms surveyed in 2013-2014, 61.6 percent testify that electricity is not a constraint to the development of their activities and 74.2 percent of firms are not using alternative energy sources such as generators (CAPEC, 2013). Compared to other sub-Saharan Africa countries, it appears that relatively few enterprises own or share a generator in Côte d’Ivoire (2013 Enterprise Survey, World Bank).
While electricity is not currently a binding constraint, it has the potential to become so in the future if the electricity supply is unable to grow to meet growing demand. Furthermore, 2016 Enterprise Survey data indicates the positive trend in the performance of the energy sector from 2011 to 2014 may be reversing (2016 data was not available to be fully included into this report).
Table 4.3 Enterprise Survey Data (2013) Côte d’Ivoire
Côte d'Ivoire Sub-Saharan
Africa World
Number of electrical outages in a typical month 2 8 6
Losses due to electrical outages (% of annual sales) 2 4 3
Percent of firms owning or sharing a generator 7 48 34
Proportion of electricity from a generator (%) 1 14 8
- small firms 0.6 12 7
- medium firms 0.7 17 10
- large firms 12 23 13
Source: World Bank Enterprise Surveys, 2013 data
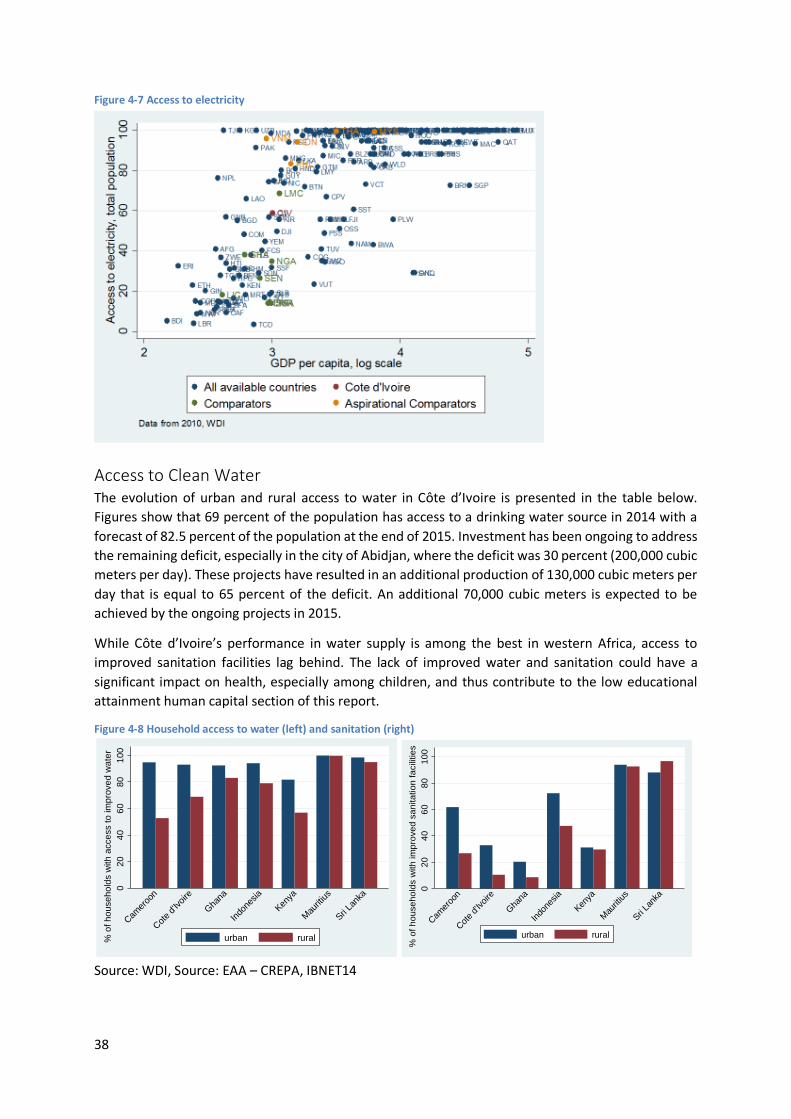
38
Figure 4-7 Access to electricity
Access to Clean Water The evolution of urban and rural access to water in Côte d’Ivoire is presented in the table below. Figures show that 69 percent of the population has access to a drinking water source in 2014 with a forecast of 82.5 percent of the population at the end of 2015. Investment has been ongoing to address the remaining deficit, especially in the city of Abidjan, where the deficit was 30 percent (200,000 cubic meters per day). These projects have resulted in an additional production of 130,000 cubic meters per day that is equal to 65 percent of the deficit. An additional 70,000 cubic meters is expected to be achieved by the ongoing projects in 2015.
While Côte d’Ivoire’s performance in water supply is among the best in western Africa, access to improved sanitation facilities lag behind. The lack of improved water and sanitation could have a significant impact on health, especially among children, and thus contribute to the low educational attainment human capital section of this report.
Figure 4-8 Household access to water (left) and sanitation (right)
Source: WDI, Source: EAA – CREPA, IBNET14
020
4060
8010
0%
of h
ouse
hold
s w
ith a
cces
s to
impr
oved
wat
er
Camero
on
Cote d'
Ivoire
Ghana
Indon
esia
Kenya
Mauriti
us
Sri Lan
ka
urban rural
020
4060
8010
0%
of h
ouse
hold
s w
ith im
prov
ed s
anita
tion
faci
litie
s
Camero
on
Cote d'
Ivoire
Ghana
Indon
esia
Kenya
Mauriti
us
Sri Lan
ka
urban rural
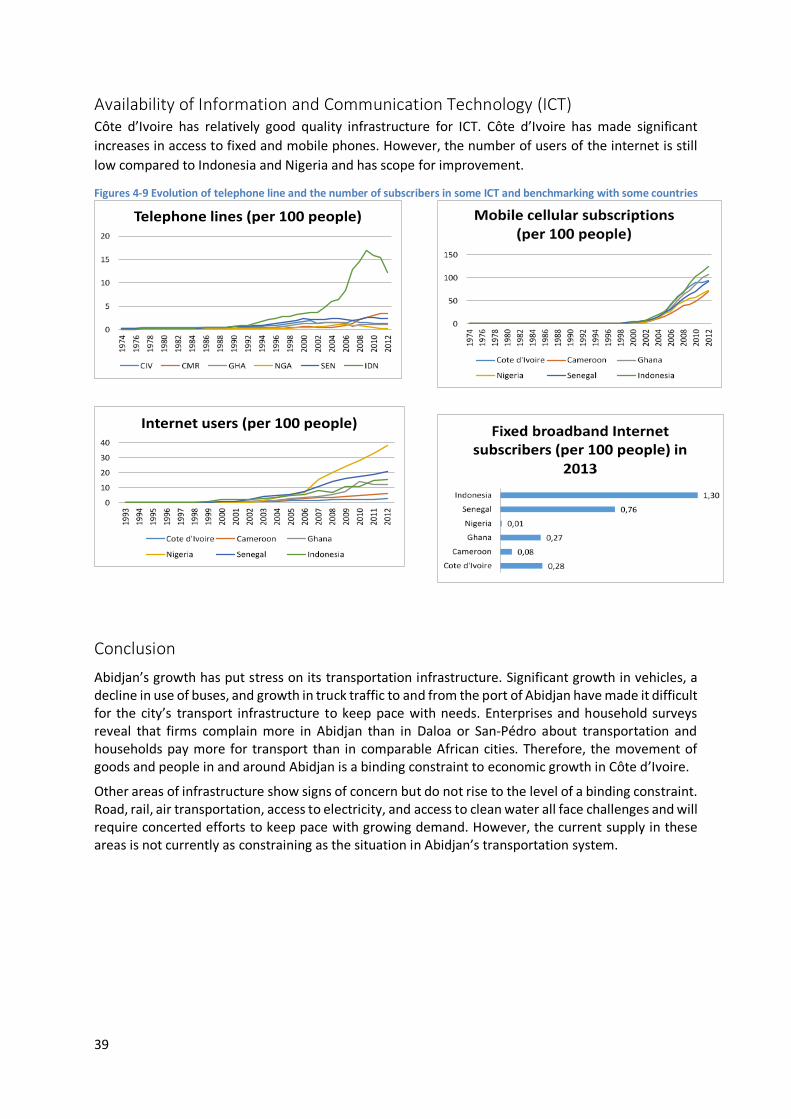
39
Availability of Information and Communication Technology (ICT) Côte d’Ivoire has relatively good quality infrastructure for ICT. Côte d’Ivoire has made significant increases in access to fixed and mobile phones. However, the number of users of the internet is still low compared to Indonesia and Nigeria and has scope for improvement.
Figures 4-9 Evolution of telephone line and the number of subscribers in some ICT and benchmarking with some countries
Conclusion Abidjan’s growth has put stress on its transportation infrastructure. Significant growth in vehicles, a decline in use of buses, and growth in truck traffic to and from the port of Abidjan have made it difficult for the city’s transport infrastructure to keep pace with needs. Enterprises and household surveys reveal that firms complain more in Abidjan than in Daloa or San-Pédro about transportation and households pay more for transport than in comparable African cities. Therefore, the movement of goods and people in and around Abidjan is a binding constraint to economic growth in Côte d’Ivoire.
Other areas of infrastructure show signs of concern but do not rise to the level of a binding constraint. Road, rail, air transportation, access to electricity, and access to clean water all face challenges and will require concerted efforts to keep pace with growing demand. However, the current supply in these areas is not currently as constraining as the situation in Abidjan’s transportation system.
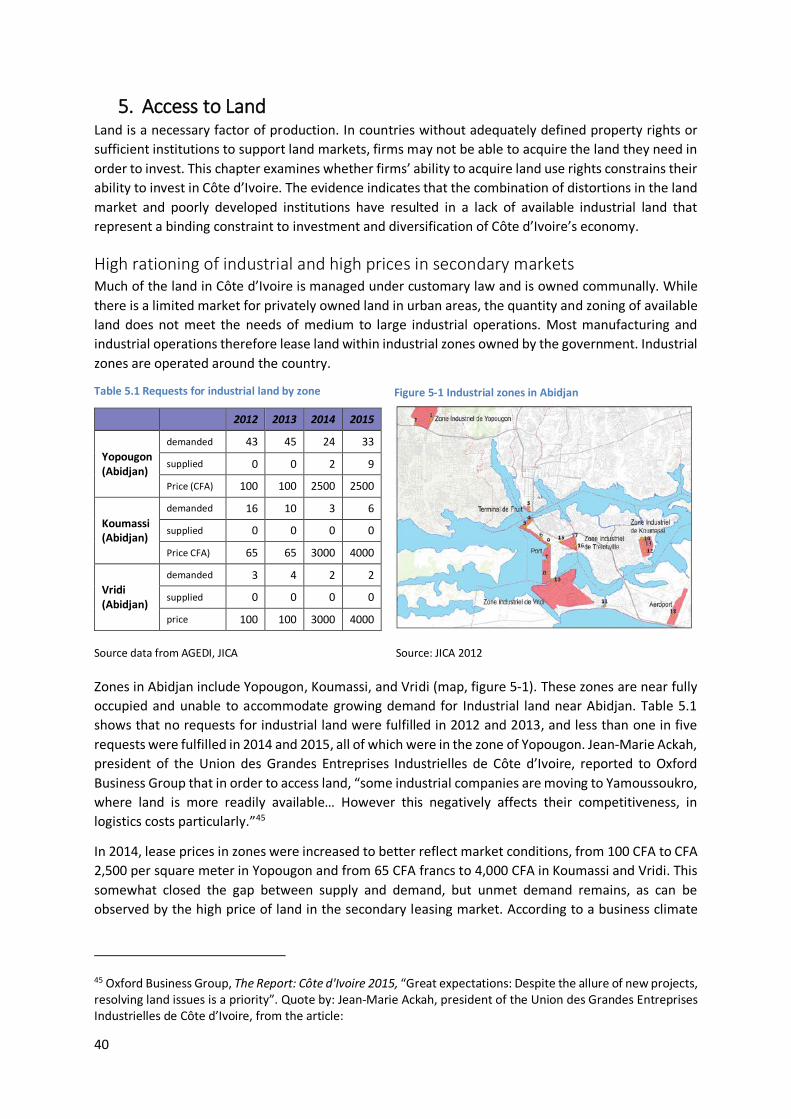
40
5. Access to Land Land is a necessary factor of production. In countries without adequately defined property rights or sufficient institutions to support land markets, firms may not be able to acquire the land they need in order to invest. This chapter examines whether firms’ ability to acquire land use rights constrains their ability to invest in Côte d’Ivoire. The evidence indicates that the combination of distortions in the land market and poorly developed institutions have resulted in a lack of available industrial land that represent a binding constraint to investment and diversification of Côte d’Ivoire’s economy.
High rationing of industrial and high prices in secondary markets Much of the land in Côte d’Ivoire is managed under customary law and is owned communally. While there is a limited market for privately owned land in urban areas, the quantity and zoning of available land does not meet the needs of medium to large industrial operations. Most manufacturing and industrial operations therefore lease land within industrial zones owned by the government. Industrial zones are operated around the country.
Table 5.1 Requests for industrial land by zone
Source data from AGEDI, JICA Source: JICA 2012 Zones in Abidjan include Yopougon, Koumassi, and Vridi (map, figure 5-1). These zones are near fully occupied and unable to accommodate growing demand for Industrial land near Abidjan. Table 5.1 shows that no requests for industrial land were fulfilled in 2012 and 2013, and less than one in five requests were fulfilled in 2014 and 2015, all of which were in the zone of Yopougon. Jean-Marie Ackah, president of the Union des Grandes Entreprises Industrielles de Côte d’Ivoire, reported to Oxford Business Group that in order to access land, “some industrial companies are moving to Yamoussoukro, where land is more readily available… However this negatively affects their competitiveness, in logistics costs particularly.”45
In 2014, lease prices in zones were increased to better reflect market conditions, from 100 CFA to CFA 2,500 per square meter in Yopougon and from 65 CFA francs to 4,000 CFA in Koumassi and Vridi. This somewhat closed the gap between supply and demand, but unmet demand remains, as can be observed by the high price of land in the secondary leasing market. According to a business climate
45 Oxford Business Group, The Report: Côte d'Ivoire 2015, “Great expectations: Despite the allure of new projects, resolving land issues is a priority”. Quote by: Jean-Marie Ackah, president of the Union des Grandes Entreprises Industrielles de Côte d’Ivoire, from the article:
2012 2013 2014 2015
Yopougon (Abidjan)
demanded 43 45 24 33
supplied 0 0 2 9
Price (CFA) 100 100 2500 2500
Koumassi (Abidjan)
demanded 16 10 3 6
supplied 0 0 0 0
Price CFA) 65 65 3000 4000
Vridi (Abidjan)
demanded 3 4 2 2
supplied 0 0 0 0
price 100 100 3000 4000
Figure 5-1 Industrial zones in Abidjan
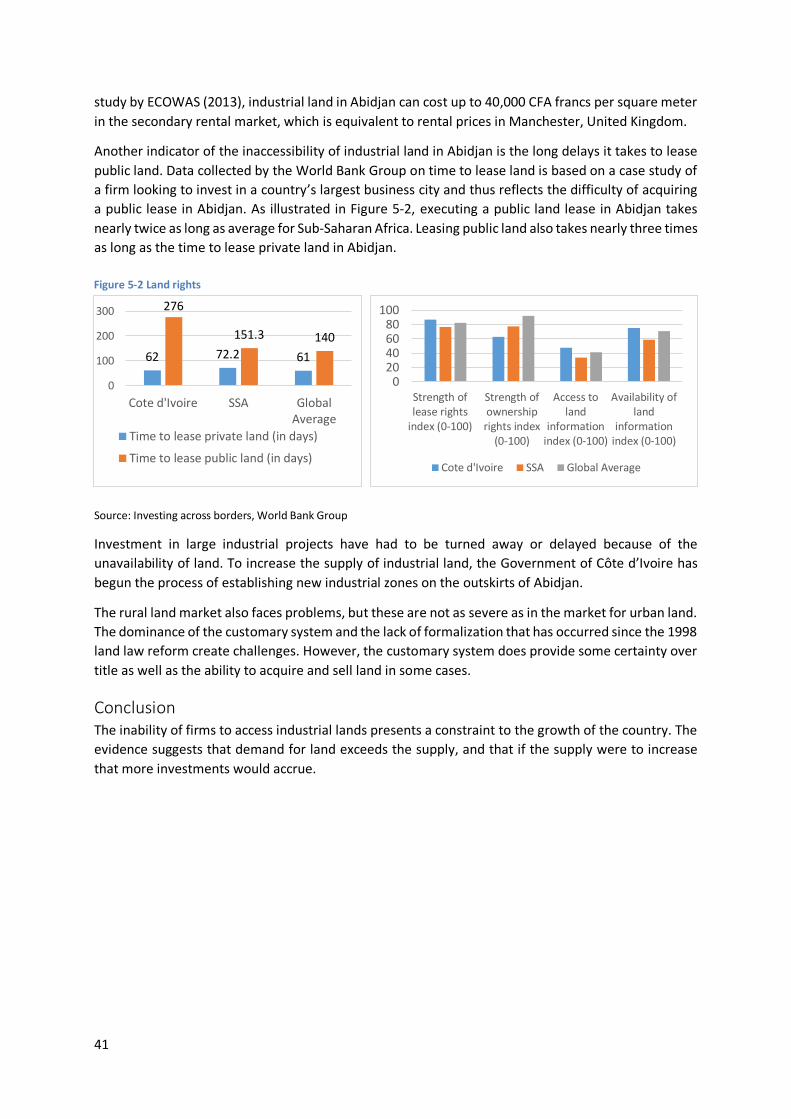
41
study by ECOWAS (2013), industrial land in Abidjan can cost up to 40,000 CFA francs per square meter in the secondary rental market, which is equivalent to rental prices in Manchester, United Kingdom.
Another indicator of the inaccessibility of industrial land in Abidjan is the long delays it takes to lease public land. Data collected by the World Bank Group on time to lease land is based on a case study of a firm looking to invest in a country’s largest business city and thus reflects the difficulty of acquiring a public lease in Abidjan. As illustrated in Figure 5-2, executing a public land lease in Abidjan takes nearly twice as long as average for Sub-Saharan Africa. Leasing public land also takes nearly three times as long as the time to lease private land in Abidjan.
Source: Investing across borders, World Bank Group
Investment in large industrial projects have had to be turned away or delayed because of the unavailability of land. To increase the supply of industrial land, the Government of Côte d’Ivoire has begun the process of establishing new industrial zones on the outskirts of Abidjan.
The rural land market also faces problems, but these are not as severe as in the market for urban land. The dominance of the customary system and the lack of formalization that has occurred since the 1998 land law reform create challenges. However, the customary system does provide some certainty over title as well as the ability to acquire and sell land in some cases.
Conclusion The inability of firms to access industrial lands presents a constraint to the growth of the country. The evidence suggests that demand for land exceeds the supply, and that if the supply were to increase that more investments would accrue.
62 72.2 61
276
151.3 140
0
100
200
300
Cote d'Ivoire SSA GlobalAverage
Time to lease private land (in days)
Time to lease public land (in days)
020406080
100
Strength oflease rights
index (0-100)
Strength ofownershiprights index
(0-100)
Access toland
informationindex (0-100)
Availability ofland
informationindex (0-100)
Cote d'Ivoire SSA Global Average
Figure 5-2 Land rights
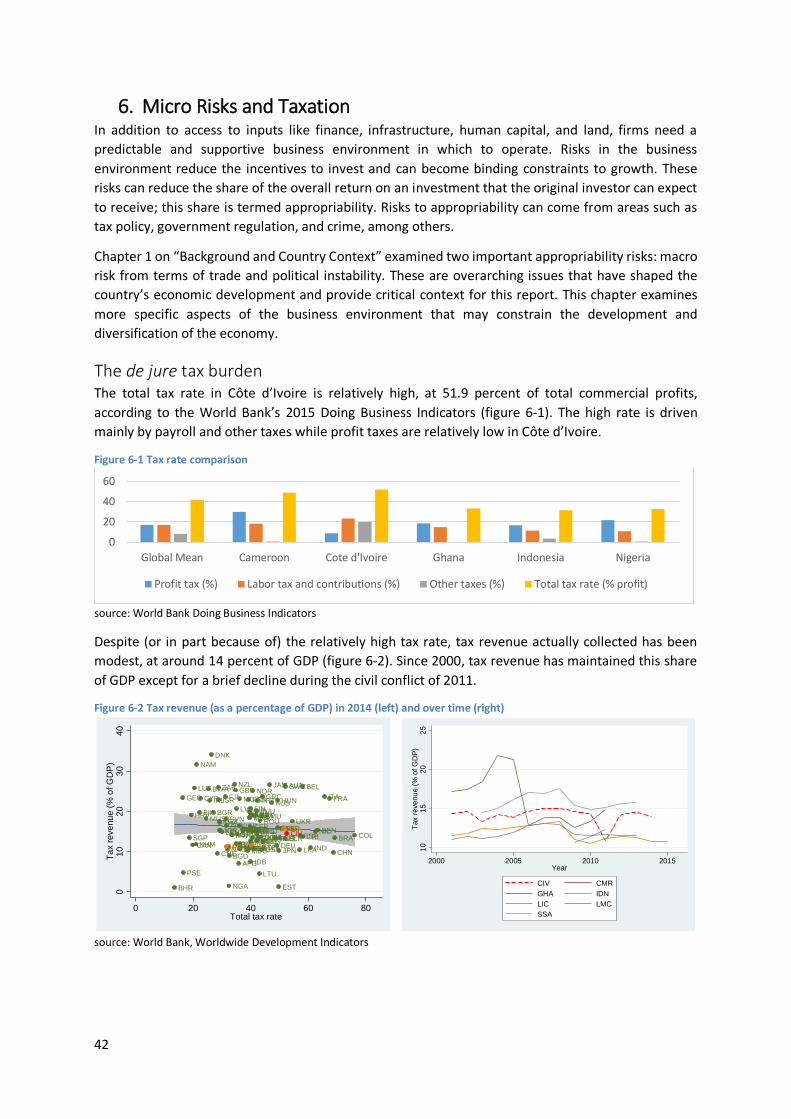
42
6. Micro Risks and Taxation In addition to access to inputs like finance, infrastructure, human capital, and land, firms need a predictable and supportive business environment in which to operate. Risks in the business environment reduce the incentives to invest and can become binding constraints to growth. These risks can reduce the share of the overall return on an investment that the original investor can expect to receive; this share is termed appropriability. Risks to appropriability can come from areas such as tax policy, government regulation, and crime, among others.
Chapter 1 on “Background and Country Context” examined two important appropriability risks: macro risk from terms of trade and political instability. These are overarching issues that have shaped the country’s economic development and provide critical context for this report. This chapter examines more specific aspects of the business environment that may constrain the development and diversification of the economy.
The de jure tax burden The total tax rate in Côte d’Ivoire is relatively high, at 51.9 percent of total commercial profits, according to the World Bank’s 2015 Doing Business Indicators (figure 6-1). The high rate is driven mainly by payroll and other taxes while profit taxes are relatively low in Côte d’Ivoire.
Figure 6-1 Tax rate comparison
source: World Bank Doing Business Indicators
Despite (or in part because of) the relatively high tax rate, tax revenue actually collected has been modest, at around 14 percent of GDP (figure 6-2). Since 2000, tax revenue has maintained this share of GDP except for a brief decline during the civil conflict of 2011.
Figure 6-2 Tax revenue (as a percentage of GDP) in 2014 (left) and over time (right)
source: World Bank, Worldwide Development Indicators
0
20
40
60
Global Mean Cameroon Cote d'Ivoire Ghana Indonesia Nigeria
Profit tax (%) Labor tax and contributions (%) Other taxes (%) Total tax rate (% profit)
AFG
ALB
AUS
AUT BEL
BEN
BGD
BGR
BHR
BIH
BLR BRABTN
BWA
CAN
CEB
CHE CHN
COLCRI
CYP
CZEDEU
DNK
DOMEAPEAS
ECA
ECS
EGY
EMU
ESP
EST
EUUFINFJI FRA
GBRGEO GRC
GTM
HIC HND
HRV
HUN
IBDIBT
IDB
IND
IRLISR ITAJAM
JOR
JPN
KENKGZ
KHMKORLBN
LKALMYLTE
LTU
LUX
LVAMDA
MDGMIC MLI
MOZ
MUS
MWIMYS
NAC
NAM
NGA
NIC
NLD
NOR
NPL
NZL
OED
PAK
PER
PHLPOL
PRT
PRY
PSE
PSS
PSTROU
RUSSAS
SGPSLV SSFSVK
SVN
SWE
TEA
TECTHA
TSA
TSSTUR
TZAUGA
UKR
UMC
URY
USA
VNM
WLD
ZAF
IDN LMC
SSACIV
010
2030
40Ta
x re
venu
e (%
of G
DP
)
0 20 40 60 80Total tax rate
1015
2025
Tax
reve
nue
(% o
f GD
P)
2000 2005 2010 2015Year
CIV CMRGHA IDNLIC LMCSSA
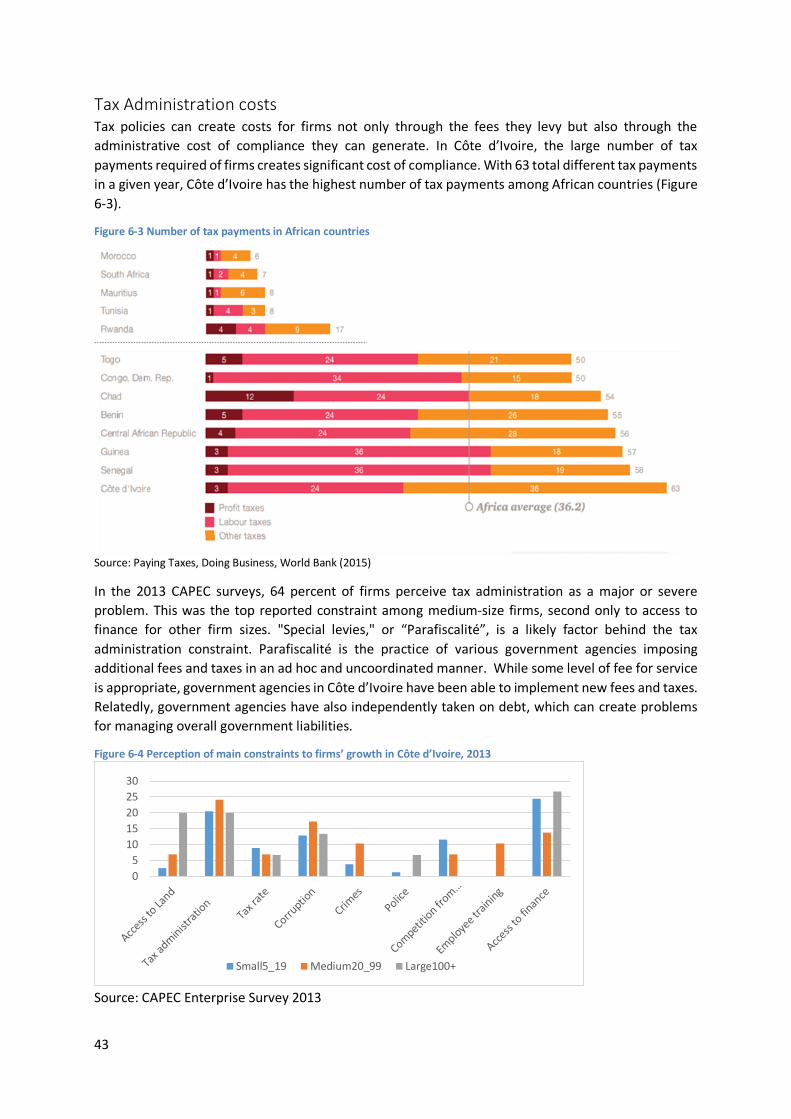
43
Tax Administration costs Tax policies can create costs for firms not only through the fees they levy but also through the administrative cost of compliance they can generate. In Côte d’Ivoire, the large number of tax payments required of firms creates significant cost of compliance. With 63 total different tax payments in a given year, Côte d’Ivoire has the highest number of tax payments among African countries (Figure 6-3).
Figure 6-3 Number of tax payments in African countries
Source: Paying Taxes, Doing Business, World Bank (2015)
In the 2013 CAPEC surveys, 64 percent of firms perceive tax administration as a major or severe problem. This was the top reported constraint among medium-size firms, second only to access to finance for other firm sizes. "Special levies," or “Parafiscalité”, is a likely factor behind the tax administration constraint. Parafiscalité is the practice of various government agencies imposing additional fees and taxes in an ad hoc and uncoordinated manner. While some level of fee for service is appropriate, government agencies in Côte d’Ivoire have been able to implement new fees and taxes. Relatedly, government agencies have also independently taken on debt, which can create problems for managing overall government liabilities.
Figure 6-4 Perception of main constraints to firms’ growth in Côte d’Ivoire, 2013
Source: CAPEC Enterprise Survey 2013
05
1015202530
Small5_19 Medium20_99 Large100+
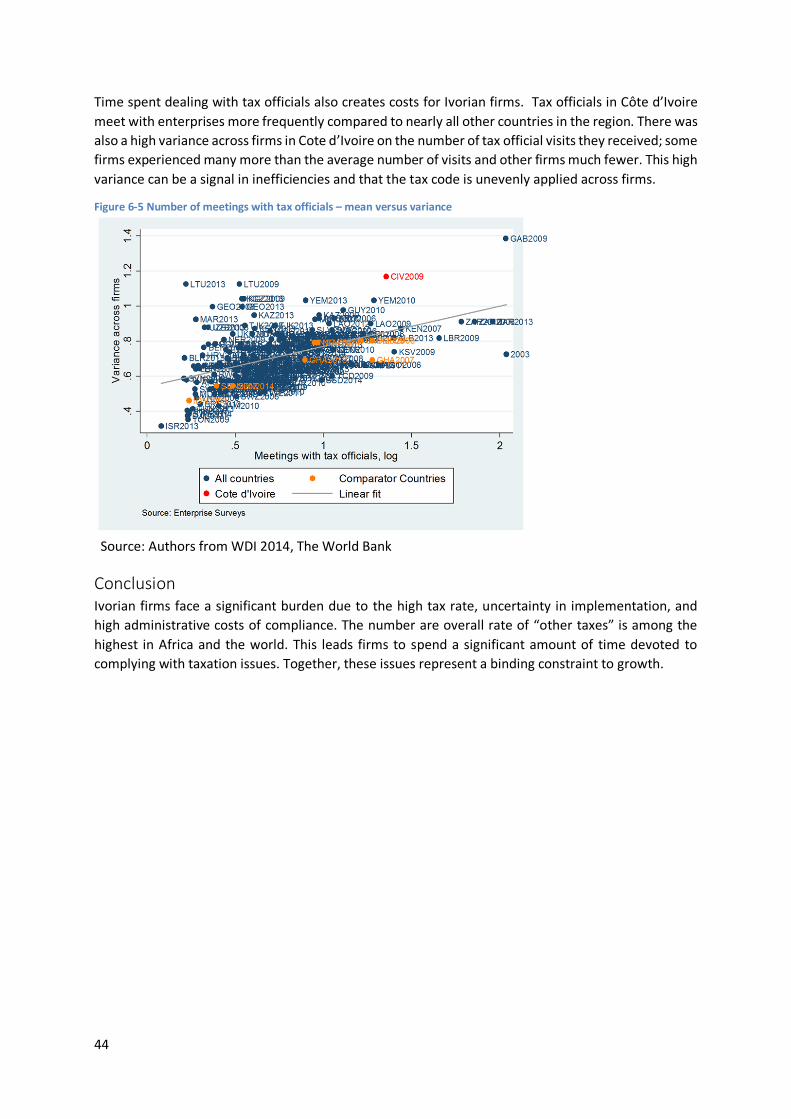
44
Time spent dealing with tax officials also creates costs for Ivorian firms. Tax officials in Côte d’Ivoire meet with enterprises more frequently compared to nearly all other countries in the region. There was also a high variance across firms in Cote d’Ivoire on the number of tax official visits they received; some firms experienced many more than the average number of visits and other firms much fewer. This high variance can be a signal in inefficiencies and that the tax code is unevenly applied across firms.
Figure 6-5 Number of meetings with tax officials – mean versus variance
Source: Authors from WDI 2014, The World Bank
Conclusion Ivorian firms face a significant burden due to the high tax rate, uncertainty in implementation, and high administrative costs of compliance. The number are overall rate of “other taxes” is among the highest in Africa and the world. This leads firms to spend a significant amount of time devoted to complying with taxation issues. Together, these issues represent a binding constraint to growth.
45
References
African Development Bank (2015). African Gender Equality Index
Agenor, PR and B. Moreno-Dodson. (2006). “Public Infrastructure and Growth: New Channels and Policy Implications.” Policy Research Working Paper 4064, World Bank, Washington, DC
Arora, S. (2001). “Health, human productivity, and long-term economic growth”. The Journal of Economic History, 61(3), 699-749.
Asiedu, E. (2002). “On the determinants of foreign direct investment to developing countries: is Africa different?” World development, 30(1), 107-119.
Barro, R. J. (1991). “Economic growth in a cross section of countries”. The quarterly journal of economics, 106(2), 407-443.
Batra, G., Kaufmann, D., & Stone, A. H. (2003). “Investment climate around the world: Voices of the firms from the World Business Environment Survey (Vol. 1)”. World Bank Publications.
Becker, G. S. (1964). Human Capital.
Becker, G. S. (1994). Human capital revisited. In Human Capital: A Theoretical and Empirical Analysis with Special Reference to Education (3rd Edition) (pp. 15-28). The University of Chicago Press.
Besley, T. (1995). “Property rights and investment incentives: Theory and evidence from Ghana”. Journal of Political Economy, 103(5), 903-937.
Bronzini, R., & Piselli, P. (2009). “Determinants of long-run regional productivity with geographical spillovers: the role of R&D, human capital and public infrastructure”. Regional Science and Urban Economics, 39(2), 187-199.
Deininger, K. W. (2003). Land policies for growth and poverty reduction. World Bank Publications.
Diaz Olvera L., Pochet P. (2008) “Household transport expenditure in Sub-Saharan African cities: measurement and analysis, Journal of Transport Geography”, Vol 16, pp. 1-13
Eggoh, J., Houeninvo, H., & Sossou, G. A. (2015). “Education, health and economic growth in African countries”. Journal of Economic Development, 40(1), 93.
Elbers, C., Gunning, J. W., & Kinsey, B. (2007). “Growth and risk: methodology and micro evidence”. The World Bank Economic Review, 21(1), 1-20.
Imran, M., & Niazi, J. (2011). “Infrastructure and growth”. The Pakistan Development Review, 355-364.
Jimenez, E. (1995). “Human and physical infrastructure: Public investment and pricing policies in developing countries”. Handbook of development economics, 3, 2773-2843.
Kumar, A., & Barrett, F. (2008). Stuck in traffic: Urban transport in Africa. AICD Background Paper, 1.
46
Lawry S., C. Samii, R. Hall, A. Leopold, D. Hornby and F. Montero. (2016). “The impact of land property rights interventions on investment and agricultural productivity in developing countries: a systematic review”, Journal of development effectiveness: 1-21
Mincer, J. (1974). “Schooling, Experience, and Earnings”. Human Behavior & Social Institutions No. 2.
Polenske, K. and N. Rockler (1993). “Infrastructure and productivity”, DUSP, MIT, Cambridge, MA
Schultz, T.W. (1961). “Investment in Human Capital” American Economic Review: 3 pp.1 – 17.
Schultz, T.W. (1993), “The Economic Importance of Human Capital in Modernization”, Education Economics, 1(1), 13-19.
United Nations High Commissioner for Refugees (2011). “Global Overview 2011: People Internally Displaced by Conflict and Violence”
USAID (2013). “Land tenure, property rights, and economic growth in rural areas”, Briefing Paper
Paul Owang (2011). The Root Causes of Conflict in Côte d’Ivoire, Africa portal N.5
World Bank, Côte d'Ivoire Urbanization Review June 12, 2015
The World Bank Group, Madio Fall and Souleymane Coulibaly, Editors, Diversified Urbanization – The Case of Côte d’Ivoire 2016
World Economic Forum (2014). Gender Global Gap Report.