Embed Size (px)
Citation preview

U.S. Department of Housing and Urban Development Office of Policy Development and Research
RROOOOFF FFRRAAMMIINNGG CCOONNNNEECCTTIIOONNSS IINN CCOONNVVEENNTTIIOONNAALL RREESSIIDDEENNTTIIAALL
CCOONNSSTTRRUUCCTTIIOONN

PATH (Partnership for Advanced Technology in Housing) is a new private/public effort to develop, demonstrate, and gain widespread market acceptance for the “Next Generation” of American housing. Through the use of new or innovative technologies the goal of PATH is to improve the quality, durability, environmental efficiency, and affordability of tomorrow’s homes. PATH is managed and supported by the Department of Housing and Urban Development (HUD). In addition, all Federal Agencies that engage in housing research and technology development are PATH Partners, including the Departments of Energy and Commerce, as well as the Environmental Protection Agency (EPA) and the Federal Emergency Management Agency (FEMA). State and local governments and other participants from the public sector are also partners in PATH. Product manufacturers, home builders, insurance companies, and lenders represent private industry in the PATH Partnership. To learn more about PATH, please contact:
451 7th Street, SW Suite B 133 Washington, DC 20410 202-708-5873 (fax) e-mail: [email protected] website: www.pathnet.org Visit PD&R's Web Site www.huduser.org to find this report and others sponsored by HUD's Office of Policy Development and Research (PD&R). Other services of HUD USER, PD&R's Research Information Service, include listservs; special interest, bimonthly publications (best practices, significant studies from other sources); access to public use databases; hotline 1-800-245-2691 for help accessing the information you need.
RROOOOFF FFRRAAMMIINNGG CCOONNNNEECCTTIIOONNSS IINN CCOONNVVEENNTTIIOONNAALL RREESSIIDDEENNTTIIAALL
CCOONNSSTTRRUUCCTTIIOONN Prepared for The U.S. Department of Housing and Urban Development Office of Policy Development and Research Washington, DC by NAHB Research Center, Inc. 400 Prince George's Boulevard Upper Marlboro, MD 20774-8731 Contract No. H-21172CA February 2002

Disclaimer While the information in this document is believed to be accurate, neither the authors, nor reviewers, nor the U.S. Department of Housing and Urban Development of the U.S. Government, nor the NAHB Research Center, Inc., nor any of their employees or representatives makes any warranty, guarantee, or representation, expressed or implied, with respect to the accuracy, effectiveness, or usefulness of any information, method, or material in this document, nor assumes any liability for the use of any information, methods, or materials disclosed herein, or for damages arising from such use. The contents of this report are the views of the contractor and do not necessarily reflect the views or policies of the U.S. Department of Housing and Urban Development or the U.S. Government.
ii
ACKNOWLEDGEMENTS This report was prepared by the NAHB Research Center, Inc., under sponsorship of the U.S. Department of Housing and Urban Development (HUD). Recognition is given to Michael Baker and Ned Waltz of Trus-Joist, A Weyerhaeuser Business for their input on the testing program. We would like to acknowledge the following individuals for their work on this project: Bryan Adgate, Technician Jay Crandell, P.E., Technical Reviewer Vladimir Kochkin, Research Engineer Lynda Marchman, Administrative Support Denise McCoskery, Technician Anthony Osborne, Technician Brandy Rogers, Technician Mark Wagner, Technician
iii

iv
TABLE OF CONTENTS
Page ACKNOWLEDGEMENTS........................................................................................................... iii 1.0 INTRODUCTION ...............................................................................................................1 2.0 BACKGROUND .................................................................................................................2
2.1 Lateral Design of Nailed Wood Connections ..........................................................2 2.1.1 Strength Design............................................................................................2 2.1.2 Deflections of Lateral Dowel Connections..................................................4
2.2 Design of Nailed Wood Connections in Withdrawal ..............................................5 2.3 Conclusions on Literature Survey............................................................................9
3.0 MATERIAL PROPERTIES ..............................................................................................10 4.0 EXPERIMENTAL RESEARCH PROGRAM ..................................................................12
4.1 Task 1 – Rafter-To-Ceiling Joist Connection (Heel Joint) Tests...........................12 4.1.1 Objective ....................................................................................................12 4.1.2 Experimental Approach .............................................................................13 4.1.3 Results and Discussion ..............................................................................15 4.1.4 Design Applications...................................................................................24 4.1.5 Conclusions................................................................................................25
4.2 Task 2 – Full-Scale Roof-to-Wall Connection System Tests ................................27 4.2.1 Objective ....................................................................................................27 4.2.2 Experimental Approach .............................................................................27 4.2.3 Results and Discussion ..............................................................................30 4.2.4 Design Applications...................................................................................36 4.2.5 Conclusions................................................................................................37
4.3 Task 3 – Individual Roof-to-Wall Toe-Nailed Connection Tests..........................38 4.3.1 Objective ....................................................................................................38 4.3.2 Experimental Approach .............................................................................38 4.3.3 Results and Discussion ..............................................................................40 4.3.4 Conclusions................................................................................................44
5.0 SUMMARY AND CONCLUSIONS ................................................................................45 6.0 RECOMMENDATIONS...................................................................................................46 7.0 REFERENCES ..................................................................................................................46 APPENDIX A − CALCULATION OF LATERAL NAIL CONNECTION VALUES
v

vi
LIST OF TABLES
Page Table 1 - Selected Resistance Data From APA Report [23].........................................................7 Table 2 - Select Data From Mizzell And Schiff [24]....................................................................7 Table 3 - Specific Gravity And Moisture Content Of Wood Test Members..............................11 Table 4 - Dowel Bending And Bearing Strength Properties For Rafter-To-Ceiling Joist
Connection Tests................................................................................................................11 Table 5 - Dowel Bending And Bearing Strength Properties For Full-Scale System Roof-
To-Wall Connection Tests .................................................................................................12 Table 6 - Dowel Bending And Bearing Strength Properties For Individual Roof-To-Wall
Connection Tests................................................................................................................12 Table 7 - Specimen Configurations For Rafter-To-Ceiling Joist Connection Tests...................14 Table 8 - Summary Of Test Results For Rafter-To-Ceiling Joist Connection Tests ..................18 Table 9 - Comparison Of Calculated And Measured 5 Percent Offset Limit Values.................20 Table 10 - Comparison Of NDS Allowable Design Values With Test Loads At 0.015-
Inch Joint Slip (NDS Slip Limit Basis)..............................................................................21 Table 11 - Comparison Of Calculated And Measured Ultimate Loads......................................22 Table 12 - Safety Margins Relative To NDS Allowable Values ................................................23 Table 13 - Allowable Snow Loads For Heel Joint Configurations 1 And 2...............................24 Table 14 - Test Configurations For Roof-To-Wall Connection System Tests ...........................27 Table 15 - Materials, Construction, And Fastening Schedules For Roof Systems.....................28 Table 16 - Summary Of Test Results For Roof-To-Wall Connection System Tests..................31 Table 17 - Comparison Of Analytical And Experimental Results For Roof-To-Wall
Connection System Tests...................................................................................................35 Table 18 - Specimen Configurations For Individual Roof-To-Wall Connection Tests..............39 Table 19 - Results Of Individual Roof-To-Wall Toe-Nailed Connection Tests.........................41 Table 20 - NDS Allowable Compared To 0.015 Inch Slip Test Results ....................................42 Table 21 - Safety Margins Relative To NDS Allowable ............................................................42 Table 22 - Comparison Of Calculated And Measured Ultimate Loads......................................43 Table 23 - Comparison Of System Roof-To-Wall And Individual Roof-To-Wall
Connection .........................................................................................................................44
vii

viii
LIST OF FIGURES
Page Figure 1 - Rafter-to-Ceiling Joist Connection Test Setup and Instrumentation ............................13 Figure 2 - Load-Deflection Relationship for a System of Two Parallel Heel Joints with 3-
10d Common Nails per Joint (Members are Unattached to Top Plate)................................16 Figure 3 - Load-Deflection Relationship for a System of Two Parallel Heel Joints with 3-
10d Common Nails per Joint (Each Joint is Attached to Top Plate with 3-8d Common Nails).....................................................................................................................16
Figure 4 - Load-Deflection Relationship for a System of Two Parallel Heel Joints with 3-16d Pneumatic Nails per Joint (Members are Unattached to Top Plate) ..............................17
Figure 5 - Load-Deflection Relationship for a System of Two Parallel Heel Joints with 3-16d Pneumatic Nails per Joint (Each Joint is Attached to Top Plate with 3-16d Pneumatic Nails)...................................................................................................................17
Figure 6 - Load-Deflection Relationship for a System of Two Parallel Heel Joints with 12-16d Pneumatic Nails per Joint (Members are Unattached to Top Plate).........................18
Figure 7 - Failure Mode Classification ..........................................................................................19 Figure 8 - Determination of the 5 Percent Nail Diameter Offset Load .........................................21 Figure 9 - Roof-to-Wall Connection System Test Setup ...............................................................28 Figure 10 - Loading Steel Strap Attachment .................................................................................29 Figure 11 - LVDT Setup (displaced position) ...............................................................................30 Figure 12 - Horizontal Movement of Truss (in initial position truss was aligned with stud)........32 Figure 13 - Wood Tear Out and Plate Bending on Tension Side of Connection...........................32 Figure 14 - Truss Plate Separation.................................................................................................32 Figure 15 - No Visual Damage on Compression Side of Connection ...........................................32 Figure 16 - Truss Separation from Top Plate due to Nail Withdrawal..........................................33 Figure 17 - Wood Tear Out and Plate Bending on Tension Side of Connection...........................33 Figure 18 - Truss Plate Separation.................................................................................................34 Figure 19 - Truss Slip and Rotation...............................................................................................34 Figure 20 - Hurricane Clip Buckling .............................................................................................34 Figure 21 - Hurricane Clip Tension Failure...................................................................................34 Figure 22 - Truss Plate Separation.................................................................................................34 Figure 23 - Setup for Individual Roof-to-Wall Connection Tests .................................................39 Figure 24 - Load-Slip Relationships for Individual Roof-to-Wall Toe-Nail Connections
Assembled with 2-16d Pneumatic Nails ...............................................................................40 Figure 25 - Load-Slip Relationships for Individual Roof-to-Wall Toe-Nail Connections
Assembled with 3-8d Common Nails ...................................................................................41 Figure 26 - Toe-Nailed Joint Response .........................................................................................43
ix

x

1.0 INTRODUCTION The NAHB Research Center has been engaged in a multifaceted research program for the National Association of Home Builders (NAHB) and the U.S. Department of Housing and Urban Development (HUD) to quantify the structural performance of homes and to develop or refine engineering methods that accurately model conventional wood construction. Previous studies have focused on the system effects of the whole building performance and specific assemblies such as built-up headers and shear walls. However, little effort has been made to investigate the systemic load path with respect to roof framing connections, particularly in the context of conventional, wood-framed homes. The engineering knowledge needed to cost-effectively design homes or evaluate residential construction guidelines are lacking in this area. In addition, the practice of making connections in conventional wood-frame construction has evolved from its original use of hand-driven fasteners to the predominant use of pneumatic fasteners. The prescriptive fastening schedules developed based on historic experience with hand-driven fasteners need to be verified and updated for use with pneumatic fasteners to ensure consistency with the intended performance objectives. This problem further extends to the design practice for engineered wood-frame connections. The focus of this project was on connections used with conventional light-frame wood roof construction. A literature review was conducted and supplemented with new research on the performance of conventional roof systems and components including ceiling joist-to-rafter connections and roof framing-to-wall connections. Individual connections and connections within full-scale roof systems were tested to quantify potential system effects. Hand-driven and pneumatic fasteners were included in the test program. Test results were compared to the provisions of the National Design Specification for Wood Construction [1] and to predictions of the yield theory using the general dowel equations for shear connections [2]. Finally, the results were analyzed with respect to an interest in establishing a consistent capacity basis for design of wood-frame connections. The key objectives for this study were to:
1. Survey relevant research on conventional and engineered nailed connections. 2. Benchmark the capacity and stiffness of conventional ceiling joist-to-rafter connections
(i.e., heel joints) assembled with hand-driven common and pneumatic nails in paired assembly tests.
3. Benchmark the shear capacity of roof-to-wall connections (load direction parallel to wall) assembled with hand-driven common nails, pneumatic nails, and a combination of pneumatic nails and light-gage steel roof clips using full-scale roof assembly tests and individual connection tests.
4. Better understand system effects in connection behavior in conventional wood-frame roof construction.
5. Evaluate the applicability of the yield theory methodology for predicting connection capacity.
This report is organized in seven sections and an appendix. Section 1 formulates the problem statement, summarizes the major tasks completed under the project, and presents the project objectives. In Section 2, background information is provided on the design of nailed connections in light-frame wood construction. A summary of relevant research is included with the focus on key roof framing connections. Properties of materials used in the testing program are reported in
1

Section 3. Section 4 includes three subsections that present the corresponding tasks of the research program on the performance of various conventional roof framing connections. Each subsection is organized as a self-contained document that presents objectives, experimental methods, results and discussion, conclusions, and a design application example (Tasks 1 and 2). The research program addresses specific loading conditions and aspects of system performance not documented in the reviewed literature. Observed performance is compared to current engineering methods for nailed wood connections. Project summary and conclusions are provided in Section 5. Section 6 provides recommendations and Section 7 includes references. Calculations of lateral load resistance of nailed connections investigated in this project are summarized in Appendix A. 2.0 BACKGROUND 2.1 LATERAL DESIGN OF NAILED WOOD CONNECTIONS 2.1.1 Strength Design The National Design Specification for Wood Construction (NDS) [1] published by the American Forest and Paper Association (AF&PA) provides the design methodology for engineering analysis of nailed wood connections. The NDS design approach is based on the connection yield theory proposed by Johansen [3] in 1949. Using the principle of static equilibrium and the yield limit theory assumptions, the connection yield theory defines a series of response modes that can occur in a single dowel connection under lateral loading. In the NDS, these response modes are referred to as yield modes and the corresponding equilibrium equations as yield equations. Using the material strength properties of the dowel and wood and the geometry of the connection assembly with the yield equations, the yield strength of each yield mode can be determined. The yield mode with the lowest value governs the performance of the connection. A detailed explanation of the yield theory with respect to design applications can be found in the 1997 NDS Commentary for Wood Construction [4] and Technical Report 12 [2]. The yield theory was validated through numerous experimental studies [5][6][7][8][9][10]. However, the majority of studies conducted in the United States addressed bolted connections. A comprehensive worldwide survey of the nail connection research including aspects of the yield theory application was compiled by Ehlbeck [11]. Although an excellent source of scientific information, this survey is outdated with respect to the current design provisions and it also provides little data on conventional construction practices. Before 1991, the NDS used empirical equations to predict the lateral resistance of dowel wood connections. First published in the 1944 edition of the design specification, these equations were derived from tests of various connection configurations [12] using the proportional limit state as the design basis. The proportional limit was defined as a point on the experimentally measured load-deformation curve at 0.015-inch joint slip. Therefore, the design load resistance values for wood connections were limited by the maximum allowable joint deformation and ignored other important response characteristics such as the connection yield mode, failure mode, load capacity, and deformation capacity. The purpose of the slip limit state approach was to satisfy both strength and serviceability design criteria using a single response parameter, i.e. joint slip. Because the design philosophy of structural analysis within the proportional performance dominated the field of timber engineering at the time, it was directly applied to the connection design with disregard to the unique features in the connection response or the function of the
2
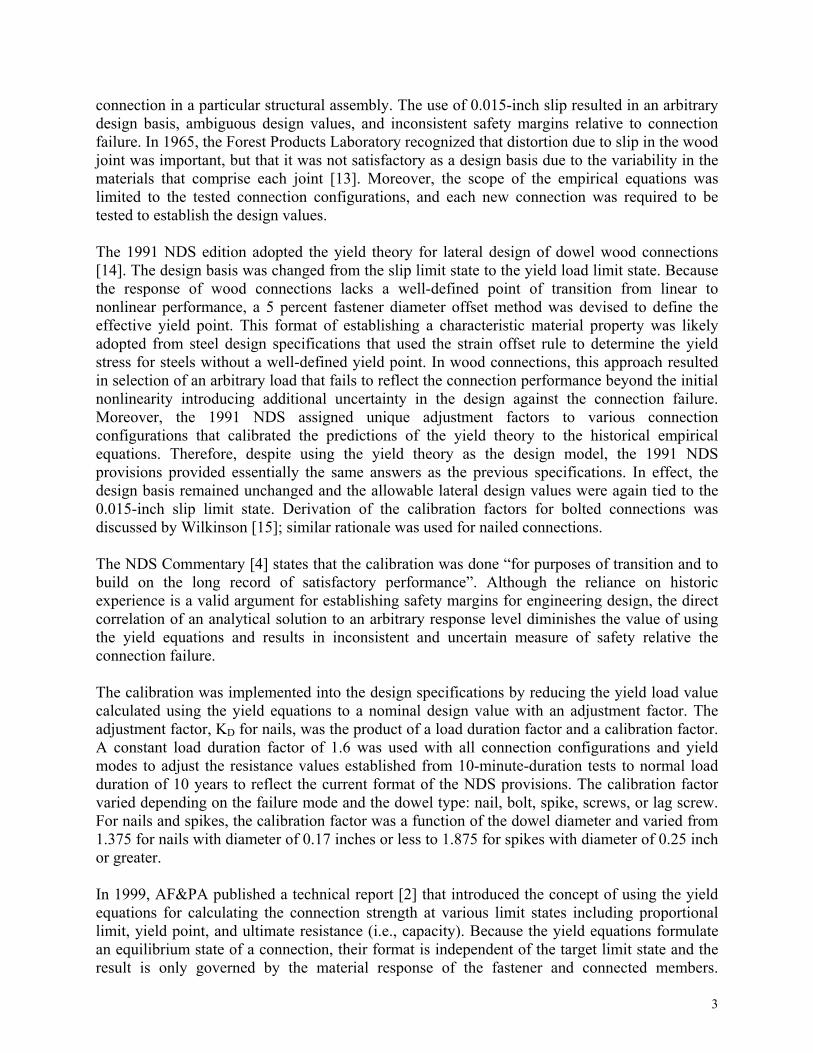
connection in a particular structural assembly. The use of 0.015-inch slip resulted in an arbitrary design basis, ambiguous design values, and inconsistent safety margins relative to connection failure. In 1965, the Forest Products Laboratory recognized that distortion due to slip in the wood joint was important, but that it was not satisfactory as a design basis due to the variability in the materials that comprise each joint [13]. Moreover, the scope of the empirical equations was limited to the tested connection configurations, and each new connection was required to be tested to establish the design values. The 1991 NDS edition adopted the yield theory for lateral design of dowel wood connections [14]. The design basis was changed from the slip limit state to the yield load limit state. Because the response of wood connections lacks a well-defined point of transition from linear to nonlinear performance, a 5 percent fastener diameter offset method was devised to define the effective yield point. This format of establishing a characteristic material property was likely adopted from steel design specifications that used the strain offset rule to determine the yield stress for steels without a well-defined yield point. In wood connections, this approach resulted in selection of an arbitrary load that fails to reflect the connection performance beyond the initial nonlinearity introducing additional uncertainty in the design against the connection failure. Moreover, the 1991 NDS assigned unique adjustment factors to various connection configurations that calibrated the predictions of the yield theory to the historical empirical equations. Therefore, despite using the yield theory as the design model, the 1991 NDS provisions provided essentially the same answers as the previous specifications. In effect, the design basis remained unchanged and the allowable lateral design values were again tied to the 0.015-inch slip limit state. Derivation of the calibration factors for bolted connections was discussed by Wilkinson [15]; similar rationale was used for nailed connections. The NDS Commentary [4] states that the calibration was done “for purposes of transition and to build on the long record of satisfactory performance”. Although the reliance on historic experience is a valid argument for establishing safety margins for engineering design, the direct correlation of an analytical solution to an arbitrary response level diminishes the value of using the yield equations and results in inconsistent and uncertain measure of safety relative the connection failure. The calibration was implemented into the design specifications by reducing the yield load value calculated using the yield equations to a nominal design value with an adjustment factor. The adjustment factor, KD for nails, was the product of a load duration factor and a calibration factor. A constant load duration factor of 1.6 was used with all connection configurations and yield modes to adjust the resistance values established from 10-minute-duration tests to normal load duration of 10 years to reflect the current format of the NDS provisions. The calibration factor varied depending on the failure mode and the dowel type: nail, bolt, spike, screws, or lag screw. For nails and spikes, the calibration factor was a function of the dowel diameter and varied from 1.375 for nails with diameter of 0.17 inches or less to 1.875 for spikes with diameter of 0.25 inch or greater. In 1999, AF&PA published a technical report [2] that introduced the concept of using the yield equations for calculating the connection strength at various limit states including proportional limit, yield point, and ultimate resistance (i.e., capacity). Because the yield equations formulate an equilibrium state of a connection, their format is independent of the target limit state and the result is only governed by the material response of the fastener and connected members.
3

Therefore, it can be assumed that the use of the material properties at the target limit state allows for calculating the connection strength at the corresponding limit state. For example, the yield equations used with the ultimate dowel bending strength and the ultimate dowel bearing strength predict the ultimate connection strength, i.e. connection capacity. Knowledge of capacity can be critical in certain types of construction (i.e., breakaway walls) [16] or in balancing the design strength of various components and connections in a wood-frame assembly such that premature failure is circumvented and more favorable failure modes occur when ultimate strength is achieved. Determination of the 5 percent offset limit is ambiguous, in terms of structural safety objectives, whereas a capacity based approach provides a known reference point relative to structural safety [17]. Moreover, capacity-based design is the most favorable method for accurate analysis of seismic response of structures. 2.1.2 Deflections of Lateral Dowel Connections Design for a capacity limit state does not address structural failure modes and serviceability issues associated with excessive joint deformations. For example, a joint slip in a roof assembly can be geometrically magnified resulting in large deflections that are perceived unacceptable by the occupants or exceed deformations tolerated by finish materials. Large deflections can also promote “P-delta” effects and contribute to the failure modes caused by structural instability. Therefore, another limit state should be introduced, as a part of a capacity-based design methodology, to analyze the effect of joint deformations and to ensure adequate serviceability of the structure. To incorporate the deflection limit state into the design procedures, a method for predicting the connection load-slip relationship is required as a separate design check. Modeling of the load-slip relationship for lateral dowel wood connections is a complex, nonlinear problem that involves analysis of the interaction of the body of the dowel and the surrounding wood material. Theories that simulate nail connection as a beam on elastic or elastic-plastic foundation [11] can provide accurate predictions, but require solution of high-order differential equations. Wood Handbook [18] presents one such model which predicts the initial slope of lateral dowel connections. Development of empirical equations is limited by the large number of combinations of variables which affect the connection performance including joint geometry, fastener geometry, wood specific gravity, direction of loading, fastener bending yield strength, etc. Most of the analytical models developed to date are complicated for practical engineering design applications and none of the models are referenced in the current design specifications. The finite element method is another analytical tool that can be used to model the load-slip relationship. A three-dimensional finite element model of a single bolted connection developed by Patton-Mallory [19] is an example of this approach. Although finite element analysis can provide valuable insights into the response of wood connections, it is impractical for most engineering design purposes due to complex and time-consuming operations involved in the model formulation and results interpretation. Aune and Patton-Mallory [5][6] used the yield equation format to predict joint slip by assuming a forth-root curve relationship between wood embedment stress and joint slip. If this relationship is used in place of the constant dowel bearing strength value, the yield equations can be solved to determine the joint slip as a function of the lateral load. Analytical predictions were in good
4
agreement with experimental results in the displacement range from 0.1 to 0.3 inches, whereas the model overestimated the test results at lower displacements. A mechanics-based approach proposed by Heine and Dolan [20] for modeling the load-slip relationship of dowel wood connections shows promise as a method that can find acceptance for engineering design applications. The primary advantage of this method is that it is compatible with the yield theory design format. The approach uses the yield mode shapes as the basic response modes to determine the mechanism involved in the load transfer between the connected members. The response shape corresponding to the governing yield mode is used to predict the joint slip. An equilibrium equation can be formulated for the selected yield mode as a function of the connection geometry, nail bending moment-angle of rotation relationship, and dowel bearing strength-deformation relationship. The complexity of the final formulation depends on the equations selected to describe the input load-deformation functions for dowel bending and dowel bearing. To exemplify the proposed methodology, a load-displacement relationship for a symmetric bolted single shear joint in yield mode IV [1] was formulated and validated using experimental results from other studies. An excellent correlation was obtained. For the selected connection configuration, the joint resistance, Pjoint, included contributions from two components:
β)FP(P intjo +=
010
12
0212
1 2122
P/kXeaaPkkP
aX)Pk)(aP(XkP
kbP =
++
+−−=
( )
−−
+=
0
1
110
1
/arctanexp1arctan1
MbXk
bXMM
bF b
(1)
where:
Pjoint = lateral joint resistance; X = joint slip;
P = resistance due to dowel bearing on wood; F = resistance due to development of plastic hinge in the bolt; β = adjustment factor due to modeling assumptions; b1 = location of the plastic hinge relative to the shear plane; k, P1, P0 = coefficients from the function used to model the load-
displacement relationship for dowel bearing; and, kb, M1, M0 = same for nail bending.
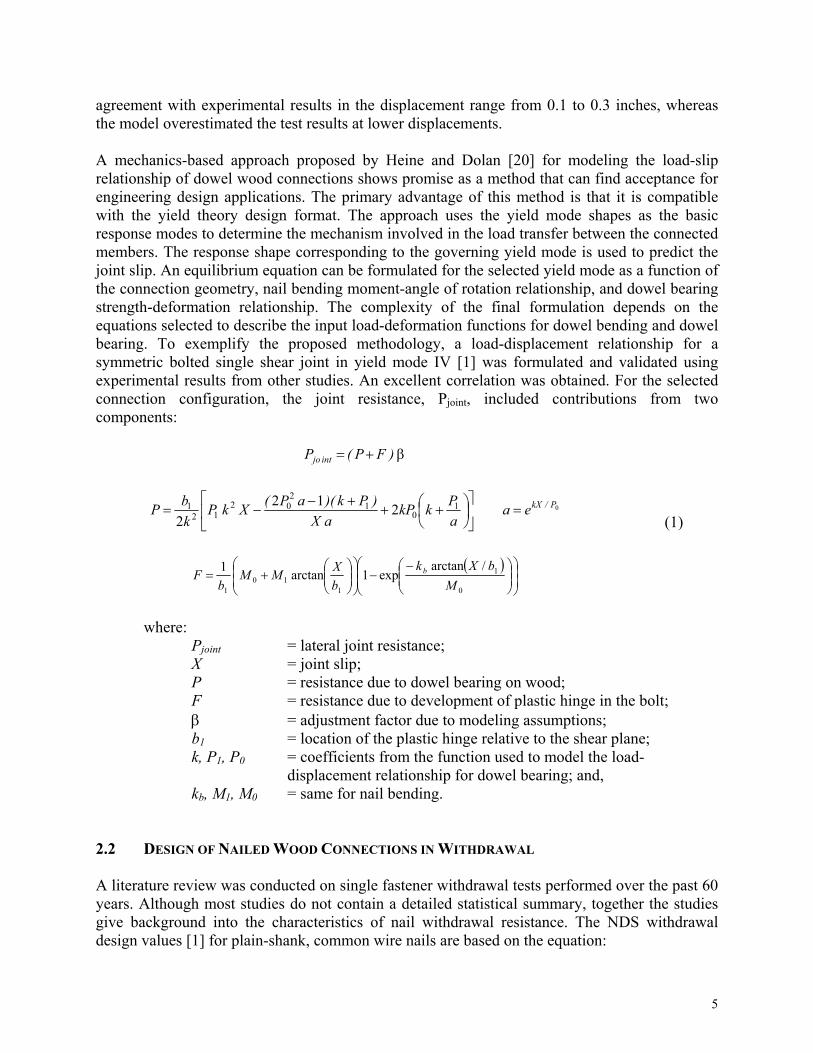
2.2 DESIGN OF NAILED WOOD CONNECTIONS IN WITHDRAWAL A literature review was conducted on single fastener withdrawal tests performed over the past 60 years. Although most studies do not contain a detailed statistical summary, together the studies give background into the characteristics of nail withdrawal resistance. The NDS withdrawal design values [1] for plain-shank, common wire nails are based on the equation:
5
P DG pmax.= 6900 2 5l
l
(2)
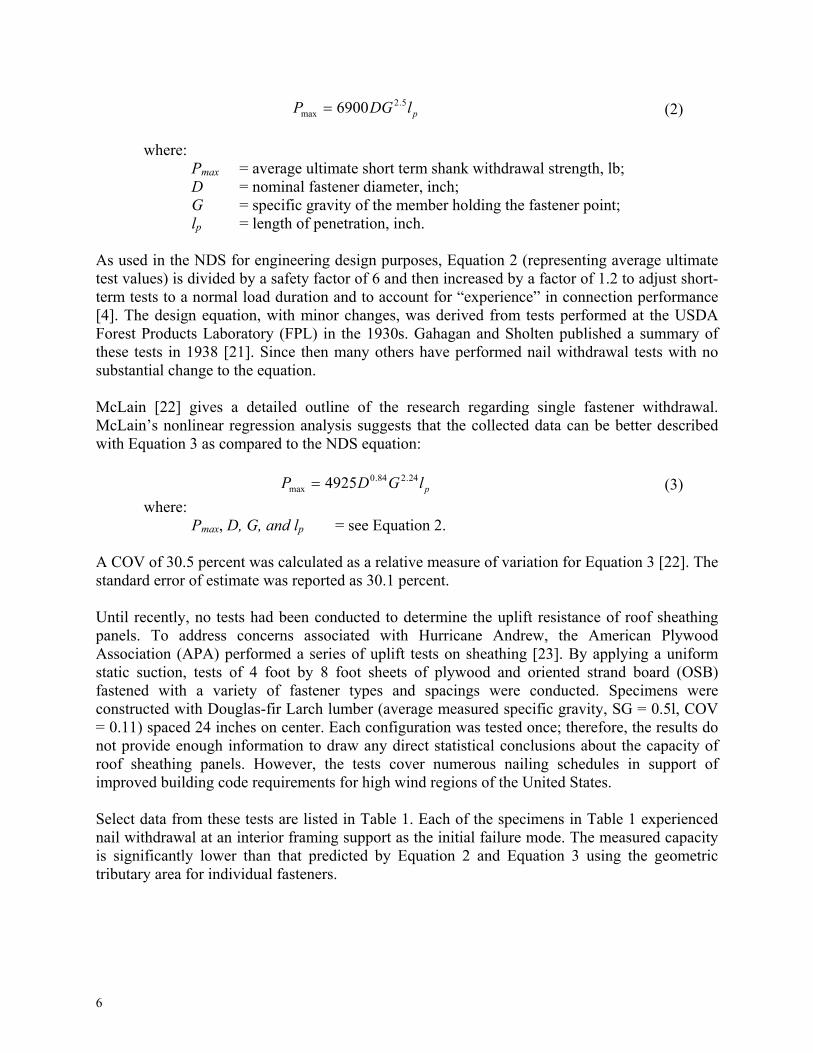
where: Pmax = average ultimate short term shank withdrawal strength, lb; D = nominal fastener diameter, inch; G = specific gravity of the member holding the fastener point; lp = length of penetration, inch. As used in the NDS for engineering design purposes, Equation 2 (representing average ultimate test values) is divided by a safety factor of 6 and then increased by a factor of 1.2 to adjust short-term tests to a normal load duration and to account for “experience” in connection performance [4]. The design equation, with minor changes, was derived from tests performed at the USDA Forest Products Laboratory (FPL) in the 1930s. Gahagan and Sholten published a summary of these tests in 1938 [21]. Since then many others have performed nail withdrawal tests with no substantial change to the equation. McLain [22] gives a detailed outline of the research regarding single fastener withdrawal. McLain’s nonlinear regression analysis suggests that the collected data can be better described with Equation 3 as compared to the NDS equation:
P D G pmax. .= 4925 0 84 2 24 (3)
where: Pmax, D, G, and lp = see Equation 2. A COV of 30.5 percent was calculated as a relative measure of variation for Equation 3 [22]. The standard error of estimate was reported as 30.1 percent. Until recently, no tests had been conducted to determine the uplift resistance of roof sheathing panels. To address concerns associated with Hurricane Andrew, the American Plywood Association (APA) performed a series of uplift tests on sheathing [23]. By applying a uniform static suction, tests of 4 foot by 8 foot sheets of plywood and oriented strand board (OSB) fastened with a variety of fastener types and spacings were conducted. Specimens were constructed with Douglas-fir Larch lumber (average measured specific gravity, SG = 0.5l, COV = 0.11) spaced 24 inches on center. Each configuration was tested once; therefore, the results do not provide enough information to draw any direct statistical conclusions about the capacity of roof sheathing panels. However, the tests cover numerous nailing schedules in support of improved building code requirements for high wind regions of the United States. Select data from these tests are listed in Table 1. Each of the specimens in Table 1 experienced nail withdrawal at an interior framing support as the initial failure mode. The measured capacity is significantly lower than that predicted by Equation 2 and Equation 3 using the geometric tributary area for individual fasteners.
6

TABLE 1 SELECTED RESISTANCE DATA FROM APA REPORT [23]
TEST SHEATHING NAILING1 RESISTANCE
1 15/32-in 5-ply 6d common @ 6 in:12 in 55 psf
2 15/32-in 5-ply 6d common @ 6 in:6 in 120 psf
4 15/32-in 5-ply 8d common @ 6 in:12 in 130 psf
9 7/16-in OSB 6d common @ 6 in:12 in 65 psf
12 5/8-in 4-ply 8d common @ 6 in:6 in 218 psf
1The notation 6 in:12 in or 6 in:6 in gives the panel edge nail spacing and panel field nail spacing on intermediate framing members, respectively.
In the tests, the “critical fasteners” were always found to be interior nails applied in the field of the panel. Therefore, a finite element analysis was also conducted to determine the effective tributary area of the fastener that determined the failure of the sheathing panel (i.e. the “critical fastener”). This effective area was found to be 20 percent greater in size than the standard geometric tributary area commonly used in engineering design. The nail spacing studied was 12 inches on center with a framing member spacing of 24 inch on center (two square feet geometric tributary area). Mizzell and Schiff [24] conducted an investigation of the uplift performance of roof sheathing panels in residential construction. A parametric study on the uplift capacity of roof sheathing included factors such as panel types and thickness, fastener types and sizes, and fastening schedules. Tests were conducted with repetitions so that statistical analysis was made possible. Select data from these tests are listed in Table 2. The framing members consisted of Spruce-pine-fir (SPF) lumber and were spaced 24 inch on center.
TABLE 2 SELECT DATA FROM MIZZELL AND SCHIFF [24]
REPETITIONS SHEATHING NAILING1 RESISTANCE COV
8 15/32 in APA Rated, Exp. 1 6d common @ 6 in:12 in 26 psf 0.09
10 15/32 in APA Rated, Exp. 1 8d common @ 6 in:12 in 61 psf 0.11
1The notation 6 in:12 in gives the panel edge nail spacing and panel field nail spacing on intermediate framing members, respectively. A uniform negative pressure was applied to each specimen creating suction on the panel. This force was transferred from the panel to the fasteners. As the pressure increased, separation between the framing member and panel began. Once failure of a single fastener occurred, the load was distributed to the surrounding fasteners causing failure to propagate throughout the panel. The failure mode for each test was nail withdrawal from the framing member in the field of the panel. The results are comparable to the APA tests [23], considering a lower density framing lumber was used (i.e., SPF instead of Douglas-fir Larch). Assuming that the lumber had a specific gravity of 0.37 (slightly below average for SPF), the two test configurations essentially duplicate APA tests 1 and 4 in Table 1 when adjusted for differences in specific gravity, G, using ratios of G2.5 from Equation 2. However, when attempting to reconcile the difference in sheathing pull-off resistance between 6d and 8d nails within either the Clemson University [24] or APA tests [23], 7
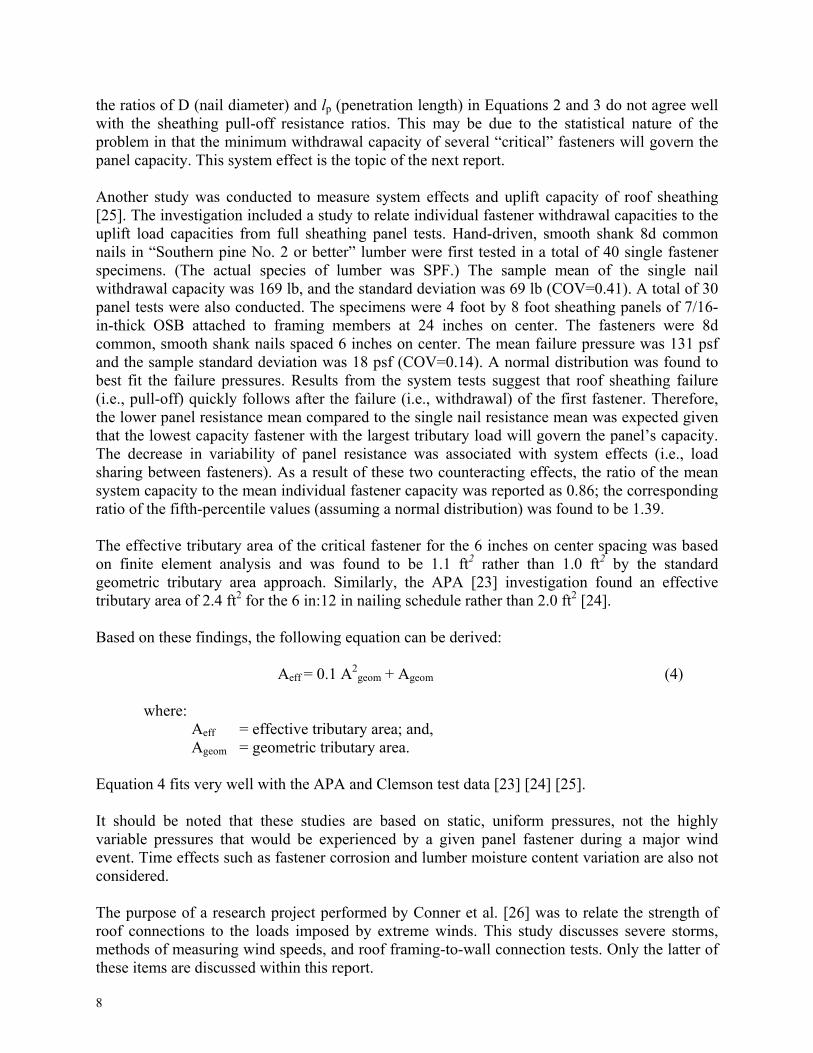
the ratios of D (nail diameter) and lp (penetration length) in Equations 2 and 3 do not agree well with the sheathing pull-off resistance ratios. This may be due to the statistical nature of the problem in that the minimum withdrawal capacity of several “critical” fasteners will govern the panel capacity. This system effect is the topic of the next report. Another study was conducted to measure system effects and uplift capacity of roof sheathing [25]. The investigation included a study to relate individual fastener withdrawal capacities to the uplift load capacities from full sheathing panel tests. Hand-driven, smooth shank 8d common nails in “Southern pine No. 2 or better” lumber were first tested in a total of 40 single fastener specimens. (The actual species of lumber was SPF.) The sample mean of the single nail withdrawal capacity was 169 lb, and the standard deviation was 69 lb (COV=0.41). A total of 30 panel tests were also conducted. The specimens were 4 foot by 8 foot sheathing panels of 7/16-in-thick OSB attached to framing members at 24 inches on center. The fasteners were 8d common, smooth shank nails spaced 6 inches on center. The mean failure pressure was 131 psf and the sample standard deviation was 18 psf (COV=0.14). A normal distribution was found to best fit the failure pressures. Results from the system tests suggest that roof sheathing failure (i.e., pull-off) quickly follows after the failure (i.e., withdrawal) of the first fastener. Therefore, the lower panel resistance mean compared to the single nail resistance mean was expected given that the lowest capacity fastener with the largest tributary load will govern the panel’s capacity. The decrease in variability of panel resistance was associated with system effects (i.e., load sharing between fasteners). As a result of these two counteracting effects, the ratio of the mean system capacity to the mean individual fastener capacity was reported as 0.86; the corresponding ratio of the fifth-percentile values (assuming a normal distribution) was found to be 1.39. The effective tributary area of the critical fastener for the 6 inches on center spacing was based on finite element analysis and was found to be 1.1 ft2 rather than 1.0 ft2 by the standard geometric tributary area approach. Similarly, the APA [23] investigation found an effective tributary area of 2.4 ft2 for the 6 in:12 in nailing schedule rather than 2.0 ft2 [24]. Based on these findings, the following equation can be derived:
Aeff = 0.1 A2geom + Ageom (4)
where:
Aeff = effective tributary area; and, Ageom = geometric tributary area.
Equation 4 fits very well with the APA and Clemson test data [23] [24] [25]. It should be noted that these studies are based on static, uniform pressures, not the highly variable pressures that would be experienced by a given panel fastener during a major wind event. Time effects such as fastener corrosion and lumber moisture content variation are also not considered. The purpose of a research project performed by Conner et al. [26] was to relate the strength of roof connections to the loads imposed by extreme winds. This study discusses severe storms, methods of measuring wind speeds, and roof framing-to-wall connection tests. Only the latter of these items are discussed within this report.
8
Uplift tests were conducted on toe-nailed roof framing-to-wall connections and on modified connections. The modifications were chosen to represent retrofitting alternatives available for homeowners to improve the wind resistance of roof framing-to-wall connections. Three tests were conducted on rafter-to-wall connections using three 16d box toe-nails. It should be noted that this configuration is stronger than the three 8d common toe-nails required by current code [27]. The framing lumber species was Douglas-fir having an average tested specific gravity of 0.45. A mean value of 668 lb with a standard deviation of 63 lb was recorded for the uplift capacity of the connection. Reed et al. [28] investigated the uplift capacity of rafter-to-top plate connections in light-frame wood construction. The results were used to evaluate the resistance of individual connections to uplift loads caused by severe wind events. Connections fastened with hurricane straps, toe nails, and adhesives were tested. Over 350 tests were performed on 28 different roof-to-wall connection details. A total of 13 tests were conducted on the standard toe-nail connection using SPF lumber and three 8d common toe-nails per joint. This connection had an average withdrawal capacity of 410 lb and a standard deviation of 139 lb (COV = 0.34) in the assembly tests. For comparison, Equation 1 predicts an ultimate uplift capacity of about 200 lb to 280 lb, assuming a framing lumber specific gravity of 0.37 to 0.42, a nail penetration of about 1 inch, and no toe-nail reduction factor as required by NDS-97. The mode of failure reported for the toe-nailed connections was nail withdrawal. 2.3 CONCLUSIONS ON LITERATURE SURVEY Results of the literature survey of research information relevant to the performance and methods of analysis of nailed wood connections in residential roof construction indicate that a voluminous body of knowledge is accumulated in this field. However, there is a disparity in both understanding the response and the state-of-the-art of the engineering design methods between various connection configurations, failure modes, and design applications. While a sound methodology exists for analysis of withdrawal resistance of individual nail connections and multiple nail connections within roof systems, there is a lack of rational application of the design methodologies for lateral analysis of nail connections. The capacity-based design philosophy for wood shear connections is advocated and analytical methods for determination of connection capacity are proposed [2], yet little experimental data is compiled to substantiate the implementation of capacity-based design into the engineering design procedures. As an integral part of capacity-based design, a practical method for modeling the nail load-slip relationship should be adopted. Moreover, current design methods ignore systematic aspects of the performance of the nail shear connections within multiple nail joints and structural systems that use a cumulative resistance of multiple joints with the exception of the nail diaphragm factor [1]. Determination of these system effects for conventional construction is the key for understanding the generally successful historic performance of conventional light-frame wood construction and is necessary for development of methodologies that accurately predict the response of conventional systems for efficient design of houses. An experimental research program was developed to begin addressing some of the identified deficiencies and inequities in the current design methodologies relevant to the objectives of this study. The purpose of this program was to investigate the response parameters including capacity and stiffness of conventional roof connections with the focus on the system performance
9
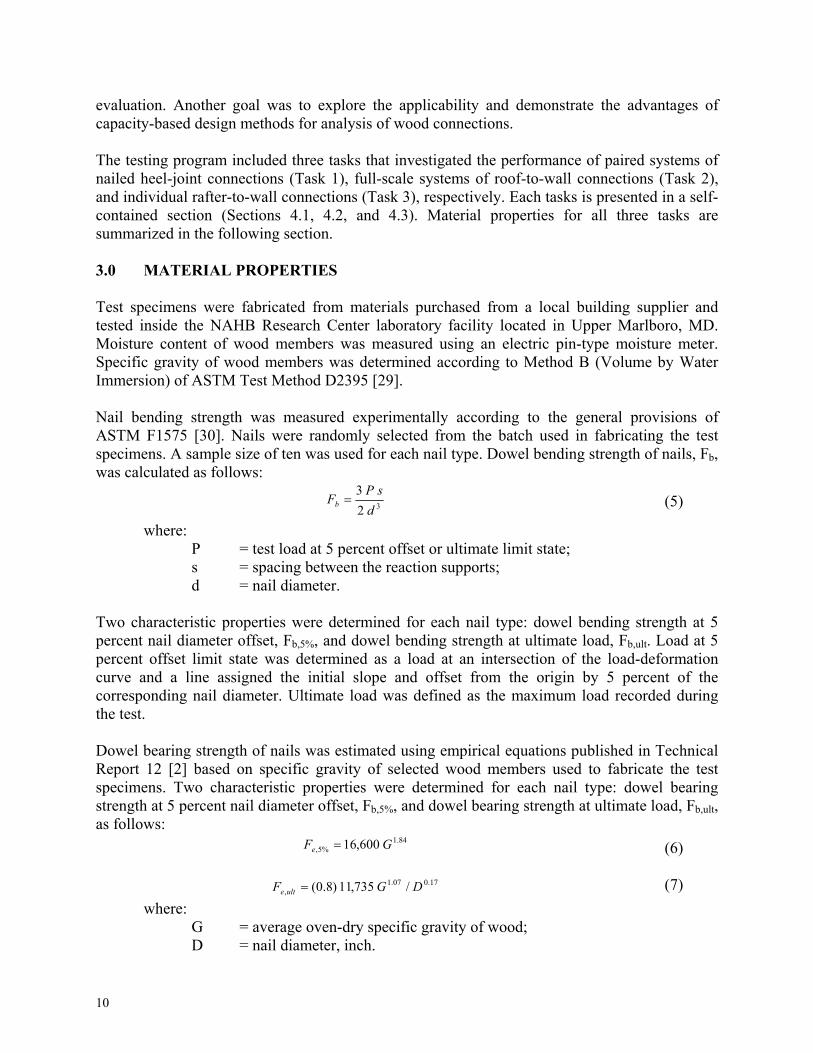
evaluation. Another goal was to explore the applicability and demonstrate the advantages of capacity-based design methods for analysis of wood connections. The testing program included three tasks that investigated the performance of paired systems of nailed heel-joint connections (Task 1), full-scale systems of roof-to-wall connections (Task 2), and individual rafter-to-wall connections (Task 3), respectively. Each tasks is presented in a self-contained section (Sections 4.1, 4.2, and 4.3). Material properties for all three tasks are summarized in the following section. 3.0 MATERIAL PROPERTIES Test specimens were fabricated from materials purchased from a local building supplier and tested inside the NAHB Research Center laboratory facility located in Upper Marlboro, MD. Moisture content of wood members was measured using an electric pin-type moisture meter. Specific gravity of wood members was determined according to Method B (Volume by Water Immersion) of ASTM Test Method D2395 [29]. Nail bending strength was measured experimentally according to the general provisions of ASTM F1575 [30]. Nails were randomly selected from the batch used in fabricating the test specimens. A sample size of ten was used for each nail type. Dowel bending strength of nails, Fb, was calculated as follows:
323
dsP
Fb = (5)
where: P = test load at 5 percent offset or ultimate limit state; s = spacing between the reaction supports; d = nail diameter. Two characteristic properties were determined for each nail type: dowel bending strength at 5 percent nail diameter offset, Fb,5%, and dowel bending strength at ultimate load, Fb,ult. Load at 5 percent offset limit state was determined as a load at an intersection of the load-deformation curve and a line assigned the initial slope and offset from the origin by 5 percent of the corresponding nail diameter. Ultimate load was defined as the maximum load recorded during the test. Dowel bearing strength of nails was estimated using empirical equations published in Technical Report 12 [2] based on specific gravity of selected wood members used to fabricate the test specimens. Two characteristic properties were determined for each nail type: dowel bearing strength at 5 percent nail diameter offset, Fb,5%, and dowel bearing strength at ultimate load, Fb,ult, as follows:
84.1%5, 600,16 GFe =
17.007.1
, /735,11)8.0( DGF ulte =
(6)
(7) where:
G = average oven-dry specific gravity of wood; D = nail diameter, inch.
10
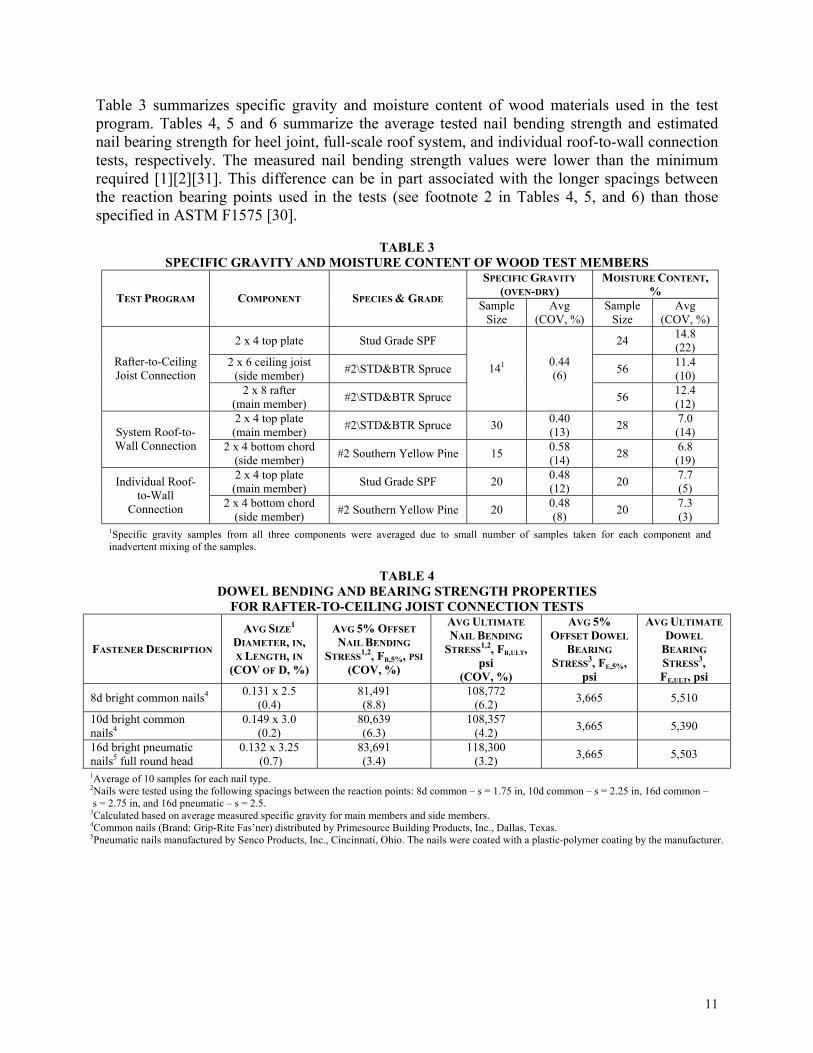
Table 3 summarizes specific gravity and moisture content of wood materials used in the test program. Tables 4, 5 and 6 summarize the average tested nail bending strength and estimated nail bearing strength for heel joint, full-scale roof system, and individual roof-to-wall connection tests, respectively. The measured nail bending strength values were lower than the minimum required [1][2][31]. This difference can be in part associated with the longer spacings between the reaction bearing points used in the tests (see footnote 2 in Tables 4, 5, and 6) than those specified in ASTM F1575 [30].
TABLE 3
SPECIFIC GRAVITY AND MOISTURE CONTENT OF WOOD TEST MEMBERS SPECIFIC GRAVITY
(OVEN-DRY) MOISTURE CONTENT,
% TEST PROGRAM COMPONENT SPECIES & GRADE Sample Size
Avg (COV, %)
Sample Size
Avg (COV, %)
2 x 4 top plate Stud Grade SPF 24 14.8 (22)
2 x 6 ceiling joist (side member) #2\STD&BTR Spruce 56 11.4
(10) Rafter-to-Ceiling Joist Connection
2 x 8 rafter (main member) #2\STD&BTR Spruce
141
0.44 (6)
56 12.4 (12)
2 x 4 top plate (main member) #2\STD&BTR Spruce 30 0.40
(13) 28 7.0 (14) System Roof-to-
Wall Connection 2 x 4 bottom chord (side member) #2 Southern Yellow Pine 15 0.58
(14) 28 6.8 (19)
2 x 4 top plate (main member) Stud Grade SPF 20 0.48
(12) 20 7.7 (5) Individual Roof-
to-Wall Connection 2 x 4 bottom chord
(side member) #2 Southern Yellow Pine 20 0.48 (8) 20 7.3
(3) 1Specific gravity samples from all three components were averaged due to small number of samples taken for each component and inadvertent mixing of the samples.
TABLE 4
DOWEL BENDING AND BEARING STRENGTH PROPERTIES FOR RAFTER-TO-CEILING JOIST CONNECTION TESTS
FASTENER DESCRIPTION
AVG SIZE1
DIAMETER, IN, X LENGTH, IN
(COV OF D, %)
AVG 5% OFFSET NAIL BENDING
STRESS1,2, FB,5%, PSI (COV, %)
AVG ULTIMATE NAIL BENDING
STRESS1,2, FB,ULT,
psi (COV, %)
AVG 5% OFFSET DOWEL
BEARING STRESS3, FE,5%,
psi
AVG ULTIMATE DOWEL
BEARING STRESS3, FE,ULT, psi
8d bright common nails4 0.131 x 2.5 (0.4)
81,491 (8.8)
108,772 (6.2) 3,665 5,510
10d bright common nails4
0.149 x 3.0 (0.2)
80,639 (6.3)
108,357 (4.2) 3,665 5,390
16d bright pneumatic nails5 full round head
0.132 x 3.25 (0.7)
83,691 (3.4)
118,300 (3.2) 3,665 5,503
1Average of 10 samples for each nail type. 2Nails were tested using the following spacings between the reaction points: 8d common – s = 1.75 in, 10d common – s = 2.25 in, 16d common – s = 2.75 in, and 16d pneumatic – s = 2.5. 3Calculated based on average measured specific gravity for main members and side members. 4Common nails (Brand: Grip-Rite Fas’ner) distributed by Primesource Building Products, Inc., Dallas, Texas. 5Pneumatic nails manufactured by Senco Products, Inc., Cincinnati, Ohio. The nails were coated with a plastic-polymer coating by the manufacturer.
11
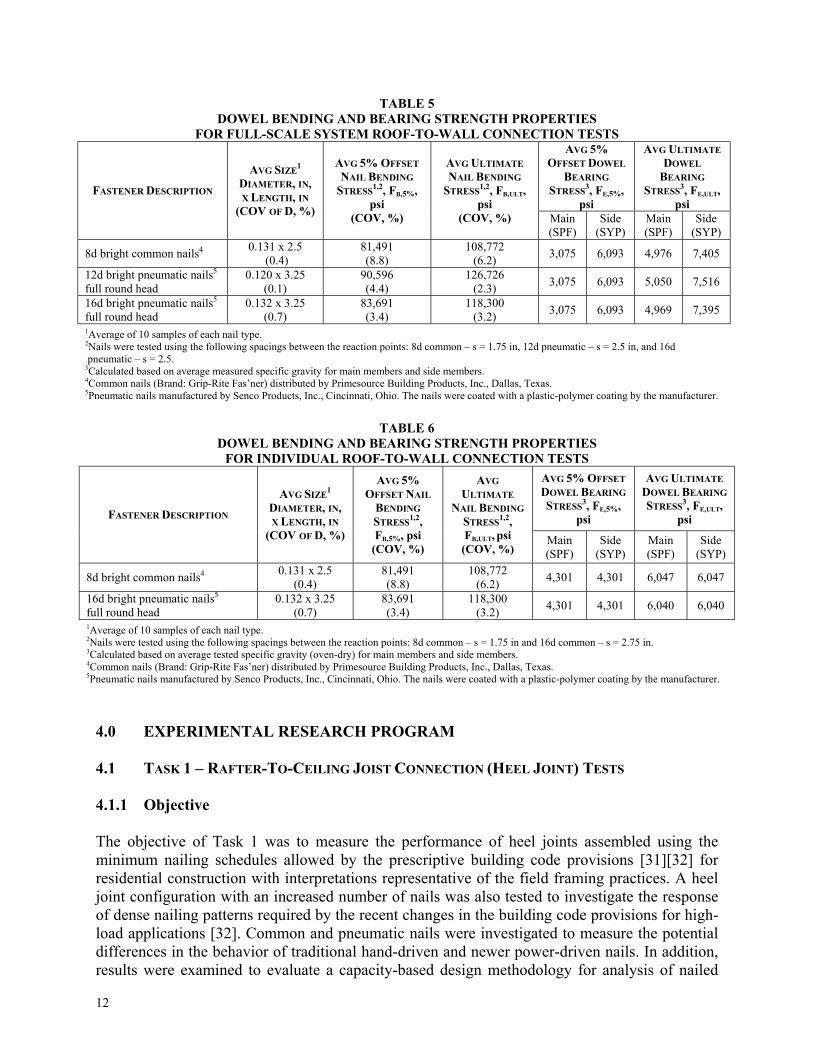
TABLE 5 DOWEL BENDING AND BEARING STRENGTH PROPERTIES
FOR FULL-SCALE SYSTEM ROOF-TO-WALL CONNECTION TESTS AVG 5%
OFFSET DOWEL BEARING
STRESS3, FE,5%, psi
AVG ULTIMATE DOWEL
BEARING STRESS3, FE,ULT,
psi FASTENER DESCRIPTION
AVG SIZE1
DIAMETER, IN, X LENGTH, IN
(COV OF D, %)
AVG 5% OFFSET NAIL BENDING
STRESS1,2, FB,5%, psi
(COV, %)
AVG ULTIMATE NAIL BENDING
STRESS1,2, FB,ULT,
psi (COV, %) Main
(SPF) Side
(SYP) Main (SPF)
Side (SYP)
8d bright common nails4 0.131 x 2.5 (0.4)
81,491 (8.8)
108,772 (6.2) 3,075 6,093 4,976 7,405
12d bright pneumatic nails5 full round head
0.120 x 3.25 (0.1)
90,596 (4.4)
126,726 (2.3) 3,075 6,093 5,050 7,516
16d bright pneumatic nails5 full round head
0.132 x 3.25 (0.7)
83,691 (3.4)
118,300 (3.2) 3,075 6,093 4,969 7,395
1Average of 10 samples of each nail type. 2Nails were tested using the following spacings between the reaction points: 8d common – s = 1.75 in, 12d pneumatic – s = 2.5 in, and 16d pneumatic – s = 2.5. 3Calculated based on average measured specific gravity for main members and side members. 4Common nails (Brand: Grip-Rite Fas’ner) distributed by Primesource Building Products, Inc., Dallas, Texas. 5Pneumatic nails manufactured by Senco Products, Inc., Cincinnati, Ohio. The nails were coated with a plastic-polymer coating by the manufacturer.
TABLE 6
DOWEL BENDING AND BEARING STRENGTH PROPERTIES FOR INDIVIDUAL ROOF-TO-WALL CONNECTION TESTS
AVG 5% OFFSET DOWEL BEARING STRESS3, FE,5%,
psi
AVG ULTIMATE DOWEL BEARING STRESS3, FE,ULT,
psi FASTENER DESCRIPTION
AVG SIZE1
DIAMETER, IN, X LENGTH, IN
(COV OF D, %)
AVG 5% OFFSET NAIL
BENDING STRESS1,2, FB,5%, psi
(COV, %)
AVG ULTIMATE
NAIL BENDING STRESS1,2, FB,ULT, psi (COV, %)
Main (SPF)
Side (SYP)
Main (SPF)
Side (SYP)
8d bright common nails4 0.131 x 2.5 (0.4)
81,491 (8.8)
108,772 (6.2) 4,301 4,301 6,047 6,047
16d bright pneumatic nails5 full round head
0.132 x 3.25 (0.7)
83,691 (3.4)
118,300 (3.2) 4,301 4,301 6,040 6,040
1Average of 10 samples of each nail type. 2Nails were tested using the following spacings between the reaction points: 8d common – s = 1.75 in and 16d common – s = 2.75 in. 3Calculated based on average tested specific gravity (oven-dry) for main members and side members. 4Common nails (Brand: Grip-Rite Fas’ner) distributed by Primesource Building Products, Inc., Dallas, Texas. 5Pneumatic nails manufactured by Senco Products, Inc., Cincinnati, Ohio. The nails were coated with a plastic-polymer coating by the manufacturer.
4.0 EXPERIMENTAL RESEARCH PROGRAM 4.1 TASK 1 – RAFTER-TO-CEILING JOIST CONNECTION (HEEL JOINT) TESTS 4.1.1 Objective The objective of Task 1 was to measure the performance of heel joints assembled using the minimum nailing schedules allowed by the prescriptive building code provisions [31][32] for residential construction with interpretations representative of the field framing practices. A heel joint configuration with an increased number of nails was also tested to investigate the response of dense nailing patterns required by the recent changes in the building code provisions for high-load applications [32]. Common and pneumatic nails were investigated to measure the potential differences in the behavior of traditional hand-driven and newer power-driven nails. In addition, results were examined to evaluate a capacity-based design methodology for analysis of nailed
12
connections. Test results were used to determine the scope of the minimum allowed prescriptive provisions for heel joint construction for selected building configurations and loading conditions. 4.1.2 Experimental Approach
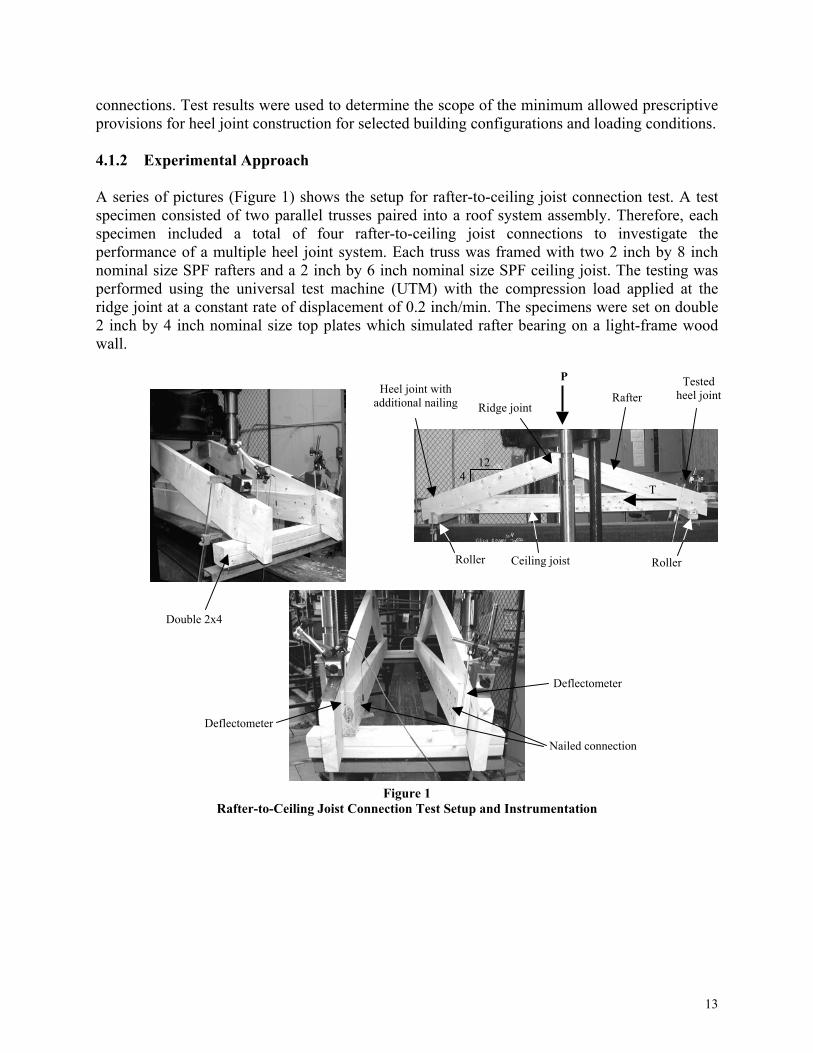
A series of pictures (Figure 1) shows the setup for rafter-to-ceiling joist connection test. A test specimen consisted of two parallel trusses paired into a roof system assembly. Therefore, each specimen included a total of four rafter-to-ceiling joist connections to investigate the performance of a multiple heel joint system. Each truss was framed with two 2 inch by 8 inch nominal size SPF rafters and a 2 inch by 6 inch nominal size SPF ceiling joist. The testing was performed using the universal test machine (UTM) with the compression load applied at the ridge joint at a constant rate of displacement of 0.2 inch/min. The specimens were set on double 2 inch by 4 inch nominal size top plates which simulated rafter bearing on a light-frame wood wall.
Figure 1
Rafter-to-Ceiling Joist Connection Test Setup and Instrumentation
P
T
Heel joint with additional nailing
Roller
4 12
Ridge joint
Tested heel joint
Deflectometer
Deflectometer
Nailed connection
Roller
Rafter
Ceiling joist
Double 2x4
13

Five connection configurations were tested with varying fastening schedules (Table 7). Specimen configurations 1, 3, and 5 were tested without mechanical fasteners between the top plates and the specimens (unattached), whereas specimen configurations 2 and 4 were testes with the rafters and ceiling joists toe-nailed to the top plates (attached). Heel joint configuration 5 with 12 nails per joint was investigated to evaluate recent changes to connection requirements for residential construction.
TABLE 7
SPECIMEN CONFIGURATIONS FOR RAFTER-TO-CEILING JOIST CONNECTION TESTS
CO
NFI
G. #
RAFTER-TO-JOIST CONNECTION1 TEST SPECIMEN METHOD OF CONNECTING
TO THE TOP PLATE
SAMPLE SIZE
(PAIRS)
1 3-10d Common Nails 2 x 6 Ceiling Joist
face-nailed to 2 x 8 Rafters
Unattached 6
2 3-10d Common Nails 2 x 6 Ceiling Joist
face-nailed to 2 x 8 Rafters
Attached with 3-8d Common Toe-Nails per
Joint 6
3 3-16d Pneumatic Nails 2 x 6 Ceiling Joist
face-nailed to 2 x 8 Rafters
Unattached 6
4 3-16d Pneumatic Nails 2 x 6 Ceiling Joist
face-nailed to 2 x 8 Rafters
Attached with 3-16d Pneumatic Toe-Nails per
Joint 6
5 12-16d Pneumatic Nails 2 x 6 Ceiling Joist
face-nailed to 2 x 8 Rafters
Unattached 2
1For actual nail sizes, refer to Section 4.1. Three toe-nails per joint were used to connect the rafter-ceiling joist assemblies to the top plate in the "attached" tests (Table 7). Therefore, the force transferred between the ceiling joist and rafter through the top plate was limited by the member receiving one toe-nail to the top plate. The load was applied through a 2-inch square steel distribution beam that spanned the paired trusses at the ridge joint. The distribution beam was rigidly fixed to the UTM crosshead so that equal displacements were applied to each rafter to more closely represent the behavior of rafters and heel joints within a sheathed roof system. A 2 inch by 4 inch piece of oriented strand board was nailed to the interior surface of the ridge joint to temporarily brace the assembly until it was secured in the UTM. Roller plates under the double top plates at both reactions allowed horizontal movement of the specimens at the heel joints. Horizontal displacement of the rafter relative to the ceiling joist was measured with a deflectometer1. Displacements were measured for two heel joints on one side of the specimen (Figure 1) and, to ensure that failure occurred at one of these two joints, the number of nails was doubled for the joints on the opposite side of the specimen. Each test was run until the maximum load occurred and a downward trend in load was observed. Load and displacement
14
1Deflectometers were manufactured by Instron – Satec Systems, Grove City, PA.
measurements were collected by the UTM data acquisition system. Following each test, one nail from the connection was isolated and the wood joint was split apart to identify the failure mode. Calculation of the loads used in the analysis was based on the assumption that the applied load, P (Figure 1), was equally distributed between the opposite sides of each specimen. The tension force in the ceiling joist was the force resisted by the nails at the heel joint. The lateral load resisted by a system of two parallel heel joints was calculated as follows:
)(21
θTanPT = (8)
where: P = applied compression load; Tan(θ) = slope of the rafter relative to the ceiling joist, and, T = total tension force in two ceiling joists.
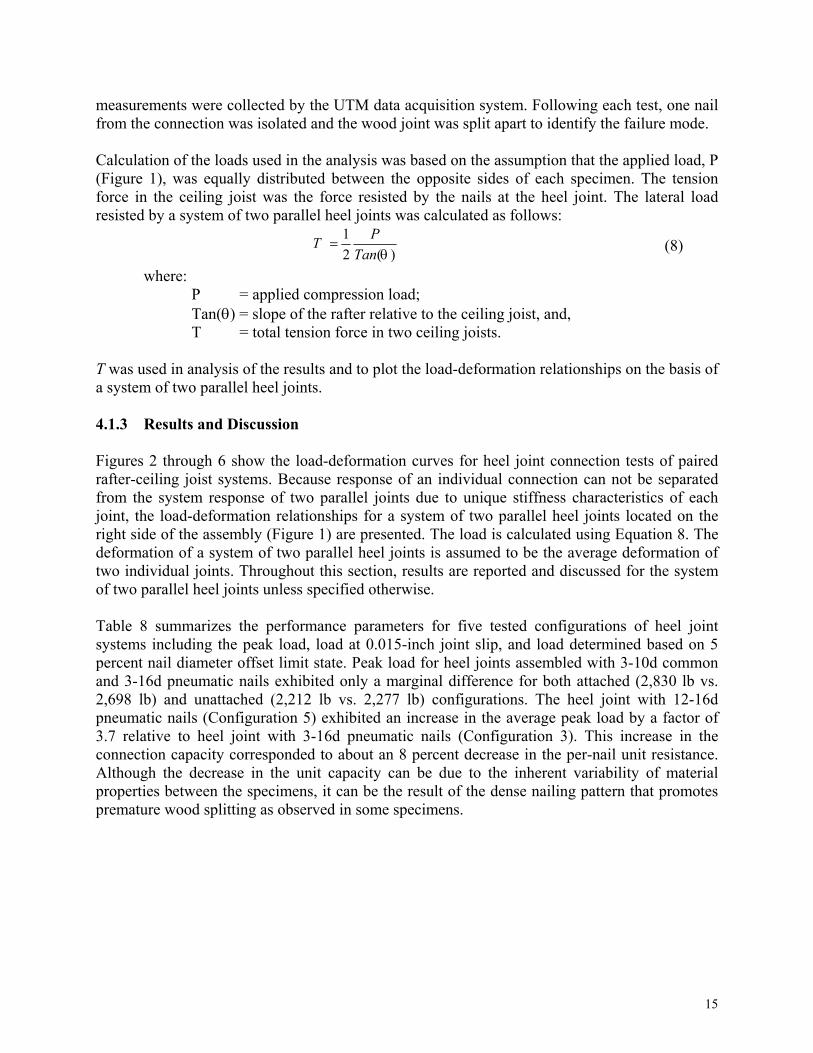
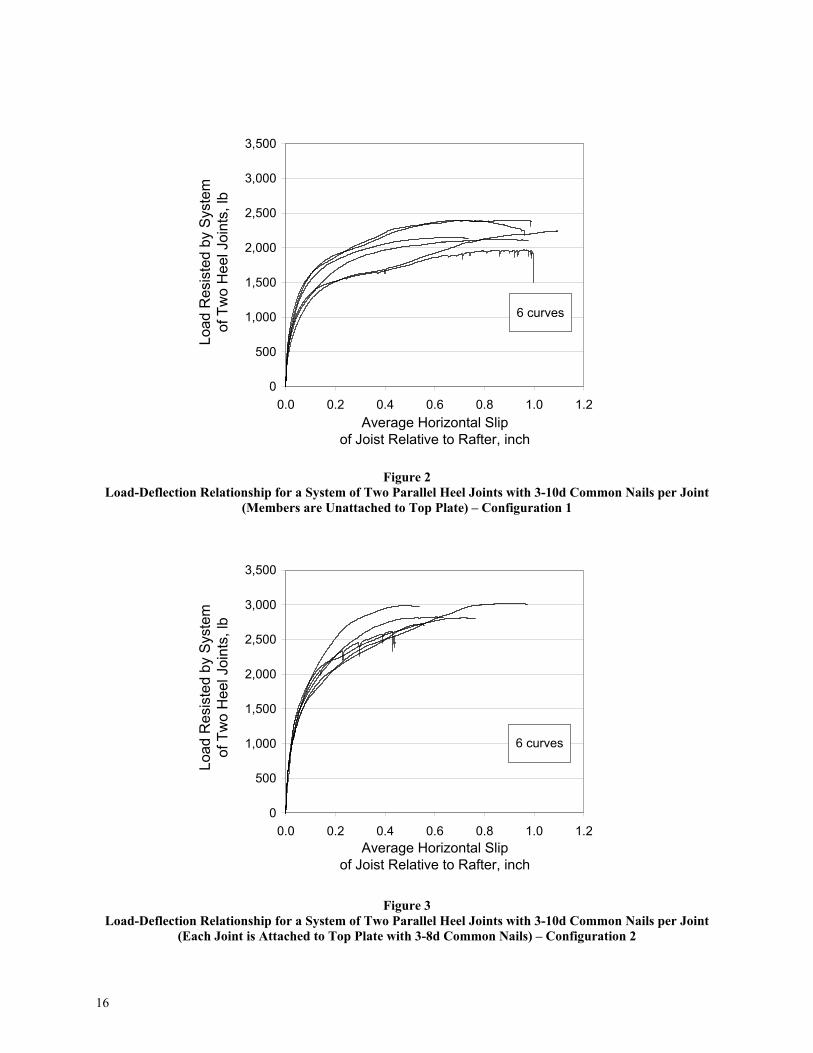
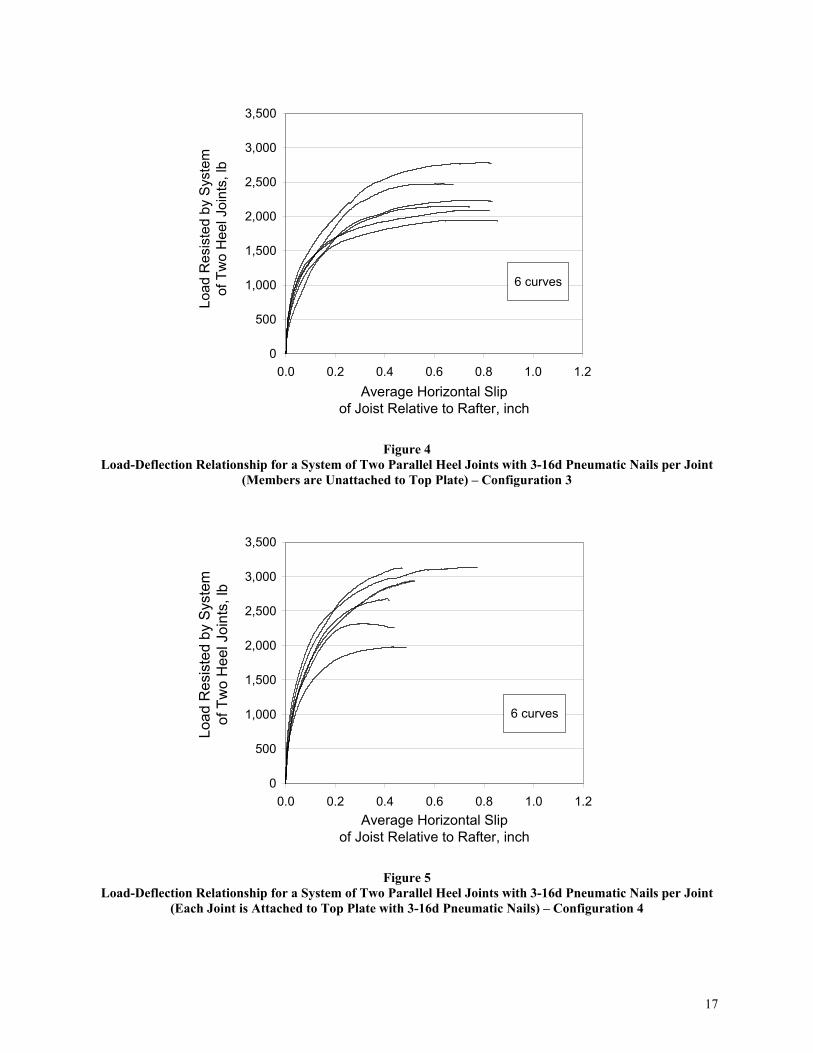
T was used in analysis of the results and to plot the load-deformation relationships on the basis of a system of two parallel heel joints. 4.1.3 Results and Discussion Figures 2 through 6 show the load-deformation curves for heel joint connection tests of paired rafter-ceiling joist systems. Because response of an individual connection can not be separated from the system response of two parallel joints due to unique stiffness characteristics of each joint, the load-deformation relationships for a system of two parallel heel joints located on the right side of the assembly (Figure 1) are presented. The load is calculated using Equation 8. The deformation of a system of two parallel heel joints is assumed to be the average deformation of two individual joints. Throughout this section, results are reported and discussed for the system of two parallel heel joints unless specified otherwise. Table 8 summarizes the performance parameters for five tested configurations of heel joint systems including the peak load, load at 0.015-inch joint slip, and load determined based on 5 percent nail diameter offset limit state. Peak load for heel joints assembled with 3-10d common and 3-16d pneumatic nails exhibited only a marginal difference for both attached (2,830 lb vs. 2,698 lb) and unattached (2,212 lb vs. 2,277 lb) configurations. The heel joint with 12-16d pneumatic nails (Configuration 5) exhibited an increase in the average peak load by a factor of 3.7 relative to heel joint with 3-16d pneumatic nails (Configuration 3). This increase in the connection capacity corresponded to about an 8 percent decrease in the per-nail unit resistance. Although the decrease in the unit capacity can be due to the inherent variability of material properties between the specimens, it can be the result of the dense nailing pattern that promotes premature wood splitting as observed in some specimens.
15
0
500
1,000
1,500
2,000
2,500
3,000
3,500
0.0 0.2 0.4 0.6 0.8 1.0 1.2Average Horizontal Slip
of Joist Relative to Rafter, inch
Load
Res
iste
d by
Sys
tem
of
Tw
o H
eel J
oint
s, lb
6 curves
Figure 2
Load-Deflection Relationship for a System of Two Parallel Heel Joints with 3-10d Common Nails per Joint (Members are Unattached to Top Plate) – Configuration 1
0
500
1,000
1,500
2,000
2,500
3,000
3,500
0.0 0.2 0.4 0.6 0.8 1.0 1.2Average Horizontal Slip
of Joist Relative to Rafter, inch
Load
Res
iste
d by
Sys
tem
of
Tw
o H
eel J
oint
s, lb
6 curves
Figure 3
Load-Deflection Relationship for a System of Two Parallel Heel Joints with 3-10d Common Nails per Joint (Each Joint is Attached to Top Plate with 3-8d Common Nails) – Configuration 2
16
0
500
1,000
1,500
2,000
2,500
3,000
3,500
0.0 0.2 0.4 0.6 0.8 1.0 1.2Average Horizontal Slip
of Joist Relative to Rafter, inch
Load
Res
iste
d by
Sys
tem
of
Tw
o H
eel J
oint
s, lb
6 curves
Figure 4
Load-Deflection Relationship for a System of Two Parallel Heel Joints with 3-16d Pneumatic Nails per Joint (Members are Unattached to Top Plate) – Configuration 3
0
500
1,000
1,500
2,000
2,500
3,000
3,500
0.0 0.2 0.4 0.6 0.8 1.0 1.2Average Horizontal Slip
of Joist Relative to Rafter, inch
Load
Res
iste
d by
Sys
tem
of
Tw
o H
eel J
oint
s, lb
6 curves
Figure 5
Load-Deflection Relationship for a System of Two Parallel Heel Joints with 3-16d Pneumatic Nails per Joint (Each Joint is Attached to Top Plate with 3-16d Pneumatic Nails) – Configuration 4
17
0
1,000
2,000
3,000
4,000
5,000
6,000
7,000
8,000
9,000
0.0 0.2 0.4 0.6 0.8 1.0 1.2Average Horizontal Slip
of Joist Relative to Rafter, inch
Load
Res
iste
d by
Sys
tem
of
Tw
o H
eel J
oint
s, lb
2 curves
Figure 6
Load-Deflection Relationship for a System of Two Parallel Heel Joints with 12-16d Pneumatic Nails per Joint (Members are Unattached to Top Plate) – Configuration 5
TABLE 8 SUMMARY OF TEST RESULTS FOR RAFTER-TO-CEILING JOIST CONNECTION TESTS
PEAK LOAD1 LOAD1 @ 0.015 IN. SLIP
LOAD1 @ 5% NAIL DIAMETER
OFFSET
CO
NFI
G. #
RAFTER-TO-JOIST
CONNECTION
SAMPLE SIZE
(PAIRS)
METHOD OF CONNECTING TO THE TOP PLATE Mean,
lb COV,
% Mean,
lb COV,
% Mean,
lb COV,
%
1 3-10d Common Nails 6 Unattached 2,212 7.5 687 13.5 708 9.4
2 3-10d Common Nails 6
Attached with 3-8d Common Toe-Nails
per Joint 2,830 5.4 775 8.0 817 6.3
3 3-16d Pneumatic Nails 6 Unattached 2,277 13.3 586 16.5 592 12.4
4 3-16d Pneumatic Nails 6
Attached with 3-16d Pneumatic Toe-Nails per Joint
2,698 17.4 764 14.9 825 13.1
5 12-16d Pneumatic Nails 2 Unattached 8,406 n/a2 3,031 n/a2 2,875 n/a2
1Shear load on a system of paired joints calculated using Equation 8. 2 due to small sample size. COV is not reported
18
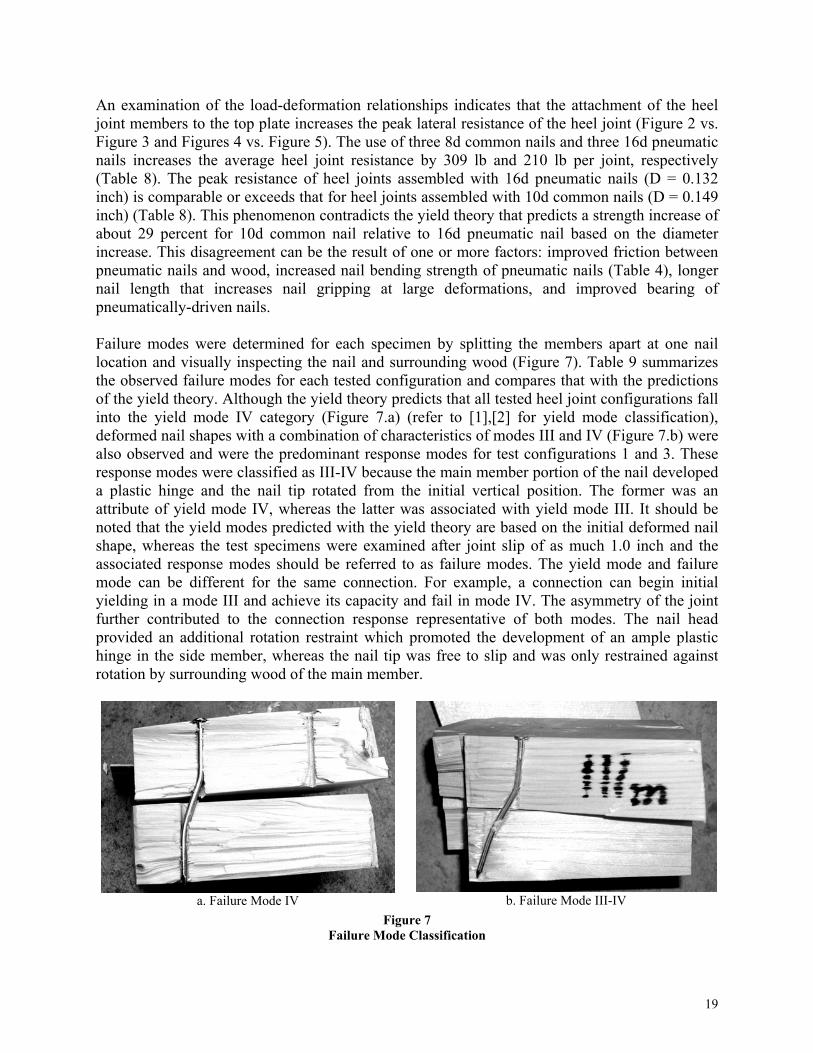
An examination of the load-deformation relationships indicates that the attachment of the heel joint members to the top plate increases the peak lateral resistance of the heel joint (Figure 2 vs. Figure 3 and Figures 4 vs. Figure 5). The use of three 8d common nails and three 16d pneumatic nails increases the average heel joint resistance by 309 lb and 210 lb per joint, respectively (Table 8). The peak resistance of heel joints assembled with 16d pneumatic nails (D = 0.132 inch) is comparable or exceeds that for heel joints assembled with 10d common nails (D = 0.149 inch) (Table 8). This phenomenon contradicts the yield theory that predicts a strength increase of about 29 percent for 10d common nail relative to 16d pneumatic nail based on the diameter increase. This disagreement can be the result of one or more factors: improved friction between pneumatic nails and wood, increased nail bending strength of pneumatic nails (Table 4), longer nail length that increases nail gripping at large deformations, and improved bearing of pneumatically-driven nails. Failure modes were determined for each specimen by splitting the members apart at one nail location and visually inspecting the nail and surrounding wood (Figure 7). Table 9 summarizes the observed failure modes for each tested configuration and compares that with the predictions of the yield theory. Although the yield theory predicts that all tested heel joint configurations fall into the yield mode IV category (Figure 7.a) (refer to [1],[2] for yield mode classification), deformed nail shapes with a combination of characteristics of modes III and IV (Figure 7.b) were also observed and were the predominant response modes for test configurations 1 and 3. These response modes were classified as III-IV because the main member portion of the nail developed a plastic hinge and the nail tip rotated from the initial vertical position. The former was an attribute of yield mode IV, whereas the latter was associated with yield mode III. It should be noted that the yield modes predicted with the yield theory are based on the initial deformed nail shape, whereas the test specimens were examined after joint slip of as much 1.0 inch and the associated response modes should be referred to as failure modes. The yield mode and failure mode can be different for the same connection. For example, a connection can begin initial yielding in a mode III and achieve its capacity and fail in mode IV. The asymmetry of the joint further contributed to the connection response representative of both modes. The nail head provided an additional rotation restraint which promoted the development of an ample plastic hinge in the side member, whereas the nail tip was free to slip and was only restrained against rotation by surrounding wood of the main member.
a. Failure Mode IV
b. Failure Mode III-IV
Figure 7 Failure Mode Classification
19
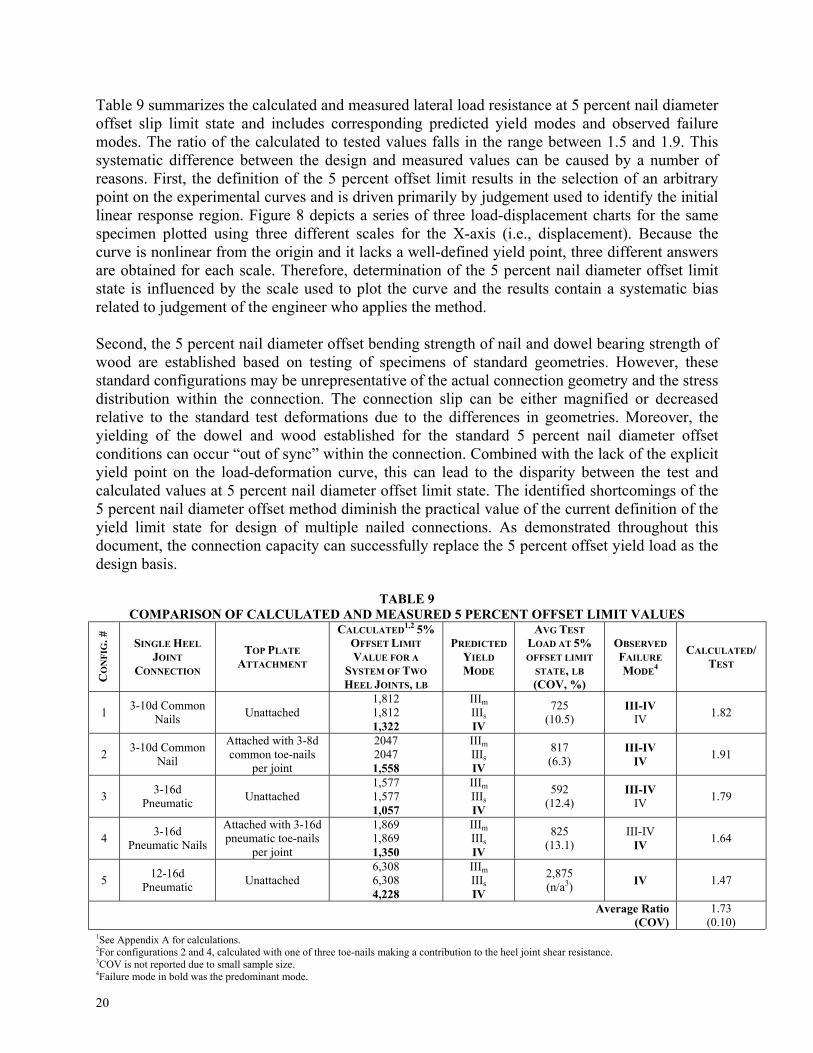
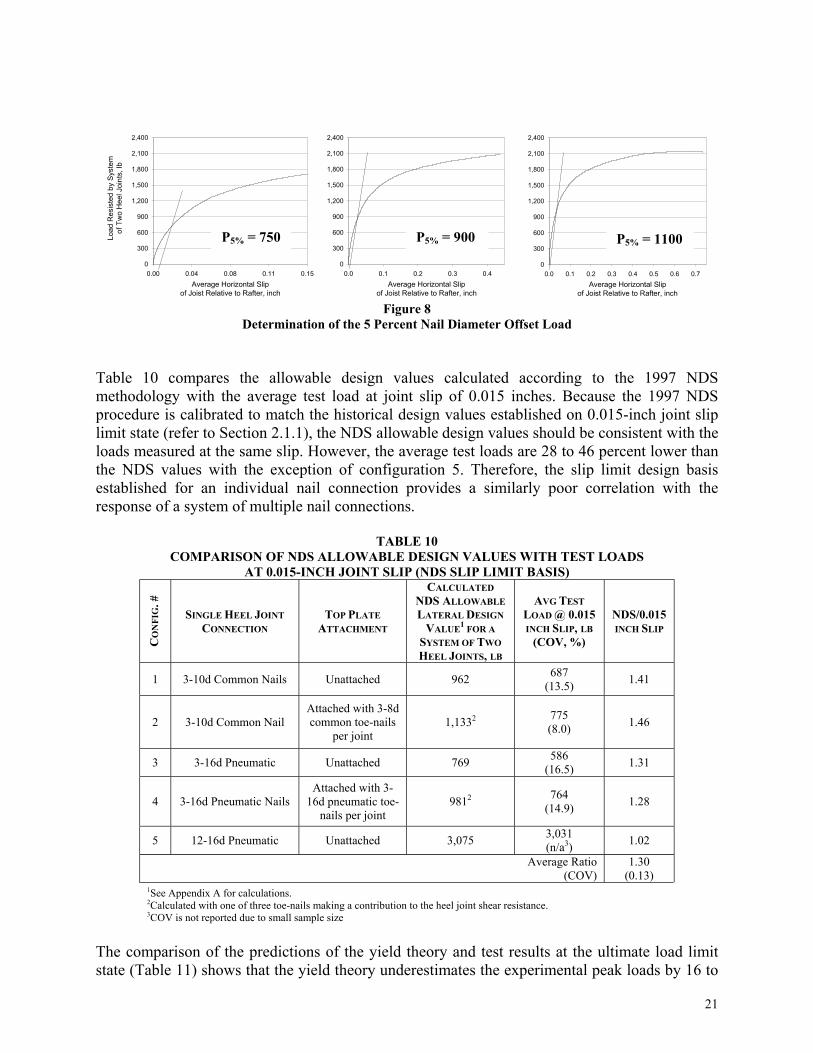
Table 9 summarizes the calculated and measured lateral load resistance at 5 percent nail diameter offset slip limit state and includes corresponding predicted yield modes and observed failure modes. The ratio of the calculated to tested values falls in the range between 1.5 and 1.9. This systematic difference between the design and measured values can be caused by a number of reasons. First, the definition of the 5 percent offset limit results in the selection of an arbitrary point on the experimental curves and is driven primarily by judgement used to identify the initial linear response region. Figure 8 depicts a series of three load-displacement charts for the same specimen plotted using three different scales for the X-axis (i.e., displacement). Because the curve is nonlinear from the origin and it lacks a well-defined yield point, three different answers are obtained for each scale. Therefore, determination of the 5 percent nail diameter offset limit state is influenced by the scale used to plot the curve and the results contain a systematic bias related to judgement of the engineer who applies the method. Second, the 5 percent nail diameter offset bending strength of nail and dowel bearing strength of wood are established based on testing of specimens of standard geometries. However, these standard configurations may be unrepresentative of the actual connection geometry and the stress distribution within the connection. The connection slip can be either magnified or decreased relative to the standard test deformations due to the differences in geometries. Moreover, the yielding of the dowel and wood established for the standard 5 percent nail diameter offset conditions can occur “out of sync” within the connection. Combined with the lack of the explicit yield point on the load-deformation curve, this can lead to the disparity between the test and calculated values at 5 percent nail diameter offset limit state. The identified shortcomings of the 5 percent nail diameter offset method diminish the practical value of the current definition of the yield limit state for design of multiple nailed connections. As demonstrated throughout this document, the connection capacity can successfully replace the 5 percent offset yield load as the design basis.
TABLE 9 COMPARISON OF CALCULATED AND MEASURED 5 PERCENT OFFSET LIMIT VALUES
CO
NFI
G. #
SINGLE HEEL JOINT
CONNECTION
TOP PLATE ATTACHMENT
CALCULATED1,2 5% OFFSET LIMIT VALUE FOR A
SYSTEM OF TWO HEEL JOINTS, LB
PREDICTED YIELD MODE
AVG TEST LOAD AT 5% OFFSET LIMIT
STATE, LB (COV, %)
OBSERVED FAILURE MODE4
CALCULATED/ TEST
1 3-10d Common Nails Unattached
1,812 1,812 1,322
IIIm IIIs IV
725 (10.5)
III-IV IV 1.82
2 3-10d Common Nail
Attached with 3-8d common toe-nails
per joint
2047 2047 1,558
IIIm IIIs IV
817 (6.3)
III-IV IV 1.91
3 3-16d Pneumatic Unattached
1,577 1,577 1,057
IIIm IIIs IV
592 (12.4)
III-IV IV 1.79
4 3-16d Pneumatic Nails
Attached with 3-16d pneumatic toe-nails
per joint
1,869 1,869 1,350
IIIm IIIs IV
825 (13.1)
III-IV IV 1.64
5 12-16d Pneumatic Unattached
6,308 6,308 4,228
IIIm IIIs IV
2,875 (n/a3) IV 1.47
Average Ratio (COV)
1.73 (0.10)
1See Appendix A for calculations. 2For configurations 2 and 4, calculated with one of three toe-nails making a contribution to the heel joint shear resistance. 3COV is not reported due to small sample size. 4Failure mode in bold was the predominant mode.
20
0
300
600
900
1,200
1,500
1,800
2,100
2,400
0.0 0.1 0.2 0.3 0.4Average Horizontal Slip
of Joist Relative to Rafter, inch
0
300
600
900
1,200
1,500
1,800
2,100
2,400
0.00 0.04 0.08 0.11 0.15Average Horizontal Slip
of Joist Relative to Rafter, inch
Load
Res
iste
d by
Sys
tem
of
Tw
o H
eel J
oint
s, lb
0
300
600
900
1,200
1,500
1,800
2,100
2,400
0.0 0.1 0.2 0.3 0.4 0.5 0.6 0.7Average Horizontal Slip
of Joist Relative to Rafter, inch
P5% = 750 P5% = 900 P5% = 1100
Figure 8 Determination of the 5 Percent Nail Diameter Offset Load
Table 10 compares the allowable design values calculated according to the 1997 NDS methodology with the average test load at joint slip of 0.015 inches. Because the 1997 NDS procedure is calibrated to match the historical design values established on 0.015-inch joint slip limit state (refer to Section 2.1.1), the NDS allowable design values should be consistent with the loads measured at the same slip. However, the average test loads are 28 to 46 percent lower than the NDS values with the exception of configuration 5. Therefore, the slip limit design basis established for an individual nail connection provides a similarly poor correlation with the response of a system of multiple nail connections.
TABLE 10 COMPARISON OF NDS ALLOWABLE DESIGN VALUES WITH TEST LOADS
AT 0.015-INCH JOINT SLIP (NDS SLIP LIMIT BASIS)
CO
NFI
G. #
SINGLE HEEL JOINT CONNECTION
TOP PLATE ATTACHMENT
CALCULATED NDS ALLOWABLE LATERAL DESIGN
VALUE1 FOR A SYSTEM OF TWO HEEL JOINTS, LB
AVG TEST LOAD @ 0.015 INCH SLIP, LB
(COV, %)
NDS/0.015 INCH SLIP
1 3-10d Common Nails Unattached 962 687 (13.5) 1.41
2 3-10d Common Nail Attached with 3-8d common toe-nails
per joint 1,1332 775
(8.0) 1.46
3 3-16d Pneumatic Unattached 769 586 (16.5) 1.31
4 3-16d Pneumatic Nails Attached with 3-
16d pneumatic toe-nails per joint
9812 764 (14.9) 1.28
5 12-16d Pneumatic Unattached 3,075 3,031 (n/a3) 1.02
Average Ratio (COV)
1.30 (0.13)
1See Appendix A for calculations. 2Calculated with one of three toe-nails making a contribution to the heel joint shear resistance. 3COV is not reported due to small sample size
The comparison of the predictions of the yield theory and test results at the ultimate load limit state (Table 11) shows that the yield theory underestimates the experimental peak loads by 16 to
21
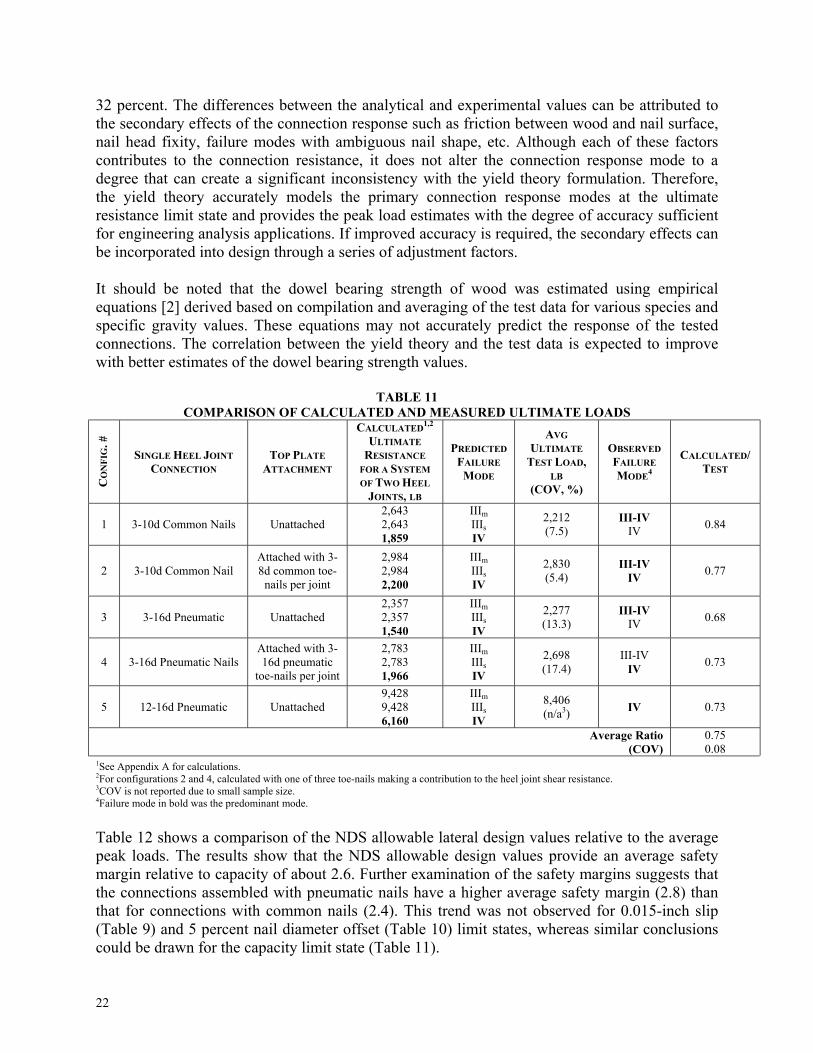
32 percent. The differences between the analytical and experimental values can be attributed to the secondary effects of the connection response such as friction between wood and nail surface, nail head fixity, failure modes with ambiguous nail shape, etc. Although each of these factors contributes to the connection resistance, it does not alter the connection response mode to a degree that can create a significant inconsistency with the yield theory formulation. Therefore, the yield theory accurately models the primary connection response modes at the ultimate resistance limit state and provides the peak load estimates with the degree of accuracy sufficient for engineering analysis applications. If improved accuracy is required, the secondary effects can be incorporated into design through a series of adjustment factors. It should be noted that the dowel bearing strength of wood was estimated using empirical equations [2] derived based on compilation and averaging of the test data for various species and specific gravity values. These equations may not accurately predict the response of the tested connections. The correlation between the yield theory and the test data is expected to improve with better estimates of the dowel bearing strength values.
TABLE 11 COMPARISON OF CALCULATED AND MEASURED ULTIMATE LOADS
CO
NFI
G. #
SINGLE HEEL JOINT CONNECTION
TOP PLATE ATTACHMENT
CALCULATED1,2 ULTIMATE
RESISTANCE FOR A SYSTEM OF TWO HEEL
JOINTS, LB
PREDICTED FAILURE MODE
AVG ULTIMATE
TEST LOAD, LB
(COV, %)
OBSERVED FAILURE MODE4
CALCULATED/ TEST
1 3-10d Common Nails Unattached 2,643 2,643 1,859
IIIm IIIs IV
2,212 (7.5)
III-IV IV 0.84
2 3-10d Common Nail Attached with 3-8d common toe-
nails per joint
2,984 2,984 2,200
IIIm IIIs IV
2,830 (5.4)
III-IV IV 0.77
3 3-16d Pneumatic Unattached 2,357 2,357 1,540
IIIm IIIs IV
2,277 (13.3)
III-IV IV 0.68
4 3-16d Pneumatic Nails Attached with 3-16d pneumatic
toe-nails per joint
2,783 2,783 1,966
IIIm IIIs IV
2,698 (17.4)
III-IV IV 0.73
5 12-16d Pneumatic Unattached 9,428 9,428 6,160
IIIm IIIs IV
8,406 (n/a3) IV 0.73
Average Ratio (COV)
0.75 0.08
1See Appendix A for calculations. 2For configurations 2 and 4, calculated with one of three toe-nails making a contribution to the heel joint shear resistance. 3COV is not reported due to small sample size. 4Failure mode in bold was the predominant mode. Table 12 shows a comparison of the NDS allowable lateral design values relative to the average peak loads. The results show that the NDS allowable design values provide an average safety margin relative to capacity of about 2.6. Further examination of the safety margins suggests that the connections assembled with pneumatic nails have a higher average safety margin (2.8) than that for connections with common nails (2.4). This trend was not observed for 0.015-inch slip (Table 9) and 5 percent nail diameter offset (Table 10) limit states, whereas similar conclusions could be drawn for the capacity limit state (Table 11).
22

The pneumatic nails used in this study (refer to Section 4.1) have a plastic polymer coating applied from the nail tip to approximately half length of the nail. The coating is a heat-activated lubricant that decreases the forces required to drive the nail into wood and also works as a glue that improves the adhesion between nail to wood. The coatings considerably improve the dowel withdrawal resistance and can increase the dowel lateral resistance at the ultimate limit state [33]. Another reason for the increased strength of pneumatic connections can be the conditions of the dowel bearing surface produced by coated pneumatic nails installed using power tools in a fraction of a second as opposed to non-coated common nails installed manually with a hammer in several strokes. Through reducing friction, the lubricant decreases stresses during the nail installation and can minimize wood splitting around the nail body. Further research is needed to quantify these effects on the lateral resistance of connections assembled with pneumatic nails. The increased capacity of connections fabricated with coated pneumatic nails can be used as an evidence to introduce another adjustment factor for lateral and withdrawal design of nailed connections. However, the sustained long-term performance of such connections under moisture, temperature, and loading cycles should be demonstrated to allow for consideration of coating effects in design procedures. The increased resistance can be also attributed to longer nail length of 16d pneumatic nails, L = 3.25 inch, versus 8d common nails, L = 3.0 inch. The better penetration provides addition fixity of the nail tip in the main member and improved friction, both of which can enhance the connection performance at capacity level when the nail has deformed and undergone partial withdrawal from the main member. In addition, common nails with larger diameter, D=0.149 inch, than pneumatic nails, D=0.131 inch, can promote localized splitting of wood around the nail and alter bearing conditions in the direction parallel to grain.
TABLE 12 SAFETY MARGINS RELATIVE TO NDS ALLOWABLE VALUES
CO
NFI
G. #
SINGLE HEEL JOINT CONNECTION
TOP PLATE ATTACHMENT
CALCULATED1,2 NDS
ALLOWABLE LATERAL
DESIGN VALUE FOR A SYSTEM OF TWO HEEL
JOINTS, LB
NDS YIELD MODE
AVG ULTIMATE
TEST LOAD, LB
(COV, %)
OBSERVED
FAILURE MODE4
AVERAGE ULTIMATE/ND
S (SAFETY
MARGFIN)
1 3-10d Common Nails Unattached 962 IV 2,212 (7.5)
III-IV IV 2.30
2 3-10d Common Nail Attached with 3-8d common toe-
nails per joint 1,133 IV 2,830
(5.4) III-IV
IV 2.49
3 3-16d Pneumatic Unattached 769 IV 2,277 (13.3)
III-IV IV 2.96
4 3-16d Pneumatic Nails Attached with 3-16d pneumatic
toe-nails per joint 981 IV 2,698
(17.4) III-IV
IV 2.75
5 12-16d Pneumatic Unattached 3,075 IV 8,406 (n/a3) IV 2.73
Average Ratio (COV)
2.64 (0.10)
1See Appendix A for calculations. 2For configurations 2 and 3, calculated with one of three toe-nails making a contribution to the heel joint shear resistance. 3COV is not reported due to small sample size. 4Failure mode in bold was the predominant mode. 23
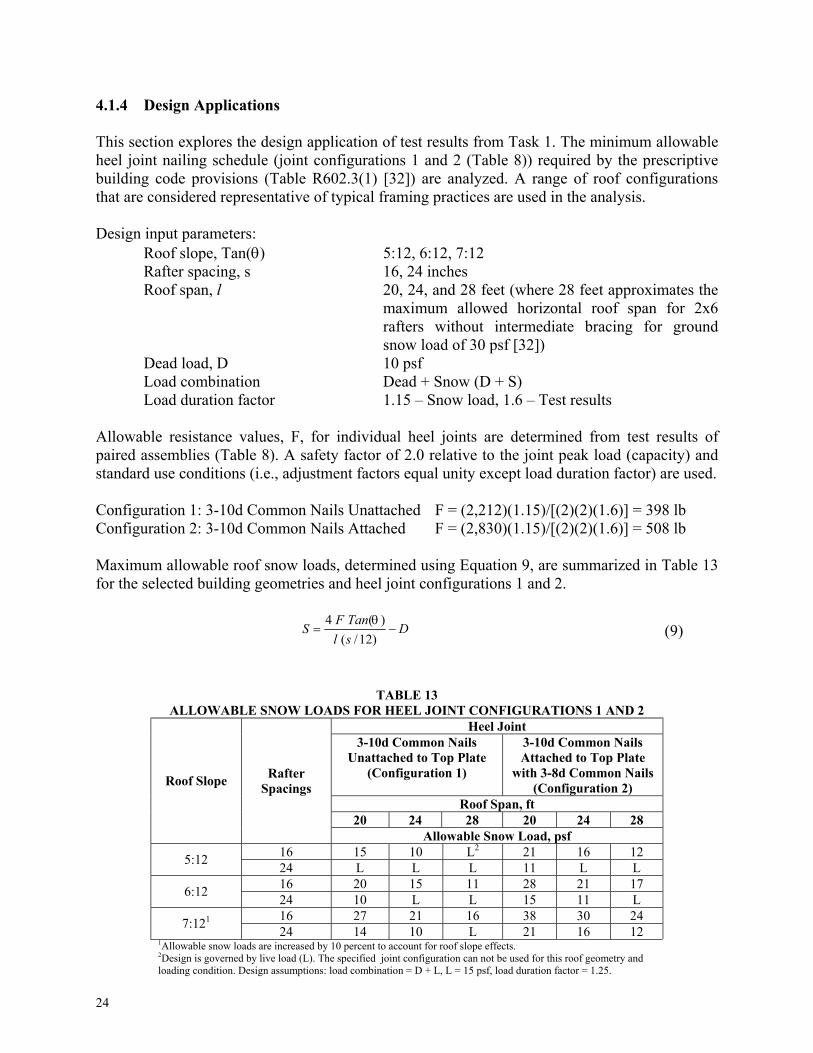
4.1.4 Design Applications This section explores the design application of test results from Task 1. The minimum allowable heel joint nailing schedule (joint configurations 1 and 2 (Table 8)) required by the prescriptive building code provisions (Table R602.3(1) [32]) are analyzed. A range of roof configurations that are considered representative of typical framing practices are used in the analysis. Design input parameters: Roof slope, Tan(θ) 5:12, 6:12, 7:12 Rafter spacing, s 16, 24 inches
Roof span, l 20, 24, and 28 feet (where 28 feet approximates the maximum allowed horizontal roof span for 2x6 rafters without intermediate bracing for ground snow load of 30 psf [32])
Dead load, D 10 psf Load combination Dead + Snow (D + S)
Load duration factor 1.15 – Snow load, 1.6 – Test results Allowable resistance values, F, for individual heel joints are determined from test results of paired assemblies (Table 8). A safety factor of 2.0 relative to the joint peak load (capacity) and standard use conditions (i.e., adjustment factors equal unity except load duration factor) are used. Configuration 1: 3-10d Common Nails Unattached F = (2,212)(1.15)/[(2)(2)(1.6)] = 398 lb Configuration 2: 3-10d Common Nails Attached F = (2,830)(1.15)/[(2)(2)(1.6)] = 508 lb Maximum allowable roof snow loads, determined using Equation 9, are summarized in Table 13 for the selected building geometries and heel joint configurations 1 and 2.
DslTanF
S −=)12/(
)(4 θ (9)
TABLE 13 ALLOWABLE SNOW LOADS FOR HEEL JOINT CONFIGURATIONS 1 AND 2
Heel Joint 3-10d Common Nails
Unattached to Top Plate (Configuration 1)
3-10d Common Nails Attached to Top Plate
with 3-8d Common Nails (Configuration 2)
Roof Span, ft 20 24 28 20 24 28
Roof Slope Rafter Spacings
Allowable Snow Load, psf 16 15 10 L2 21 16 12 5:12 24 L L L 11 L L 16 20 15 11 28 21 17 6:12 24 10 L L 15 11 L 16 27 21 16 38 30 24 7:121 24 14 10 L 21 16 12
1Allowable snow loads are increased by 10 percent to account for roof slope effects. 2Design is governed by live load (L). The specified joint configuration can not be used for this roof geometry and loading condition. Design assumptions: load combination = D + L, L = 15 psf, load duration factor = 1.25.
24
Table 13 indicates that the use of the minimum prescriptive heel joint nailing schedules should be limited to specific geographic areas and building geometries. For example, the heel joint with 3-10d common face-nails and frame members attached to the wall top plate with 3-8d common toe-nails used with rafters spaced 24 inches on center, 6:12 roof slope, and 24-foot roof span should be used only in the areas with ground snow loads of 10 psf or less. These areas generally include the southern United States unless higher snow loads are required due to local climatic conditions or high elevations. The same joint configuration used with rafters spaced 16 inches on center, 7:12 roof slope, and roof span of 24 feet can be constructed in the areas with ground snow loads up to 30 psf. This snow load exceeds or meets the design requirements for the majority of the United States with the exception of the northern states and high elevation regions. If the specified attachment of the rafter and ceiling joist to the top plate is not provided, the maximum allowable roof span should be reduced as specified for configuration 1 in Table 13. The allowable design values included a reduction for short-term duration of the tests relative to the design load duration (2 months for snow load, and seven days for construction load) as required by the NDS [1]. This reduction was originally adopted into the provisions for analysis of wood connections from the methodologies developed for design of solid-sawn lumber under bending and axial loading. However, the applicability of load duration effects observed in solid wood members was not directly validated for wood connections. If the load duration factor is excluded from the analysis, the allowable ground snow loads reported in Table 13 can be increased accordingly. 4.1.5 Conclusions 1. Peak load for heel joints assembled with 3-10d common and 3-16d pneumatic nails exhibited
only a marginal difference for both attached (2,830 lb vs. 2,698 lb) and unattached (2,212 lb vs. 2,277 lb) configurations (Table 8).
2. Attachment of the heel joint to the wall top plate with toe-nails improved the heel joint
resistance. Three 8d common toe-nails increased average heel joint capacity by 309 lb, whereas three 16d pneumatic toe-nails increased average heel joint capacity by 210 lb (Table 8). The contribution of three 8d common toe-nails to heel joint resistance exceeded the yield theory predictions, whereas that for three 16d pneumatic nails was consistent with the yield theory (Table A3).
3. The performance of pneumatic nails is improved relative to common nails as shown by an
increases in the average safety margin (Table 12). This effect is primarily attributed to the nail polymer coating that adheres nail surface to surrounding wood. Further research is needed to measure the long-term performance of the coatings to permit the use of the improved friction between nail and wood for design applications.
4. The observed failure modes often had characteristics attributed to yield modes IIIm and IV
including partial development of a plastic hinge and rotation of the nail tip in the main member of the connection (Figure 7 and Table 9). The development of this transition failure mode was due to the asymmetry of the nailed heel joint created by the nail head fixity effect in the side member of the connection.
25

5. The NDS allowable design load showed a poor correlation with the experimental 0.015-inch slip limit values for multiple nail connections (Table 10).
6. Use of 5 percent nail diameter offset yield load results in an arbitrary design limit that
provides an inconsistent safety margin relative to the connection failure (Table 9). Moreover, the 5 percent dowel diameter offset rule for determination of the yield point is ambiguous for application to nail connections and it introduces a systematic bias in the interpretation of the test results (Figure 9).
7. The NDS yield equations, using ultimate dowel bearing and ultimate nail bending values,
provided conservative estimates of the lateral capacity by a consistent margin of about 20 percent for common nails and 30 percent for pneumatic nails (Table 11). Because the observed response modes for the tested nailed connections generally agreed with the assumptions of the yield theory, this level of accuracy is sufficient for engineering design applications. Where improved accuracy is required, the contribution of secondary effects such friction and nail head fixity must be included.
8. Use of yield equations to predict ultimate capacity resulted in less variability relative to the
primary design limit state related to safety (i.e., failure). The COV of the average ratio in Table 11 is lower (0.08) than the COV of the average ratio in Tables 9 (0.13) and 10 (0.10), suggesting a greater consistency in the capacity-based calculations.
9. The safety margin, measured as a ratio of the NDS allowable value to the average ultimate
load, was in the range between 2.3 and 2.4 for common nails and between 2.7 and 3.0 for pneumatic nails (Table 12). It is recommended that conventional construction requirements for heel joints specified in current building codes be reevaluated based on the findings of this study using joint capacity as the design basis and a minimum safety factor of 2.0.
10. The prescriptive nailing provisions of using three 10d common nails (or equivalent) for
construction of conventional heel joints should be limited by building geometry and loading condition as illustrated in Table 13. Alternatively, additional fastening should be required by analysis considering above recommendations.
26
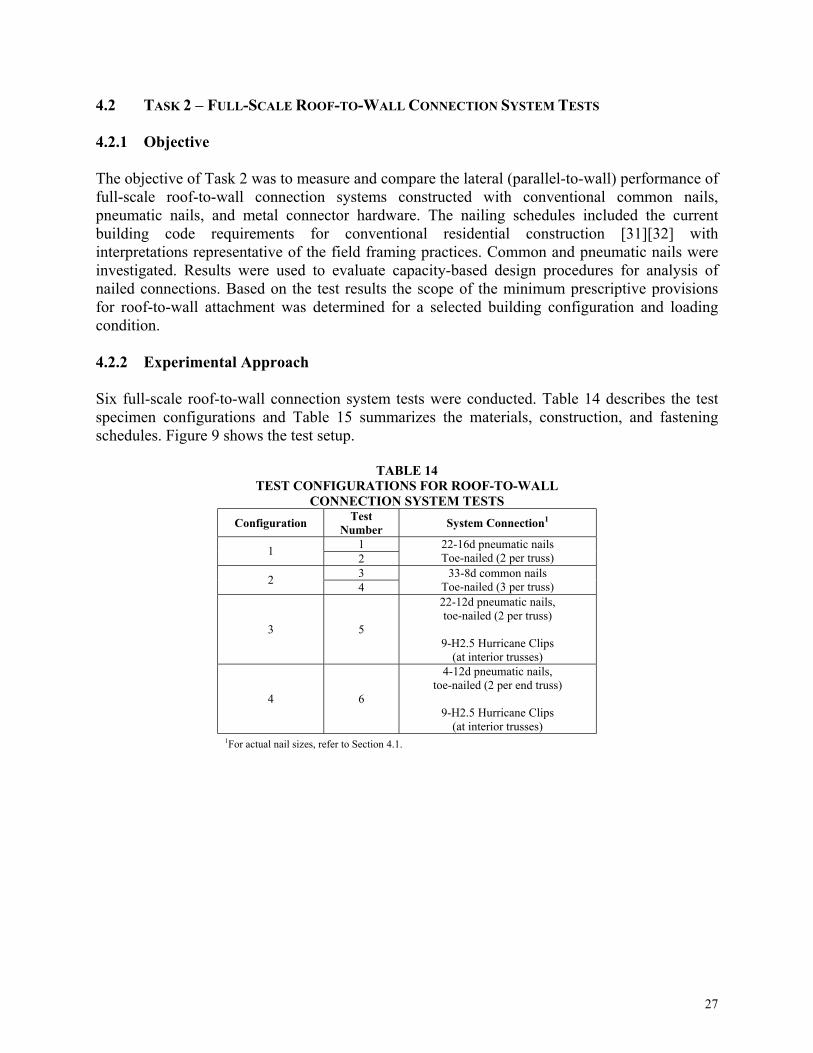
4.2 TASK 2 – FULL-SCALE ROOF-TO-WALL CONNECTION SYSTEM TESTS 4.2.1 Objective The objective of Task 2 was to measure and compare the lateral (parallel-to-wall) performance of full-scale roof-to-wall connection systems constructed with conventional common nails, pneumatic nails, and metal connector hardware. The nailing schedules included the current building code requirements for conventional residential construction [31][32] with interpretations representative of the field framing practices. Common and pneumatic nails were investigated. Results were used to evaluate capacity-based design procedures for analysis of nailed connections. Based on the test results the scope of the minimum prescriptive provisions for roof-to-wall attachment was determined for a selected building configuration and loading condition. 4.2.2 Experimental Approach Six full-scale roof-to-wall connection system tests were conducted. Table 14 describes the test specimen configurations and Table 15 summarizes the materials, construction, and fastening schedules. Figure 9 shows the test setup.
TABLE 14 TEST CONFIGURATIONS FOR ROOF-TO-WALL
CONNECTION SYSTEM TESTS Configuration Test
Number System Connection1
1 1 2 22-16d pneumatic nails Toe-nailed (2 per truss)
3 2 4 33-8d common nails
Toe-nailed (3 per truss)
3 5
22-12d pneumatic nails, toe-nailed (2 per truss)
9-H2.5 Hurricane Clips
(at interior trusses)
4 6
4-12d pneumatic nails, toe-nailed (2 per end truss)
9-H2.5 Hurricane Clips
(at interior trusses) 1For actual nail sizes, refer to Section 4.1.
27
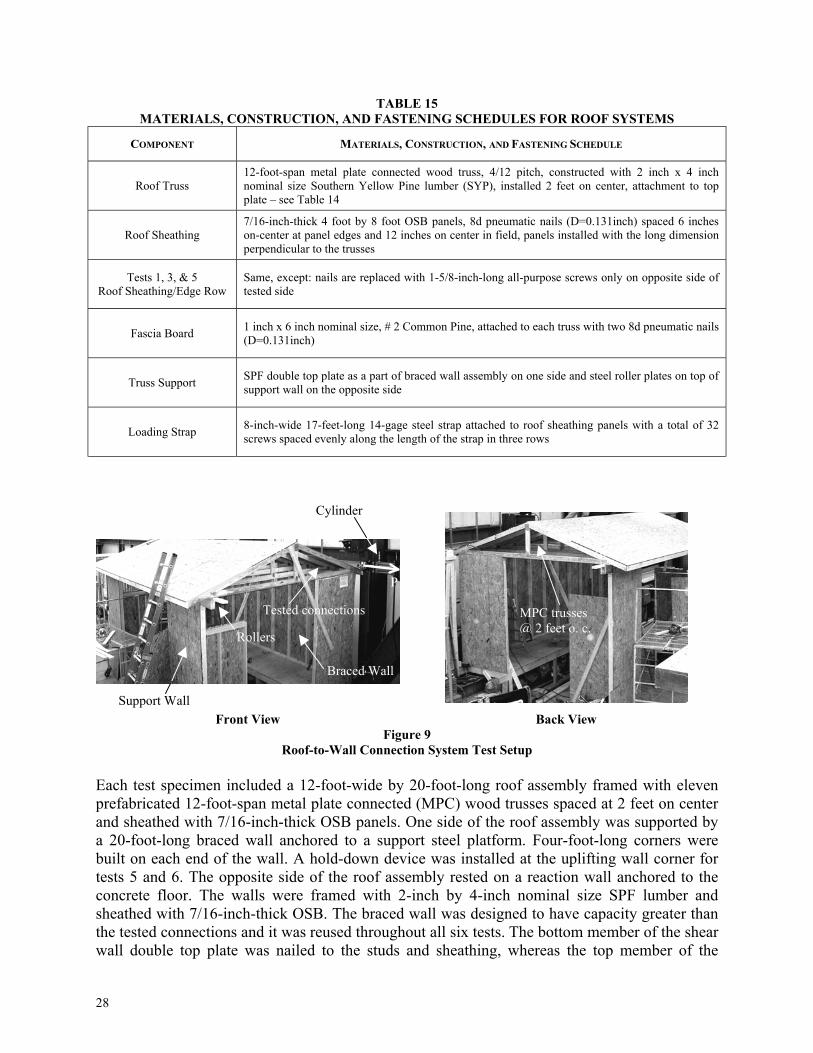
TABLE 15 MATERIALS, CONSTRUCTION, AND FASTENING SCHEDULES FOR ROOF SYSTEMS
COMPONENT MATERIALS, CONSTRUCTION, AND FASTENING SCHEDULE
Roof Truss 12-foot-span metal plate connected wood truss, 4/12 pitch, constructed with 2 inch x 4 inch nominal size Southern Yellow Pine lumber (SYP), installed 2 feet on center, attachment to top plate – see Table 14
Roof Sheathing 7/16-inch-thick 4 foot by 8 foot OSB panels, 8d pneumatic nails (D=0.131inch) spaced 6 inches on-center at panel edges and 12 inches on center in field, panels installed with the long dimension perpendicular to the trusses
Tests 1, 3, & 5 Roof Sheathing/Edge Row
Same, except: nails are replaced with 1-5/8-inch-long all-purpose screws only on opposite side of tested side
Fascia Board 1 inch x 6 inch nominal size, # 2 Common Pine, attached to each truss with two 8d pneumatic nails (D=0.131inch)
Truss Support SPF double top plate as a part of braced wall assembly on one side and steel roller plates on top of support wall on the opposite side
Loading Strap 8-inch-wide 17-feet-long 14-gage steel strap attached to roof sheathing panels with a total of 32 screws spaced evenly along the length of the strap in three rows
Front View Back View Figure 9
Roof-to-Wall Connection System Test Setup
Cylinder
MPC trusses @ 2 feet o. c.
Tested connections
Rollers
P
Support Wall
Braced Wall
Each test specimen included a 12-foot-wide by 20-foot-long roof assembly framed with eleven prefabricated 12-foot-span metal plate connected (MPC) wood trusses spaced at 2 feet on center and sheathed with 7/16-inch-thick OSB panels. One side of the roof assembly was supported by a 20-foot-long braced wall anchored to a support steel platform. Four-foot-long corners were built on each end of the wall. A hold-down device was installed at the uplifting wall corner for tests 5 and 6. The opposite side of the roof assembly rested on a reaction wall anchored to the concrete floor. The walls were framed with 2-inch by 4-inch nominal size SPF lumber and sheathed with 7/16-inch-thick OSB. The braced wall was designed to have capacity greater than the tested connections and it was reused throughout all six tests. The bottom member of the shear wall double top plate was nailed to the studs and sheathing, whereas the top member of the
28
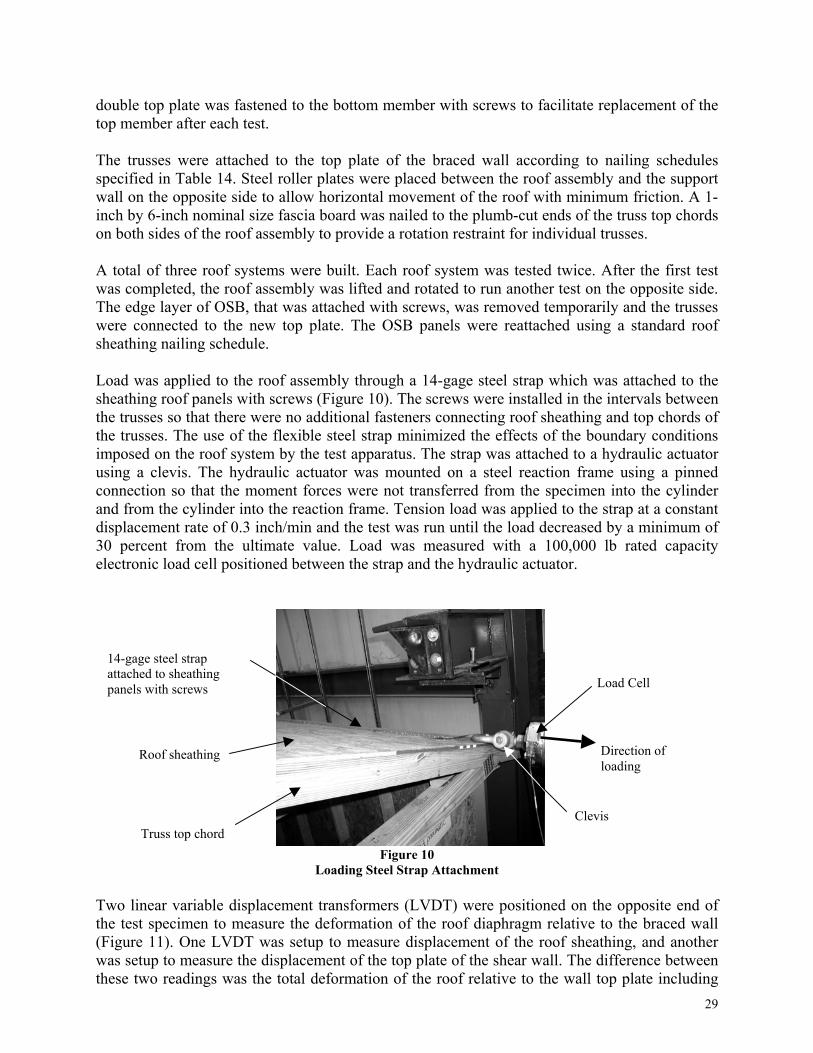
double top plate was fastened to the bottom member with screws to facilitate replacement of the top member after each test. The trusses were attached to the top plate of the braced wall according to nailing schedules specified in Table 14. Steel roller plates were placed between the roof assembly and the support wall on the opposite side to allow horizontal movement of the roof with minimum friction. A 1-inch by 6-inch nominal size fascia board was nailed to the plumb-cut ends of the truss top chords on both sides of the roof assembly to provide a rotation restraint for individual trusses. A total of three roof systems were built. Each roof system was tested twice. After the first test was completed, the roof assembly was lifted and rotated to run another test on the opposite side. The edge layer of OSB, that was attached with screws, was removed temporarily and the trusses were connected to the new top plate. The OSB panels were reattached using a standard roof sheathing nailing schedule. Load was applied to the roof assembly through a 14-gage steel strap which was attached to the sheathing roof panels with screws (Figure 10). The screws were installed in the intervals between the trusses so that there were no additional fasteners connecting roof sheathing and top chords of the trusses. The use of the flexible steel strap minimized the effects of the boundary conditions imposed on the roof system by the test apparatus. The strap was attached to a hydraulic actuator using a clevis. The hydraulic actuator was mounted on a steel reaction frame using a pinned connection so that the moment forces were not transferred from the specimen into the cylinder and from the cylinder into the reaction frame. Tension load was applied to the strap at a constant displacement rate of 0.3 inch/min and the test was run until the load decreased by a minimum of 30 percent from the ultimate value. Load was measured with a 100,000 lb rated capacity electronic load cell positioned between the strap and the hydraulic actuator.
Figure 10 Loading Steel Strap Attachment
14-gage steel strap attached to sheathing panels with screws Load Cell
Direction of loading
Clevis
Roof sheathing
Truss top chord
Two linear variable displacement transformers (LVDT) were positioned on the opposite end of the test specimen to measure the deformation of the roof diaphragm relative to the braced wall (Figure 11). One LVDT was setup to measure displacement of the roof sheathing, and another was setup to measure the displacement of the top plate of the shear wall. The difference between these two readings was the total deformation of the roof relative to the wall top plate including 29
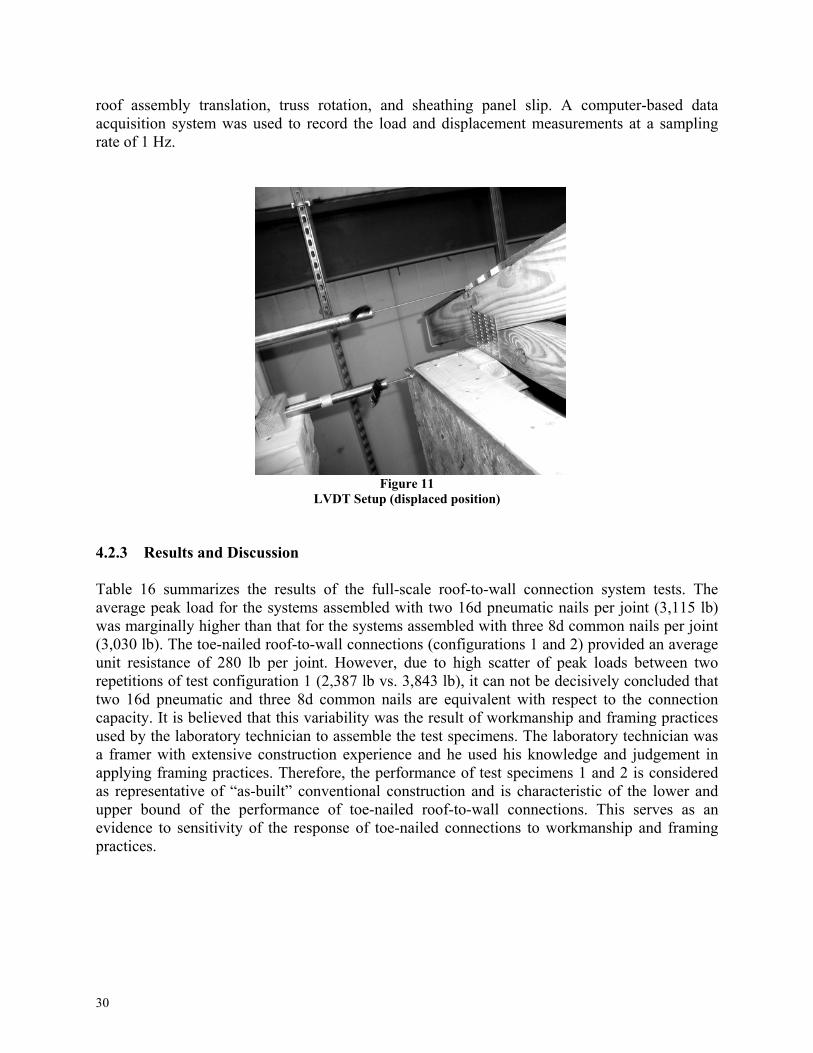
roof assembly translation, truss rotation, and sheathing panel slip. A computer-based data acquisition system was used to record the load and displacement measurements at a sampling rate of 1 Hz.
Figure 11 LVDT Setup (displaced position)
4.2.3 Results and Discussion Table 16 summarizes the results of the full-scale roof-to-wall connection system tests. The average peak load for the systems assembled with two 16d pneumatic nails per joint (3,115 lb) was marginally higher than that for the systems assembled with three 8d common nails per joint (3,030 lb). The toe-nailed roof-to-wall connections (configurations 1 and 2) provided an average unit resistance of 280 lb per joint. However, due to high scatter of peak loads between two repetitions of test configuration 1 (2,387 lb vs. 3,843 lb), it can not be decisively concluded that two 16d pneumatic and three 8d common nails are equivalent with respect to the connection capacity. It is believed that this variability was the result of workmanship and framing practices used by the laboratory technician to assemble the test specimens. The laboratory technician was a framer with extensive construction experience and he used his knowledge and judgement in applying framing practices. Therefore, the performance of test specimens 1 and 2 is considered as representative of “as-built” conventional construction and is characteristic of the lower and upper bound of the performance of toe-nailed roof-to-wall connections. This serves as an evidence to sensitivity of the response of toe-nailed connections to workmanship and framing practices.
30
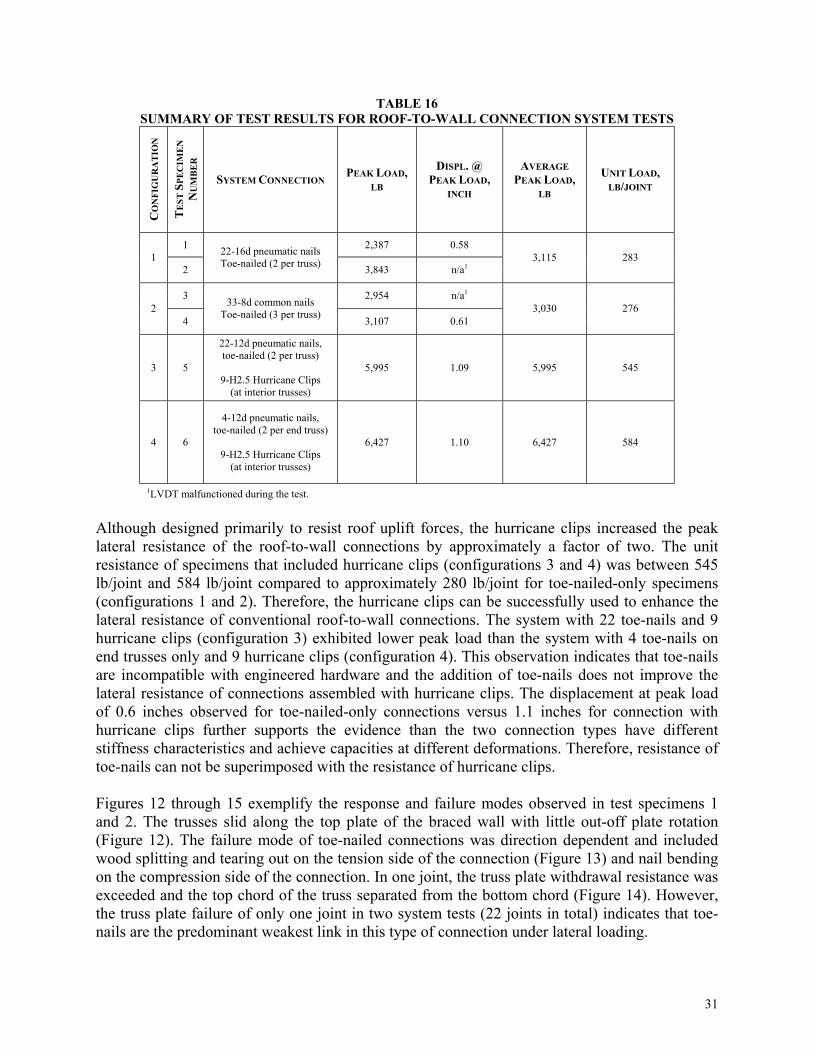
TABLE 16 SUMMARY OF TEST RESULTS FOR ROOF-TO-WALL CONNECTION SYSTEM TESTS
CO
NFI
GU
RA
TIO
N
TE
ST S
PEC
IME
N
NU
MB
ER
SYSTEM CONNECTION PEAK LOAD,
LB
DISPL. @ PEAK LOAD,
INCH
AVERAGE PEAK LOAD,
LB
UNIT LOAD, LB/JOINT
1 2,387 0.58 1
2
22-16d pneumatic nails Toe-nailed (2 per truss) 3,843 n/a1
3,115 283
3 2,954 n/a1 2
4
33-8d common nails Toe-nailed (3 per truss) 3,107 0.61
3,030 276
3 5
22-12d pneumatic nails, toe-nailed (2 per truss)
9-H2.5 Hurricane Clips
(at interior trusses)
5,995 1.09 5,995 545
4 6
4-12d pneumatic nails, toe-nailed (2 per end truss)
9-H2.5 Hurricane Clips
(at interior trusses)
6,427 1.10 6,427 584
1LVDT malfunctioned during the test. Although designed primarily to resist roof uplift forces, the hurricane clips increased the peak lateral resistance of the roof-to-wall connections by approximately a factor of two. The unit resistance of specimens that included hurricane clips (configurations 3 and 4) was between 545 lb/joint and 584 lb/joint compared to approximately 280 lb/joint for toe-nailed-only specimens (configurations 1 and 2). Therefore, the hurricane clips can be successfully used to enhance the lateral resistance of conventional roof-to-wall connections. The system with 22 toe-nails and 9 hurricane clips (configuration 3) exhibited lower peak load than the system with 4 toe-nails on end trusses only and 9 hurricane clips (configuration 4). This observation indicates that toe-nails are incompatible with engineered hardware and the addition of toe-nails does not improve the lateral resistance of connections assembled with hurricane clips. The displacement at peak load of 0.6 inches observed for toe-nailed-only connections versus 1.1 inches for connection with hurricane clips further supports the evidence than the two connection types have different stiffness characteristics and achieve capacities at different deformations. Therefore, resistance of toe-nails can not be superimposed with the resistance of hurricane clips. Figures 12 through 15 exemplify the response and failure modes observed in test specimens 1 and 2. The trusses slid along the top plate of the braced wall with little out-off plate rotation (Figure 12). The failure mode of toe-nailed connections was direction dependent and included wood splitting and tearing out on the tension side of the connection (Figure 13) and nail bending on the compression side of the connection. In one joint, the truss plate withdrawal resistance was exceeded and the top chord of the truss separated from the bottom chord (Figure 14). However, the truss plate failure of only one joint in two system tests (22 joints in total) indicates that toe-nails are the predominant weakest link in this type of connection under lateral loading.
31
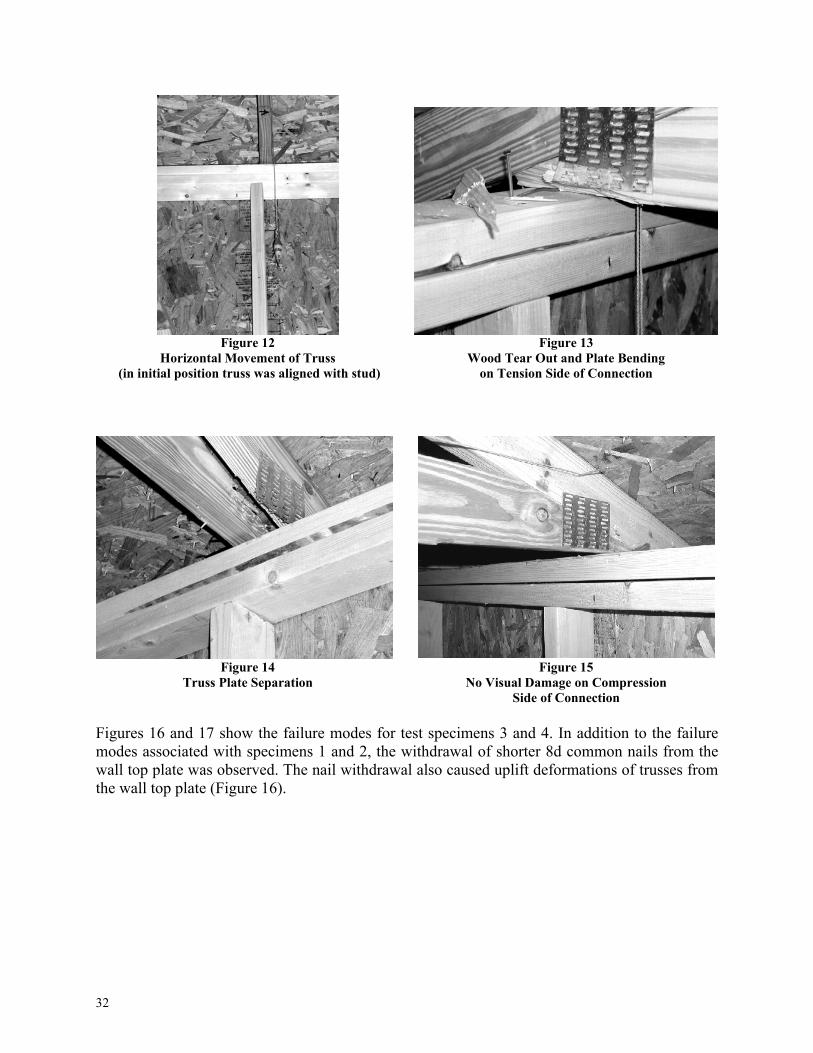
Figure 12
Horizontal Movement of Truss (in initial position truss was aligned with stud)
Figure 13 Wood Tear Out and Plate Bending
on Tension Side of Connection
Figure 14
Truss Plate Separation Figure 15
No Visual Damage on Compression Side of Connection
Figures 16 and 17 show the failure modes for test specimens 3 and 4. In addition to the failure modes associated with specimens 1 and 2, the withdrawal of shorter 8d common nails from the wall top plate was observed. The nail withdrawal also caused uplift deformations of trusses from the wall top plate (Figure 16).
32
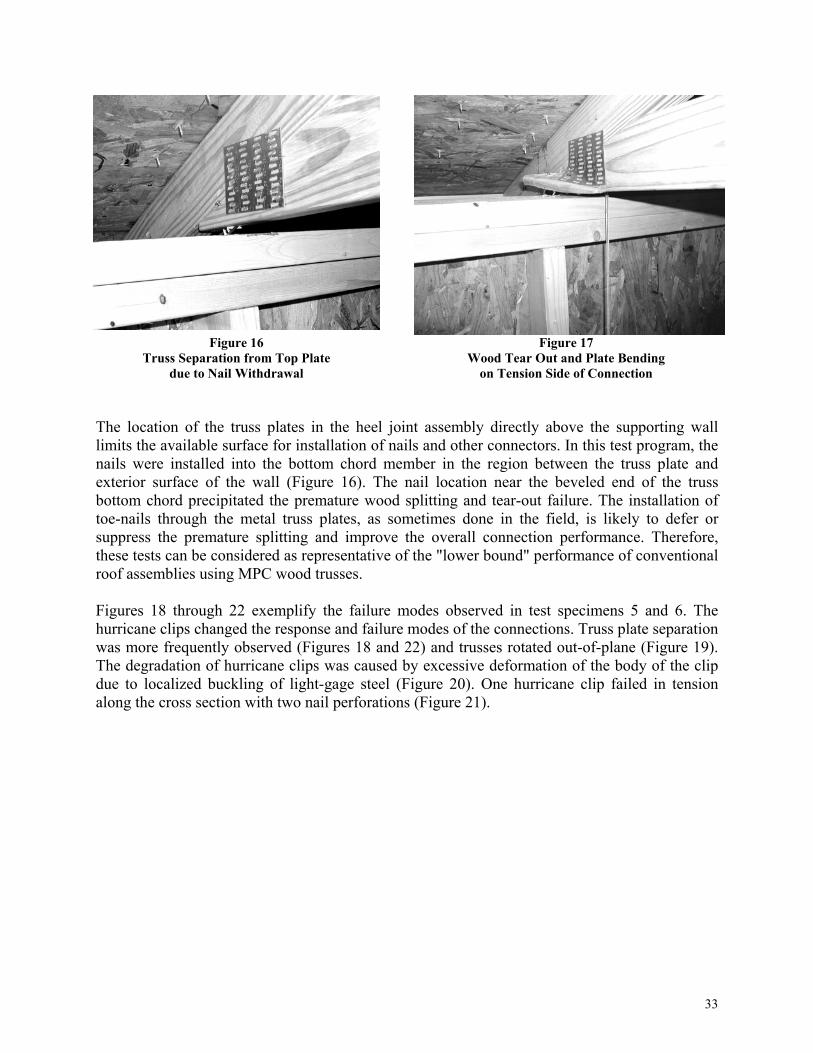
Figure 16
Truss Separation from Top Plate due to Nail Withdrawal
Figure 17 Wood Tear Out and Plate Bending
on Tension Side of Connection The location of the truss plates in the heel joint assembly directly above the supporting wall limits the available surface for installation of nails and other connectors. In this test program, the nails were installed into the bottom chord member in the region between the truss plate and exterior surface of the wall (Figure 16). The nail location near the beveled end of the truss bottom chord precipitated the premature wood splitting and tear-out failure. The installation of toe-nails through the metal truss plates, as sometimes done in the field, is likely to defer or suppress the premature splitting and improve the overall connection performance. Therefore, these tests can be considered as representative of the "lower bound" performance of conventional roof assemblies using MPC wood trusses. Figures 18 through 22 exemplify the failure modes observed in test specimens 5 and 6. The hurricane clips changed the response and failure modes of the connections. Truss plate separation was more frequently observed (Figures 18 and 22) and trusses rotated out-of-plane (Figure 19). The degradation of hurricane clips was caused by excessive deformation of the body of the clip due to localized buckling of light-gage steel (Figure 20). One hurricane clip failed in tension along the cross section with two nail perforations (Figure 21).
33
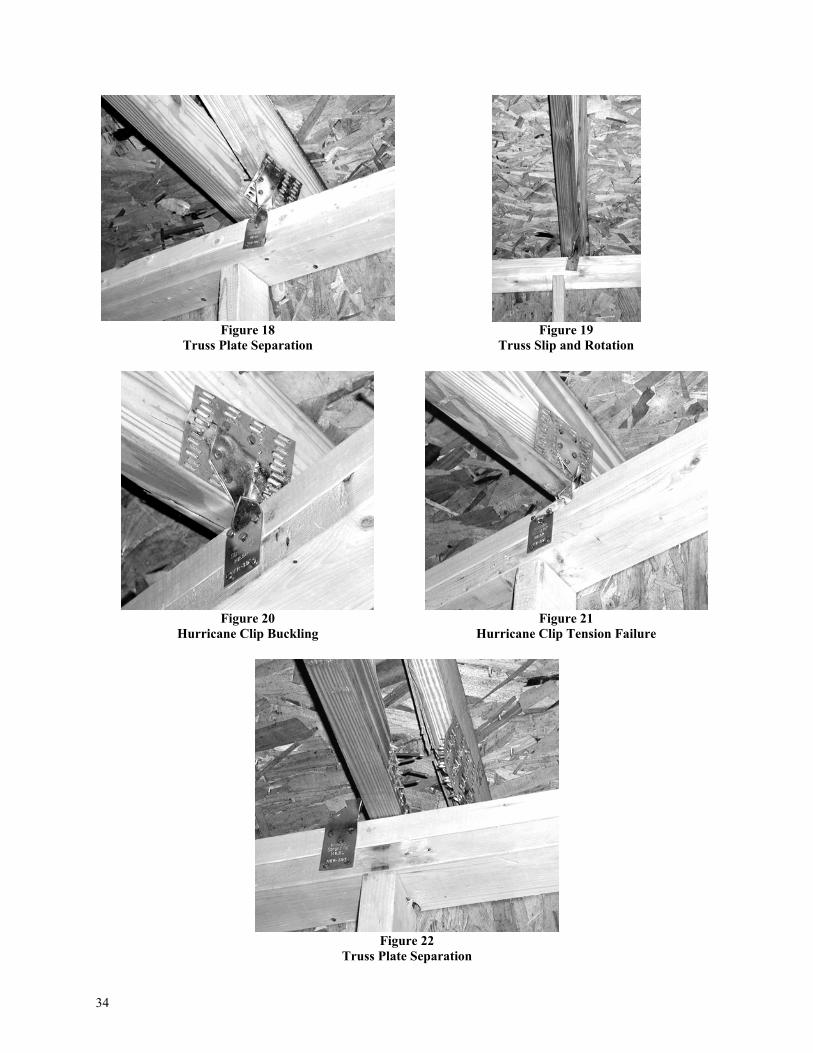
Figure 18
Truss Plate Separation Figure 19
Truss Slip and Rotation
Figure 20
Hurricane Clip Buckling Figure 21
Hurricane Clip Tension Failure
Figure 22
Truss Plate Separation 34
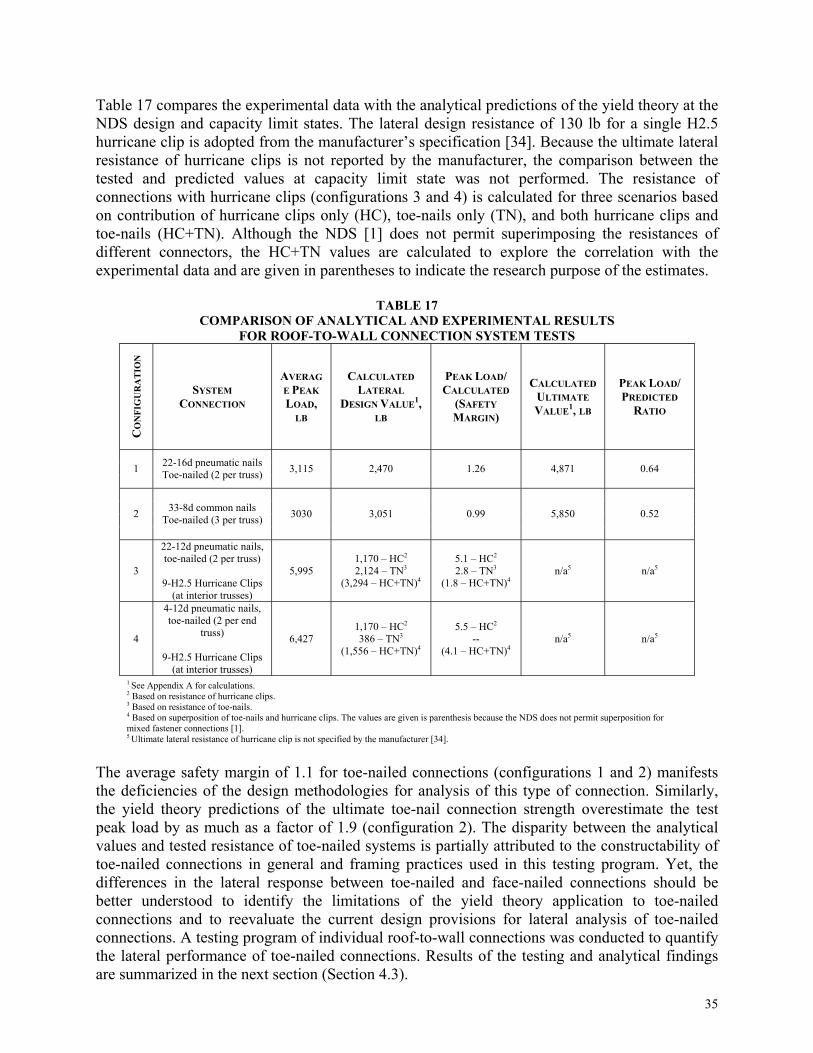
Table 17 compares the experimental data with the analytical predictions of the yield theory at the NDS design and capacity limit states. The lateral design resistance of 130 lb for a single H2.5 hurricane clip is adopted from the manufacturer’s specification [34]. Because the ultimate lateral resistance of hurricane clips is not reported by the manufacturer, the comparison between the tested and predicted values at capacity limit state was not performed. The resistance of connections with hurricane clips (configurations 3 and 4) is calculated for three scenarios based on contribution of hurricane clips only (HC), toe-nails only (TN), and both hurricane clips and toe-nails (HC+TN). Although the NDS [1] does not permit superimposing the resistances of different connectors, the HC+TN values are calculated to explore the correlation with the experimental data and are given in parentheses to indicate the research purpose of the estimates.
TABLE 17 COMPARISON OF ANALYTICAL AND EXPERIMENTAL RESULTS
FOR ROOF-TO-WALL CONNECTION SYSTEM TESTS
CO
NFI
GU
RA
TIO
N
SYSTEM CONNECTION
AVERAGE PEAK LOAD,
LB
CALCULATED LATERAL
DESIGN VALUE1, LB
PEAK LOAD/ CALCULATED
(SAFETY MARGIN)
CALCULATED ULTIMATE VALUE1, LB
PEAK LOAD/ PREDICTED
RATIO
1 22-16d pneumatic nails Toe-nailed (2 per truss) 3,115 2,470 1.26 4,871 0.64
2 33-8d common nails Toe-nailed (3 per truss) 3030 3,051 0.99 5,850 0.52
3
22-12d pneumatic nails, toe-nailed (2 per truss)
9-H2.5 Hurricane Clips
(at interior trusses)
5,995 1,170 – HC2 2,124 – TN3
(3,294 – HC+TN)4
5.1 – HC2 2.8 – TN3
(1.8 – HC+TN)4 n/a5 n/a5
4
4-12d pneumatic nails, toe-nailed (2 per end
truss)
9-H2.5 Hurricane Clips (at interior trusses)
6,427 1,170 – HC2 386 – TN3
(1,556 – HC+TN)4
5.5 – HC2 --
(4.1 – HC+TN)4 n/a5 n/a5
1 See Appendix A for calculations. 2 Based on resistance of hurricane clips. 3 Based on resistance of toe-nails. 4 Based on superposition of toe-nails and hurricane clips. The values are given is parenthesis because the NDS does not permit superposition for mixed fastener connections [1]. 5 Ultimate lateral resistance of hurricane clip is not specified by the manufacturer [34].
The average safety margin of 1.1 for toe-nailed connections (configurations 1 and 2) manifests the deficiencies of the design methodologies for analysis of this type of connection. Similarly, the yield theory predictions of the ultimate toe-nail connection strength overestimate the test peak load by as much as a factor of 1.9 (configuration 2). The disparity between the analytical values and tested resistance of toe-nailed systems is partially attributed to the constructability of toe-nailed connections in general and framing practices used in this testing program. Yet, the differences in the lateral response between toe-nailed and face-nailed connections should be better understood to identify the limitations of the yield theory application to toe-nailed connections and to reevaluate the current design provisions for lateral analysis of toe-nailed connections. A testing program of individual roof-to-wall connections was conducted to quantify the lateral performance of toe-nailed connections. Results of the testing and analytical findings are summarized in the next section (Section 4.3). 35
The calculated lateral design values for test configuration 3 (Table 17) expose the inconsistencies in using the joint slip limit state for establishing characteristic connection properties. According to the current design provisions, the lateral design resistance of the toe-nailed connections is greater than that of hurricane clips for roof configuration 3 by as much as a factor of 1.8. Given this design value, the engineer is more likely to specify toe-nailed connections for the roof-to-wall lateral load path. The lack of information available to the engineer on the correlation of the design properties and the connection capacities creates a perception that the toe-nailed connections provide a better degree of safety relative to failure. However, results of these tests demonstrate a contrary trend with the hurricane clips providing as much as twice of the toe-nail lateral resistance. The safety margin of 5.1-5.5 for the hurricane clip connections is excessive. The allowable design value for the hurricane clip adopted from the manufacturer’s specifications are established based on a joint slip limit state. This direct implementation of design methods developed for single dowel connections to light-gage steel hardware connections, which exhibit different response and unique failure modes, results in ambiguous design values and an arbitrary design basis with respect to the performance levels of the hardware systems. Based on this limited testing, the allowable lateral resistance of hurricane clips in the direction parallel to wall can be increased from 130 lb to 260 lb per clip. 4.2.4 Design Applications This section explores the design application of test results from Task 2. A simplified seismic analysis is performed to design a roof diaphragm-to-shear wall connection using the tested joint configurations. For a selected roof configuration, seismic design categories are assigned to the conventional toe-nailed and engineered connections. Design input parameters: Truss span 36 feet
Truss spacing 24 inches Dead load 15 psf
Load combination 0.7E Response modification factor (assumed) R = 5
Overstrength factor (assumed) Ω = 3 Vertical load distribution factor for simplified design procedure ψ = 1.2 Unit seismic weight per joint: (15)(36/2)(24/12) = 540 lb Allowable resistance values, F, for individual roof-to-wall connections are determined from test results (Table 16). A safety factor of 2.0 relative to the joint peak load (capacity) and standard use conditions (i.e., adjustment factors equal unity) are used. Configuration 1: 2-16d Pneumatic Nails F = 283 / 2 = 141 lb/joint Configuration 2: 3-8d Common Nails F = 276 / 2 = 138 lb/joint Configuration 4: H2.5 Hurricane Clip F = 584 / 2 = 292 lb/joint
36
Maximum 0.2 sec design spectral response acceleration, SDS, is calculated as follows: Configurations 1 and 2: SDS = (140)(5)/[(0.7)(1.2)(540)(3)] = 0.51g Configuration 4: SDS = (292)(5)/[(0.7)(1.2)(540)(3)] = 1.1 g Based on these findings, the conventional toe-nailed connection schedule is generally sufficient to provide the shear load transfer for seismic design categories A, B, and C with SDS<0.5 (refer to Table R301.2.2.1.1 [32] for classification of seismic design categories). In the areas of moderate to high seismicity (i.e., West Coast, New Madrid, and Charleston areas) with assigned seismic design categories D1 (SDS<0.83g) or D2 (SDS<1.17), shear transfer can be provided with hurricane clips. For seismic design category E (SDS>1.17g), which includes the near-fault regions, additional measures such as blocking and increased fastening schedule should be implemented. These recommendations are valid for the specified building configuration. The fastening requirements can be relaxed for lighter roofs and smaller roof spans, or become more stringent for heavier roofs and longer spans. Moreover, the default soil type for this classification of seismic design categories is based on site class D. The connection requirements can be further adjusted for other site class categories. This example is intended to provide prescriptive design recommendations applicable to a variety of building configurations. Therefore, design assumptions (i.e., R-factor, Ω-parameter, safety factor) are selected to provide conservative fastening schedules for the majority of houses. If the roof-to-wall connections are analyzed as a part of a specific lateral force resisting system (LFRS), as may be done with engineered houses, R-factor and Ω-parameter are used with the resistance of shear walls and diaphragms to determine the maximum potential force demand that can be applied to the connections. Using capacity-based system and component design values, this approach allows for better balancing of the connection capacity relative to other components of the LFRS. In addition, light-frame wood houses generally exhibit a response characteristic of “soft-story” behavior with the weakest link in the first-story shear walls so that the demand on the roof-to-wall connections is typically limited to elastic response. Therefore, the design recommendations provided in this example can be further adjusted and are likely to become less stringent. 4.2.5 Conclusions 1. Conventional toe-nailed roof-to-wall connections assembled with 3-8d common or 2-16d
pneumatic nails per truss provided about 280 lb/joint of capacity for shear loads parallel to the wall in full-scale system tests (Table 16).
2. The primary failure modes for toe-nailed connections included splitting and tear-out of wood,
nail bending, and nail withdrawal (Figures 12-17). The wood splitting and tear-out were caused by reduced end distance between the nails and beveled end of the bottom truss chord. The primary failure modes for joints with hurricane clips included buckling of the body of the clip, separation of metal truss plate, and truss rotation (Figures 18-22).
3. An average safety margin of 1.1 for predicted performance of toe-nailed connections (Table
17) indicate deficiencies in the design methodologies. This effect is partially attributed to the
37
connection failure modes (i.e., wood splitting and tear-out) that preceded more ductile failure modes associated with the yield theory.
4. Use of light-gage steel hurricane clips doubled the shear transfer capacity of the system to
about 560 lb/joint (Table 16) without use of blocking between the trusses. 5. The resistances of toe-nails and hurricane clips can not be superimposed due to different
stiffness characteristics of two connection types (Table 16). 6. Because metal truss plates limit the area available for installation of toe-nails (Figure 16) and
the beveled end of ceiling joist is susceptible to premature splitting (Figure 17), the toe-nailed truss-to-wall connection is not necessarily equivalent to conventional roof-to-wall connections that use roof systems assembled with rafters and joists rather than trusses. Therefore, further research is needed to develop prescriptive connection requirements for MPC trusses consistent with the use of three 8d common toe-nails with conventional roof systems.
7. Using capacity as the design basis, the lateral allowable resistance of hurricane clip H2.5 in
the direction parallel to wall can be doubled relative to the values provided by the clip manufacturer.
8. In moderate- to high-hazard areas of the United States, use of simple roof ties without
additional blocking or detailing can significantly improve the shear transfer through roof diaphragm systems into shear walls in conventional residential construction and engineered wood-frame construction.
4.3 TASK 3 – INDIVIDUAL ROOF-TO-WALL TOE-NAILED CONNECTION TESTS 4.3.1 Objective The objectives of Task 3 were to measure the performance of individual toe-nailed roof-to-wall connections and to evaluate the engineering design methodologies for analysis of toe-nailed connections. Common and pneumatic nails were investigated. The differences in the lateral response between toe-nailed and face-nailed connections and the limitations of the yield theory application to toe-nailed connections were identified. Moreover, potential system effects were investigated through comparison of the results of full-scale (Task 2, Section 4.2) and individual connection tests. 4.3.2 Experimental Approach A series of tests on individual roof-to-wall connections with the nailing schedules adopted from the full-scale testing (Section 4.2) was conducted. Two connections (Table 18) corresponding to specimen configurations 1 and 2 of the full-scale tests (Table 14) were investigated. Figure 23 shows the test setup.
38
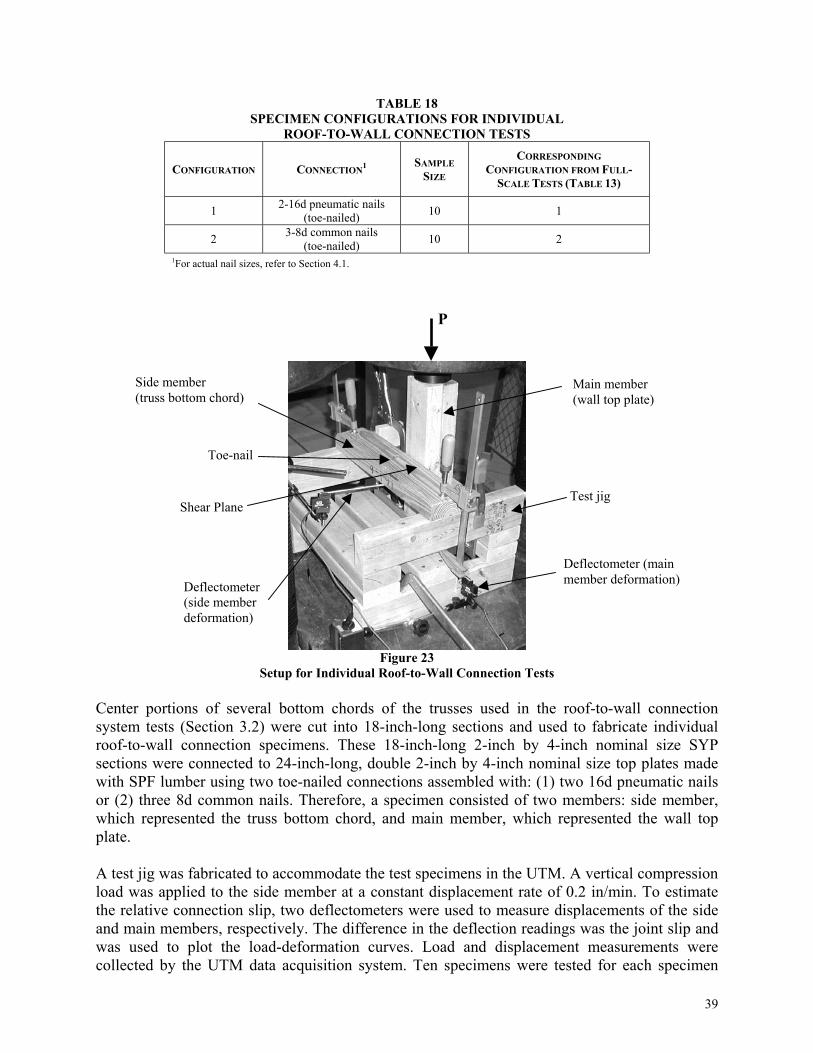
TABLE 18 SPECIMEN CONFIGURATIONS FOR INDIVIDUAL
ROOF-TO-WALL CONNECTION TESTS
CONFIGURATION CONNECTION1 SAMPLE SIZE
CORRESPONDING CONFIGURATION FROM FULL-
SCALE TESTS (TABLE 13)
1 2-16d pneumatic nails (toe-nailed) 10 1
2 3-8d common nails (toe-nailed) 10 2
1For actual nail sizes, refer to Section 4.1.
Figure 23
Setup for Individual Roof-to-Wall Connection Tests
Toe-nail
Shear Plane
Deflectometer (main member deformation) Deflectometer
(side member deformation)
Main member (wall top plate)
Side member (truss bottom chord)
P
Test jig
Center portions of several bottom chords of the trusses used in the roof-to-wall connection system tests (Section 3.2) were cut into 18-inch-long sections and used to fabricate individual roof-to-wall connection specimens. These 18-inch-long 2-inch by 4-inch nominal size SYP sections were connected to 24-inch-long, double 2-inch by 4-inch nominal size top plates made with SPF lumber using two toe-nailed connections assembled with: (1) two 16d pneumatic nails or (2) three 8d common nails. Therefore, a specimen consisted of two members: side member, which represented the truss bottom chord, and main member, which represented the wall top plate. A test jig was fabricated to accommodate the test specimens in the UTM. A vertical compression load was applied to the side member at a constant displacement rate of 0.2 in/min. To estimate the relative connection slip, two deflectometers were used to measure displacements of the side and main members, respectively. The difference in the deflection readings was the joint slip and was used to plot the load-deformation curves. Load and displacement measurements were collected by the UTM data acquisition system. Ten specimens were tested for each specimen
39
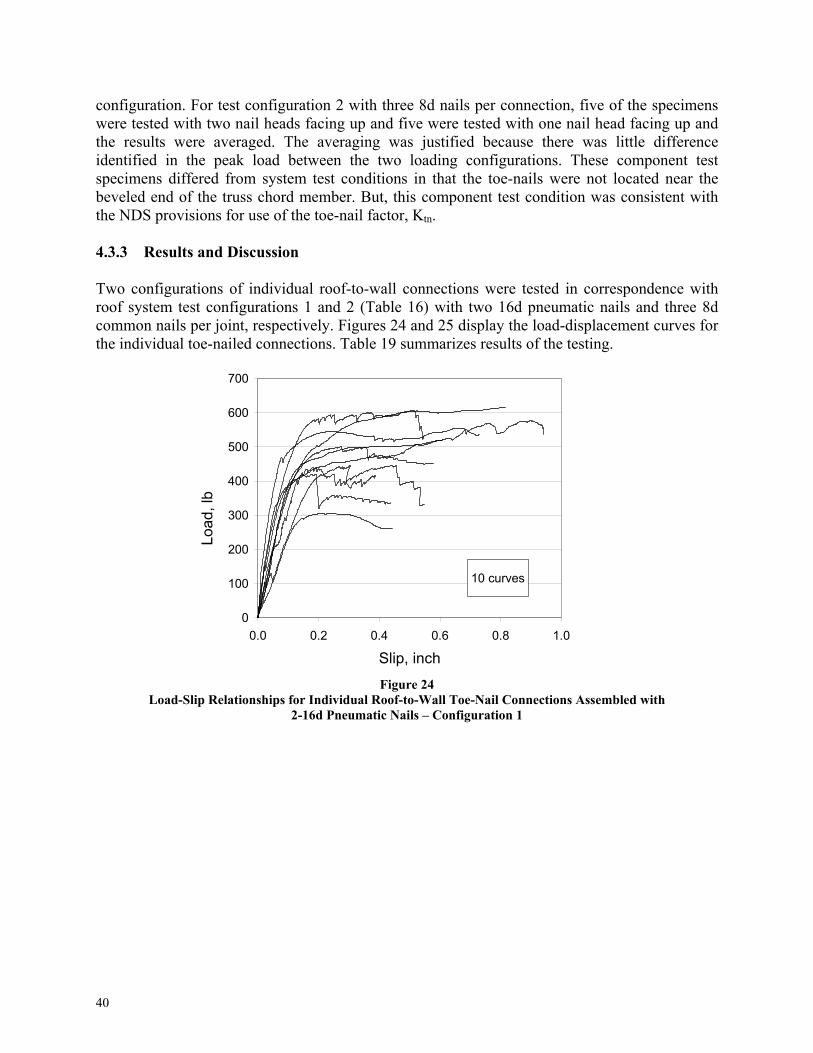
configuration. For test configuration 2 with three 8d nails per connection, five of the specimens were tested with two nail heads facing up and five were tested with one nail head facing up and the results were averaged. The averaging was justified because there was little difference identified in the peak load between the two loading configurations. These component test specimens differed from system test conditions in that the toe-nails were not located near the beveled end of the truss chord member. But, this component test condition was consistent with the NDS provisions for use of the toe-nail factor, Ktn. 4.3.3 Results and Discussion Two configurations of individual roof-to-wall connections were tested in correspondence with roof system test configurations 1 and 2 (Table 16) with two 16d pneumatic nails and three 8d common nails per joint, respectively. Figures 24 and 25 display the load-displacement curves for the individual toe-nailed connections. Table 19 summarizes results of the testing.
0
100
200
300
400
500
600
700
0.0 0.2 0.4 0.6 0.8 1.0
Slip, inch
Load
, lb
10 curves
Figure 24 Load-Slip Relationships for Individual Roof-to-Wall Toe-Nail Connections Assembled with
2-16d Pneumatic Nails – Configuration 1
40
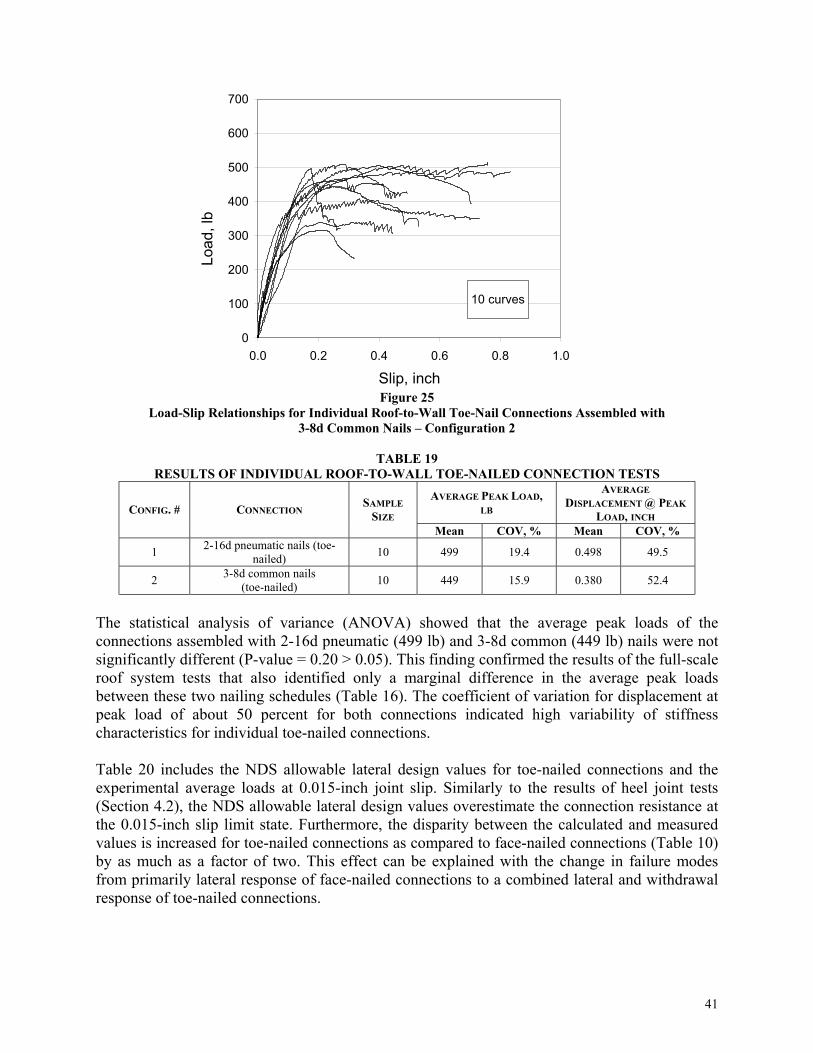
0
100
200
300
400
500
600
700
0.0 0.2 0.4 0.6 0.8 1.0
Slip, inch
Load
, lb
10 curves
Figure 25 Load-Slip Relationships for Individual Roof-to-Wall Toe-Nail Connections Assembled with
3-8d Common Nails – Configuration 2
TABLE 19 RESULTS OF INDIVIDUAL ROOF-TO-WALL TOE-NAILED CONNECTION TESTS
AVERAGE PEAK LOAD, LB
AVERAGE DISPLACEMENT @ PEAK
LOAD, INCH CONFIG. # CONNECTION SAMPLE SIZE
Mean COV, % Mean COV, %
1 2-16d pneumatic nails (toe-nailed) 10 499 19.4 0.498 49.5
2 3-8d common nails (toe-nailed) 10 449 15.9 0.380 52.4
The statistical analysis of variance (ANOVA) showed that the average peak loads of the connections assembled with 2-16d pneumatic (499 lb) and 3-8d common (449 lb) nails were not significantly different (P-value = 0.20 > 0.05). This finding confirmed the results of the full-scale roof system tests that also identified only a marginal difference in the average peak loads between these two nailing schedules (Table 16). The coefficient of variation for displacement at peak load of about 50 percent for both connections indicated high variability of stiffness characteristics for individual toe-nailed connections. Table 20 includes the NDS allowable lateral design values for toe-nailed connections and the experimental average loads at 0.015-inch joint slip. Similarly to the results of heel joint tests (Section 4.2), the NDS allowable lateral design values overestimate the connection resistance at the 0.015-inch slip limit state. Furthermore, the disparity between the calculated and measured values is increased for toe-nailed connections as compared to face-nailed connections (Table 10) by as much as a factor of two. This effect can be explained with the change in failure modes from primarily lateral response of face-nailed connections to a combined lateral and withdrawal response of toe-nailed connections.
41
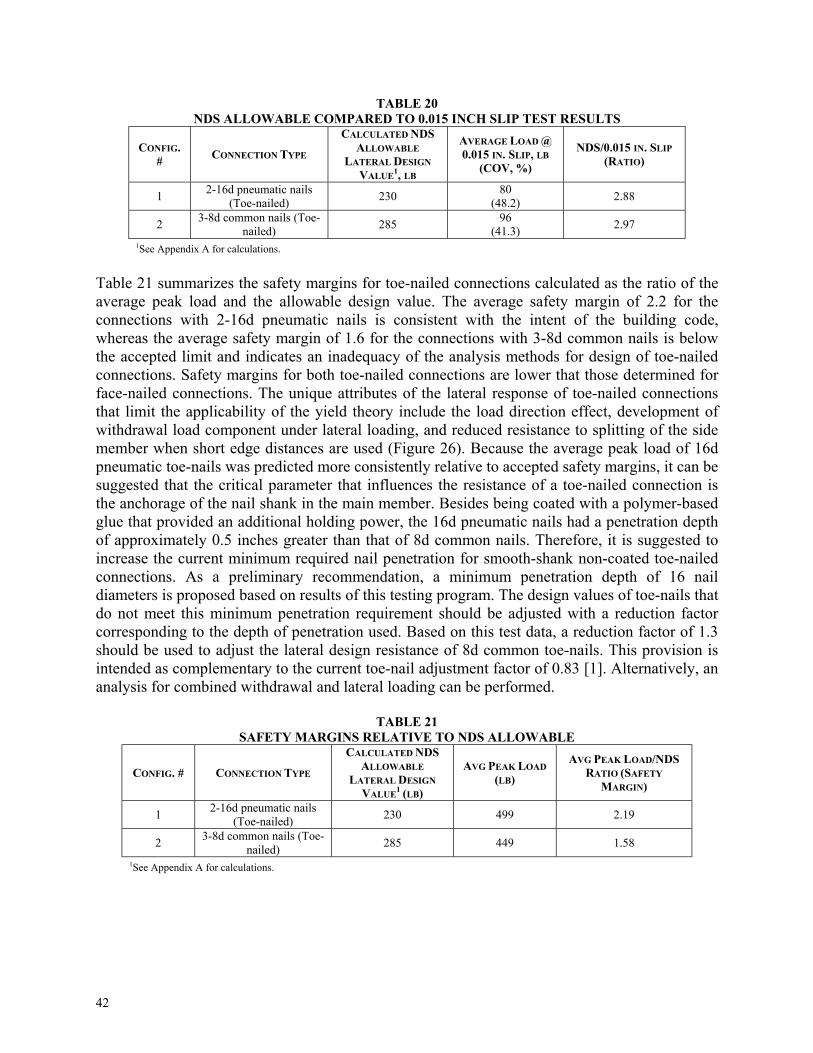
TABLE 20 NDS ALLOWABLE COMPARED TO 0.015 INCH SLIP TEST RESULTS
CONFIG. # CONNECTION TYPE
CALCULATED NDS ALLOWABLE
LATERAL DESIGN VALUE1, LB
AVERAGE LOAD @ 0.015 IN. SLIP, LB
(COV, %)
NDS/0.015 IN. SLIP (RATIO)
1 2-16d pneumatic nails (Toe-nailed) 230 80
(48.2) 2.88
2 3-8d common nails (Toe-nailed) 285 96
(41.3) 2.97 1See Appendix A for calculations.
Table 21 summarizes the safety margins for toe-nailed connections calculated as the ratio of the average peak load and the allowable design value. The average safety margin of 2.2 for the connections with 2-16d pneumatic nails is consistent with the intent of the building code, whereas the average safety margin of 1.6 for the connections with 3-8d common nails is below the accepted limit and indicates an inadequacy of the analysis methods for design of toe-nailed connections. Safety margins for both toe-nailed connections are lower that those determined for face-nailed connections. The unique attributes of the lateral response of toe-nailed connections that limit the applicability of the yield theory include the load direction effect, development of withdrawal load component under lateral loading, and reduced resistance to splitting of the side member when short edge distances are used (Figure 26). Because the average peak load of 16d pneumatic toe-nails was predicted more consistently relative to accepted safety margins, it can be suggested that the critical parameter that influences the resistance of a toe-nailed connection is the anchorage of the nail shank in the main member. Besides being coated with a polymer-based glue that provided an additional holding power, the 16d pneumatic nails had a penetration depth of approximately 0.5 inches greater than that of 8d common nails. Therefore, it is suggested to increase the current minimum required nail penetration for smooth-shank non-coated toe-nailed connections. As a preliminary recommendation, a minimum penetration depth of 16 nail diameters is proposed based on results of this testing program. The design values of toe-nails that do not meet this minimum penetration requirement should be adjusted with a reduction factor corresponding to the depth of penetration used. Based on this test data, a reduction factor of 1.3 should be used to adjust the lateral design resistance of 8d common toe-nails. This provision is intended as complementary to the current toe-nail adjustment factor of 0.83 [1]. Alternatively, an analysis for combined withdrawal and lateral loading can be performed.
TABLE 21 SAFETY MARGINS RELATIVE TO NDS ALLOWABLE
CONFIG. # CONNECTION TYPE
CALCULATED NDS ALLOWABLE
LATERAL DESIGN VALUE1 (LB)
AVG PEAK LOAD (LB)
AVG PEAK LOAD/NDS RATIO (SAFETY
MARGIN)
1 2-16d pneumatic nails (Toe-nailed) 230 499 2.19
2 3-8d common nails (Toe-nailed) 285 449 1.58
1See Appendix A for calculations.
42
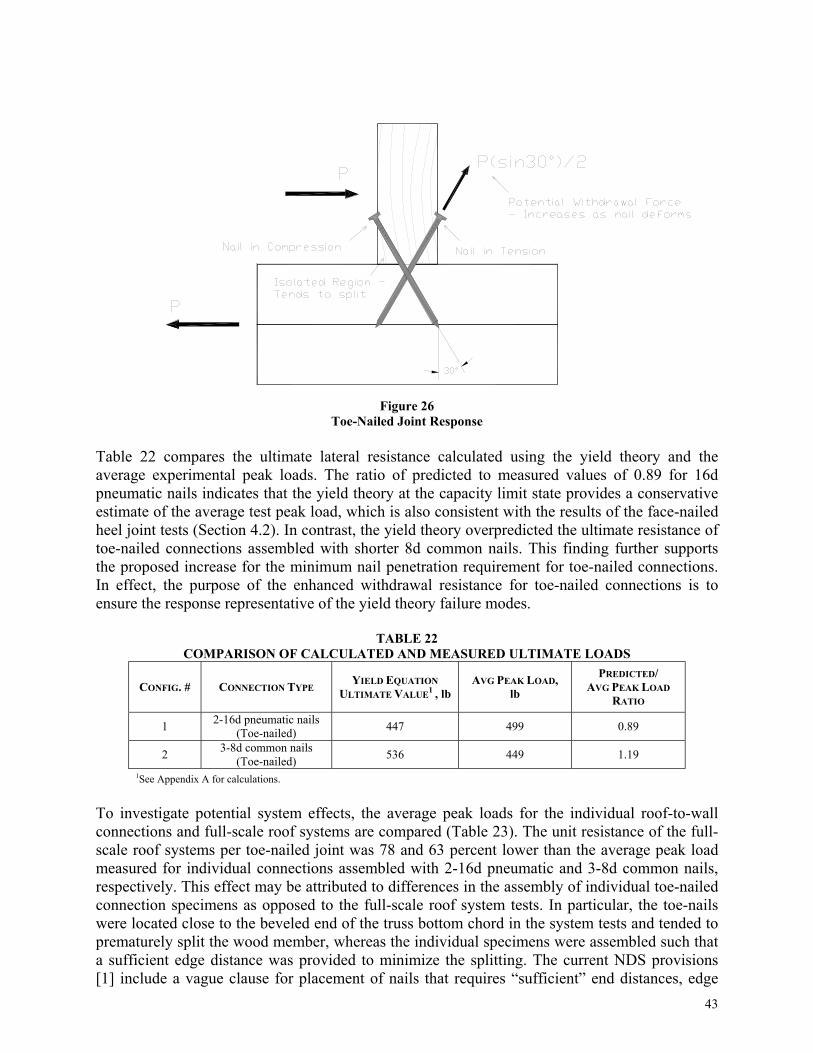
Figure 26 Toe-Nailed Joint Response
Table 22 compares the ultimate lateral resistance calculated using the yield theory and the average experimental peak loads. The ratio of predicted to measured values of 0.89 for 16d pneumatic nails indicates that the yield theory at the capacity limit state provides a conservative estimate of the average test peak load, which is also consistent with the results of the face-nailed heel joint tests (Section 4.2). In contrast, the yield theory overpredicted the ultimate resistance of toe-nailed connections assembled with shorter 8d common nails. This finding further supports the proposed increase for the minimum nail penetration requirement for toe-nailed connections. In effect, the purpose of the enhanced withdrawal resistance for toe-nailed connections is to ensure the response representative of the yield theory failure modes.
TABLE 22 COMPARISON OF CALCULATED AND MEASURED ULTIMATE LOADS
CONFIG. # CONNECTION TYPE YIELD EQUATION ULTIMATE VALUE1 , lb
AVG PEAK LOAD, lb
PREDICTED/ AVG PEAK LOAD
RATIO
1 2-16d pneumatic nails (Toe-nailed) 447 499 0.89
2 3-8d common nails (Toe-nailed) 536 449 1.19
1See Appendix A for calculations. To investigate potential system effects, the average peak loads for the individual roof-to-wall connections and full-scale roof systems are compared (Table 23). The unit resistance of the full-scale roof systems per toe-nailed joint was 78 and 63 percent lower than the average peak load measured for individual connections assembled with 2-16d pneumatic and 3-8d common nails, respectively. This effect may be attributed to differences in the assembly of individual toe-nailed connection specimens as opposed to the full-scale roof system tests. In particular, the toe-nails were located close to the beveled end of the truss bottom chord in the system tests and tended to prematurely split the wood member, whereas the individual specimens were assembled such that a sufficient edge distance was provided to minimize the splitting. The current NDS provisions [1] include a vague clause for placement of nails that requires “sufficient” end distances, edge 43
distances, and spacing to “prevent splitting of the wood”. The location of the truss plates directly above the wall and the beveled configuration of the truss heel joint limits the framing options for providing sufficient end distances. Therefore, the use of conventional roof-to-wall toe-nailed connections for fastening of engineered MPC trusses should be further investigated to develop connections that provide resistance consistent with the intent of the prescriptive construction provisions.
TABLE 23 COMPARISON OF SYSTEM ROOF-TO-WALL
AND INDIVIDUAL ROOF-TO-WALL CONNECTION
CONNECTION TYPE
INDIVIDUAL ROOF TO WALL
CONNECTION AVG PEAK LOAD1, lb
ROOF SYSTEM AVERAGE UNIT PEAK
LOAD, lb/JOINT
RATIO OF PREDICTED/
TESTED
2-16d pneumatic 499 283 1.78 3-8d common 449 276 1.63
4.3.4 Conclusions 1. Analysis of variance (ANOVA) showed that the peak load of toe-nailed connections
assembled with 2-16d pneumatic nails and 3-8d common nails are not significantly different (Table 19).
2. The NDS allowable design load showed a poor correlation with the experimental 0.015-inch
slip limit values (Table 20). 3. The average safety margins for toe-nailed connections decreased compared to those for face-
nailed connections and were estimated as 2.2 and 1.6 for 2-16d pneumatic and 3-8d common nails, respectively (Table 21). The reduced resistance of the toe-nailed connections relative to the yield theory is explained with the unique attributes of the toe-nail connection response including load direction effect, development of withdrawal load component under lateral loading, and reduced edge distances (Figure 26).
4. It is recommended to increased the minimum nail penetration requirement into the main
member to 16 nail diameters for toe-nailed connections to develop full lateral resistance representative of the yield theory approach. The design values of toe-nails that do not meet this minimum penetration requirement should be adjusted with a reduction factor corresponding to the depth of penetration used. Based on this test data, a reduction factor of 1.3 should be applied to adjust the lateral design resistance of 8d common toe-nails. This provision is intended to be in addition to the current toe-nail adjustment factor of 0.83 [1].
5. Based on comparison of the full-scale system test and individual roof-to-wall connection test
results, the resistance of a toe-nailed connection in a system of MPC trusses is as much as 80 percent lower than that of an individual toe-nailed connection. This reduction is attributed to the decreased end distances in the truss heel joint that precipitate premature wood splitting at the beveled end of the bottom truss chord.
44
5.0 SUMMARY AND CONCLUSIONS The analytical and experimental findings of this project provide an opportunity to advance the engineering knowledge in the field of wood connections used by the residential building industry. As conventional residential construction evolves to incorporate recent technological advances and as houses become engineered to include enhanced connection requirements and novel fastening systems, the updated engineering information becomes important. This information should be used to provide consistent basis for connection design with respect to historical practice and innovative design methodologies. Under this project, several research areas are identified and investigated to benchmark the response of conventional and engineered roof connections. Three research tasks are completed on the performance of heel joints, full-scale roof-to-wall connections, and individual toe-nailed roof-to-wall connections. Results of the investigation indicate several inconsistencies in the design methodologies used for engineering analysis of traditional and hardware-type connections that can potentially lead to development of inaccurate prescriptive connection provisions and inefficient design solutions. As a method to reconcile many of the detected disparities, it was proposed to implement capacity-based design methodology for analysis of all types of wood connections. This recommendation is supported with results of the literature survey and experimental program. As capacity-based design provides a measure of safety with improved consistency, the greatest practical impact will be realized in high-seismic and hurricane-prone areas where economical engineering solutions are essential for construction of safe and affordable housing. Task 1 demonstrated that conventional practice of constructing roof heel joints with 3-10d common nails (or equivalent) should be limited by building geometry and geographical regions. System effects such as attachment of the heel joint members to the wall assembly should be included in the analysis to accurately predict the resistance of conventional connections on a capacity basis. Results of Task 2 show that the resistance of roof-to-wall toe-nailed connections (direction parallel to wall) used with MPC wood trusses can be decreased as compared to conventional rafter-joist roof systems due to reduced edge distances and limited area for nail installation. Therefore, a prescriptive connection schedule should be developed for attachment of MPC trusses to provide lateral resistance equivalent to the conventional roof systems. It is further shown that a simple hurricane clip can be used in the high-hazard regions to significantly improve the lateral load transfer from the roof diaphragm to shear walls in conventional residential construction. Task 3 manifests that the current engineering methods for design of toe-nailed connections should be revised to account for unique response attributes such as increased withdrawal force, reduced edge distance, directionality effects, etc. The current design methods can potentially overestimate the resistance of certain toe-nailed connections and result in safety margins lower than intended by building codes.
45
6.0 RECOMMENDATIONS The findings of this report can be applied to re-evaluate or confirm connection requirements for conventional construction, such as roof connections investigated under this project, with a practical view toward historic practice, structural performance, and constructability. The re-evaluation should include improvements to the ability to design wood connections to an explicit and consistent safety margin relative to failure. For example, the NDS method for design of wood connections in shear using the yield equations, particularly for the types of joints considered in this study, should be modified as follows:
1. Use ultimate dowel bearing and ultimate nail bending values to predict connection shear capacity.
2. Apply a consistent safety margin, such as 2.0 as recommended in this study, to adjust connection capacity estimates to an allowable design value for residential construction.
3. Use all applicable adjustment factors as specified in the NDS provisions [1].
4. In coordination with the above changes to the NDS procedure, include a method to estimate and limit joint slip as an independent design check dependent on application requirements and performance objectives consistent with residential construction practice and other related experience.
7.0 REFERENCES [1] AF&PA. 1997. National Design Specification for Wood Construction. American Forest
& Paper Association, Washington, DC. [2] AF&PA. 1999. General Dowel Equations for Calculating Lateral Connection Values,
Technical Report 12. American Forest & Paper Association, Inc., Washington, DC. [3] Johansen, K. W. 1949. Theory of timber connections. Publications of the International
Association for Bridge and Structural Engineering. Vol. 9. International Association for Bridge and Structural Engineering, Zurich, Switzerland. pp. 249-262.
[4] AF&PA. 1997. National Design Specification Commentary for Wood Construction.
American Forest & Paper Association, Washington, DC. [5] Aune, P., Patton-Mallory M. 1986. Lateral load-bearing capacity of nailed joints based on
the yield theory: Theoretical development. Res. Pap. FPL 469. U.S. Department of Agriculture, Forest Service, Forest Products Laboratory, Madison, WI.
[6] Aune, P., and Patton-Mallory, M. 1986. Lateral load-bearing capacity of nailed joints
based on the yield theory: Experimental verification. Res. Pap. FPL 470. U.S. Department of Agriculture, Forest Service, Forest Products Laboratory, Madison, WI.
46
[7] Wilkinson, T. L. 1993. Bolted Connection Strength and Bolt Hole Size. Research Paper FPL-RP-524, U.S. Department of Agriculture, Forest Service, Forest Products Laboratory, Madison, WI.
[8] Soltis, L. A., and Wilkinson, L. T. 1987. Bolted-Connection Design. General Technical
Report FPL-GTR-54, U.S. Department of Agriculture, Forest Service, Forest Products Laboratory, Madison, WI.
[9] Wilkinson, L. T. 1992. Strength of Bolted Timber Connections with Steel Side Members.
Research Paper FPL-RP-513, U.S. Department of Agriculture, Forest Service, Forest Products Laboratory, Madison, WI.
[10] McLain, T. E., and Thangjitham, S. 1983. Bolted Wood Joint Yield Model. Journal of
Structural Division, ASCE 109(8): 1820-1835. [11] Ehlbeck, J. 1979. Nailed Joints in Wood Structures. Virginia Polytechnic Institute and
State University, Blacksburg, VA. [12] Trayer, G. W. 1932. The bearing strength of wood under bolts. Technical Bulletin No.
332. USDA Forest Service, Washington, DC.
[13] Forest Products Laboratory. 1965. Strength of Wood Joints Made With Nails, Staples, or Screws. Gen. Tech. Rep. FPL-0100, U.S. Department of Agriculture, Forest Service, Forest Products Laboratory, Madison, WI.
[14] Soltis, L. A. 1991. European Yield Model for Wood Connections. 9th Structures Congress
Proceedings, 1991 April 29-May 1, Indianapolis, IN. New York: American Society of Civil Engineers: 60-63.
[15] Wilkinson, T. L. 1993. Bolted Connection Design Values Based on European Yield
Model. Journal of Structural Engineering, Vol. 119, No. 7. [16] Yeh, S.C., Kasal, B., Tung, C.C., and Rogers, S.M. Jr. 1999. Ultimate Capacity of Nailed
Connections for Design of Breakaway Walls. Forest Products Journal, Vol. 49, No. 10. [17] Heine, C.P. 2001. Simulated Response of Degrading Hysteretic Joints with Slack
Behavior. Dissertation submitted to the Faculty of the Virginia Polytechnic Institute and State University, Blacksburg, VA, 291 p.
[18] Forest Products Laboratory. 1999. Wood Handbook-Wood as an engineering material.
Gen. Tech. Rep. FPL-GTR-113, U.S. Department of Agriculture, Forest Service, Forest Products Laboratory, Madison, WI.
[19] Patton-Mallory, M. 1996. The three dimensional mechanics and failure of single bolt
wood connections. Ph.D. thesis, Colorado State University, Fort Collins, CO, 310 p. [20] Heine, C. P., and Dolan, J. D. 2001. A new model to predict the load-slip relationship of
bolted connections in timber. Wood and Fiber Science, V. 33, No. 4.
47
[21] Gahagan, J.M. and Scholten, J.A. 1938. Resistance of Wood to the Withdrawal of Nails,
USDA Forest Service, Forest Products Laboratory, Madison, WI. [22] McClain, T.E. 1997. Design Axial Withdrawal Strength from Wood: II. Plain-Shank
Common Wire Nails, Forest Products Journal, Volume 47, No. 6, Madison, WI. [23] Cunningham, T.P. 1993. Roof Sheathing Fastening Schedules For Wind Uplift. APA
Report T92-28, American Plywood Association, Tacoma, WA. [24] Mizzell, D.P. and Schiff, S.D. 1994. Wind Resistance of Sheathing for Residential Roofs,
Clemson University, Clemson, SC. [25] Murphy, S., Pye, S., and Rosowsky, D. 1995. System Effects and Uplift Capacity of Roof
Sheathing Fasteners. Structures Congress, American Society of Civil Engineers, New York, NY.
[26] Conner, H., Gromala, D., and Burgess, D. 1987. Roof Connections in Houses: Key to
Wind Resistance. American Society of Structural Engineers, Journal of Structural Engineering, Volume 113, No. 12, New York, NY.
[27] Council of American Building Officials. 1995. One and Two Family Dwelling Code. The
Council of American Building Officials, Falls Church, VA. [28] Reed, T.D., Rosowsky, D.V., and Schiff, S.D. 1996. Uplift Capacity of Rafter-to-Top
Plate Connections in Light-Frame Construction. Clemson University, Clemson, SC. [29] ASTM. 1999. Annual Book of ASTM Standards, Volume 04.10, Wood, ASTM D 2395-
93 Standard Test Method for Specific Gravity of Wood and Wood-Based Materials American Society of Testing and Materials, West Conshohocken, PA.
[30] ASTM. 1995. Annual Book of ASTM Standards, Volume 03.01, ASTM F 1575-95
Standard Test Method for Determining Bending Yield Moment of Nails, American Society of Testing and Materials, West Conshohocken, PA.
[31] National Evaluation Service, Inc. 1997. Power-Driven Staples and Nails for Use in All
Types of Building Construction, NER-272, Falls Church, VA. [32] International Code Council (ICC). 2000. International Residential Code (IRC) for One-
and Two-Family Dwellings. ICC, Falls Church, VA. [33] Ehlbeck, J. 1978. Performance of Non-Coated and Coated Senco Staples in European
Spruce (Whitewood). Virginia Polytechnic Institute and State University, Wood Research and Wood Construction Laboratory, NO. 160.
[34] Simpson Strong-Tie Co., Inc. 1999. Catalog C-99. Wood Construction Connectors,
Simpson Strong Tie Co., Inc., Pleasanton, CA.
48
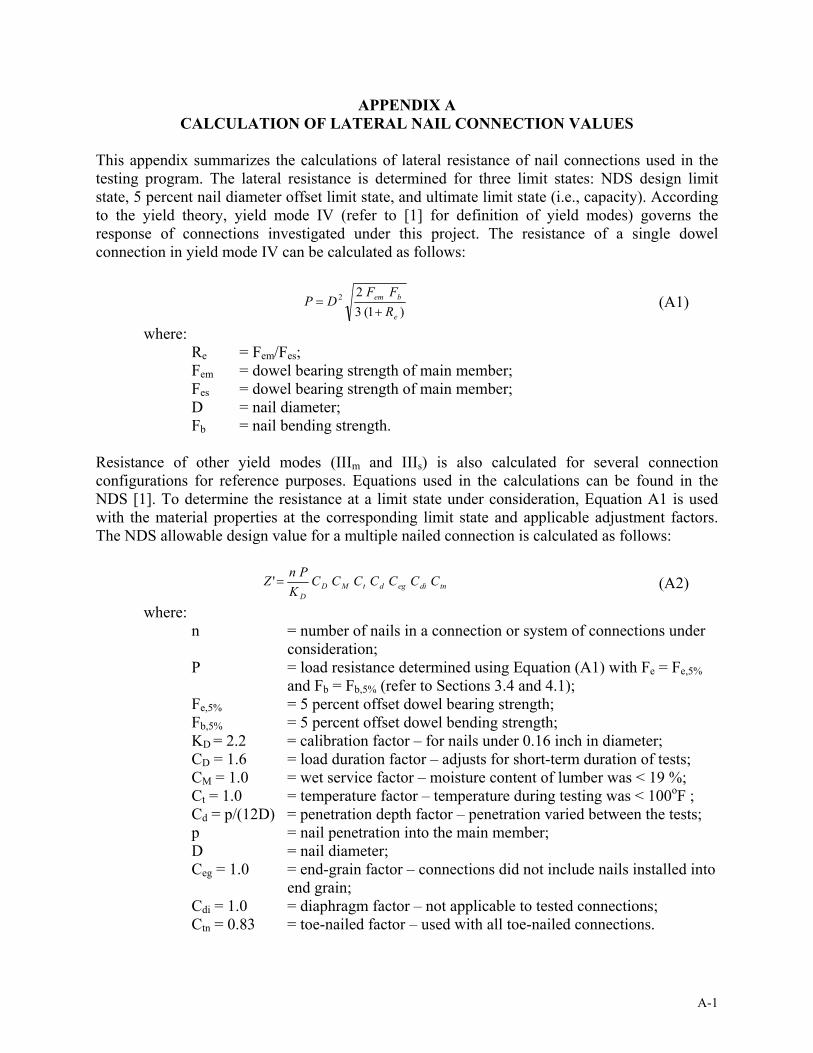
APPENDIX A CALCULATION OF LATERAL NAIL CONNECTION VALUES
This appendix summarizes the calculations of lateral resistance of nail connections used in the testing program. The lateral resistance is determined for three limit states: NDS design limit state, 5 percent nail diameter offset limit state, and ultimate limit state (i.e., capacity). According to the yield theory, yield mode IV (refer to [1] for definition of yield modes) governs the response of connections investigated under this project. The resistance of a single dowel connection in yield mode IV can be calculated as follows:
)1(322
e
bem
RFF
DP+
= (A1)
where: Re = Fem/Fes; Fem = dowel bearing strength of main member; Fes = dowel bearing strength of main member;
D = nail diameter; Fb = nail bending strength.
Resistance of other yield modes (IIIm and IIIs) is also calculated for several connection configurations for reference purposes. Equations used in the calculations can be found in the NDS [1]. To determine the resistance at a limit state under consideration, Equation A1 is used with the material properties at the corresponding limit state and applicable adjustment factors. The NDS allowable design value for a multiple nailed connection is calculated as follows:
tndiegdtMDD
CCCCCCCK
PnZ =' (A2)
where: n = number of nails in a connection or system of connections under
consideration; P = load resistance determined using Equation (A1) with Fe = Fe,5%
and Fb = Fb,5% (refer to Sections 3.4 and 4.1); Fe,5% = 5 percent offset dowel bearing strength; Fb,5% = 5 percent offset dowel bending strength;
KD = 2.2 = calibration factor – for nails under 0.16 inch in diameter; CD = 1.6 = load duration factor – adjusts for short-term duration of tests; CM = 1.0 = wet service factor – moisture content of lumber was < 19 %; Ct = 1.0 = temperature factor – temperature during testing was < 100oF ; Cd = p/(12D) = penetration depth factor – penetration varied between the tests; p = nail penetration into the main member; D = nail diameter;
Ceg = 1.0 = end-grain factor – connections did not include nails installed into end grain;
Cdi = 1.0 = diaphragm factor – not applicable to tested connections; Ctn = 0.83 = toe-nailed factor – used with all toe-nailed connections.
A-1
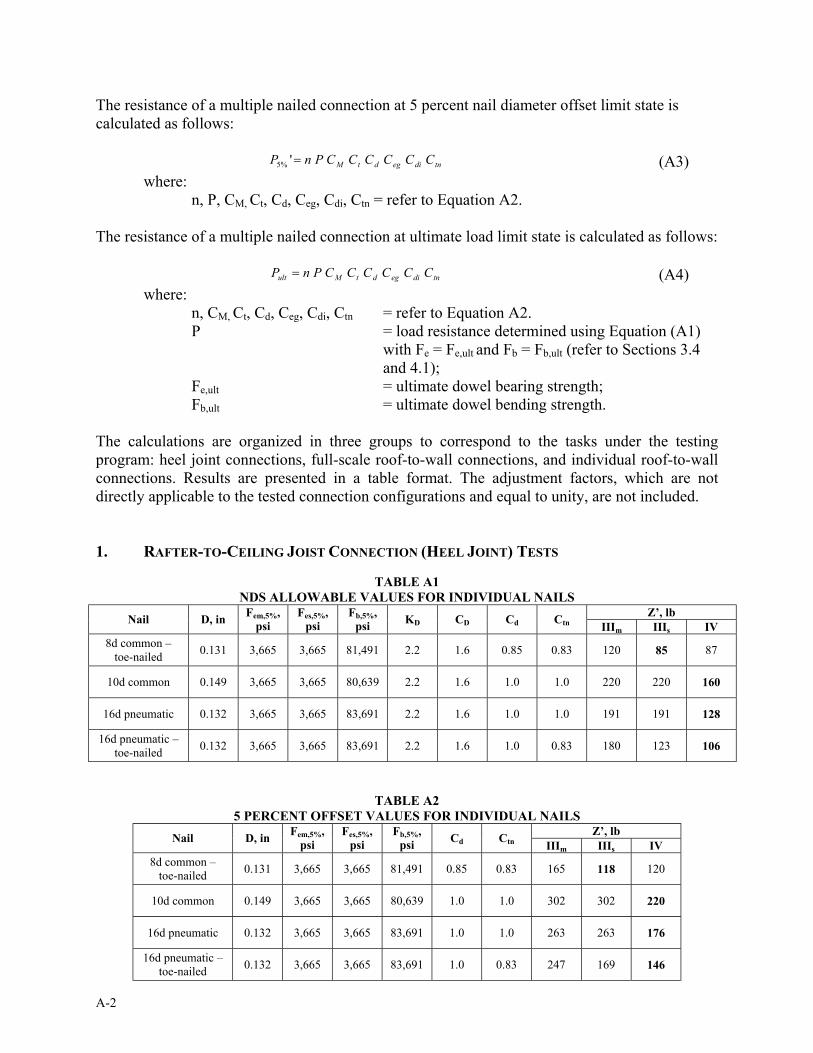
The resistance of a multiple nailed connection at 5 percent nail diameter offset limit state is calculated as follows:
tndiegdtM CCCCCCPnP ='%5 (A3) where:
n, P, CM, Ct, Cd, Ceg, Cdi, Ctn = refer to Equation A2. The resistance of a multiple nailed connection at ultimate load limit state is calculated as follows:
tndiegdtMult CCCCCCPnP = (A4) where:
n, CM, Ct, Cd, Ceg, Cdi, Ctn = refer to Equation A2. P = load resistance determined using Equation (A1)
with Fe = Fe,ult and Fb = Fb,ult (refer to Sections 3.4 and 4.1);
Fe,ult = ultimate dowel bearing strength; Fb,ult = ultimate dowel bending strength.
The calculations are organized in three groups to correspond to the tasks under the testing program: heel joint connections, full-scale roof-to-wall connections, and individual roof-to-wall connections. Results are presented in a table format. The adjustment factors, which are not directly applicable to the tested connection configurations and equal to unity, are not included. 1. RAFTER-TO-CEILING JOIST CONNECTION (HEEL JOINT) TESTS
TABLE A1 NDS ALLOWABLE VALUES FOR INDIVIDUAL NAILS
Z’, lb Nail D, in Fem,5%, psi
Fes,5%, psi
Fb,5%, psi KD CD Cd Ctn IIIm IIIs IV
8d common – toe-nailed 0.131 3,665 3,665 81,491 2.2 1.6 0.85 0.83 120 85 87
10d common 0.149 3,665 3,665 80,639 2.2 1.6 1.0 1.0 220 220 160
16d pneumatic 0.132 3,665 3,665 83,691 2.2 1.6 1.0 1.0 191 191 128
16d pneumatic – toe-nailed 0.132 3,665 3,665 83,691 2.2 1.6 1.0 0.83 180 123 106
TABLE A2 5 PERCENT OFFSET VALUES FOR INDIVIDUAL NAILS
Z’, lb Nail D, in Fem,5%, psi
Fes,5%, psi
Fb,5%, psi Cd Ctn IIIm IIIs IV
8d common – toe-nailed 0.131 3,665 3,665 81,491 0.85 0.83 165 118 120
10d common 0.149 3,665 3,665 80,639 1.0 1.0 302 302 220
16d pneumatic 0.132 3,665 3,665 83,691 1.0 1.0 263 263 176
16d pneumatic – toe-nailed 0.132 3,665 3,665 83,691 1.0 0.83 247 169 146
A-2

TABLE A3 ULTIMATE VALUES FOR INDIVIDUAL NAILS
Z’, lb Nail D, in Fem,ult, psi
Fes,ult, psi Fb,ult psi Cd Ctn IIIm IIIs IV
8d common – toe-nailed 0.131 5,510 5,510 108,772 0.85 0.83 246 173 170
10d common 0.149 5,390 5,390 108,357 1.0 1.0 440 440 310
16d pneumatic 0.132 5,503 5,503 118,300 1.0 1.0 393 393 257
16d pneumatic – toe-nailed 0.132 5,503 5,503 118,300 1.0 0.83 369 251 213
TABLE A4 RESISTANCE OF TWO PARALLEL HEEL JOINTS
NDS Allowable Value, lb 5% Offset Value, lb Ultimate Value, lb
Con
fig. #
Rafter-to-Joist Connection (Heel Joint)
Number of joints
IIIm IIIs IV IIIm IIIs IV IIIm IIIs IV
1 3-10d Common Nails Unattached 2 1,317 1,317 962 1,812 1,812 1,322 2,643 2,643 1,859
2 3-10d Common Nails Attached with 3-8d Common Toe-Nails
2 1,489 1,489 1,133 2,047 2,047 1,558 2,984 2,984 2,200
3 3-16d Pneumatic Nails Unattached 2 1,147 1,147 769 1,577 1,577 1,057 2,357 2,357 1,540
4 3-16d Pneumatic Nails Attached with 3-16d Pneumatic Toe-Nails
2 1,360 1,360 981 1,869 1,869 1,350 2,783 2,783 1,966
5 12-16d Pneumatic
Nails Unattached
2 4,587 4,587 3,075 6,308 6,308 4,228 9,428 9,428 6,160
2. FULL-SCALE ROOF-TO-WALL CONNECTION SYSTEM TESTS
TABLE A5 NDS ALLOWABLE VALUES FOR INDIVIDUAL NAILS
Z’, lb Nail D, in Fem,5%, psi
Fes,5%, psi
Fb,5%, psi KD CD Cd Ctn IIIm IIIs IV
8d common – toe-nailed 0.132 3,075 6,093 81,491 2.2 1.6 0.85 0.83 113 113 92
12d pneumatic toe-nail 0.131 3,075 6,093 90,596 2.2 1.6 1.0 0.83 151 151 97
16d pneumatic – toe-nailed 0.120 3,075 6,093 83,691 2.2 1.6 1.0 0.83 168 167 112
A-3
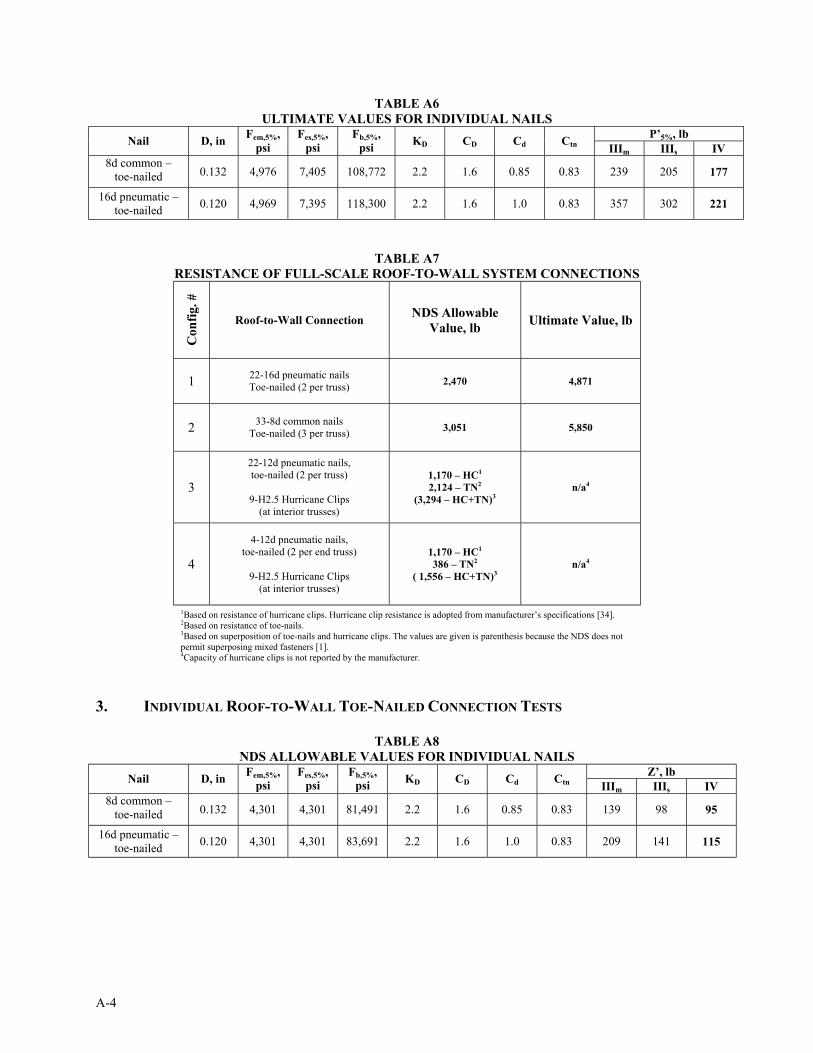
TABLE A6 ULTIMATE VALUES FOR INDIVIDUAL NAILS
P’5%, lb Nail D, in Fem,5%, psi
Fes,5%, psi
Fb,5%, psi KD CD Cd Ctn IIIm IIIs IV
8d common – toe-nailed 0.132 4,976 7,405 108,772 2.2 1.6 0.85 0.83 239 205 177
16d pneumatic – toe-nailed 0.120 4,969 7,395 118,300 2.2 1.6 1.0 0.83 357 302 221
TABLE A7 RESISTANCE OF FULL-SCALE ROOF-TO-WALL SYSTEM CONNECTIONS
Con
fig. #
Roof-to-Wall Connection NDS Allowable Value, lb Ultimate Value, lb
1 22-16d pneumatic nails Toe-nailed (2 per truss) 2,470 4,871
2 33-8d common nails Toe-nailed (3 per truss) 3,051 5,850
3
22-12d pneumatic nails, toe-nailed (2 per truss)
9-H2.5 Hurricane Clips
(at interior trusses)
1,170 – HC1 2,124 – TN2
(3,294 – HC+TN)3 n/a4
4
4-12d pneumatic nails, toe-nailed (2 per end truss)
9-H2.5 Hurricane Clips
(at interior trusses)
1,170 – HC1 386 – TN2
( 1,556 – HC+TN)3 n/a4
1Based on resistance of hurricane clips. Hurricane clip resistance is adopted from manufacturer’s specifications [34]. 2Based on resistance of toe-nails. 3Based on superposition of toe-nails and hurricane clips. The values are given is parenthesis because the NDS does not permit superposing mixed fasteners [1]. 4Capacity of hurricane clips is not reported by the manufacturer.
3. INDIVIDUAL ROOF-TO-WALL TOE-NAILED CONNECTION TESTS
TABLE A8 NDS ALLOWABLE VALUES FOR INDIVIDUAL NAILS
Z’, lb Nail D, in Fem,5%, psi
Fes,5%, psi
Fb,5%, psi KD CD Cd Ctn IIIm IIIs IV
8d common – toe-nailed 0.132 4,301 4,301 81,491 2.2 1.6 0.85 0.83 139 98 95
16d pneumatic – toe-nailed 0.120 4,301 4,301 83,691 2.2 1.6 1.0 0.83 209 141 115
A-4

TABLE A9 ULTIMATE VALUES FOR INDIVIDUAL NAILS
P’5%, lb Nail D, in Fem,5%, psi
Fes,5%, psi
Fb,5%, psi KD CD Cd Ctn IIIm IIIs IV
8d common – toe-nailed 0.132 6,047 6,047 108,772 2.2 1.6 0.85 0.83 268 187 179
16d pneumatic – toe-nailed 0.120 6,040 6,040 118,300 2.2 1.6 1.0 0.83 403 273 223
TABLE A10 RESISTANCE OF INDIVIDUAL ROOF-TO-WALL SYSTEM CONNECTIONS
Con
fig. #
Roof-to-Wall Connection NDS Allowable Value, lb Ultimate Value, lb
1 2-16d pneumatic nails (toe-nailed) 230 447
2 3-8d common nails (toe-nailed) 285 536
A-5

A-6