Embed Size (px)
Citation preview

ROLE OF REMOTE SENSING TO INTEGRATED COASTAL ZONE MANAGEMENT
Shailesh Nayak
Space Applications Centre (ISRO), Ahmedabad 380 015, India. E-mail: [email protected]
Commission VII, Th S 18
KEYWORDS: Remote sensing, coast, ecosystem, application, management
ABSTRACT:
The coastal zone represents varied and highly productive ecosystems such as mangroves, coral reefs, sea grasses and sand dunes. These ecosystems are under pressure on account of increased anthropogenic activity on the coast, as a result of globalisation. It is necessary to protect these coastal ecosystems to ensure sustainable development. This requires information on habitats, landforms, coastal processes, water quality, natural hazards on a repetitive basis. In India, remote sensing data, especially Indian Remote Sensing (IRS) data, having moderate (23-36 m) to high spatial resolution (6 m), have been used to generate database on various components of coastal environment of the entire country. However, the moderate resolution data provide macro-level information on 1:250,000 and 1:50,000 scale about the condition of habitats, type of landforms and areas under erosion and deposition. The major advantage of remote sensing data is monitoring of change periodically. The combination of moderate and high-resolution data provided detailed coastal land use maps on the 1:25,000-scale for implementing coastal regulation measures. The classification accuracy have been achieved is 85 per cent or better at 90 per cent confidence level. Mangrove areas were classified up to community level through contextual editing. Various zones of coral reef were identified, however, species level information is not possible to generate using such data. The knowledge about bio-optical properties of water is vital for coral reef and sea grass bed monitoring. The OCEANSAT I (IRS P4) Ocean Colour Monitor (OCM) data provide useful information on the phytoplankton and suspended sediments. The information on phytoplankton and sea surface temperature (SST) has been used to predict potential fishery zones routinely. The information on sediments provides some insight in to the movement of sediments along the coast. Satellite-derived derived information were integrated with the other collateral information through GIS to select sites for aquaculture, zoning of coastal zone for regulatory purpose and assess possible impact of sea level rise. Realising the value of the remote-sensing derived information, the state and central agencies responsible for the conservation of these ecosystems are increasingly adopting remote sensing data for their routine use.
1. INTRODUCTION The coastal zone of world is under increasing stress due to development of industries, trade and commerce, tourism and resultant human population growth and migration, and deteriorating water quality. This region is of very high biological productivity and thus an important component of the global life system. Coastal ecosystems harbour wealth of species and genetic diversity, store and cycle nutrients, filter pollutants and help to protect shorelines from erosion and storms. Marine ecosystems play a vital role in regulating climate and they are a major carbon sink and oxygen source. The industrial development of coast has resulted in degradation of coastal ecosystems and diminishing the living resources of Exclusive Economic Zone (EEZ) in form of coastal and marine biodiversity and productivity. More than half population lives within 60 km of the coast and would rise to almost three quarters by 2020 (Anon, 1992). Episodic events, such as cyclones, floods, pose serious threat to human life and property in the coastal zone. Human activities also induce certain changes or accelerate the process of change.
Thus there is an urgent need to conserve the coastal ecosystems and habitats including individual plant species and communities so, settlements, recreation, environment and agriculture. In order to ensure sustainable development, it necessary to develop accurate, up-to-date and comprehensive scientific databases on habitats, protected areas, water quality, environmental indicators and carry out periodic assessment of the health of the system. The modern scientific tools of remote sensing, GIS and GPS are extremely valuable in development of databases and to analyse them in the integrated manner and derive management action plans. Availability of repetitive, synoptic and multi-spectral data from various satellite platforms, viz. IRS, LANDSAT, SPOT, have helped to generate information on varied aspects of the coastal and marine environment. Ocean colour data from OCANSAT I OCM, SeaWiFS, MODIS, provide information on biological aspects useful for fisheries and coastal ecosystems. In India, satellite based information has been used for generating inventory on coastal habitats, landforms, coastal land use and shoreline condition, condition assessment of protected areas,

exploration of marine fisheries, mitigation of coastal disasters and understanding of sediment dynamics. GIS has been used for the integrating satellite based information for identifying aquaculture sites, coastal regulation and environmentally sensitive zones.
2. ISSUES FOR COASTAL ZONE MANAGEMENT The following issues are critical in context of coastal zone management (Nayak, 2000).
Coastal ecosystems and marine living resources i) Generation of reference or baseline data,
conservation and restoration of vital and critical habitats such as mangroves, coral reefs, sea-grass beds, etc.
ii) Reclamation of wetland for agricultural and industrial purposes
iii) Exploration and sustainable use of living resources Shoreline protection
i) Identification of vulnerable areas including eroded areas and developmental activities
ii) Planning and implementation of coastal protection work (erosion, flood protection, salt water intrusion, etc.)
iv) Impact of engineering structures and dams on coastal processes of erosion, deposition and sediment transport
v) Suspended sediment dynamics vi) Changes in bottom topography
Coastal water quality
i) Non-point and point pollution ii) Phytoplankton blooms
Coastal Hazards and Climate Change i) Cyclones, storm surges, sea-level rise and possible
effects ii) Emergency response plans for natural disasters
such as cyclones, sea level rise, or anthropogenic activities such as oil spills.
Coastal development
i) Appropriate site selection for industries, landfall points, aquaculture, recreational activities, etc.
ii) Assessment of conditions in regulation zones, areas under construction setback–lines, mega-cities, etc.
3. COASTAL ECOSYSTEMS AND MARINE RESOURCES
3.1Coastal Ecosystems Coastal habitats, especially wetlands, coral reefs, mangroves, salt marshes, and sea grasses, are highly productive, serve important ecological functions, provide coastal protection and are critical resources for food, energy, tourism and economic development. Such coastal systems are under stress or threatened from various
sources, both natural and human. The information on loss of tidal wetlands is important as they provide a vital link in the marine energy flow through transfer of solar energy into forms, which are readily usable by a wide variety of estuarine organisms. Satellite imagery has immensely helped mapping of coastal ecosystems and provided estimates of extent and alteration in land cover in coastal ecosystem. A baseline information on coastal habitat (critical/vital) and associated shore land features along the entire Indian coast on 1:250,000/1:50,000 scale has been carried out through visual interpretation of multi-spectral IRS LISS II and LISS III and LANDSAT TM data for macro-level planning for the first time (Nayak et al. 1991, Jagtap et al. 2001, Nayak, 2002). Low-tide image of period December-February was used. Image-interpretation key was developed to identify various components of the ecosystem. The degradation of mangroves (about 25 per cent) and coral reefs, reclamation of lagoons and mudflats was observed (Desai et al. 1991, Nayak et al. 1992 a, Nayak, 1996,). Classification accuracy of 85 per cent at 90 per cent confidence level was achieved. Synergistic use of SAR and optical data improve distinction of wetlands (Kushwaha, 2000). Attempts are being made to use interferometric SAR to study small elevation changes in the inter-tidal zone (Cracknell, 1999). 3.2 Mangroves Mangroves help in the production of detritus, organic matter, recycling of nutrients and thus enrich the coastal waters and support benthos population of sea. Mangroves cover about 200,000 sq km areas on the globe, mainly around tropics. It has been estimated that half of the world mangroves may have been lost. The Forest Survey of India has been providing estimates of mangroves based on satellite data since 1987. However, in some regions, mangroves have increased due to plantation as well as regeneration. In India, mangroves have reduced from 6740 to 4460 sq. km (Nayak, 1992). Mangroves are degraded and destroyed due to conversion of these areas for agriculture, aquaculture on the East Coast and industrial purposes on the West Coast (Fig.1).
Fig. 1. Change in mangrove area during 1986-1993. Dense, degraded, mangrove plantation areas and reclaimed areas can be distinguished using IRS LISS III data (Nayak et al. 1996,

Nayak and Bahuguna, 2001, Blasco and Aizpuru, 2002). Principal component analysis and band ratio are important techniques for distinguishing mangroves (Nayak et al. 1985, Nayak, 1994, Green et al. 1998). It was found that spectral resolution is more crucial in distinguishing mangroves (Gao, 1999a, 1999b).
Mangroves are characterised by the presence of particular dominant communities/species, physico-chemical environment, extent and frequency of inundation by tidal waves, salinity and a soil types. It is possible to identify major mangrove communities such as Avicennia spp.; Rhizophora forest, Sonneratia spp., Phoenix spp. and mangrove scrub using LISS III and PAN data on the Indian sub-continent (Fig. 2). The variation in pigment content, leaf structure and water content in mangroves leaves along with the associated features and location were exploited to identify dominant mangrove types. Information regarding different mangrove community zonation is a vital for bio-diversity assessment and for preparing management plans for conservation.
Fig. 2. Mangrove zonation in the part of Sunderbans, India usng
IRS LISS III and PAN merged data 3.3 Coral Reefs The information about extent and condition of coral reefs is required for planning conservation and preventive measures to protect this fragile system. Coral reefs cover about 300,000 sq km areas. IRS LISS III, LANDSAT TM and SPOT multi-spectral
data have shown potential in identifying various coral reef features. Coral reef features such as type (fringing, atoll, platform, patch, coral heads, sand cays, etc.), reef-flat, reef vegetation, degraded reef, lagoons, live corals and coralline shelf have been mapped using IRS LISS II and III data on 1:50,000 scale for the Indian reefs (Nayak et al. 1996, Bahuguna and Nayak, 1998). Uncharted coralline shelf, coral heads, live coral platform and coral pinnacle were mapped. These maps have been used as a basic input for identifying the boundaries of protected areas and biosphere reserves. It was observed that coral reef degradation is more serious problem than total destruction (Bahuguna and Nayak, 1998). The felling of mangroves and clearing of forests have increased sedimentation and affected live coral and species diversity. It was observed that annual growth of coral reefs decreases with increase in sediment loading in the Mayaquez bay in Puerto Rico (Miller and Cruise, 1995). Coral reefs show distinct morphological and ecological characters. Water column modifies the apparent reflectance spectrum of an object on the sea bottom. Water column correction and contextual editing increased the classification accuracy (Mumby et al. 1998). IRS-1C LISS III and PAN merged data have been used for coral reef zonation study (Nayak et al. 1996). It is possible to identify reef edge, reef crest, algal ridge, moat, coral knolls, reef platform, reef flat (consisting of sea grass, algae/seaweed, shallow pools, mud over reef and sand apron). IRS LISS III green band (520-590 nm) is quite useful. The live coral area as small as 50-sq. m was possible to identify. The use of very high-resolution data such as IKONOS has further improved the accuracy of classification as well as delineation of boundary (Fig. 3).
Fig. 3. Coral reef zonation (Gulf of Kachchh, Western India), using IKONOS data.
Avicennia alba
Avicennia marina
Avicennia sparse
Creek
Sand
Mudflat
Aegialitis
Phoenix
Marsh
WRF
Algal ridge
Moat
Outer reef flat with macro algae
Inner RF wit
Inner RF (sand + mud)
Outer RF with algae
The accuracy achieved is about 85 per cent. The branching coral, massive coral, healthy and bleached coral have distinct spectral characteristics. However, their distinction using remote sensing data has not been very successful.
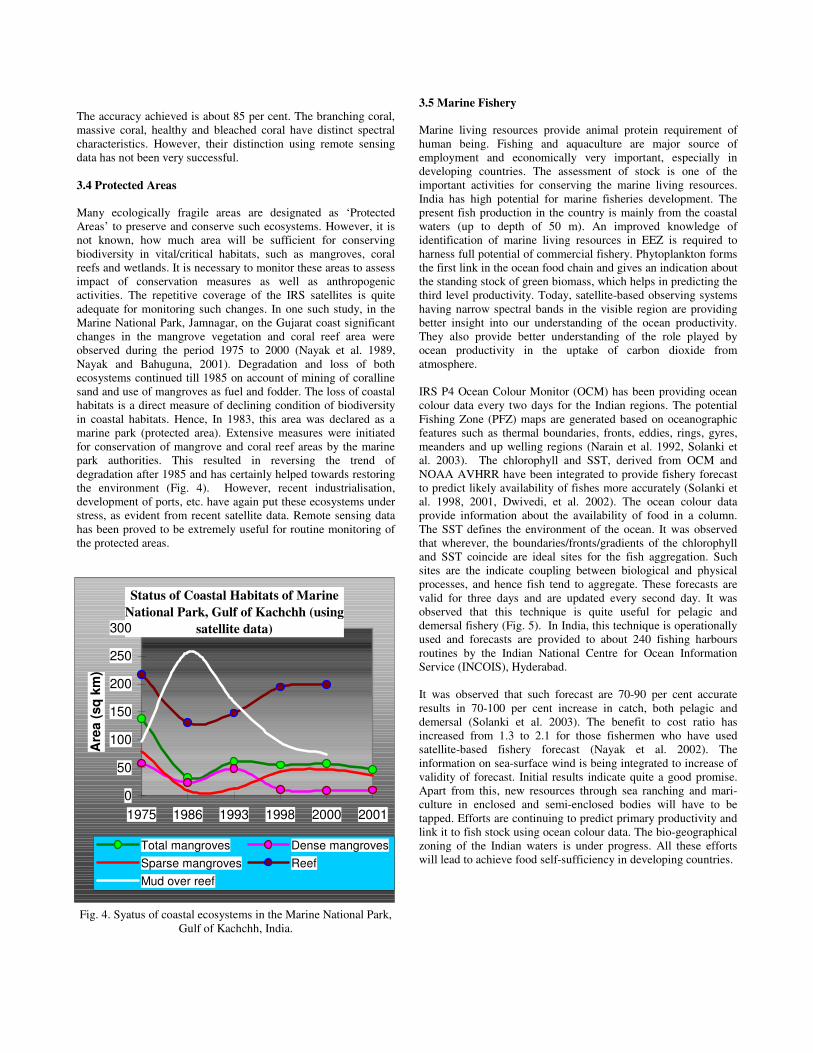
3.4 Protected Areas Many ecologically fragile areas are designated as ‘Protected Areas’ to preserve and conserve such ecosystems. However, it is not known, how much area will be sufficient for conserving biodiversity in vital/critical habitats, such as mangroves, coral reefs and wetlands. It is necessary to monitor these areas to assess impact of conservation measures as well as anthropogenic activities. The repetitive coverage of the IRS satellites is quite adequate for monitoring such changes. In one such study, in the Marine National Park, Jamnagar, on the Gujarat coast significant changes in the mangrove vegetation and coral reef area were observed during the period 1975 to 2000 (Nayak et al. 1989, Nayak and Bahuguna, 2001). Degradation and loss of both ecosystems continued till 1985 on account of mining of coralline sand and use of mangroves as fuel and fodder. The loss of coastal habitats is a direct measure of declining condition of biodiversity in coastal habitats. Hence, In 1983, this area was declared as a marine park (protected area). Extensive measures were initiated for conservation of mangrove and coral reef areas by the marine park authorities. This resulted in reversing the trend of degradation after 1985 and has certainly helped towards restoring the environment (Fig. 4). However, recent industrialisation, development of ports, etc. have again put these ecosystems under stress, as evident from recent satellite data. Remote sensing data has been proved to be extremely useful for routine monitoring of the protected areas.
Fig. 4. Syatus of coastal ecosystems in the Marine National Park, Gulf of Kachchh, India.
3.5 Marine Fishery Marine living resources provide animal protein requirement of human being. Fishing and aquaculture are major source of employment and economically very important, especially in developing countries. The assessment of stock is one of the important activities for conserving the marine living resources. India has high potential for marine fisheries development. The present fish production in the country is mainly from the coastal waters (up to depth of 50 m). An improved knowledge of identification of marine living resources in EEZ is required to harness full potential of commercial fishery. Phytoplankton forms the first link in the ocean food chain and gives an indication about the standing stock of green biomass, which helps in predicting the third level productivity. Today, satellite-based observing systems having narrow spectral bands in the visible region are providing better insight into our understanding of the ocean productivity. They also provide better understanding of the role played by ocean productivity in the uptake of carbon dioxide from atmosphere. IRS P4 Ocean Colour Monitor (OCM) has been providing ocean colour data every two days for the Indian regions. The potential Fishing Zone (PFZ) maps are generated based on oceanographic features such as thermal boundaries, fronts, eddies, rings, gyres, meanders and up welling regions (Narain et al. 1992, Solanki et al. 2003). The chlorophyll and SST, derived from OCM and NOAA AVHRR have been integrated to provide fishery forecast to predict likely availability of fishes more accurately (Solanki et al. 1998, 2001, Dwivedi, et al. 2002). The ocean colour data provide information about the availability of food in a column. The SST defines the environment of the ocean. It was observed that wherever, the boundaries/fronts/gradients of the chlorophyll and SST coincide are ideal sites for the fish aggregation. Such sites are the indicate coupling between biological and physical processes, and hence fish tend to aggregate. These forecasts are valid for three days and are updated every second day. It was observed that this technique is quite useful for pelagic and demersal fishery (Fig. 5). In India, this technique is operationally used and forecasts are provided to about 240 fishing harbours routines by the Indian National Centre for Ocean Information Service (INCOIS), Hyderabad. It was observed that such forecast are 70-90 per cent accurate results in 70-100 per cent increase in catch, both pelagic and demersal (Solanki et al. 2003). The benefit to cost ratio has increased from 1.3 to 2.1 for those fishermen who have used satellite-based fishery forecast (Nayak et al. 2002). The information on sea-surface wind is being integrated to increase of validity of forecast. Initial results indicate quite a good promise. Apart from this, new resources through sea ranching and mari-culture in enclosed and semi-enclosed bodies will have to be tapped. Efforts are continuing to predict primary productivity and link it to fish stock using ocean colour data. The bio-geographical zoning of the Indian waters is under progress. All these efforts will lead to achieve food self-sufficiency in developing countries.
Status of Coastal Habitats of Marine National Park, Gulf of Kachchh (using
satellite data)
0
50
100
150
200
250
300
1975 1986 1993 1998 2000 2001
Are
a (s
q km
)
Total mangroves Dense mangrovesSparse mangroves ReefMud over reef
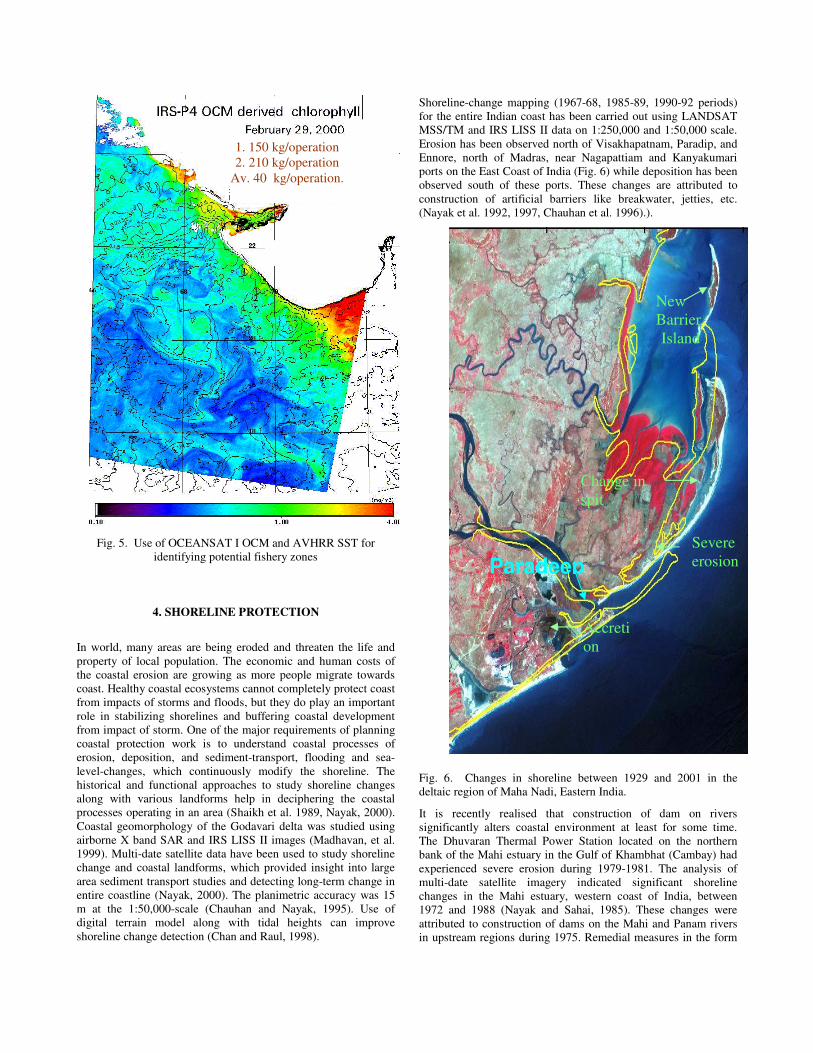
Fig. 5. Use of OCEANSAT I OCM and AVHRR SST for identifying potential fishery zones
4. SHORELINE PROTECTION
In world, many areas are being eroded and threaten the life and property of local population. The economic and human costs of the coastal erosion are growing as more people migrate towards coast. Healthy coastal ecosystems cannot completely protect coast from impacts of storms and floods, but they do play an important role in stabilizing shorelines and buffering coastal development from impact of storm. One of the major requirements of planning coastal protection work is to understand coastal processes of erosion, deposition, and sediment-transport, flooding and sea-level-changes, which continuously modify the shoreline. The historical and functional approaches to study shoreline changes along with various landforms help in deciphering the coastal processes operating in an area (Shaikh et al. 1989, Nayak, 2000). Coastal geomorphology of the Godavari delta was studied using airborne X band SAR and IRS LISS II images (Madhavan, et al. 1999). Multi-date satellite data have been used to study shoreline change and coastal landforms, which provided insight into large area sediment transport studies and detecting long-term change in entire coastline (Nayak, 2000). The planimetric accuracy was 15 m at the 1:50,000-scale (Chauhan and Nayak, 1995). Use of digital terrain model along with tidal heights can improve shoreline change detection (Chan and Raul, 1998).
Shoreline-change mapping (1967-68, 1985-89, 1990-92 periods) for the entire Indian coast has been carried out using LANDSAT MSS/TM and IRS LISS II data on 1:250,000 and 1:50,000 scale. Erosion has been observed north of Visakhapatnam, Paradip, and Ennore, north of Madras, near Nagapattiam and Kanyakumari ports on the East Coast of India (Fig. 6) while deposition has been observed south of these ports. These changes are attributed to construction of artificial barriers like breakwater, jetties, etc. (Nayak et al. 1992, 1997, Chauhan et al. 1996).).
Fig. 6. Changes in shoreline between 1929 and 2001 in the deltaic region of Maha Nadi, Eastern India.
It is recently realised that construction of dam on rivers significantly alters coastal environment at least for some time. The Dhuvaran Thermal Power Station located on the northern bank of the Mahi estuary in the Gulf of Khambhat (Cambay) had experienced severe erosion during 1979-1981. The analysis of multi-date satellite imagery indicated significant shoreline changes in the Mahi estuary, western coast of India, between 1972 and 1988 (Nayak and Sahai, 1985). These changes were attributed to construction of dams on the Mahi and Panam rivers in upstream regions during 1975. Remedial measures in the form
1. 150 kg/operation 2. 210 kg/operation
Av. 40 kg/operation.
Severe erosion
Accretion
Paradeep
Change in spit
New Barrier Island

of diaphragm wall and spurs ave certainly helped to check the erosion. Recently available high-resolution images will be extremely useful for such analysis.
The knowledge about suspended sediment movement helps in understanding near-shore water flow. In one such study, a sediment plume emerging from the Kochi harbour made a sharp contact with the sediments along the coast indicating two different water masses. This clearly indicated that the plume is acting as obstruction to the sediment movement. This had resulted in erosion on the southern coast and deposition on the northern coast. The IRS P4 OCM data are extremely useful to study sediment dispersal and sediment transport studies due to their 2-day repeat cycle. The sequential nature of OCM helped in understanding sediment movement along the coast. OCM data has been used for computing advective velocity of surface currents (Prasad et al. 2002).
5. MARINE WATER QUALITY
Anthropogenic activities such as discharge of industrial and municipal sewage, land use, tourism, maritime transport, offshore oil exploration and production, dumping at sea degrade the marine environment. Turbidity, temperature and colour are indicators of water quality. Chlorophyll indicates trophic status, nutrient load and possibility of pollutants in coastal waters. Suspended sediments affect navigation, fisheries, and aquatic life, recreation potential of sea resorts. As the suspended sediments carry absorbed chemicals and fronts are associated with pollutants, the knowledge about their movement will help in predicting waste effluent transportation path. Suspended sediments are easily observed on the satellite imagery. Tides play an important role in the movement of suspended sediments and fronts (Nayak and Sahai, 1985). Successive images from IRS P4 OCM have been used for understanding impact of tides on sediments in tide- and wave-dominated regions. A distinct front was observed separating the Gulf waters and the Arabian Sea, western India under different tidal conditions. This suggests that there is very little mixing between these two waters. Hence the pollutants discharged in the Gulf will circulate within the Gulf and ultimately will settle in the Gulf itself.
Municipal sewage and industrial waste are major types of pollution observed on the coast. Toxic chemicals, nutrients, sediments and solid waste discharged in to coastal waters affect coastal ecosystems. Such waste out-falls are difficult to detect as near shore waters are turbid. Some of the effluents have colour and can be detected. One such waste out-fall from titanium factory near Thiruvananthapuram and sugar mill discharge near the Kakinada Coast, West and east coast of India were traced using high- resolution satellite data, respectively (Fig. 7). Indian coastal waters are relatively free from pollution except few pockets around industrialised zones and large cities.
Oil spills from vessels and platforms are infrequent. In such cases, oil rises to surface and spread across the water body and thus amenable to remote detection. In one such study, IRS P4 OCM data was used for monitoring oil slick occurred in the Gulf of Kachchh. However, 2-day repeat cycle of OCM data is not adequate for monitoring slick in tide-dominated areas. Satellite
surveillance is possible if high-resolution remote- sensing geo-synchronous satellite is available. Smaller spills from vessels, maintenance of oil infrastructure is a major source and is not detected on satellite images. Systematic observation with high-resolution satellite data will be helpful to study their effect on coastal habitats.
Fig. 7. A plume from a sugar factory and its dispersion (dark colour) in the Kakinada Bay, Eastern India.
Incidences of harmful algal blooms have increased worldwide. They may occur with cyclic regularity in certain regions where certain optimum environmental conditions prevail in marine waters. These planktons produce certain toxins, which adversely affect fish and other organisms. The bloom usually takes place rather suddenly and may spread with amazing speed, changing colour of surface water into red, green or hay colour. CZCS-derived chlorophyll map was used to study such bloom in the Baltic Sea. IRS P4 OCM data have been used to monitor Trichodesium bloom in the Arabian Sea using OCM data.
6. MARINE ENVIRONMENT AND CLIMATE CHANGE The marine environment is sensitive and vulnerable to climate change. It is necessary to determine present status of the various systems and to predict future conditions. The high degree of uncertainty in present information inhibits effective management and limits the ability to make predictions and assess environmental change. Systematic collection of data on marine environment needed to apply integrated management approaches and predict effect of global climate change. Global climate change may compound pressures on coastal ecosystems through warmer sea surface temperature, altered ocean circulation patterns, changing storm frequency and rising sea levels. It was observed on IRS P4 images that productivity of the coastal waters of the Orissa coast increased after the cyclone (Nayak et al. 2001). The frequency of cyclone has also increased during last several years. It may be interesting to see long-term impact on productivity in view of global warming.

Coral bleaching can occur due to increase in temperatures 1°-2° C higher than average in the warm season. Coral bleaching provides a direct indicator of the condition of coral reefs. In last two decades, incidence of mass bleaching has been increasingly observed (Goreau and Hayes, 1994, Goreau, et al. 1997). NOAA SST data have been extensively used to study the relationship between increase in SST and coral bleaching (NOAA, 1998, ICRS, 1998). It is possible to predict coral bleaching by monitoring SST (Strong, 1998). The wide spread coral bleaching observed during 1997-98 is an example of the effect of elevated SST. This event of bleaching on the Lakshadweep Islands, India was also recorded using IRS LISS III data (Fig. 8). Fig. 8. Coral beaching seen on IRS LISS III image during 1998.
The sea level rise is highly variable both in terms of time and space. Various estimates for the Indian coast vary from 0.5 to 2.2 mm per year. It is expected that the rise in sea level will lead to increased erosion and habitat loss, increased salinity in estuaries, alter tidal range, change sediment transport and increase coastal flooding. Rising levels will also increase impact of storm surges. The response of different ecosystems to sea level rise has been evaluated based on their characteristics for the Gujarat coast (Nayak, 1994). Small increase in sea level has potential of causing significant changes to small islands and low-lying coasts. It seems that conservation of mangrove areas will be one of the important step to mitigate impact of the sea level rise (Baba and Nayak, 2002).
7. COASTAL ZONE MANAGEMENT
The management of coastal zone requires data on varied aspects as discussed earlier. Information exists in form of thematic maps as well as non-spatial format. Thus it is difficult to integrate these data conventionally. It is, therefore necessary to develop a computer-based information system composed of comprehensive and integrated set of data designed for decision-making. In this remote-sensing-based management plan, basic input about coastal areas is derived from remote sensing data. Integration of this thematic data with other secondary data would lead to identification of suitable sites, initial zoning, sea protection plan, eco-system conservation, etc.
7.1 Brackish Water Aquaculture Site Selection In India, the aquaculture development started with essentially to provide employment in rural coastal areas as well as to increase the export to developing countries. Aquaculture development and planning require comprehensive data on land use and water resources. IRS LISS II data was utilised to prepare coastal land use maps on 1:50,000 scale along the Indian coast. These maps show wetland features between high and low water lines and land use features of the adjoining shore (up to 1.5 km from high waterline). The land use/wetland information has been used for evaluating quality of the surrounding coastal waters, as this information was not available in most of the cases. The spatial distribution of mud/tidal flat areas, which are most suitable from substrate condition point of view give idea about potential available for brackish water aquaculture. These maps have been used by the Central and State Fisheries departments for evaluating proposed sites as well as for selecting new sites and reassessing potential for brackish water aquaculture. These maps along with other engineering, biological, meteorological, socio-economic and infrastructure related parameters were integrated using GIS for evaluating site suitability (Gupta et al. 1995, 2001). Site evaluation is carried out to determine whether site is suitable or not and to appreciate about requirements to make the site suitable (Fi.g. 9) This procedure had ensured development for brackish water aquaculture with minimum damage to the ecology of the area.
Fig. 9. Prioritised aquaculture sites selected based on integration
of remote-sensing-based coastal land use and other ecological, engineering, infrastructure related data in GIS
7.2 Coastal Regulation Zone The increasing pressure on the coastal zone due to concentration of population, development of industries, discharge of waste effluents and municipal sewage and spurt in recreational activities, has adversely affected the coastal environment. The population of coastal districts is increasing through out the coastal areas in the world. In India, the population on coastal regions is
Bleaching in 1998

likely to increase to from 15 per cent at present to almost 40 per cent in next decade. In view of this, coastal stretches of bays, estuaries, backwaters, seas, creeks, which are influenced by tidal action up to 500 m from High Tide Line (HTL) and the land between the Low Tide Line (LTL) and the HTL has been declared as the Coastal Regulation Zone (CRZ). Maps showing wetland features between HTL and LTL and coastal land use features up to 500 m from HTL on 1:25,000 scales for the entire Indian coast, using IRS LISS II and SPOT data were prepared. These maps provided condition of land use and wetlands during 1990-91, just before the notification of CRZ issued by the Govt. of India (fig. 10 a). These maps are 85 per cent accurate at 90 per cent confidence level. The planimetric accuracy is 20-50 m. It was observed that large-scale reclamation of wetlands have been carried out for residential, industrial, commercial and agricultural purposes. Temporal nature of the IRS data has been used to prove time of reclamation in few cases. These coastal land use maps were integrated with the other information related to ecology, tourism, archaeological sites, etc. for classifying coastal zone into four classes (fig. 10b). CRZ I areas are ecologically sensitive and most activity are restricted or prohibited in this zone. CRZ II is developed area and construction activities are permitted under certain condition. CRZ III is undeveloped area and limited activities are permitted. All islands are classified as CRZ IV and no construction activities are permitted. Such maps are prepared for the entire India’s coastline using satellite data CRZ maps are being used by the State Governments to prepare coastal zone management plans (Gupta et al. 2000). Recently, Govt. of India has issued a notification to use satellite data for preparation of 1:25,000 scale maps for regional planning. The recent availability of the high-resolution data has helped to prepare local level maps on 1:5,000-scale for implementation of CRZ measures. The interaction between various activities conducted in the coastal zones need to be assessed. This would ensure judicious develop-ment of coastal zone without endangering the environment and ecology.
Acknowledgements
I am extremely grateful to Dr. K. N. Shankara, Director, and Dr. K. L. Majumdar, Deputy Director, Space Applications Centre, Ahmedabad for his valuable support and constant encouragement. Thanks are to my colleague Dr. Anjali Bahuguna, Dr. M. C. Gupta, Shri A. S. Rajawat, Shri H. U. Solanki and Shri H. B. Chauhan, for helping me for preparing the manuscript.

Fig. 10. Coastal land use map (7.5’ x 7.5’ ) prepared using IRS LISS II and PAN merged data (a) and coastal regulation zones (b).
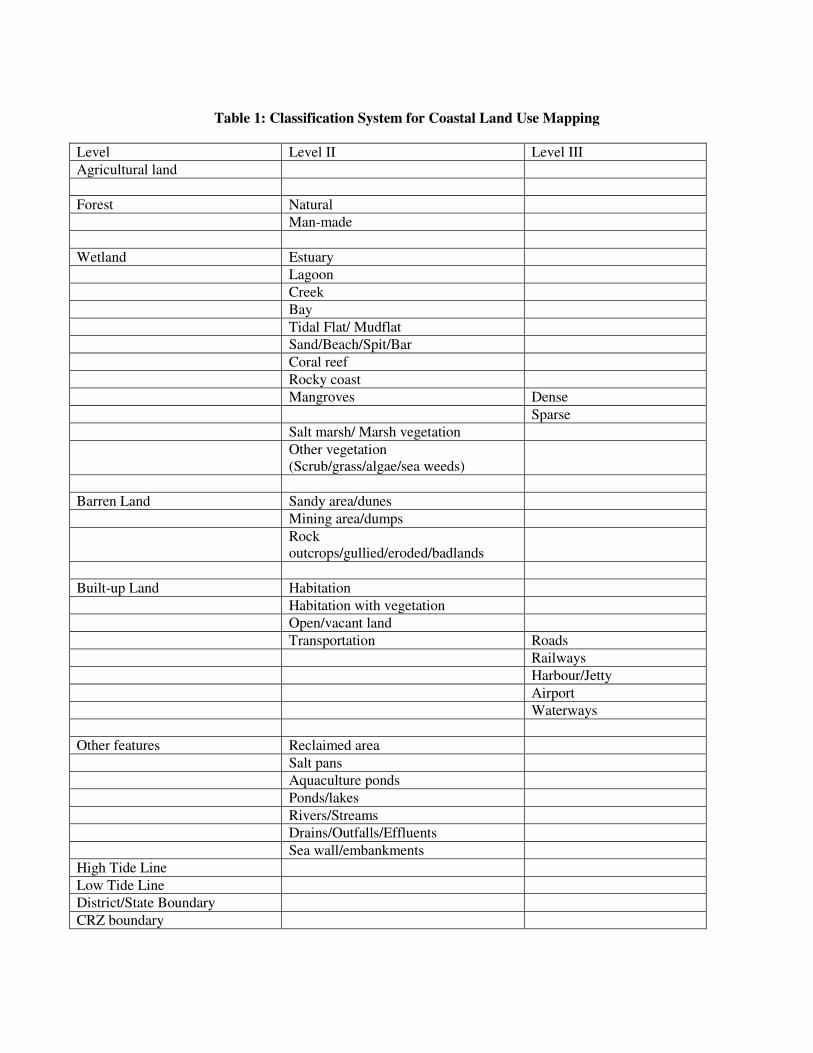
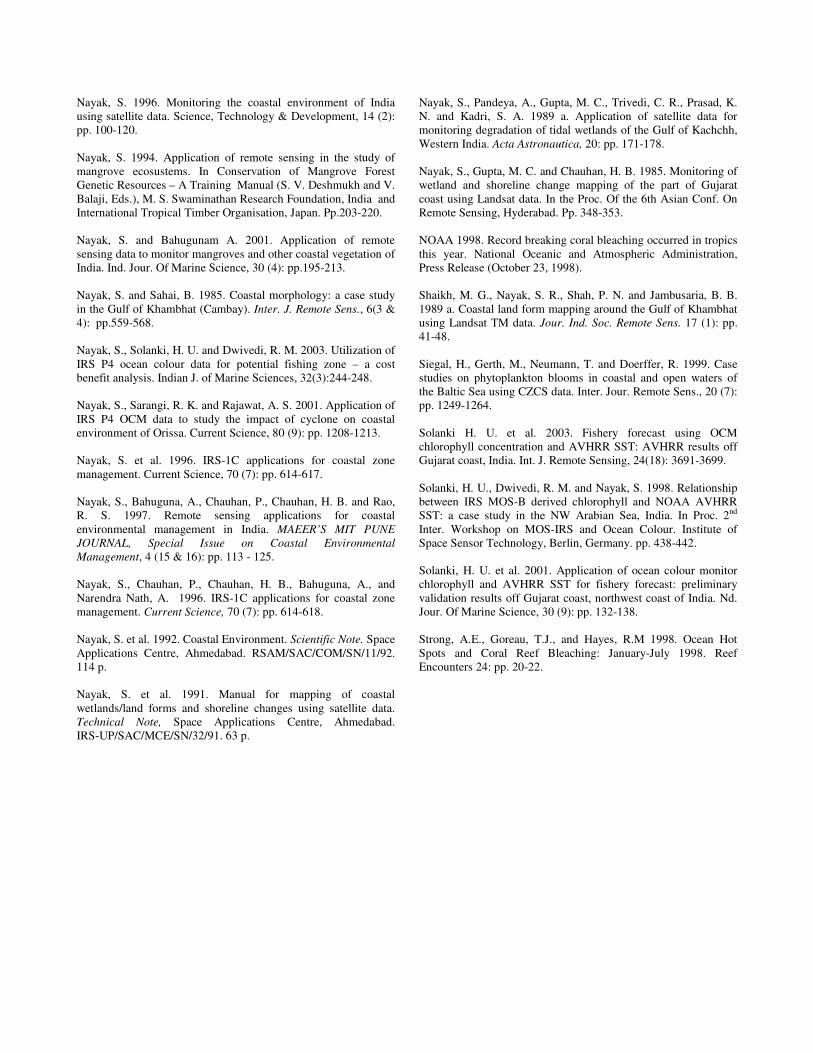
Table 1: Classification System for Coastal Land Use Mapping Level Level II Level III Agricultural land Forest Natural Man-made Wetland Estuary Lagoon Creek Bay Tidal Flat/ Mudflat Sand/Beach/Spit/Bar Coral reef Rocky coast Mangroves Dense Sparse Salt marsh/ Marsh vegetation Other vegetation
(Scrub/grass/algae/sea weeds)
Barren Land Sandy area/dunes Mining area/dumps Rock
outcrops/gullied/eroded/badlands
Built-up Land Habitation Habitation with vegetation Open/vacant land Transportation Roads Railways Harbour/Jetty Airport Waterways Other features Reclaimed area Salt pans Aquaculture ponds Ponds/lakes Rivers/Streams Drains/Outfalls/Effluents Sea wall/embankments High Tide Line Low Tide Line District/State Boundary CRZ boundary

REFERENCES Anon. 1992. Agenda 21, United Nations Conference on Environment and Development, Rio de Janeiro, Brazil, June 3-14, 1992. pp. 215-249. Baba, M. and Nayak, S. 2002. Muddy coasts of India. In Muddy Coasts of the World: Processes, Deposits and Function (Eds. T. Healy, Y. Wang and J. A. Healy). Elsevier Science B. V. pp. 375-390. Bahuguna, A. and Nayak, S. 1998. Coral reefs of Indian Coast. Scientific Note, Space Applications Centre, Ahmedabad. SAC/RSA/RSAG/DOD-COS/SN/16/98, 56 p. Blasco, F. and Aizpuru, M. 2002. Mangrove along the coastal stretch of the Bay of Bengal: present status. Indian Jour. Of Marine Sci. 31(1): pp. 9-20. Chan, L. C. and Rau, J. Y. 1998. Detection of shoreline changes for tideland areas using multi-temporal satellite images. Inter. Jour. Remote Sens., 19(17): pp. 3383-3398. Chauhan, P., Nayak, S., Ramesh, R., Krishnamoorthy, R. and Ramachandran, S. 1996. Remote sensing of suspended sediments along the Tamil Nadu Coastal waters. J. Ind. Soc. Remote Sensing, 24 (3): pp.105-114. Chauhan, P. and Nayak, S. 1995. Shoreline Change – mapping from space: a case study on the Indian coast. Inter. In the proc. Of the Workshop on International Mapping from Space. IRS & ISPRS WG IV/2, pp.130-140. Desai, P.S., Narain, A., Nayak, S. R., Manikiam, B., Adiga, S. and Nath, A. N. 1991. IRS 1A applications for coastal and marine resources. Current Science, 61 (3 & 4): pp..204-208. Dwivedi, R. M. et al. 2002. Potential of onboard IRS P4 (OCM) for exploration of scombroids in the Indian seas. In Management of Scombroid Fishery, CMFRI, Kochi, pp. 82-89. Gao, J. 1999a. A comparative study on spatial and spectral resolutions of satellite data in mapping mapping mangrove forests. Inter. Jour. Of Remote Sens., 20 (14): pp. 2823-2833. Gao, J. 1999b. Evaluation of SPOT HRV data in mapping mangrove forests in a temperate zone. Geocarto International, 14 (3): pp. 43-50. Gao, J. 1998. A hybrid method towards accurate mapping of mangroves in a marginal habitat from SPOT multi-spectral data. Inter. Jour. Remote Sens., 19 (10) : pp. 1887-1900. Goreau, T.J., and Hayes, R.M., 1994. Coral bleaching and ocean “Hot spots”. Ambio 23: pp. 176-180. Goreau T.J., and Hayes, R.M., and Strong, A.E., 1997. Tracking south pacific coral reef bleaching by satellite and field observations. Proc. Of the 8th International Coral Reef Symposium 2: pp.. 1491-1494.
Green, E. P., Clark, C. D., Mumby, P. J., Edwards, A. J. and Ellis, A. C. 1998. Remote Sensing techniques for mangrove mapping. Inter. Jour. Remote Sens., 19 (5): pp. 935-956. Gupta, M. C. et al. 1995. Brackish water aquaculture site selection using techniques of Geographical Information System (GIS). Scientific Note, Space Applications Centre, Ahmedabad. RSAM/SAC/CMASS/SN/08.95. 56 p. Gupta, M. C., Krishnarajan, V. P. and Nayak, S. 2001. Brackish water aquaculture site selection in coastal tract of Cannore (Kerala) using remote sensing and GIS techniques. Jour. Ind. Soc. Remote Sens., 29 (1&2): pp. 80-83. Gupta, M. C. et al. 2000. Coastal zone management plan for Gujarat. GIS@development, 4 (12): pp.24-25. ICRS 1998. Statement on Global Coral Bleaching in 1997-1998. International Coral Reef Society, October 15 1998. Jagtap, T. G., Nayak, S. and Nagle, V. L. 2001. Assessment of coastal wetland resources of central west coast, India using Landsat data. Jour. Ind. Soc. Remote Sens., 29 (3): pp.143-150. Kushwaha, S. P. S., Dwivedi, R. S. and Rao, B. R. M. 2000. Evaluation of various digital image processing techniques for detection of coastal wetlands using ERS-1 SAR data. Inter. Jour. Remote Sens., 21 (3): pp.565-579. Madhavan, B. B., Venkataraman, G., Krishna Mohan, B. and Shah, S. D. 1999. Airborne SAR and IRS 1A LISS II data interpretation of coastal geomorphology in the Godavari delta, India. Geocarto International, 14 (2): pp..51-60. Miller, R. L. and Cruise, J. F. 1995. Effects of suspended sediments on coral growth: evidence from remote sensing and hydrologic modelling. Remote Sens. Envi. 53 (3): pp. 177-187. Mumby, P. J., Clark, C. D., Green, E. P. and Edwards, A. J. 1998. Benefits of water column correction and contextual editing for mapping coral reefs. Inter. Jour. Remote Sens. 19 (1): pp. 203-210. Narain, A., Beenakumari, S. and Raman, M. 1992b. Observation of a persistent coastal upwelling off Gujarat by NOAA AVHRR and its implication on fisheries. Remote Sensing Applications and Geographic Information Systems: Recent Trends. Tata-McGraw Hill, New Delhi. pp. 337-341 Nayak, 2002. Use of satellite data in coastal mapping. Indian Cartographer, 22; 147-156. Nayak, S. 2000. Critical issues in coastal zone management and role of remote sensing. In Subtle Issues in Coastal Management, Indian Institute of Remote Sensing, Dehradun. Pp. 77-98. Nayak, S. 2000. Quaternary geomorphology of the Gujarat coast – an overview. Ind. Jour. Of Geomorphology, 5 (1&2): pp.9-22.
Nayak, S. 1996. Monitoring the coastal environment of India using satellite data. Science, Technology & Development, 14 (2): pp. 100-120. Nayak, S. 1994. Application of remote sensing in the study of mangrove ecosustems. In Conservation of Mangrove Forest Genetic Resources – A Training Manual (S. V. Deshmukh and V. Balaji, Eds.), M. S. Swaminathan Research Foundation, India and International Tropical Timber Organisation, Japan. Pp.203-220. Nayak, S. and Bahugunam A. 2001. Application of remote sensing data to monitor mangroves and other coastal vegetation of India. Ind. Jour. Of Marine Science, 30 (4): pp.195-213. Nayak, S. and Sahai, B. 1985. Coastal morphology: a case study in the Gulf of Khambhat (Cambay). Inter. J. Remote Sens., 6(3 & 4): pp.559-568. Nayak, S., Solanki, H. U. and Dwivedi, R. M. 2003. Utilization of IRS P4 ocean colour data for potential fishing zone – a cost benefit analysis. Indian J. of Marine Sciences, 32(3):244-248. Nayak, S., Sarangi, R. K. and Rajawat, A. S. 2001. Application of IRS P4 OCM data to study the impact of cyclone on coastal environment of Orissa. Current Science, 80 (9): pp. 1208-1213. Nayak, S. et al. 1996. IRS-1C applications for coastal zone management. Current Science, 70 (7): pp. 614-617. Nayak, S., Bahuguna, A., Chauhan, P., Chauhan, H. B. and Rao, R. S. 1997. Remote sensing applications for coastal environmental management in India. MAEER’S MIT PUNE JOURNAL, Special Issue on Coastal Environmental Management, 4 (15 & 16): pp. 113 - 125. Nayak, S., Chauhan, P., Chauhan, H. B., Bahuguna, A., and Narendra Nath, A. 1996. IRS-1C applications for coastal zone management. Current Science, 70 (7): pp. 614-618. Nayak, S. et al. 1992. Coastal Environment. Scientific Note. Space Applications Centre, Ahmedabad. RSAM/SAC/COM/SN/11/92. 114 p. Nayak, S. et al. 1991. Manual for mapping of coastal wetlands/land forms and shoreline changes using satellite data. Technical Note, Space Applications Centre, Ahmedabad. IRS-UP/SAC/MCE/SN/32/91. 63 p.
Nayak, S., Pandeya, A., Gupta, M. C., Trivedi, C. R., Prasad, K. N. and Kadri, S. A. 1989 a. Application of satellite data for monitoring degradation of tidal wetlands of the Gulf of Kachchh, Western India. Acta Astronautica, 20: pp. 171-178. Nayak, S., Gupta, M. C. and Chauhan, H. B. 1985. Monitoring of wetland and shoreline change mapping of the part of Gujarat coast using Landsat data. In the Proc. Of the 6th Asian Conf. On Remote Sensing, Hyderabad. Pp. 348-353. NOAA 1998. Record breaking coral bleaching occurred in tropics this year. National Oceanic and Atmospheric Administration, Press Release (October 23, 1998). Shaikh, M. G., Nayak, S. R., Shah, P. N. and Jambusaria, B. B. 1989 a. Coastal land form mapping around the Gulf of Khambhat using Landsat TM data. Jour. Ind. Soc. Remote Sens. 17 (1): pp. 41-48. Siegal, H., Gerth, M., Neumann, T. and Doerffer, R. 1999. Case studies on phytoplankton blooms in coastal and open waters of the Baltic Sea using CZCS data. Inter. Jour. Remote Sens., 20 (7): pp. 1249-1264. Solanki H. U. et al. 2003. Fishery forecast using OCM chlorophyll concentration and AVHRR SST: AVHRR results off Gujarat coast, India. Int. J. Remote Sensing, 24(18): 3691-3699. Solanki, H. U., Dwivedi, R. M. and Nayak, S. 1998. Relationship between IRS MOS-B derived chlorophyll and NOAA AVHRR SST: a case study in the NW Arabian Sea, India. In Proc. 2nd Inter. Workshop on MOS-IRS and Ocean Colour. Institute of Space Sensor Technology, Berlin, Germany. pp. 438-442. Solanki, H. U. et al. 2001. Application of ocean colour monitor chlorophyll and AVHRR SST for fishery forecast: preliminary validation results off Gujarat coast, northwest coast of India. Nd. Jour. Of Marine Science, 30 (9): pp. 132-138. Strong, A.E., Goreau, T.J., and Hayes, R.M 1998. Ocean Hot Spots and Coral Reef Bleaching: January-July 1998. Reef Encounters 24: pp. 20-22.