Embed Size (px)
Citation preview

Presentation by Rodrigo Custodio
Iacutelhavo January 2019
Roland Bergeracutes global automotive supplier study highlights
2RB - Global automotive supplier study highlights 23012019pptx
We are one of the largest strategic consultancies with a strong expertise in the automotive area
Our profile Our competence matrix
Our automotive practice Our values
Created in 1967in Germany by Prof Dr Roland Berger
50 offices in36 countries with2400 employees
Over 240 Partners
~1000 international clients
1993Brussels | Kiev |
Prague |
1994Moscow
1995Beijing
1997Budapest | Zuumlrich
2002Amsterdam
1998Detroit | Shanghai
2000Warsaw
2003Zagreb
2006Manama
2007Chicago | Hong Kong |Beirut
2008Casablanca | Istanbul | Taipei
2009Doha
2010Stockholm | Goteborg |
Singapore
2011Dubai | Kuala Lumpur |
Lagos | Jakarta
2012Seoul | New Delhi |
Guangzhou |Montreal | Boston
2013Mumbai
2014Bangkok | Pune
1967
1969
1976
1982
1986
Munich
Milan
Satildeo Paulo
1987Stuttgart
Duumlsseldorf
Madrid
1989Frankfurt | Vienna
1990Berlin | Hamburg |Lisbon | London |Paris
1991Tokyo
1992Bucharest
Source Roland Berger
Overview of Roland Berger
ExcellenceWe achieve excellent results and develop global best practices to ensure measurable and sustainable success
EmpathyWe are insightful and responsible advisors and
we contribute to the greater good
EntrepreneurshipWe follow an entrepreneurial approach and provide creative and pragmatic solutions
3RB - Global automotive supplier study highlights 23012019pptx
The global automotive industry has presented a growth of 3 in recent years
World
North America Europe3) China4)
JapanKorea
CAGR2) 24 CAGR2) 29 CAGR2) 86
CAGR2) 31 CAGR2)-10
2018
170
2016
178
20172015
-2
174
2013
170
2012 2014
175154 162
2012 20152014
201 210
2013
222
2016
193 215195
2017
-1
2018
220 273
2016
-3
280274
2017
240
2014
230213
20152013
186
2012 2018
South America
CAGR2) -52
2018
35
2013
332731
2014
45
201720162015
+5
3843
2012
132
20182016
0
129
2015
133
2017
133137
20142013
135
2012
139
0
2017
947
20182013
874815
2012
888
2015
847
2016
931
2014
951
Global light vehicle production volume1) by region 2012-2017 [m units]
Source IHS Roland Berger
1) Incl light commercial vehicles 2) CAGR 2012-2017 3) Excluding CIS and Turkey 4) Greater China
4RB - Global automotive supplier study highlights 23012019pptxSource Company information analyst forecasts Lazard Roland Berger
The stability of past industry years have yielded consecutive years of good supplier performance have
Revenue growth EBIT1) margin []
33555413
29
142138131
124118
113
100
20122010 2011 2013 2014 2017e2015
~147
2016
72707371
686871
2015 2017e
~73
2012 20132010 2011 2014 2016
Key supplier performance indicators 2010-2017e (n=~650 suppliers)
1) EBIT after restructuring items
Indexed [2010=100]
YoY []
5RB - Global automotive supplier study highlights 23012019pptx
Valuation of suppliers have increased while of OEMs have remained under pressure
Sources Fact set Roland Berger
PE NTM1)
1x
3x
5x
7x
9x
11x
13x
15x
17x
19x
21x
23x
25x
27x
29x
nov-
07
nov-
08
nov-
09
nov-
10
nov-
11
nov-
12
nov-
13
nov-
14
nov-
15
oct-
16
nov-
17
gt In recent years the valuation figures for suppliers have been significantly higher than those for OEMs
gt The valuation gap has hit an all-time high ndash The valuations of suppliers are almost twice as high as those of OEMs
gt Risks arising from disruptive trends appear to have been priced in to OEM valuations ndashThat does not seem to be the case for supplier valuations
Selected automotive OEMs3) Selected automotive suppliers4)
Under the influence of the economic crisis
10-y-avg = 112x2)
80x
10-y-avg = 90x2)
133x
Trend in the valuations of OEMs and suppliers
1) NTM = next twelve months 2) Excluding the distortions triggered by the economic crisis (figures for Jan-Dec 2009) 3) BMW Daimler Ford General Motors Honda Toyota and Volkswagen 4) American Axle Autoliv BorgWarner Brembo Continental Dana Delphi Faurecia Hella Johnson Controls Magna Norma and Valeo
6RB - Global automotive supplier study highlights 23012019pptx
Tim Cook (CEO Apple Inc)
Dieter Zetsche (CEO Daimler AG)
The automotive industry
has reached a
dramatic turning
point with huge changes
Right now we are exper-
iencing the second
invention of the
automobile
Sources Press Roland Berger
The industry is being looked by its own executives and by new interested parties with different eyeshellip
7RB - Global automotive supplier study highlights 23012019pptx
hellipand therefore is already going through significant changes
Prices of used
diesel vehicles1) []
Time in stock with dealers for diesel
vehicles 2016-2018 [days]
Sources Schwacke DAT Roland Berger
Diesel trends
2016 2017 2018
110
105
100
95
90
85
80
75
0
+25
Diesel
Gasoline
1
102
89
12
102
85
11
110
85
10
85
86
3
87
90
2
85
93
1
88
94
100
81
9
96
77
8
101
80
7
94
78
6
95
79
5
99
85
4
94
82
3
98
89
2
99
91
1
97
92
12
96
88
11
95
86
10
94
87
9
92
86
8
88
83
7
81
80
6
80
79
5
83
82
4
56
55
54
53
52
51
50
0
20182017201620152014
Gasoline
Diesel
Avg relative residual price for 3-year-old vehicles with mileage of 60000 km
70
65
60
55
50
0115 0715 0116 0716 0117 0717 0118
0
45
30
35
40 FR
UK
DE
IT
ES
-12
-13
0
-15
-10
Diesel engines as a proportion of
new registrations 2015-12018 []
8RB - Global automotive supplier study highlights 23012019pptx
The speed is cacthing OEMs still unprepared eg difficult adaptation to the new WLTP regulation by OEMs impacted the value chain
Impact of WLTP on the automotive market
There have been several OEMs that have delayed projects that were expected for 2018 (especially during the second half of the year) due to their difficulties to cope with the WLTP1)
regulation
Tier 1 supplier (Spain)
The situation in the market is not stable and OEMs prefer to be conservative I think that most of the reasons are conjunctural We are living an uncertainty political situation and that is why the market is waiting but from my point of view automotive market will change very fast and the growth is going to be
important
Tier 1 supplier (Spain)
The automotive market has been very instable for players across the value chain with sales and profitability lower than expected (proven by the profit warnings issued by many companies in the industry) ndashAll the players are suffering due to the declines in volumes produced and the delays in vehicle launches We dont expect this situation to last any longer
Tier 1 supplier (Spain)
Source Expert Interviews Roland Berger
The OEMs had some projects planned from several years ago (eg some new models with diesel engines or facelifts of their traditional models) that could not be launched any more They are updating these projects or questioning if some of them still make sense Most of those projects will be launched in their new electric versions
from 2020 onwards
Mold manufacturer (Portugal)
9RB - Global automotive supplier study highlights 23012019pptx
There are mainly for disruptive trends that are transforming the automotive industry ndash MADE by Roland Berger
Automotive disruption
Technology andregulatory progress
High customer value and improved safety
Consequences for current cars small vehicles LCVs
After-salesserviceimpact
2 Autonomous
Connectivity
AI
Evolution of digital technologies and culture
Full integration of the connected vehicle in
customers everyday life
3 Digitization
Strategy
How to position
Transformation
How to transform
Alternative
fuels
Automated
driving
Non-traditional
entrants
ICE
advancement
Mobility
solutions
Startup
OEMs
Connectivity
Low-cost
brands
New
retail
Geographic
shift
Source Roland Berger
Changing customer behavior (sharing vs owning)
Urbanization changing traditional mobility and logistics
concepts
New mobility mix and new business modelsplayers
1 New mobility
Compliance with future emissions regulations
Electrification landscape including infrastructure
Profitability challenges
China as a benchmark
4 Electrified
Powertrain
electrification
Emissions
regulations
Light-
weighting
Fuel
cells
10RB - Global automotive supplier study highlights 23012019pptx
The automotive end game appears inevitable yet the transition period is marked by considerable uncertainty
TimeToday
Degree of change
2020 2025 2030
North Americagt Deep penetration of ride hailing in major metropolitan
areasgt Technology leadership in highly automated drivinggt Strong regulatory support
Chinagt Strong push and high maturity for electrificationgt Deep penetration of ride hailing in major
metropolitan areasgt Strong players pushing for
autonomous drivinggt Fast regulatory
decisions
Europegt High population density in cities ndash
ideal for robocabsgt Stringent emissions regulation
driving electrificationgt Slow regulatory processes
Emerging marketsgt Less stringent emissions regulations delaying
the spread of electric vehiclesgt Growing adoption of ride hailing in major citiesgt Autonomous driving limited by lacking
infrastructure and driving behavior
Scenario development (applicable to light vehicles)
Sources Lazard Roland Berger
2030+
11RB - Global automotive supplier study highlights 23012019pptx
New business models focused on short-duration use cases are carving out segments from traditional markets
Vehicle use cases by duration
Source Roland Berger
Car rentalCar sharing Ride sharing
Car ownership
Taxi
New business models
Days
gt Business trips
gt Car replacement during repairs
gt Vacations Road trips
gt Long distance moves
gt hellip
Hours
gt Shopping excursions (long dist)
gt Day trips
gt Back-up vehicle in emergencies
gt Short distance moves
gt hellip
Minutes
gt Shopping excursions (short dist)
gt Rides to places with limited parking
gt Trips home while intoxicated
gt hellip
Mobility
12RB - Global automotive supplier study highlights 23012019pptx
1 bn
In its home market of San Francisco Ubers size relative to the taxi industry is proof of its impact on car rental and ownership
gt Only 50 m from
traditional taxi business
gt New market created ndash at the expense of all players
gt Example Ownership
- 30 of current lease customers in SFO will not renew lease
- Shift towards revenue generation for consumers (renting garage)
SFO metro area ndash Revenues pa [USD]
Source Press research Roland Berger
Taxi
post-Uber
Taxi
pre-Uber
ndash Direct from taxi business
200
140
50
Mobility
13RB - Global automotive supplier study highlights 23012019pptx
66
109
16
00 03
Singapore
27
00
00
01
27
China
07
88
0112
India
00
39
99
09
25
00
24
South Korea
01
0400 000004 03
08
01
Japan
03
04
Germany
06
00
0002
0408
00
France Italy
00
02
0002
0100
14 12 lt10
0800
09
UKNetherlands USA
0502
0000
Ride sharingCar Rental Taxi fleetCar sharing
1) PMV Purpose-built Mobility Vehicles
Mobility
The ratio of vehicles used for Mobility on demand is already at 10 of the car park in Singapore and China
Share of vehicles used for Mobility on demand on car parc [in 2015]
Source Euromonitor Desk Research Roland Berger
14RB - Global automotive supplier study highlights 23012019pptx
Vehicle sales for new mobility services are expected to exceed 10 of new car sales by 2025 in the US and the EU
9892 90
8 10
202520202015
2
OtherNew mobility1)
gt New mobility sales are expected to grow through 2025 due to
ndash Changes in car ownership patterns
ndash Growing urbanization
ndash Enhancements in technology amp mobility business models
gt The disruption potential in China is higher due to its relatively lower base of ownership levels today (1 car for 7 people vs 1 for 2 in EU and 1 for 125 in US)
gt Post 2025 the introduction of RoboCabs could drive a significantly larger share of sales to new mobility
9891
85
915
202520202015
2
United States EU-28
9791
65
9
35
2025
3
2015 2020
China
Share of vehicle sales for New Mobility1) [ passenger car sales]
1) Includes forecast for car sharing ride hailing ride sharing and Robocabs Does not include sales for conventional taxis or rental car fleets
Source Global RB Mobility Revenue and Profit Pool Model Lazard Roland Berger
Mobility
15RB - Global automotive supplier study highlights 23012019pptx
From 2020 to 2025 the addressable market for purpose-built vehicles for shared mobility is expected to grow by 21 a year
SourceSascha Birt (Illustration) Roland Berger
Mobility
16RB - Global automotive supplier study highlights 23012019pptx
Driving automation follows an evolutionary path ndash High automation will be available by 2020
SAE Levels of automated driving (AD)
Source SAE Roland Berger
Automated driving functions (SAE level)
gt Blind spot detection
gt Lane departure warning
gt Lane keeping assist
gt Adaptive cruise control
gt Valet parking with remote control
gt Construction site assist
gt Fully automated driving in somedriving modesndash Vehicle drives
in traffic jam automated
gt Traffic jam assist
gt Emergency steering assistant
5 Full automation
gt Fully automated driving (without steering wheel)
Execution of driving
0 Warninginformation
1 Driver assistance
3 Conditionalautomation
4 High automation2 Partly automation
Timegt20252017 2020
Monitoring environment
Fallback
Drivingsituationsmastered autonomously
None Some Some Some Some All
zzz
Autonomous driving
17RB - Global automotive supplier study highlights 23012019pptx
All OEMs and players form the tech and mobility sectors are in a race to bring driverless mobility services on the road
Com
-pa
ny
Tes
t co
untr
y
Existing fleet (as of Q32017 20 vehicles) Planned test fleet by 2021 (as published as of of Q32017 20 vehicles) 600 Size of planned test fleet by 2021
320100gt100 6gt100 50 40 24 16
(has started a ride-hailing service in Arizona akin to Uber this year but with driverless cars ndashsigned contract with JLR to deliver 20000 Jaguar I-Pace and with FCA to deliver 50000 Chrysler Pacifica for that)
~70000
2000 (will deploy first commercial RoboCab fleet in San Francisco in 2019)
Autonomous driving
Existing amp planned L4L5-test-fleets (in units 2017 announcement until 2021)1)
Source Press clippings fka Roland Berger
1) Major companies not exhaustive
18RB - Global automotive supplier study highlights 23012019pptx
Future penetration of highly automated vehicles will depend on overcoming current hurdles and convergence on shared mobility
Autonomous driving ndash Penetration rate of highly automated cars (SAE Levels 45)1)
1) In passenger car sales includes RoboCabs and private autonomous cars
Source Global RB Mobility Revenue and Profit Pool Model Lazard Roland Berger
Autonomous driving
2020 20252015 2030
gt Shared mobility confined to early adopters in dense urban areas
gt Automated driving penetration primarily in flagship premium models
Low scenario (business as usual)
gt Sharing proliferates with high acceptance of carride sharing services
gt Autonomy achieves high penetration in shared fleets and privately owned premium and volume vehicle segments
High scenario (autonomous mobility)
32
26
8
Shared mobility
Autonomy
19RB - Global automotive supplier study highlights 23012019pptx
CAGR 2020-2030
79798686 89
101
60
111-35
+23
Business as usual Autonomous mobility
2015 20302020 2025 2015 20302020 2025
Autonomous driving
The impact of the transition on global vehicle production lies somewhere between steady growth and large declines after 2025
Global passenger car production [m vehicle] excl LCVs
Source Roland Berger Profit Pools model
20RB - Global automotive supplier study highlights 23012019pptx
Electrification in Japan and North America mainly achieved through HEV technology so far whereas China more focused on BEVPHEV
HEV Toyota only HEV excl Toyota BEV PHEV
101154
57
(652)
39
(455)
4
(41)
0
(6)
370
9
(32)
65
(239)
27
(98)
416
44
(185)
8
(32)
23
(95)
25
(104)
526
43
(228)
25
(132)
17
(89)
15
(76)
USA Europe2) China3) Japan3)South Korea RoW
284
464
621
1104
2475
Total
Electrification
Global light vehicles xEV1) sales volume by region 2016 [000 units]
HEV ndash Mild and full hybrid electric vehicles BEV ndash Battery electric vehicles PHEV ndash Plug-in hybrid electric vehicles xEV ndash Class of electrified vehicles from mild hybrids to battery electric1) Excludes fuel cell electric vehicles 2) Including Russia and Turkey 3) ChinaJapan sales data includes only domestically produced xEVs
Source MarkLines Press Research RB xEV forecast model Roland Berger
21RB - Global automotive supplier study highlights 23012019pptx
9790
80
11
60 7
2025
168
3
2020
172
2
2
2016
176
2
Lower battery costs and potentially rising oil prices may drive electrification penetration in the United States to ~ 20 by 2025
High xEV scenarioOil 65 USDbarrel | Battery cost low
Low xEV ScenarioOil 45 USDbarrel | Battery cost high
Mid xEV scenarioOil 55 USDbarrel | Battery cost medium
97 9388
7
2025
168
2
3
2020
172
23
2
2016
176
2 0
97 95 92
2
2025
168
33
2
2020
172
2 1
2016
176
2 0
ICE amp MHFHPHEVBEV
20812
USA ndash New sales1) propulsion share [2016-2025 m units of sales]
BEV ndash Battery electric vehicles PHEV ndash Plug-in hybrid electric vehicles FH ndash Full hybrid vehicles ICE amp MH ndash Internal combustion engine amp mild hybrid vehicles xEV ndash Class of electrified vehicles from mild hybrids to battery electric1) Passenger cars and light duty trucks
Source US EPA IHS RB xEV forecast model Roland Berger
Electrification
22RB - Global automotive supplier study highlights 23012019pptx
China NEV market with significant growth forecasted neutral NEVand CAFC balance with a 13 BEV and 4 PHEV share in 2025
High xEV scenario Shares 25 higher compared to mid xEV scenario
Low xEV ScenarioShares 25 lower compared to mid xEV scenario
Mid xEV scenarioNeutral CAFC and NEV balances FHMH target met1)
98
85
62
8
20
013
4
4
2025
03
303 345
2020
1
2016
268
47
2938
98
82
53
10
25
170
6
50
345303
2016
1268
2020
3
2025
9889
71
15
60 11
12
2020 2025
3
303
2016
268
3
345
0
ICEBEV FHMHPHEV
China ndash New sales propulsion share [2016-2025 m units of sales]
BEV ndash Battery electric vehicles PHEV ndash Plug-in hybrid electric vehicles FHMH ndash Full and mild hybrid electric vehicles ICE ndash Internal combustion engine vehicles xEV ndash Class of electrified vehicles from mild hybrids to battery electric CAFC ndash Corporate average fuel consumption NEV ndash New energy vehicle1) Within FHMH a significantly higher share is expected for 48V mild-hybrids
Source MIIT IHS RB xEV forecast model Roland Berger
Electrification
23RB - Global automotive supplier study highlights 23012019pptx
Electrification in Europe varies depending on CO2 emission targets ndash Share could reach between 20 a 32 for 2025
High xEV scenario 75 g CO2 km in 2025 (100 target)
Low xEV Scenario75 g CO2 km in 2025 (90 phase in)3)
Mid xEV scenario75 g CO2 km in 2025 (95 phase in)3)
51
30
18
4
6
44
47
33
9
12
5
61
18
20253)
173
2 2
2020
168
22
4
2016
162
2 2
51
3020
4
7
44
47
35
10
95
61
15
20253)
173
2 2
2
2020
168
22
4
2016
162
2
51
3021
4
7
44
47
39
11
75
61
11
20253)
173
2020
168
22
2 2 4
2016
162
2 2
PHEVBEV DieselMH DieselGasolineMH GasolineCNGLPGFH
32
2026
EU281) ndash New sales2) propulsion share [2016-2025 m units of sales]
BEV ndash Battery electric vehicles PHEV ndash Plug-in hybrid electric vehicles FH ndash Full hybrid vehicles CNGLPG ndash Compressed natural gasliquefied petroleum gas vehicles MD ndash Mild hybrid vehicles xEV ndash Class of electrified vehicles from mild hybrids to battery electric1) Incl UK 2) Passenger cars and light commercial vehicles 3) The top 9590 of the fleet need to meet the target 95 asymp 80 g CO2km 90 asymp 85 g CO2kmSource EEA IHS RB xEV forecast model Roland Berger
Electrification
24RB - Global automotive supplier study highlights 23012019pptx
Investments in electrification have fueled the sales of Electric vehicles since 2016 in Spain
Electrification in Spain at a glance
Source ACEA EAFO Roland Berger
BEV = Battery Electric Vehicle PHEV = Plug-in Hybrid Electric Vehicle ICE = Internal Combustion Engine1) ICE (Internal Combustion Engine) CNG (Compressed Natural Gas) LNG (Liquified Natural Gas) have been included
Charging points Car parc (2015) 58 M vehicles
Drivetrain type (new car sales)
800800400
400
91
2012 2014
909
2013
109
891
2015
142
1378
1520
2016
4525 4573
213
4312
2018
261
4312
+50 4573
2017
261
4312
04
020000
2012
0101
2013 20182015 2017
992
03
2014
0104
999
01
999
03
2016
994
998999
997
0101
00
Fast charge (gt22 kW)Normal charge (gt22 kW) Rest1)BEV PHEV
CAGR 12-15
+49
+153
Growth12-18
02
Diesel
401
Petrol
597
Alternative fuels
+03
+04
-07
Electrification
25RB - Global automotive supplier study highlights 23012019pptx
Subsidies given by the Goverment in Portugal have boosted theshare of EV in new car sales since 2017 ndash 2250 euro per EV
Electrification in Portugal at a glance
Source ACEA EAFO Roland Berger
Charging points Car parc (2015) 58 M vehicles
Drivetrain type (new car sales)
828279
+4
2018
1404
2016
1322 1340
2017
1401
1172
2015
17
1422
1322
1192
2014
17
1189
2013
1209
1154
2012
1128
7 17
1135 1171
01
03
2012 2015
040000
2014
998993
999
0102
998
01
2013 20182017
981
991
0504
965
16
1911
2016
08
Fast charge (gt22 kW)Normal charge (gt22 kW) PHEV Rest1)BEV
CAGR 12-15
+3
+51
Growth12-18
466
Diesel
518
15 Alternative fuels
Petrol
BEV = Battery Electric Vehicle PHEV = Plug-in Hybrid Electric Vehicle ICE = Internal Combustion Engine1) ) ICE (Internal Combustion Engine) CNG (Compressed Natural Gas) LNG (Liquified Natural Gas) have been included
+18
+16
-34
Electrification
26RB - Global automotive supplier study highlights 23012019pptx
There have been some bold claims made by OEMs promising to deliver more EV options ndash Far faster than IHS predictions
Major xEV product announcements
16
24
431
2020
42
10
315
16
74
42
2016
OtherxEVs
20
56
470
2024
ICEOnly
+49
BEVs
10 BEVs by 2022 Smart all-electric in NA starting 2018
26 xEVs by 2020
13 xEVs by 2021
30 new BEVs by 2025
All new Volvo platforms to be xEVs by 2019
All JLR products to have xEV option by 2020
1) Within North America and Europe Considers FH MH PHEV and BEV
Electrification
Number of xEV models offered in NA and Europe
Source Roland Berger
27RB - Global automotive supplier study highlights 23012019pptx
Obsoletecomponents
Heavily modified components
New components
Resultant challenges
gt Combustion engine (engine block valves camshaft sump oil filter etc)
gt Fuel systems
gt Injection systems
gt Clutch
gt Exhaust system
gt Auxiliary power units (oil pump turbocharger etc)
gt and so onhellip
gt Gearbox
gt Wheel suspension
gt Transmission
gt Air-conditioningheating
gt Cooling water system
gt Heat insulation
gt Noise reduction
gt Vehicle floor
gt Structural elements
gt and so onhellip
gt Electric motor andother drive components
gt Power electronics
gt Battery system (rechargeable battery battery management battery system)
gt Battery casing
gt Fuel cell system
gt and so onhellip
gt New components are being developed and produced by incumbent and new suppliers
Competition is forcing OEMs and suppliers to adopt new positions
SupplierSupplier Supplier
OEMOEM OEM
Influence of electrification on vehicle components (excerpt)
Electrification is changing the composition of the vehicle giving rise to new components relating to technology increasing wiring needs
Source Roland Berger
Electrification
28RB - Global automotive supplier study highlights 23012019pptx
AutomotiveEnd game zone
Automotive suppliers will need to prepare for five distinct changes that will emerge on the road to the end game
Emergence of software as a key differentiating factorgt Digital features determine value to the end-customergt Digitization offers new monetization options3
Vanishing growthgt Stagnation in mature marketsgt Increased usage of shared mobility solutions
1Accelerated change of technologies in focusgt Increasing proliferation of electrified powertrainsgt Strong industry push for ADAS and connectivity solutions2
OEMs encounter increasing investment needs and margin pressuregt New technologies require substantial investmentsgt OEMs challenged by new competitors
4Valuation levels of commoditized suppliers might come under pressuregt Outperformance of OEM valuation multiples might come to an endgt Outlook of commoditized supplier sub-sectors might be seen more critical
by equity investors as well as creditors
5
Emerging changes impacting automotive suppliers
Source Lazard Roland Berger
29RB - Global automotive supplier study highlights 23012019pptx
2 Technology shifts
Almost all vehicle domains will see a shift in growth focus over the next years ndash Disruption impact particularly high in powertrain
Impact of technology shifts by domain
Source Lazard Roland Berger
Disruption impact on current business
Supplier domain Low High
Interior
Exterior
Chassis
Powertrain
Powertrain gt E-motors and power electronics
gt Battery systems
gt Simple 1-2 step reduction gears
Interior gt New HMI display technologies
gt Extended Infotainment solutions
gt Increased interior insulation (NVH)
gt Integration of electronics and surfaces
Next generation vehicle concept
Substantial new requirements for the supply base
Chassis gt Advanced driver assistance systems and autonomous features
gt Adaptive suspensions
gt Active steering and braking systems
gt Shifting material focus and growing importance of multi-material applications
gt Growth of non-structural composites
Exterior
30RB - Global automotive supplier study highlights 23012019pptx
Electric powertrain components to experience high growth rates at the expense of many traditional ICE components
Implications for suppliers
gt ICE hardware commoditization
gt Battery systems and electronics provide differentiation opportunities
gt Limited potential in e-motors in part due to lower complexity vs ICE
Background
gt Increasing cost of ICEexhaust treatment
gt Mild and full hybrids aid in emissions improvement and enable ICEs with downgraded requirements
gt BEV penetration rates increase driven by regulation incentives and consumer demand
Technology trends ndash Winners
gt Future powertrain architectures are electrified resulting in several fast growing domains
ndash E-motors
ndash Inverterspower electronics
ndash Battery
ndash Battery cooling
ndash 1-2 step reduction gears
ndash Charging components
Technology trends ndash Losers
gt Consequently traditional ICE components and systems to experience below average growth rates
ndash Engine camshafts crankshafts valves lubricants
ndash Exhaust oil filters alternators ignition
ndash Transmission clutch gearbox propeller shaft
Technology shifts ndash Powertrain
Source Lazard Roland Berger
2 Technology shifts
31RB - Global automotive supplier study highlights 23012019pptx
The ADAS and AD component market will strongly grow providing an increasing revenue pool mainly for software focused suppliers
Implications for suppliers
gt Hardware standardization commoditization of traditional chassis components and systems
gt Intelligent systems integrated with ADAS are expected to offer growth potential within respective domains (eg steering suspension vision systems passenger safety systems)
Background
gt ADAS offers several benefits to society and industry including accident mitigation congestion reduction increased driving comfort and fuel efficiency gains
gt Advanced vehicle control and sensor systems are the main benefactors of the shift to greater advanced driver assistance systemsndash Advanced driver assistance systems and
autonomous features ndash Adaptive suspensionsndash Active steering + braking actuatorsndash E-Axles (as part of electrified powertrain)ndash Vision sensors (LiDAR cameras)
Technology trends ndash Winners
Technology trends ndash Losers
gt Meanwhile traditional vehicle control systems are at risk for reduced market sharendash Hydraulic steering systemsndash Traditional axlesndash Conventional suspensions
Technology shifts ndash Chassis
Source Lazard Roland Berger
2 Technology shifts
32RB - Global automotive supplier study highlights 23012019pptx
Emissions regulations push OEMs for increased lightweighting of body structures while ADAS and connectivity create new use cases
Implications for suppliers
gt Shifting materials competencies for non-structural components suppliers
gt New use cases for intelligent exterior systems may offer differentiation potential particularly when paired with ADAS solutions
Background
gt Shifting material focus and growing importance of multi-material applications
gt New technology integration potential for enhanced safety
gt New design possibilities due to missing ICE powertrain
gt Advanced material components and advanced safety features offer potential in exterior componentsndash Non-structural compositesndash Increased usage of plasticsndash Side and rear view cameras and screensndash Driving mode indication (autonomous vs human
driver)ndash Lock systems using cell phones
Technology trends ndash Winners
Technology trends ndash Losers
gt Traditional materials and exterior components most at risk for lost share includendash Cast partsndash Non-structural steel partsndash Traditional side and rear view mirrors
Technology shifts ndash Exterior
Source Lazard Roland Berger
2 Technology shifts
33RB - Global automotive supplier study highlights 23012019pptx
Autonomous driving will drastically change interior designs and provide innovation and growth potentials
Background
gt Growing importance of non-driving-related activities such as infotainment completing tasks while driving automated eating and drinking
gt Interior provides huge potential for innovation and continued growth
Technology trends ndash Winners
gt New possibilities to design the interior of a vehicle by electric powertrain connectivity and automated drivingndash New HMIs1) (Augmented reality head up displays
gesture recognition haptic feedback) and integration of electronics and surfaces (OLED2)
panels curved screens) ndash Extended infotainment solutionsndash New design possibilitiesrequirements eg luxury
lounge seating or increased interior insulation (NVH3))
Key success factors
gt Successful translation of customer needs in product innovation
gt Product differentiationgt Integration of EE to ensure
value creation
Technology trends ndash Losers
gt Traditional interior components that might face lower demandndash Analog instrument clustersndash Buttons and switchesndash Conventional valves pumps and compressors
Technology shifts ndash Interior
1) Human-machine interfaces 2) Organic light emitting diode 3) Noise vibration and harshness
Source Lazard Roland Berger
2 Technology shifts
34RB - Global automotive supplier study highlights 23012019pptx
Automotive suppliers can consider 8 key elements in order to transform their business model
1 Strategy and portfolio
2 Product and technology
8 Cultural mindset
Operating cost base
Capital Financing
Competencies amp capabilities
Organization amp governance
Partnerships
3 4 5 6 7
Enablers
Automotive supplier transformation toolbox
Source Lazard Roland Berger
35RB - Global automotive supplier study highlights 23012019pptx
Active consolidation and harvesting are often financially viable strategies ndash Future sources for growth have to be identified
1 Strategic responses to declining segments 2 New sources for growth
ConsolidateMaintain
leadership
Harvest
Ramp-down business model
ExitDivest
Competitive Intensity
LowHigh
Co
mp
etit
ive
Po
siti
on
Wea
kS
tro
ng
gt Before the industry disruption reaches a tipping point suppliers should consider end-game strategies for their declining business areas
gt Suppliers can expand into new offerings and end markets to provide outlets for growth
gt Diversification into other industries leveraging current core competencies as an alternative
Core
Adjacent
Step-out
Incremental
innovation
New go-
to-market
Diversify into other
industries
New value-
chain position
New applications
Adjoining
value-chain
position
New technology
segment
New geographies
Strategic decision matrix and portfolio growth options
Source Lazard Roland Berger
Strategy amp Portfolio1
36RB - Global automotive supplier study highlights 23012019pptx
The cultural mindset has to be rethought along with the transformation of the business model
Transformation
Future
Past
Focus on methods processes and tools
Incremental processes
Tactics and pressure as drivers
Change of working style
Implementation of defined changes
Status Quo
Addressing existing mindsets and beliefs
Strategy-driven
Many connected initiatives
Reconfiguration and reinvention
Change of framework
Result of many changes
Solution-drivenProblem orientation
Limited initiatives
Project orientation Influence on the whole organization
Flat hierarchyagile decisions
Top-down decisions
Motivation as driver
IllustrativeCultural mindset transformation
Source Lazard Roland Berger
Cultural mindset8
37RB - Global automotive supplier study highlights 23012019pptx
Suppliers need to rethink their business model in order to be successful in the future
1Suppliers need to rethink their strategy and product portfolio in order to capture growth opportunities or consolidate the market around their existing portfolio
3Suppliers need to implement a new and lower operating cost base and at the same time ensure sufficient financing for the upcoming transition
4Suppliers need to build up new competencies and capabilities and adapt their organizational structure amp governance as well as cultural mindset to compete in the new technology areas
5Suppliers need to build up new partnerships and leverage this ecosystem to find new ways to innovate
New
bu
sin
ess
mo
del
2Suppliers need to define a long term technology roadmap as well as their strategic positioning in the value chain regarding their product and service offering
Summary Key actions for automotive suppliers
Source Lazard Roland Berger
38RB - Global automotive supplier study highlights 23012019pptx
But The one thing we have learned is that even the best predictions cannot say what will really happen with disruptive technology
I think there is a world market for maybe five computersTHOMAS WATSON PRESIDENT OF IBM 1943
Nuclear-powered vacuum cleaners will probably be a reality within ten yearsALEX LEWYT PRESIDENT OF LEWYT VACUUM COMPANY 1955
Two years from now spam will be solvedBILL GATES FOUNDER OF MICROSOFT 2004
39RB - Global automotive supplier study highlights 23012019pptx
Rodrigo Custodio
DirectorRoland Berger
RodrigoCustodiorolandbergercom
Stay tuned with our Automotive publications
httpswwwrolandbergercomenDossiersMADEhtml
Your discussion partner today
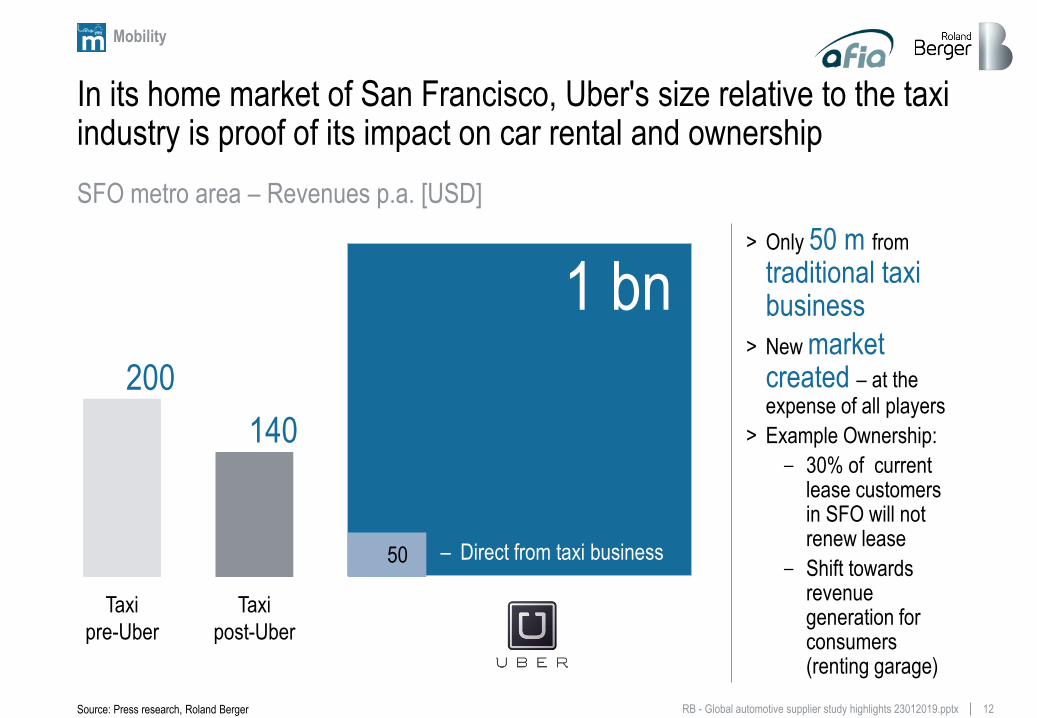
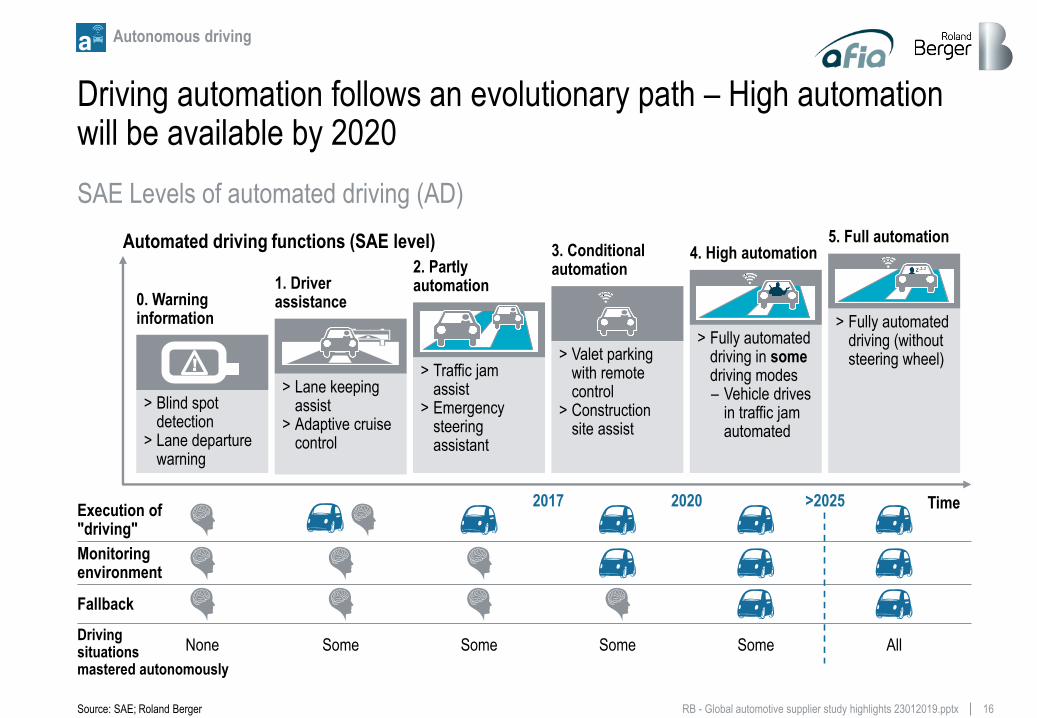
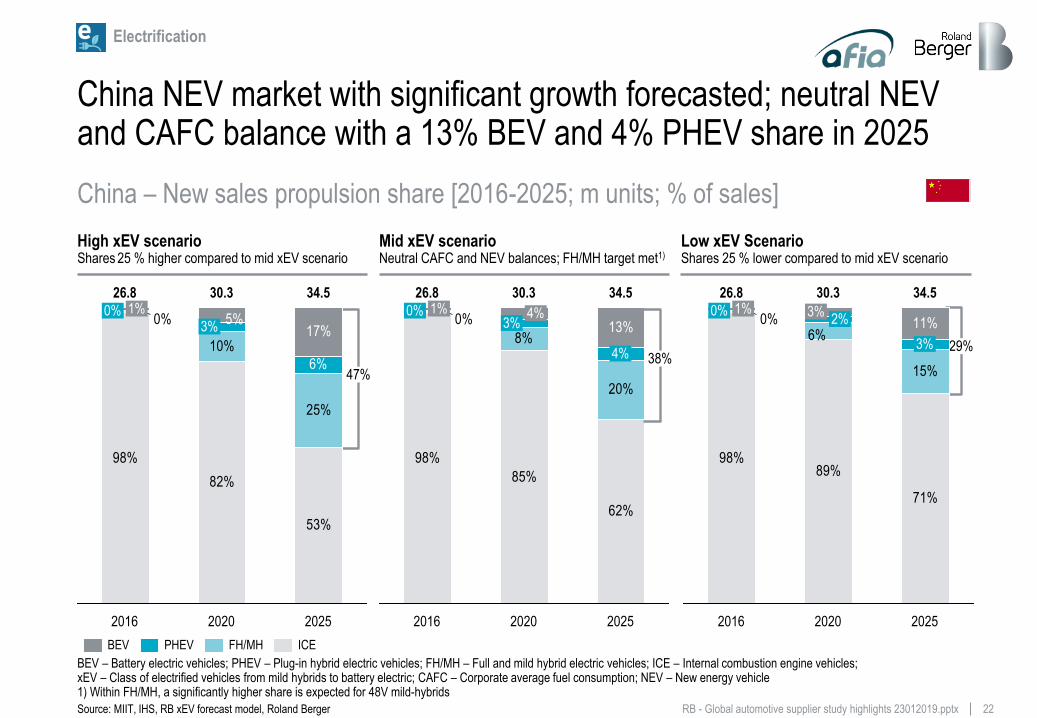
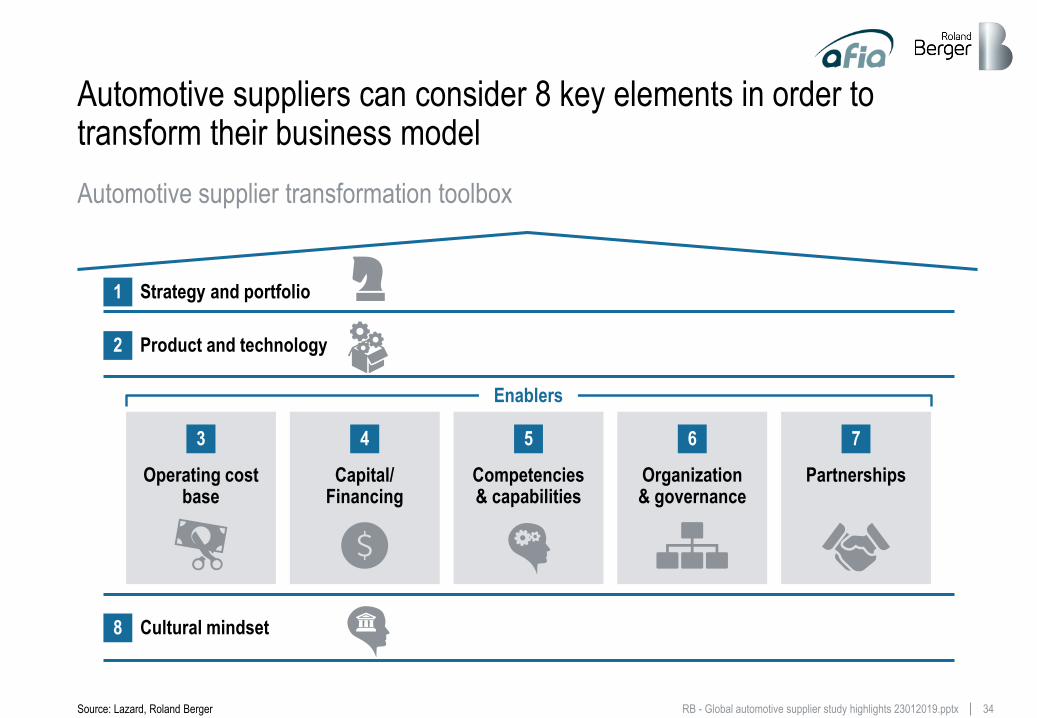

39RB - Global automotive supplier study highlights 23012019pptx
Rodrigo Custodio
DirectorRoland Berger
RodrigoCustodiorolandbergercom
Stay tuned with our Automotive publications
httpswwwrolandbergercomenDossiersMADEhtml
Your discussion partner today