Embed Size (px)
Citation preview

February, 1998
Revised March, 2007
SOREMO VERSION V.2
David A. Kenny
University of Connecticut
Program SOREMO was developed for the analysis of multivariate round-robin data using a
Social Relations Model approach (Kenny, 1994; Kenny & La Voie, 1984; Malloy & Kenny, 1986)
It is assumed that the reader has some familiarity with Social Relations Model, and so by way of
introduction only a brief overview of the key concepts is presented.
The Social Relations Model assumes that people are both stimuli and producers of
responses. To study both aspects of social functioning simultaneously, data generated from dyadic
social interactions are used. (It is assumed throughout that actors and partners are people. It can be
that they are animals, groups, organizations, cities, or countries.) SOREMO is used to analyze data
from a round-robin research design, in which each person in a group interacts with or rates every
other person in the group, and data are collected from both members of each dyad. The scores of
the two people are usually different, but may be the same. If there are multiple groups, the number
of people in each may vary. All groups must have at least four people, unless it can be assumed
that there is no dyadic reciprocity. In this case, group size may be as small as three. If each person
does not interact with every other person, the program BLOCKO may be able to analyze such data.
Three types of effects are in the Social Relations Model. An actor effect represents a
person's average level of a given behavior in the presence of a variety of partners. For example ,
Sandy's actor effect on the variable of trust measures the extent to which she tends to trust others in
general. A partner effect represents the average level of a response which a person elicits from a
variety of partners. Sandy's partner effect measures the extent to which other people tend to trust
her. A relationship effect represents a person's behavior toward another individual in particular,
above and beyond their actor and partner effects.
For example, Sandy's relationship effect toward Mark on the variable of trust measures the
extent to which she trusts him controlling for her general tendency toward trusting others and his
general tendency to be trusted by others. Relationship effects are directional or asymmetric, such
that Sandy may trust Mark more, less, or the same as he trusts her. In order to differentiate
relationship from error variance, multiple indicators of the construct, either across time or with
different measures, are necessary.
There are three types of measures in SOREMO:
a) Dyadic measures: variables for which there are data for both members of every dyad (a
round robin structure). For example, rof trust to be a dyadic measure, Sandy and
Mark would each report how much they trust each other, or if they each report
how trustworthy they believe themselves to be in regard to their interactions with
the other person
.

2
b) Self-measures: variables for which a person's interaction partner is him or herself. For
rating data, a self-measure is a self-rating. For example, Mark may report how
trustworthy he believes himself to be in general. (If Mark states how
trustworthy he is with each person, this measure would be a dyadic not a self-
measure.)
c) Personality measures: variables which are measured at the "trait" level, across a variety
of situations and partners .These variables may be thought of as internal, stable
characteristics of individuals, and may include such variables as race and sex.
For example, a standardized measure may be administered to assess Mark's locus
of control to see if this is related to his tendency to trust or be trusted by other. A
personality variable may be a self-report measure.
Note that the same variable may be measured by two or even three of these methods of
measurement. The program requires at least one dyadic variable while self measures and
personality variables are optional.
SOREMO presents various analyses of the data. The program partitions variance into actor,
partner, and relationship components, and outputs the relative variance of each component. Two
different tests of significance are available. First, jackknife significance tests, which estimate the
stability of an estimate with a single subject removed. Alternatively, significance tests with the
group as the unit of analysis (the mean of the estimates across groups are tested to determine if is
significantly different from zero) are used to test variances and covariances. If latent constructs are
measured with multiple indicators, the variances of these constructs are partitioned. The reliabilities
of the actor and partner effects are also available. Finally, various correlations among the different
types of effects and variables are computed
Currently, SOREMO can be run on only an IBM-compatible personnel computer. There
are two different ways to run the program. However, before doing this, three files must first be
created. One is a setup file that contains the title, problem, variable names, and format records.
The program WINSOREMO can be used to create this file. The second file is the data file. The
third file is a file that has three lines and is called the instructions file. The first line is the name of
the setup file, the second line is the name of the data file, and the last line is the name of the file to
which the output is sent. SOREMO requests from the user the name of the file that contains the
names of these three files.
Consider the Warner, Kenny, and Stoto (1979) data. The data file might be located in a file
called C:WARN.DAT. The user would create a file called C:WARN.SET that would contain the
control records for SOREMO. Imagine that the user wants the output to be put on a floppy disk to
a file called A:WARN.OUT. The user would then create the following three-line instructions file,
called perhaps SOREMO.SET:
C:WARN.SET
C:WARN.DAT
A:WARN.OUT
When prompted for the file with file instructions, the user merely types SOREMO.SET. The order
of files in SOREMO.SET cannot be changed. If the user inadvertently made C:WARN.DAT the
last line in the file, SOREMO would write over the data file.

3
If the run is not completed (the program says "Stop-Program terminated."), the user should
check the output file or A:WARN.OUT, as SOREMO may indicate the error. The data file
contains only raw data. If a new drop subjects record or format record is needed for each group,
these records are included in the setup file.
If the covariance matrices are outputted (see below, Problem Record, column 10, option
4), the name of a fourth file must be included. Also if a file of estimated actor and partner effects is
desired (Problem Record, column 20, option 5), a file name is needed. If covariances matrices are
outputted, the actor and partner effect estimates file is the fifth file, otherwise it is the fourth.
Description of the Setup File
The basic setup file for the program is as follows:
title record
problem record
group size record (optional)
label record for dyadic variables
label record for personality variables (optional)
construct designation record (optional)
correlated indicator record (optional)
label record for constructs (optional)
reversal of variable record (optional)
input format
input format for personality variables (optional)
drop subjects record (optional)
input format for group 2 (optional)
input format for personality variables (optional)
Although the setup file has many types of records, only four are required. They are the title,
problem, dyadic label, and input format records.
Title Record
This record describes the run being done. It contains the basic descriptive information. All
80 columns of this record may be used.
Problem Record
This record provides the program with the basic parameters for running a job. In most
applications, the default (a blank which will be read as zero) can be used. (Columns 11 through 27
can be left blank.) All values should be right justified (blanks on the left). That is, if there are two
columns provided for a number and the number has only one digit, that number should be put in the
right-most column.
column 1-2 number of subjects per group (between 3 and 25) , blank or zero if group size
varies
column 3-4 number of dyadic variables (between 1 and 20)
column 5-7 number of groups (between 1 and 999)
4
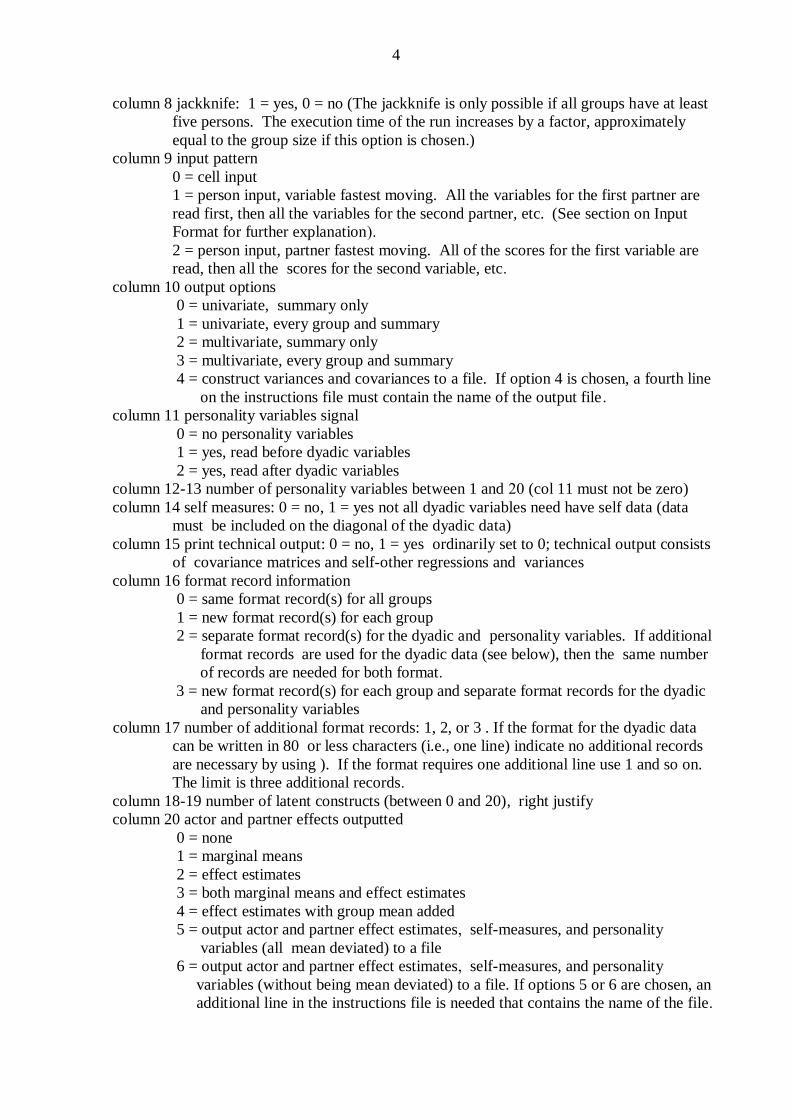
column 8 jackknife: 1 = yes, 0 = no (The jackknife is only possible if all groups have at least
five persons. The execution time of the run increases by a factor, approximately
equal to the group size if this option is chosen.)
column 9 input pattern
0 = cell input
1 = person input, variable fastest moving. All the variables for the first partner are
read first, then all the variables for the second partner, etc. (See section on Input
Format for further explanation .)
2 = person input, partner fastest moving. All of the scores for the first variable are
read, then all the scores for the second variable, etc.
column 10 output options
0 = univariate, summary only
1 = univariate, every group and summary
2 = multivariate, summary only
3 = multivariate, every group and summary
4 = construct variances and covariances to a file. If option 4 is chosen, a fourth line
on the instructions file must contain the name of the output file.
column 11 personality variables signal
0 = no personality variables
1 = yes, read before dyadic variables
2 = yes, read after dyadic variables
column 12-13 number of personality variables between 1 and 02 (col 11 must not be zero)
column 14 self measures: 0 = no, 1 = yes not all dyadic variables need have self data (data
must be included on the diagonal of the dyadic data)
column 15 print technical output: 0 = no, 1 = yes ordinarily set to 0; technical output consists
of covariance matrices and self-other regressions and variances
column 16 format record information
0 = same format record(s) for all groups
1 = new format record(s) for each group
2 = separate format record(s) for the dyadic and personality variables. If additional
format records are used for the dyadic data (see below), then the same number
of records are needed for both format.
3 = new format record(s) for each group and separate format records for the dyadic
and personality variables
column 17 number of additional format records: 1, 2, or 3 . If the format for the dyadic data
can be written in 80 or less characters (i.e., one line) indicate no additional records
are necessary by using ). If the format requires one additional line use 1 and so on.
The limit is three additional records.
column 18-19 number of latent constructs (between 0 and 20), right justify
column 20 actor and partner effects outputted
0 = none
1 = marginal means
2 = effect estimates
3 = both marginal means and effect estimates
4 = effect estimates with group mean added
5 = output actor and partner effect estimates, self-measures, and personality
variables (all mean deviated) to a file
6 = output actor and partner effect estimates, self-measures, and personality
variables (without being mean deviated) to a file. If options 5 or 6 are chosen, an
additional line in the instructions file is needed that contains the name of the file.

5
column 21 interaction effects outputted
0 = none
1 = cell scores (raw data)
2 = interaction effects
3 = both cell scores and effect estimates
column 22 estimation of dyadic reciprocity
0 = yes
1 = no (option chosen if number of subjects per group is as few as three and the
persons are unacquainted and do not interact with each other)
column 23 reverse scoring of some variables
0 = no, 1 = yes
column 24 drop subjects
0 = no
1 = yes, different pattern for each group
2 = yes, same pattern for every group
column 25-27 total number of subjects dropped from all groups; this value will be compared
to the actual number dropped and if there is a discrepancy the run is halted
To evaluate whether the setup records for SOREMO are correct, the user can run the program with
an empty data file. Then the user can examine the output file to see if the program properly read
the setup records. The program should say that a premature end of data occurred in group 1.
Group Size Record
This record or records must be used if the group size varies from group to group, which is
signaled by blanks or zeros in columns 1-2 of the problem record. Group sizes must be in two-
column fields separated by commas. The user begins in column one. For instance, the record
05,15,18 would mean there are three groups with sizes of five, fifteen, and eighteen. Continue as
necessary until column 80.
If there are more than 27 groups, use additional records. Again, begin in columns 1-2 with
the group size for group 28. Recall that the minimum group size is four without jackknife and five
with. Group size can be three without the jackknife and four with the jackknife if there is a one in
column 22 of the problem record.
Label Record for Dyadic Variables
This record contains the dyadic variable names in 10 column fields. A second record is
used if there are between 9 and 16 variables, and a third record if there are between 17 and 20
variables. No signal is needed to indicate continuance of dyadic variable names onto a second or
third record, if used .
The output looks neater if these labels are right justified. So if LIKING is variable 1, one
should start put the "L" in column 5.
Label Record for Personality Variables
This record must be included if there are personality variables. Its form is the same as the
previous label record.

6
Construct Designation Record
If a given construct has multiple replications, a construct designation record is necessary to
signal which dyadic variables measure which construct. There are multiple replications if the same
construct is measured at multiple times or by multiple indicators. The units of measurement of
these indicators must be the same.
This record is required when there is a non-zero value in columns 18-19 of the problem
record. Whenever there is not a zero in columns 18-19, the Correlated Indicator Record and the
Label Record for Constructs must also be read. If this option is chosen, the dyadic and self-
variables are assumed to be indicators of a latent construct.
The construct designation record tells SOREMO which measure indicates which construct.
Imagine that there are seven variables and three constructs. If the first three variables load on the
first construct, the next three on the second, and the seventh variable on the third, the construct
designation record would be:
20202020202020
In general, the format of the record consists of two-column fields beginning in column 1.
The first field gives the number of the construct for the first dyadic variable. The second two-
column field (in columns 3 and 4) gives the construct for the second dyadic variable, and so on
until all dyadic variables have been designated. So the last column on this record must be equal to
two times n where n is the number of dyadic variables. Every variable must be linked to a
construct and, as in the example, there may be only one variable that is linked to a construct.
The constructs are numbered from 1 to m where m is given in columns 18-19 of the
problem record. The ordering of the constructs is determined by the user. So the following
construct designation record 20202020202020 is the same as the earlier described record. The only
difference is that the constructs have been reordered. The prior construct 1 is now construct 2, the
prior construct 2 is now 3, and the prior construct 3 is now 1.
Correlated Indicator Record
This record is used to tell the program which indicators have correlated measurement error.
Two indicators have correlated measurement error if they are measured using the same method or
at the same time. This record is required if there is not a zero in columns 18-19 of the problem
record. For two indicators to have correlated measurement error, they must be indicators of two
different constructs. The sets of correlated indicators are designated numerically. For example,
consider the earlier described construct designation record and its correlated indicator record:
20202020202020
20202020202020
The records tell SOREMO that variable pairs 1, 4 and 2, 5 and 3, 6 are correlated. If an indicator
shares no measurement error, a unique number is put in the fields. So the record 20202020272625
would indicate that none of the seven indicators has correlated measurement error. The ordering of
the numbers is arbitrary. If a construct has only a single indicator, it must be given a unique
number on the correlated indicator record.

7
Beginning users may be best advised to simply put consecutive numbers starting with 01 in
two-column fields (e.g 20202020), Such a Correlated Indicator Record presumes no correlated
errors.SOREMO allows for only a particular type of correlated errors. The measurement model
presumed by SOREMO is that the measures are parallel but means may vary. That is, all the
indicators of a construct have equal loadings on the construct. Also, correlated measurement error
across a pair of constructs is assumed to be equal for all pairs of correlated indicators of the two
constructs.
The following rules apply in setting up correlated measurement error on this record. First,
constructs that have a single indicator cannot have correlated measurement error and so must be
given a unique number. Any instructions that the user gives concerning correlated errors with ingle
indicator variables are ignored. Second, for two indicators to have correlated measurement error,
they must be indicators of different constructs. Two indicators of the same construct cannot share
measurement error. Third, if the indicators of two constructs share measurement error, then the
number of indicators of the constructs must be the same, and each indicator of one construct must
be paired with one, different indicator of the other construct. Consider as an example the following
pair of records, the first being the construct designation record and the second being the correlated
measurement record:
20202020202020202726
20202020202020202726
The construct designation record signals that the ten variables form six constructs. The
pattern is:
Construct Indicators
1 1 and 2
2 3 and 4
3 5 and 6
4 7 and 8
5 9
6 10
The correlated indicator record states those variables 1, 3, and 5 share measurement errors as do 2,
4 and 6. So the indicators of constructs 1, 2, and 3 share correlated measurement error. But the
indicators of construct 4 do not share measurement error. The indicators of constructs 5 and 6
cannot share measurement error because they each have a single indicator.
Label Record for Constructs
This record is optional, but must be included if there is a non-zero value in columns 18-19
of the problem record. Its form is the same as other label records. The number and order of the
constructs is given in the construct designation record.
Reverse Scoring Record
This record is signaled by a 1 in column 23 of the problem record. Sometimes the dyadic
variables are scored in different directions. For instance, a high score on one variable means
having more of something while a high score on another variable means having less. Reverse
coring of the second variable would make the results more interpretable and would be necessary if
the two variables were supposed to be two indicators of the same construct. Say for instance, there

8
are two measures of extroversion: outgoing and quiet. People are rated on a 7-point scale. For
outgoing, higher numbers would mean more extroversion, but for quiet lower numbers would mean
more extroversion. If these two measures are to be used to form a construct, then one of the
variables, probably quiet, would need to be reversed.
In columns 1 to 5 of this record is the sum of the upper and lower limits of the variable. So
if the scores can range from 1 to 6, then one would put a 7 in column 5. If the reversed variables
have different upper and lower limits, it is probably best to leave these columns blank.
If the user wants to reverse the first variable, a one is put in column 6. To leave a variable
as it is, a blank or zero is left in the appropriate column. In general to reverse the nth variable, put a
one in the nth plus five column of this record. For instance, to reverse the 12th variable, a one is put
in column 17. Whenever a dyadic variable is reversed, the self variable is also automatically
reversed. One cannot reverse personality variables within SOREMO.
As an example, the following record 2222122002200would mean that the upper plus lower
limit is 8, and that the third, fourth, seventh, and eighth variables would be reversed.
If a variable is reversed and there is self data (a 1 in column 14 of the problem record), the
self data are also reversed. If raw data are outputted and the variable has no self data, the "self
data" equals the upper plus lower limits.
FORTRAN Format Specifications
The input format record tells SOREMO how to read the data based on how it was entered.
The input format record specifies the location and format of the data, and is written in FORTRAN.
The following FORTRAN symbols are used in this application. If you are already familiar with
standard FORTRAN formats, skip ahead to the next section:
a) opening parenthesis "(". This is always used to begin the input format record.
b) closing parenthesis ")". This is always used to end the input format record.
c) skip symbol "X". This skip-field specification is always preceded by an integer (e.g.,
32X), and specifies the number of columns which should not be read. For example, the
statement 5X at the beginning of a record means skip 5 columns, and begin reading data
in column 6. If 20 columns of data have already been read, the statement 5X means
skip columns 21-25, and begin reading data in column 26.
d) tab "T". This statement is always followed by an integer (e.g., T21), and specifies the
column number in which to begin reading data. Unlike the X-type symbol, which
moves the reading of data only to the right on the data record, the tab statement can
move data reading to the right or the left on the data record. For example, the statement
T9 at the beginning of a record means tab to the right and begin reading data in column
9. If columns 11-14 have already been read, the statement T9 means tab to the left,
going back to column 9, and begin reading data in column 9.
e) slash "/". This statement forwards the reading of data to the next data record. The slash
can be preceded by an integer, specifying the number of records to skip. For example,
5/ means skip 5 records.

9
f) comma ",". This specification is always used to separate specification statements which
are not separated by a slash.
g) data format statement in F-mode - wFy.z, where w, y, and z are variables: This is read
as w fields of y.z, and specifies the number of data points to be read, and how many
digits each has to the right of the decimal. For example, 0 F3.1 means two fields of 3-
column data, with one column to the right of the decimal (e.g., 15.9 5.1). If all data are
in integers, the number of digits to the right of the decimal must be specified as zero
(e.g., 3F2.0). Always use F-mode, never I-mode and always specify the number of
decimal places. So never use 3I1, but use 3F1.0.
h) embedded parentheses "(( ))". Embedding statements within the input format record
can be useful when there are many data records, all with the same format. For example,
if there are 25 data records, all with the format 5X,15F1.0, rather than writing
(5X,15F1.0/5X,15F1.0/ etc.) 25 times, it is much easier to write
(24(5X,15F1.0/),5X,15F1.0). This means read 5X,15F1.0 on 24 separate data records,
then read one more record with the format 5X,15F1.0. The separate specification for
the last record is necessary because a slash, indicating read the next record, will be read
after the twenty-fourth record, so the program expects another record of data. If all the
data are in blocks of the same format and on a single data record, embedded parentheses
can be used without a slash. For example, the format (5(6F2.0,2X)) means read 5
blocks of data, with each block containing 6F2.0 data then 2 skipped spaces, all on a
single data record.
Assume the following data set:
record 1: 32 51 67113
record 2: 211613 41016215 5031798
With the following format record:
(3X,4F3.1/T14,4F.2,T1,2F3.2)
The data will be read as:
record 1: 3.2 5.1 6.7 11.3
record 2: 41.01 62.15 5.03 17.98 2.11 6.13
Input Format Record
SOREMO reads all the scores of a person for the entire set of variables and partners,
including the data for the personality variables. (Alternatively, one can use cell input which is
described below.) For example, the format (10F3.0) might indicate two variables and five persons
in the group. If there are any personality variables, make sure to include them on the format record
or request a separate format record for the personality variables. So in general, for each subject, the
number of scores read is the number of people in the group times the number of variables plus the
number of personality variables.
Always include the number of decimal places. So do not use ( 0F1,2F2,F4) but rather
(3F1.0,2F2.0,F4.0).

10
There are two types of data input: variable fastest moving (signaled by a one in column 9 of
the problem record) and person fastest moving (signaled by a two). Imagine two variables and four
persons. Variable would be fastest moving if the order of the eight scores for each person is P1V1
P1V2 P2V1 P2V2 P3V1 P3V2 P4V1 P4V2 where P indicates person and V variable. Person
would be fastest moving if the order of the eight scores for each person is P1V1 P2V1 P3V1
P4V1 P1V2 P2V2 P3V2 P4V2
Note that all the personality variables must be read before or after all the dyadic variables
have been read.
In SOREMO, the diagonal is generally read and so self-data are read even if they are not
present. If missing, one ordinarily would leave the "self" data blank. Do not type letters or non-
numeric symbols in this area, as SOREMO actually reads these data.
If group sizes are unequal or the format varies from group to group, one may need a
different format record for each group, which is signaled by a 1 or 3 in column 16 of the problem
record.
When the personality variables are on different records from the dyadic variables, one may
wish to have a separate format for the personality data. As stated before, the personality data for a
subject always follow or precede the dyadic data. If the data precede, a 1 is put in column 11 or the
problem record; if the data follow, a 2 is put in column 11. A separate format record is indicated by
2 or 3 in column 16 of the problem record.
Sometimes the format information does not fit on a single record. If additional records are
needed, the number of such records is indicated in column 17 of the problem record. Up to an
additional three records can be read. If a separate format record is requested for the personality
variables, the same number of records must be used for both the dyadic and personality format
records. It may then be necessary to add blank records.
When setting up a data file, if one has many dyadic variables per subject, it is advisable to
have a single record (or, if necessary, a set of records) for each dyad. So each subject would have n
data records where n is the number of people in the group. There would be additional records for
the person if there were any personality variables. One would then choose to have "variable fastest
moving" and the format record would read the data for the one partner (a 1 in column 9). If there
are personality variables, it is advisable to put a 2 in column ( 06 or 3 if different records are needed
for each group) and request a separate format record for them.
For instance, imagine that there are 18 dyadic variables in one column fields. One might
put them in columns 10 through 27. The format record for the dyadic variables would be
(T10,18F1.0).
After the record is read for the first partner, the program automatically goes to the next
record and uses the same format. If there are no self data, make sure to include a blank record for
them. This procedure would work for any size group and if group sizes vary.
For cell input, the scores for only one partner are read. The data are read in round robin
format. So if there are four people in the group, the data would be read as follows: 12, 13, 14, 21,
23, 24, 31, 32, 34, 41, 42, and 43. If there are self data, additional cells would be read. With cell

11
input, there cannot be any personality variables. If there are self data, person input with variables
fastest moving is the same as cell input.
Drop Subjects Record
This record is signaled by a 1 or 2 in column 24 of the problem record. A 1 indicates that a
drop subject's record is in the setup file. A 2 indicates the subjects that are dropped are the same
for each group so only the first group need have a drop subjects record. The format of this record is
as follows. Subjects correspond to columns in the record. So subject 1 is in column 1, subject 2 in
column 2, and so on. If a subject is to remain in the analysis, a 1 is present in the subject's column .
If the subject is to be dropped a zero or blank is present. So, if there are eight persons, the
record 00002222 would indicate the first four persons are to be included in the analysis and last
four are dropped. If subjects are dropped, there must still be 4 subjects in each group or the
program will stop processing (unless there is no dyadic reciprocity in which there must be at least 3
subjects per group). The drop subjects cannot be used to drop an entire group.
Additional Records
A 1 or a 3 in column 16 of the problem record signals that the format varies from group to
group. Also if the drop subject pattern varies from group to group (a 1 in column 24), a drop
subjects record must be present. If there are both format and drop subjects records, the former must
precede the latter. The format and drop subjects' records are contained in the setup file and not the
data file. There must be as many records of each type as there are groups.
Missing Data
As a rule, SOREMO does not allow for any missing data. Blanks and periods are read as
zeros, and codes for missing data (e.g., 99) are read as real numbers. The only exception is that self
data, coded as blanks, may be missing for all persons on a given variable.
Missing data must either be imputed or the case (usually the actor) must be deleted. There
is no standard way to impute values for round robin structures. One strategy is to use the mean,
median, or the mode of the entire sample, the group, or the actor. If an actor has no data, it is
usually best to delete the person. However, sometimes deleting a person means deleting the entire
group if the minimum sample size is not met. Common sense is needed in developing a reasonable
missing data strategy.
Significance Tests
If there are at least two groups and the jackknife option is not chosen, the tests of actor,
partner, and relationship effects are done using group, weighted by the number of groups less one
as the unit of analysis. Thus, the variance or covariance component is estimated for each group and
the mean of the estimates is tested whether it is different from zero. The user can request jackknife
significance tests which are described in Warner, Kenny, and Stoto (1979). If there are at least six
groups, the jackknife method should not be used as it appears to be overly conservative.
Tests of the correlations that involve only the self- measures or the personality variables are
ordinary tests of partial correlations with group effects partialled. Essentially the correlations are
computed with the group means subtracted. Tests of the personality or self-measures with actor or

12
partner effects involve correlations of each with the effect estimates. Using the formula presented
in Kenny (1994), the actor and partner effects are estimated for each person. The degrees of
freedom for these correlations are the total number of persons minus the number of groups minus
one. Although these are the correlations that are tested, the correlations presented in the output are
the disattenuated correlations which take into account the reliability of actor and partner effects.
Tests of the self-measures and the personality variables are only available for summaries across
multiple groups.
The user can output a file with the individual difference variables (a 5 or 6 is placed in
column 20 of the problem record). Four sets of individual differences are outputted for each person
in each group on separate records: actor effects (A), partner effects (P), self ratings (S), and
personality variables (I). Scores are ordered on the record in the same order as the variables and if
there are more than seven variables there are multiple records. Correlations and variances using
these estimates differ somewhat from SOREMO correlations because the latter are disattenuated.
If option 5 is chosen, all variables have a mean of zero. In analyses of these variables,
group should be controlled so that the degrees of freedom are correct. Because group means are
removed the effective sample size is the number of persons less the number of groups minus one.
If option 6 is chosen, the variables have the group means included. Generally, it is preferable to
use option 5 and make adjustments to the degrees of freedom.
There are no tests of construct variances and covariances within SOREMO. However, these
variances and covariances, as well as group means, can be outputted to a file using output option 4.
Then that output can be read as a data file by some statistical package and tests can be
performed. One should weight by group size less one. The covariances are outputted in matrix
format. Columns 1-3 give the group number, 4-6 record number, columns 7-8 matrix or mean type,
and columns 9-80 the 7 values of the matrix. There symbols are:
DM -- means of the dyadic variables
SM -- means of the self measures
IM -- means of the personality variables
AA -- actor by actor
PP -- partner by partner
AP -- actor by partner
RR -- relationship intrapersonal
R' -- relationship interpersonal
II -- personality variables by personality variables
IA -- personality variables by actor
IP -- personality variables by partner
SS -- self by self
S' -- self by self adjusted
SA -- self by actor
SP -- self by partner
SI -- self by personality variables
This option can be used to perform specialized tests of the univariate estimates. For
instance, one may wish to test that there is more actor than target variance. One sets the number of
constructs equal to the number of variables and has each variable be its own construct. SOREMO
then outputs to a file all of the variances and covariances of the individual measures.

13
If a construct has two indicators, the test of the correlation between these two indicators
evaluates construct variance. So if there are two indicators of a Liking construct, the correlation
between the two indicators at the relationship intrapersonal level evaluates whether there is any
relationship stable variance for the construct.
To test a complex hypothesis (e.g., actor variance is greater than partner) use output option
4 and make the number of constructs equal to the number of variables. For the construct
designation record, use consecutive numbers, e.g. 01020304, etc. The output can then serve as input
for the test of the complex hypothesis. So one would test whether the mean of the actor minus the
partner variance was significantly different from zero. To be consistent with SOREMO, the test
should be weighted by group size less one.
Description of the Output
The initial output consists of information about the job specifications. A list of options
chosen is printed by SOREMO. SOREMO aborts the run if the user has made a request that is not
allowed. SOREMO explains why it stopped the run. However, if a record is missing, SOREMO's
explanation may be misleading. One should on initial runs, put a 1 in column 21 of the problem
record. This will output raw data, and serve as a check that the data were properly inputted,
deleted, and reversed. The remainder of this description concerns the summary output only.
Generally, one only asks for output for each group to check whether the data are properly inputted,
to locate outliers, or to create a data file for significance testing.
Means
The first set of output is the means of the dyadic variables, the self measures, and the
personality variables, if there are any. The mean for each of the self measures is tested to
determine if it differs from the mean of dyadic variables (Group is the unit of analysis.) All means
are weighted by group size. However, all the variances and covariances are weighted by group size
less one. Construct means are the means of the indicator means.
Variance Partitioning
The program presents the actor, partner, and relationship variances for each variable. Also
outputted are the relative variances in which a given variance component is divided by the sum of
the other components. Negative components are treated as zero. For both actor and partner
variance, an asterisk indicates that the component is significantly greater than zero at the .05 level
of statistical significance. All tests of variance components are one-tailed because variances in
principle should not be negative. Relationship variances must be nonnegative and so are not tested
for significance.
Construct variance partitioning. When the constructs' variances are partitioned, they are
broken up into six sources. First, variance is divided into stable and unstable components. Stable
variance represents variance that is consistent across replications. For instance, if liking is
measured at three points in time, the stable variance measures the variance that persists across the
three time points. Unstable variance represents variance that is unique to specific each replication.
Stable variance can be viewed as reliable variance and unstable variance as error, but this
interpretation does not always apply.
14
Both the stable and unstable components are divided into actor, partner, and relationship.
Stable actor variance measures how consistent the actor effect is across replications. So if the
replications are three measures of intelligence, then the stable actor variance would represent the
variance in the actor effect that is consistent across replications. Thus, it measures if a person has a
high actor effect on one replication, does the person have a high actor effect on the other
replications. In a similar fashion, partner variance can be partitioned into stable and unstable
components. Unstable relationship variance corresponds to what was previously called error
(Warner, Kenny& , Stoto, 1979) or occasion (Kenny & La Voie, 1984) variance. Previous work
made the implicit assumption that all the actor and partner variance is stable. This assumption is
not made in this version of SOREMO. Also that previous work presumed that the replications had
the same means and this assumption is not made in the current formulation. The construct
variances and correlations are not tested for statistical significance.
Reliabilities. The reliabilities of the actor and partner effects are given. They provide the
user a sense as to whether one can meaningfully interpret actor and partner effects for a given
variable. Formulas for the reliability are given in Kenny, Lord, and Garg (1986). The reliability is
a function of group size: the larger the group, the greater the reliability.
Before discussing the interpretation of correlations, a few general words of advice may be
helpful in interpreting correlations involving actor or partner effects. One should generally only
interpret correlations involving individual level effects (actor and partner) in which the relevant
variance (actor and partner) is significant. One can determine whether a variable has significant
actor or partner variance by examining the relative variance partitioning table and seeing if there is
an asterisk by the variable's variance. An asterisk means that the variable has nontrivial variance,
and its correlations can be interpreted. If a variable is estimated to have negative variance (Malloy
& Kenny, 1986), then all of its correlations are automatically set to zero. Negative variance may
occur when the actual variance is very small. In this case, it should be considered zero variance,
and correlations involving these variables should not be interpreted. Occasionally, a correlation
can be larger than one. Assuming both the variances are significant, such a large correlation
indicates that the true correlation is a large value near one. If the variances are non-significant, an
anomalously high correlation should not be interpreted. SOREMO automatically changes these out
of range correlations to one or minus one.
Self-other and reciprocity correlations. The program also outputs reciprocity correlations
and self correlations for each variable. There are two reciprocity correlations: generalized and
dyadic. The generalized correlation is the actor-partner correlation and the dyadic correlation is the
relationship- interpersonal correlation. Both of these are described below. The self-other
correlations measure the correlations of self with the actor and partner effects. An asterisk by these
correlations indicates that the correlation is statistically significant at the .05 level of significance
(two-tailed). A question mark after the asterisk indicates that the correlation involves either an
actor or partner effect that does not have statistically reliable variance. (It is possible for the
numerator of the correlation to be statistically significant but the denominator to be zero. In such a
case, the correlation is outputted as zero and next to it is an asterisk and a question mark).
If the user requests multivariate output a series of matrices follow. A brief description of
each is provided.
Actor by Actor

15
For the actor-actor covariance matrix, the diagonal contains the actor variances. Off
diagonal values are the actor-actor covariances. They are more easily interpreted by examining the
actor-actor correlations. Say the actor-actor correlation between peer ratings of intelligence and
peer ratings of extroversion is .60. That would indicate that if a person has a high actor effect on
ratings of intelligence (he or she sees others as intelligent), he or she would tend to have a high
actor effect on ratings of extroversion (he or she sees others as extroverted).
Partner by Partner
For the partner-partner covariance matrix the diagonal contains the partner variances. Off-
diagonal values are the partner-partner covariances. They are more easily interpreted by examining
the partner-partner correlations. Say the partner-partner correlation between the variables of
observer rated dominance and friendliness is .20. That would indicate that if a person has a high
partner effect on dominance (that is, he or she elicits dominance from others), he or she would tend
to have a somewhat positive partner effect on friendliness (that is, he or she elicits friendliness from
others).
Actor (Row) by Partner (Column)
One generally only examines the correlation matrix. The diagonal of the matrix gives the
actor-partner correlation for a given variable. So if the variable is smiling, then a positive actor-
partner correlation would indicate that, if a person tends to smile frequently, his or her partner tends
to smile frequently. Unlike the previous two matrices, the actor-partner matrix is not symmetric.
So, for variables X and Y, there is both the actor X, partner Y correlation and the actor Y, partner X
correlation. Actor forms the row of the matrix and partner the column. And so for the following
matrix
X Y
X .4 .3
Y .1 .7
the actor X, partner Y correlation is .3 and the actor Y, partner X correlation is .1. The actor-
partner correlation is .4 for X and .7 for Y.
The previous three matrices examine variables at the individual level. The next two
matrices are at the dyadic level, representing the two types of correlations at the dyadic level:
intrapersonal and interpersonal relationship effects.
Relationship-Intrapersonal
Consider the relationship effect of person A interacting with B. The relationship effect of A
with B for one variable can be correlated with the relationship effect of A with B for a second
variable. This would be an intrapersonal correlation because the same person is the actor in each
variable. For example, the intrapersonal relationship correlation between smiling and gazing
assesses the amount of smiling of A with B with the amount of gazing of A with B.
Relationship-Interpersonal
The relationship effect of person A with B for one variable can be correlated with the
relationship effect of B with A for a second variable. This would be an interpersonal correlation
because a different person is the actor in each variable. The diagonal of the relationship-

16
interpersonal matrix gives the dyadic reciprocity. So if the variable is perceptions of friendliness
and the diagonal element is -.3, then if A feels that B is friendly, then B tends to think that A is not
friendly. The off diagonal elements measure the correlations between relationship components in
which the persons flip-flop as actor and partner. So for instance, the interpersonal relationship
correlation between smiling and gazing assesses the amount of smiling of A with B with the
amount of gazing of B with A.
This matrix is set to zero and not outputted if there is no dyadic reciprocity (a 1 in column
22 of the problem record)
Personality Variables by Personality Variables
These are the ordinary correlations with the group means subtracted. So if there are two
personality variables, say self- monitoring and self-consciousness, then a correlation between the
two would be based on taking each person's self-monitoring score, subtracting the group's mean on
self-monitoring, and correlating it with the parallel score for self-consciousness.
Personality Variables (Row) by Actor (Column)
These correlations state the association between an actor effect and a personality variable.
For instance, do people who are high in self-monitoring see others as more or less intelligent?
Personality Variables (Row) by Partner (Column)
These correlations ask whether there is any association between a partner effect and a
personality variable. For instance, are people who are high in self-monitoring seen by others as
more or less intelligent?
Self by Self
These are the ordinary correlations with group mean subtracted. So if there are two self
ratings, say intelligence and popularity, then a correlation between the two would be based on
taking each person's self rating of intelligence and subtracting the group's mean and correlating it
with the parallel score for self rating of popularity.
Self by Self Adjusted
This matrix is optional and can be requested by asking for technical output in column 15 of
the problem record. There are two types of output here. First there are the regressions of the self-
measure on the actor and partner effects and then there is the adjusted covariance and correlation
matrix.
First discussed are the regressions. If self ratings do not differ from other ratings, then the
person's actor and partner effect should emerge in the self measure and the regression coefficients
should be equal to 1.0. To the extent that the coefficients are greater than 1.0, the component is
more important when rating self; if less than 1.0, the component is less important when rating self.
If it is zero, then the component is not present in self ratings. If it is negative, then it is present in
self ratings but in the opposite direction of the other ratings. For instance, if the variable is ratings
of intelligence and the self-partner regression coefficient is negative, then a person whom peers feel
is stupid, sees him or herself as intelligent.

17
After the regressions have been computed, the effects of actor and partner from the peer
ratings are removed. The covariance and correlation matrices for the self ratings can be
recomputed with the adjustments made for actor and partner effects. The diagonal of this matrix is
in essence the relationship variances for self, and they can be compared to the relationship
variances for the dyadic variables.
Self (Row) by Actor (Column)
These correlations determine whether persons who have a high actor effect see themselves
as high on the trait. For instance, in a study of peer ratings of social adjustment, the self actor
correlation would ask whether persons who see others as adjusted see themselves as adjusted.
Self (Row) by Partner (Column)
These correlations determine whether persons who have a high partner effect see
themselves as high on the trait. For instance, in a study of peer ratings of social adjustment, the
self-partner correlation would ask whether persons who are seen by their peers as adjusted see
themselves as adjusted.
Personality Variables by Self
These are ordinary correlations, with group controlled. That is, a personality variable is
correlated with a self measure. For both variables the group means are subtracted.
Disclaimer and Availability
Although every effort has been made to ensure accuracy, there is no guarantee that all
results are totally accurate. Please proceed with caution. In particular, the following have not been
extensively tested:
unequal group sizes,
dropped subjects,
self measures,
latent constructs,
personality variables,
variable reversal,
significance tests with the above, and
no reciprocity
Please report all inquiries, errors, and suggested modifications to:
David A. Kenny
Department of Psychology
University of Connecticut
Storrs, CT 06269-1020
This program supersedes OBIRD and MOBIRD which were written by Rebecca Warner, Richard
Polley, Judith Harackiewicz, and Lawrence La Voie. Lisa Cassady assisted in writing this
documentation and Bernadette Park suggested the modification of the program for PC use.

18
References
Kenny, D. A. (1994). Interpersonal perception: A social relations analysis. New York:
Guilford.
Kenny, D. A., & LaVoie, L. (1984). The social relations model. In L. Berkowitz (Ed.), Advances in
Experimental Social Psychology, (Vol. 18, pp. 142-182). Orlando, FL: Academic Press.
Kenny, D. A., Lord, R., & Garg, S. (1986). A social relations analysis of peer ratings.
Unpublished paper, University of Connecticut.
Malloy, T. E., & Kenny, D. A. (1986). The social relations model: An integrative method for the
study of personality. Journal of Personality, 54, 101-124.
Warner, R., Kenny, D. A., & Stoto, M. (1979). A new round robin analysis of variance for social
interaction data. Journal of Personality & Social Psychology, 37, 1742-1757.
Illustration
To illustrate some of the features of SOREMO, the data in Warner, Kenny, and Stoto (1979)
are re-analyzed. (See Table 7 of the paper.) The results differ slightly from those in the paper
because latent constructs are handled differently. A total of eight persons interacted with each
other at three time points which are designated as TIME 1, TIME 2, and TIME 3. The personality
variable of gender is included in this analysis. Men are coded with a +1 and women with -1. (The
partner by personality variable correlations show that there is a trend for women to elicit more
speech than men).
The personality variable is read after the dyadic variables and are contained on a separate
record. Separate format records are used for the dyadic and the personality variables. The number
of dyadic variables is 3, the number of persons is 8, and the number of groups is 1. To illustrate the
group size record, the group size is left blank on the problem record. The three measures are
combined to form a single construct, called TIME SPEAK. There can be no correlated easurement
error because there is only one construct. For PC-SOREMO, there are two files: the setup file and
the data file.
Setup file:
WARNER, KENNY, AND STOTO (1979) DATA
3 1120201 2 1
21
TIME 1 TIME 2 TIME 3
GENDER
202020
202020
TIME SPEAK
(1F3.0)

19
(0X,1F2.0)
Data File:
55 65 59 62 87 69 81
58 58 54 68 68 76 76
45 85 50 79 76 56 71
1
22 21 34 25 35 39 58
50 42 27 38 35 36 53
36 35 38 34 49 53 28
1
31 56 34 31 24 34 36
45 45 40 33 25 48 16
12 54 24 37 42 37 30
-1
26 62 68 46 31 58 72
30 62 55 25 89 43 83
45 60 81 65 33 59 65
-1
66 56 70 67 36 58 73
70 56 89 69 54 53 56
52 58 64 44 37 71 71
1
27 30 74 45 49 70 40
49 53 81 11 35 78 69
28 41 47 48 37 46 41
1
52 40 77 32 52 49 67
45 66 54 40 48 22 65
67 34 60 48 23 49 61
-1
39 47 75 47 37 45 37
59 80 90 47 51 46 67
45 70 73 49 37 51 51
-1
The output from this run is
PROGRAM SOREMO VERSION V.2 7/95
PROGRAM DESIGNED FOR SOCIAL RELATIONS ANALYSIS
OF ROUND ROBIN DESIGNS
WARNER, KENNY, AND STOTO (1979) DATA
GROUP SIZES UNEQUAL
NUMBER OF DYADIC VARIABLES: 3
NUMBER OF GROUPS: 1

20
NUMBER OF CONSTRUCTS: 1
NUMBER OF PERSONALITY VARIABLES: 1
JACKKNIFE: YES
INPUT PATTERN
PERSONS FASTEST MOVING
PERSONALITY VARIABLES AFTER DYADIC VARIABLES
SEPARATE FORMAT RECORD FOR PERSONALITY VARIABLES
OUTPUT
MULTIVARIATE: NO
SUMMARY ONLY: YES
GROUP # SIZE
1 8
DYADIC VARIABLE NAMES: TIME 1 TIME 2 TIME 3
PERSONALITY VARIABLE NAMES: GENDER
****CONSTRUCT SPECIFICATIONS****
NUMBER OF INDICATORS OF CONSTRUCT TIME SPEAK IS 3
TIME 1 IS INDICATOR 1
TIME 2 IS INDICATOR 2
TIME 3 IS INDICATOR 3
GROUP BEING PROCESSED: 1
INPUT FORMAT
(8F3.0)
PERSONALITY VARIABLE FORMAT
(3X,1F2.0)
END OF INPUT SETUP
WARNER, KENNY, AND STOTO (1979) DATA
RESULTS FOR THE 1 GROUPS
MEANS FOR THE DYADIC VARIABLES
TIME 1 TIME 2 TIME 3
49.6786 53.2321 49.6071

21
MEANS FOR THE CONSTRUCTS
TIME SPEAK
50.8393
MEANS FOR THE PERSONALITY VARIABLES
GENDER
.0000
ABSOLUTE VARIANCE PARTITIONING
VARIABLE ACTOR PARTNER RELATIONSHIP
TIME 1 102.525 46.573 156.666
TIME 2 76.581 38.712 240.639
TIME 3 87.418 17.775 154.671
RELATIVE VARIANCE PARTITIONING
VARIABLE ACTOR PARTNER RELATIONSHIP
TIME 1 .335 .152 .512
TIME 2 .215 .109 .676
TIME 3 .336 .068 .595
RELIABILITY OF EFFECT ESTIMATES
ACTOR PARTNER
TIME 1 .827 .685
TIME 2 .707 .549
TIME 3 .811 .466
(BASED ON GROUP SIZE OF 8.00)
RECIPROCITY CORRELATIONS
VARIABLE ACTOR-PARTNER RELATIONSHIP
TIME 1 -.593 -.428
TIME 2 -.400 -.666
TIME 3 -.822 -.668*
WARNER, KENNY, AND STOTO (1979) DATA
PERSONALITY VARIABLES(ROW) BY ACTOR(COL)
CORRELATION MATRIX

22
TIME 1 TIME 2 TIME 3
GENDER .2293 .2640 .0643
T-TEST SUMMARY RESULTS, DF = 6
TIME 1 TIME 2 TIME 3
GENDER .5223 .5577 .1421
RESULTS POOLED ACROSS REPLICATIONS
STABLE EFFECTS
CORRELATION MATRIX
GENDER .1804
PERSONALITY VARIABLES(ROW) BY PARTNER(COL(
CORRELATION MATRIX
TIME 1 TIME 2 TIME 3
GENDER -.9081 -.4716 -.8399
T-TEST SUMMARY RESULTS, DF = 6
TIME 1 TIME 2 TIME 3
GENDER -2.7893 -.9139 -1.7131
RESULTS POOLED ACROSS REPLICATIONS
STABLE EFFECTS
CORRELATION MATRIX
GENDER -.6354
VARIANCE PARTITIONING OF CONSTRUCTS
VARIABLE STABLE UNSTABLE
TIME SPEAK .508 .492
STABLE CONSTRUCT VARIANCE
ABSOLUTE VARIANCE PARTITIONING
VARIABLE ACTOR PARTNER RELATIONSHIP
TIME SPEAK 93.532 44.200 25.659

23
RELATIVE VARIANCE PARTITIONING
VARIABLE ACTOR PARTNER RELATIONSHIP
TIME SPEAK .291 .137 .080
RECIPROCITY CORRELATIONS
VARIABLE ACTOR-PARTNER RELATIONSHIP
TIME SPEAK -.695 .525
UNSTABLE CONSTRUCT VARIANCE
ABSOLUTE VARIANCE PARTITIONING
VARIABLE ACTOR PARTNER RELATIONSHIP
TIME SPEAK -4.690 -9.847 158.333
RELATIVE VARIANCE PARTITIONING
VARIABLE ACTOR PARTNER RELATIONSHIP
TIME SPEAK .000 .000 .492
RECIPROCITY CORRELATIONS
VARIABLE ACTOR-PARTNER RELATIONSHIP
TIME SPEAK .000 -.781
END OF PROCESSING FOR ONE GROUP