Embed Size (px)
Citation preview
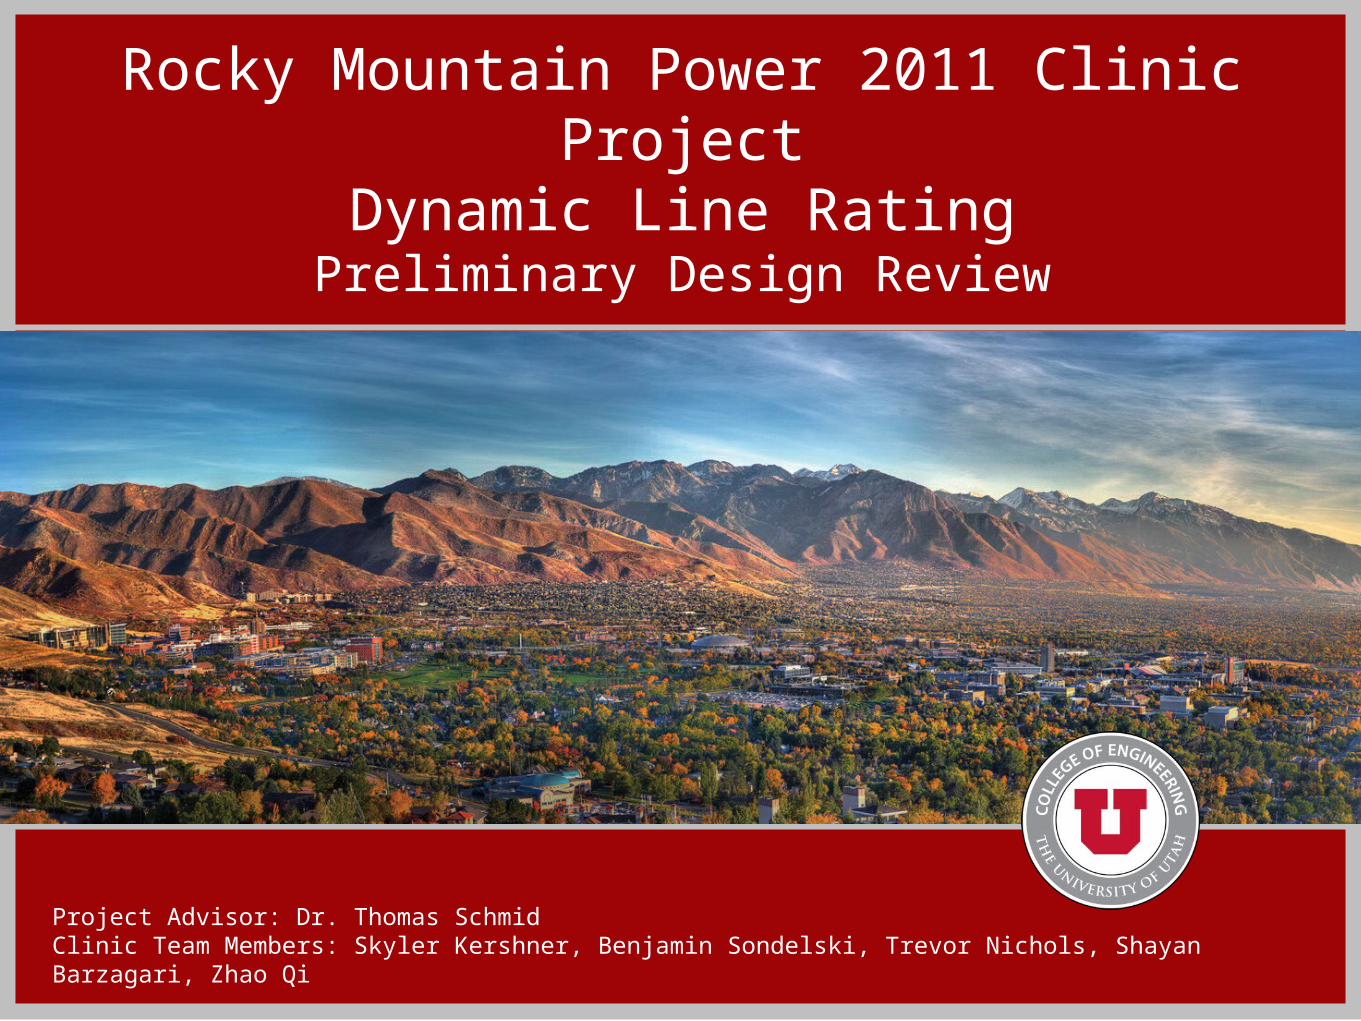
Rocky Mountain Power 2011 Clinic Project
Dynamic Line RatingPreliminary Design Review
Project Advisor: Dr. Thomas SchmidClinic Team Members: Skyler Kershner, Benjamin Sondelski, Trevor Nichols, Shayan Barzagari, Zhao Qi
2
Presentation Overview
• Project Background
• Goals
• Proposed Solution
• Additional Considerations
• System Implementation
• Model
• Expected Results
• Budget / Timeline
3
Project Background
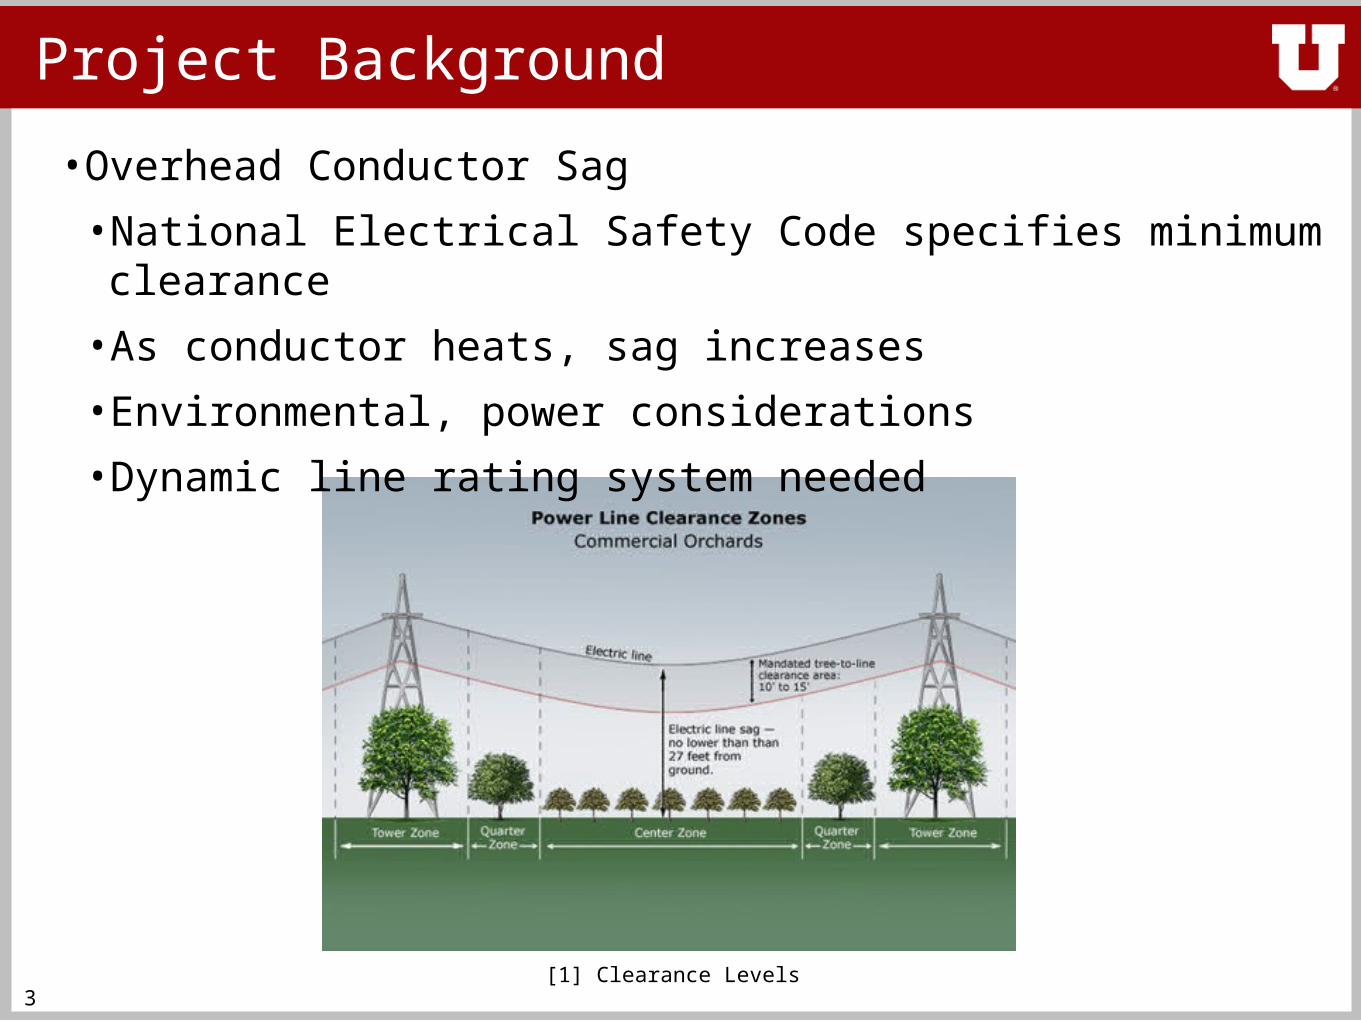
• Overhead Conductor Sag
• National Electrical Safety Code specifies minimum clearance
• As conductor heats, sag increases
• Environmental, power considerations
• Dynamic line rating system needed
[1] Clearance Levels
4
Project Goals
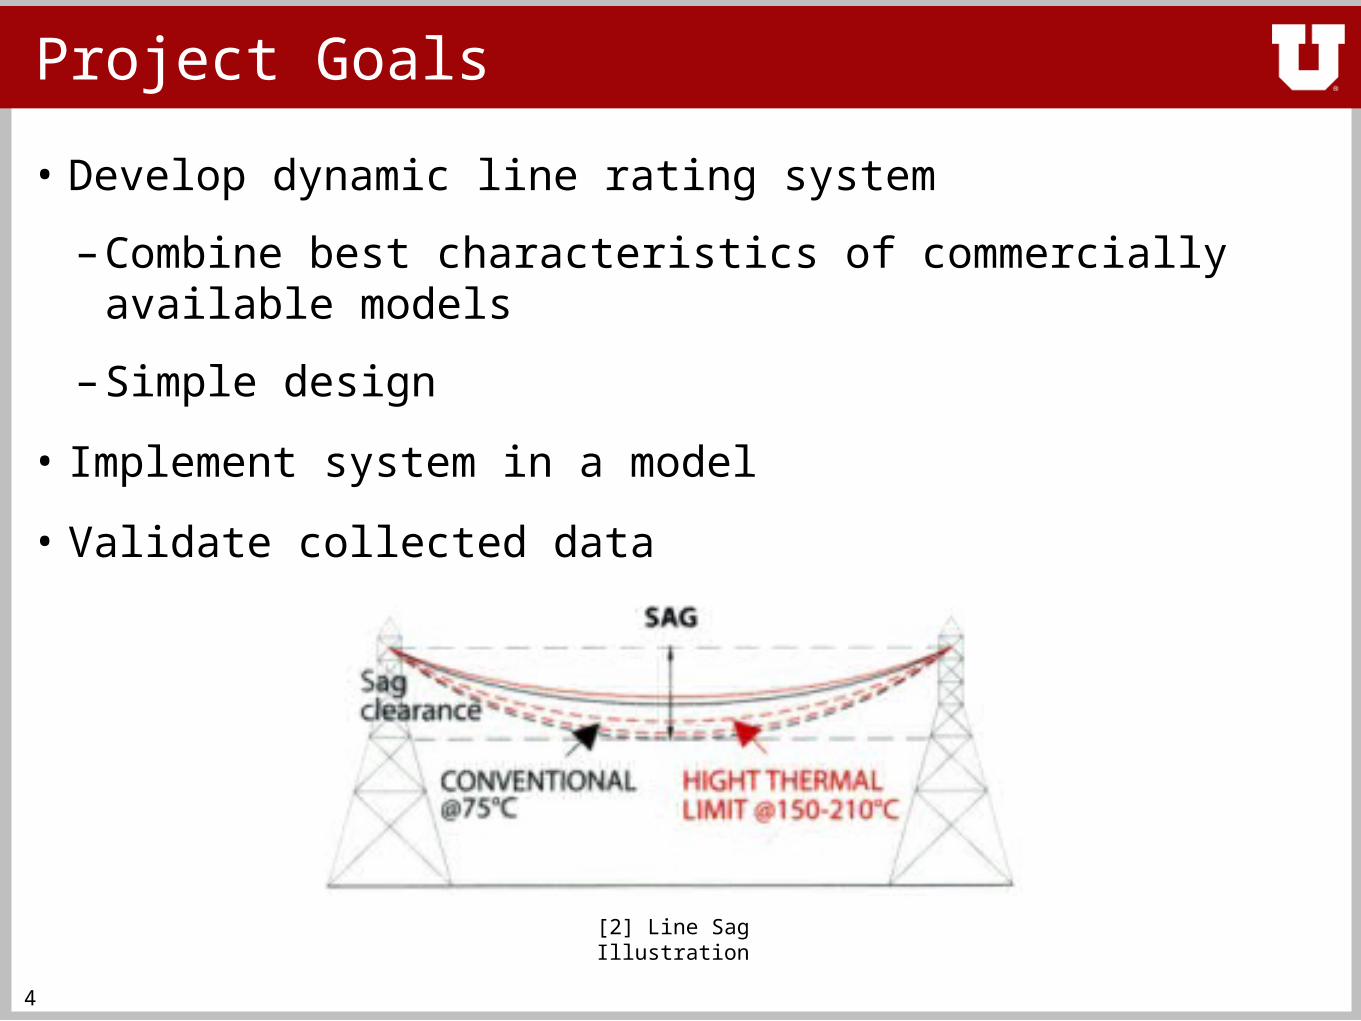
• Develop dynamic line rating system
– Combine best characteristics of commercially available models
– Simple design
• Implement system in a model
• Validate collected data
[2] Line Sag Illustration
5
Proposed Method: Thermal Imaging
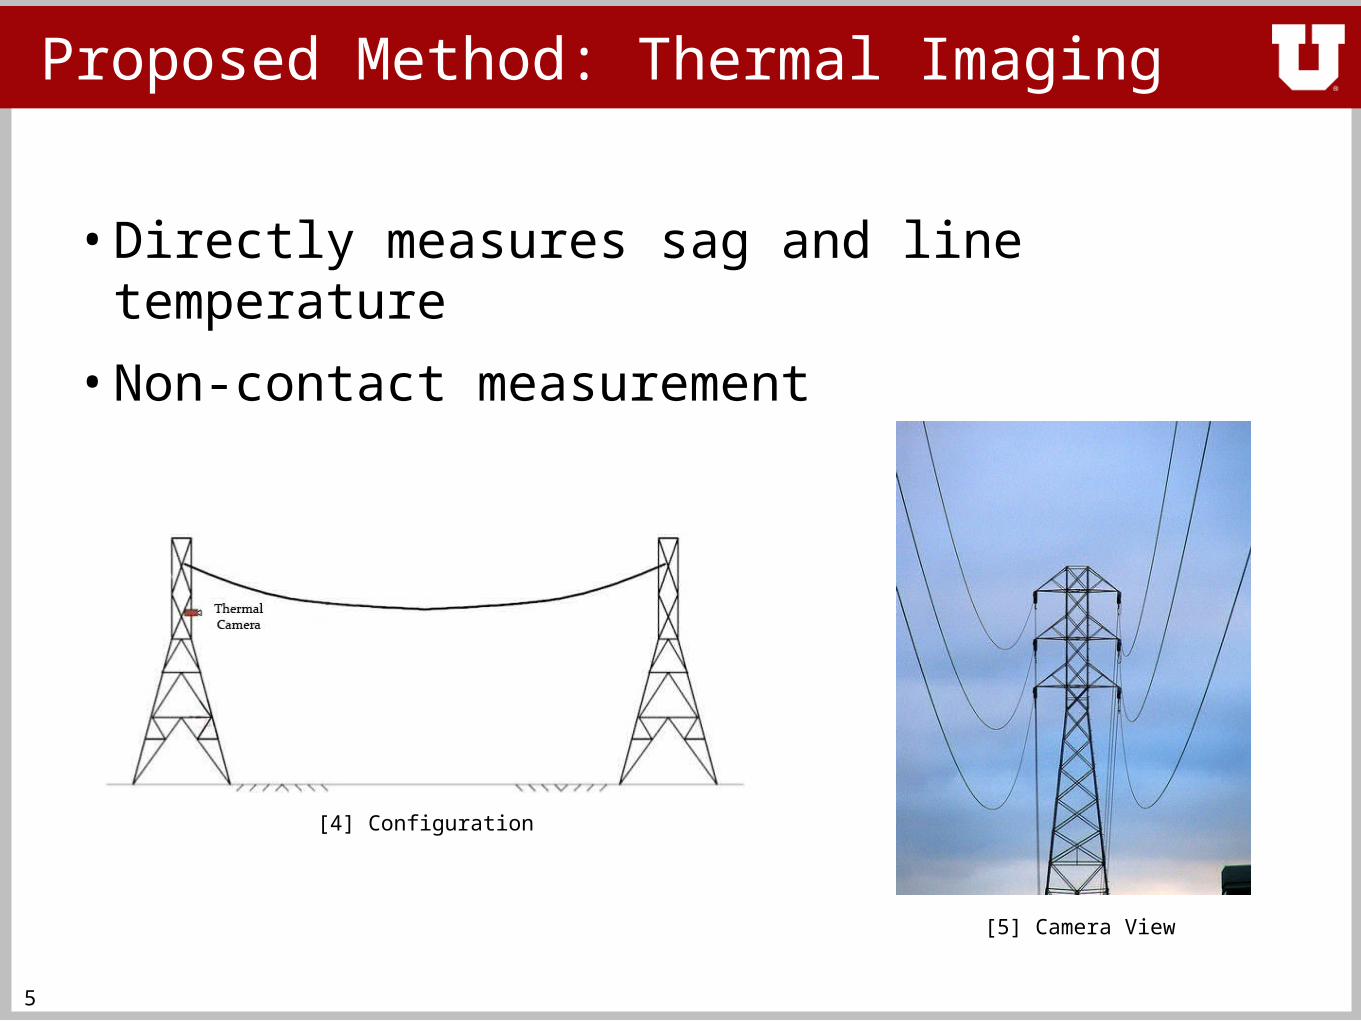
• Directly measures sag and line temperature
• Non-contact measurement
[4] Configuration
[5] Camera View
6
Proposed Method: Thermal Imaging
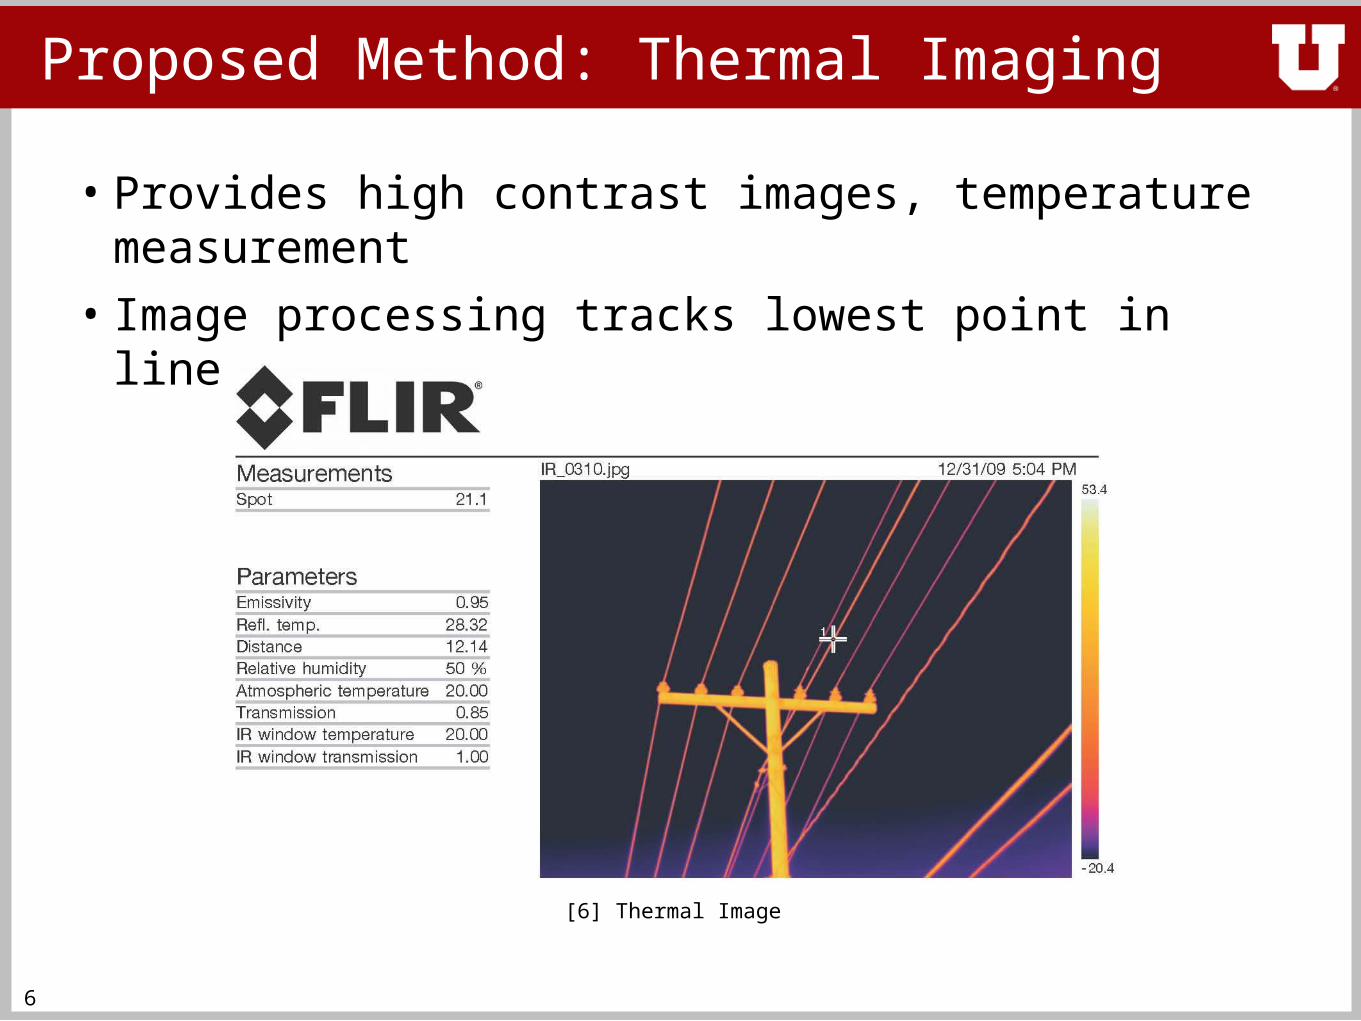
• Provides high contrast images, temperature measurement
• Image processing tracks lowest point in line
[6] Thermal Image
7
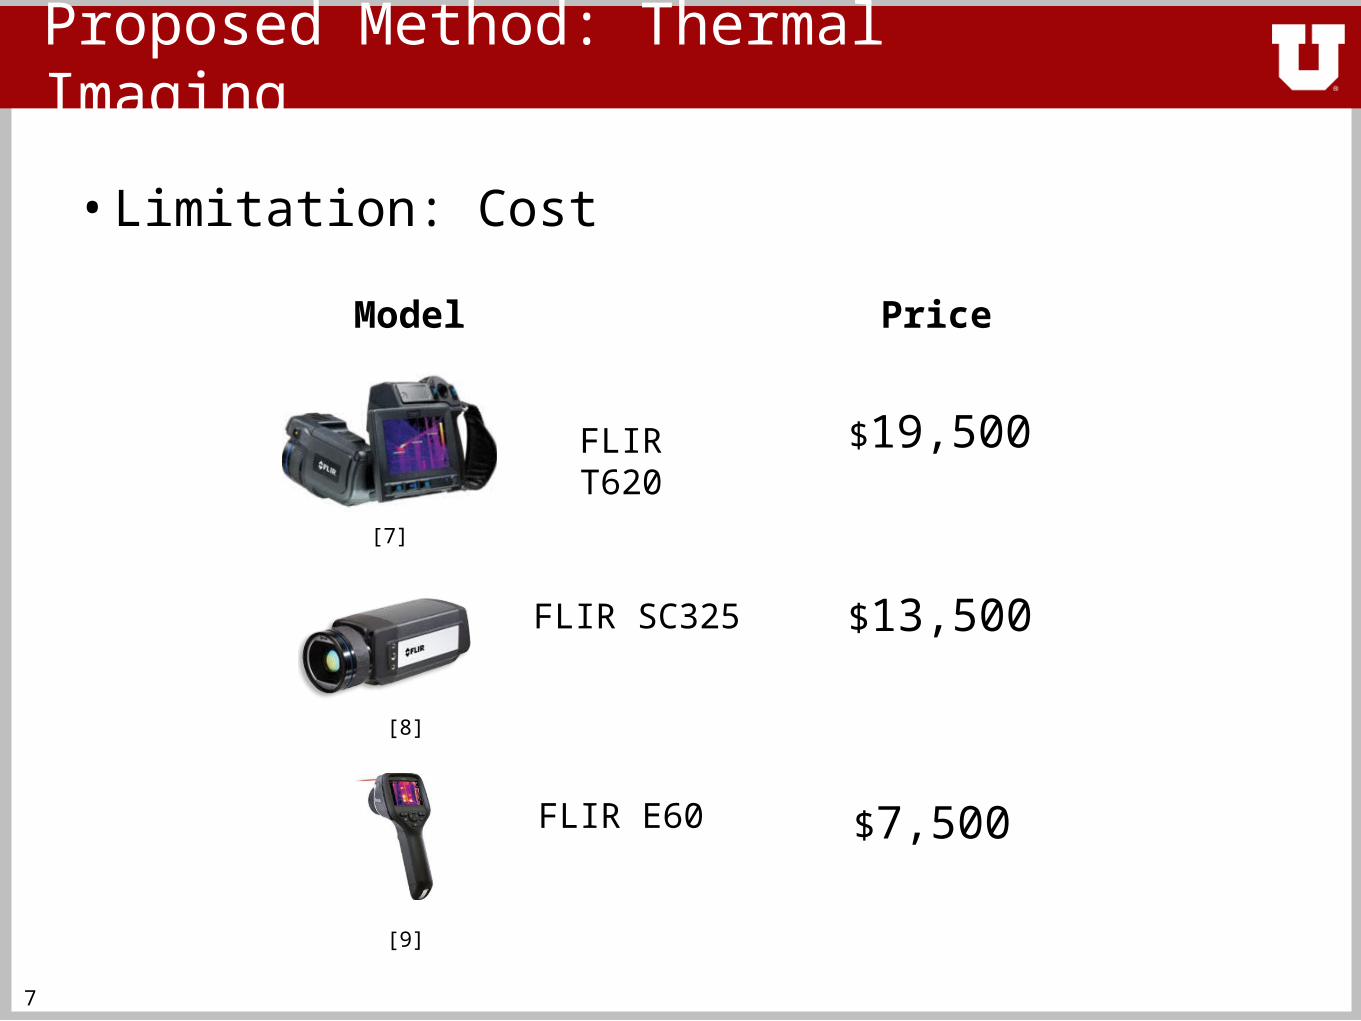
Proposed Method: Thermal Imaging
• Limitation: Cost
Model Price
FLIR T620 $19,500
FLIR SC325 $13,500
FLIR E60 $7,500
[7]
[8]
[9]
8
Conclusion
• Need for dynamic line rating
• Goals
• Thermal imaging as potential solution
• Limitations of thermal imaging
–Other methods needed
9
Overview
• Sag – Tension rating and calculation
• Tension as a solution
• Tension as a problem
• Design Problems/Solutions**
• Conclusion
10
Tension as a Possible Solution
• All-Inclusive Measurement–line temperature, environment temperature, solar
absorption
• Accuracy
• Simplicity
• Low-Power Draw
11
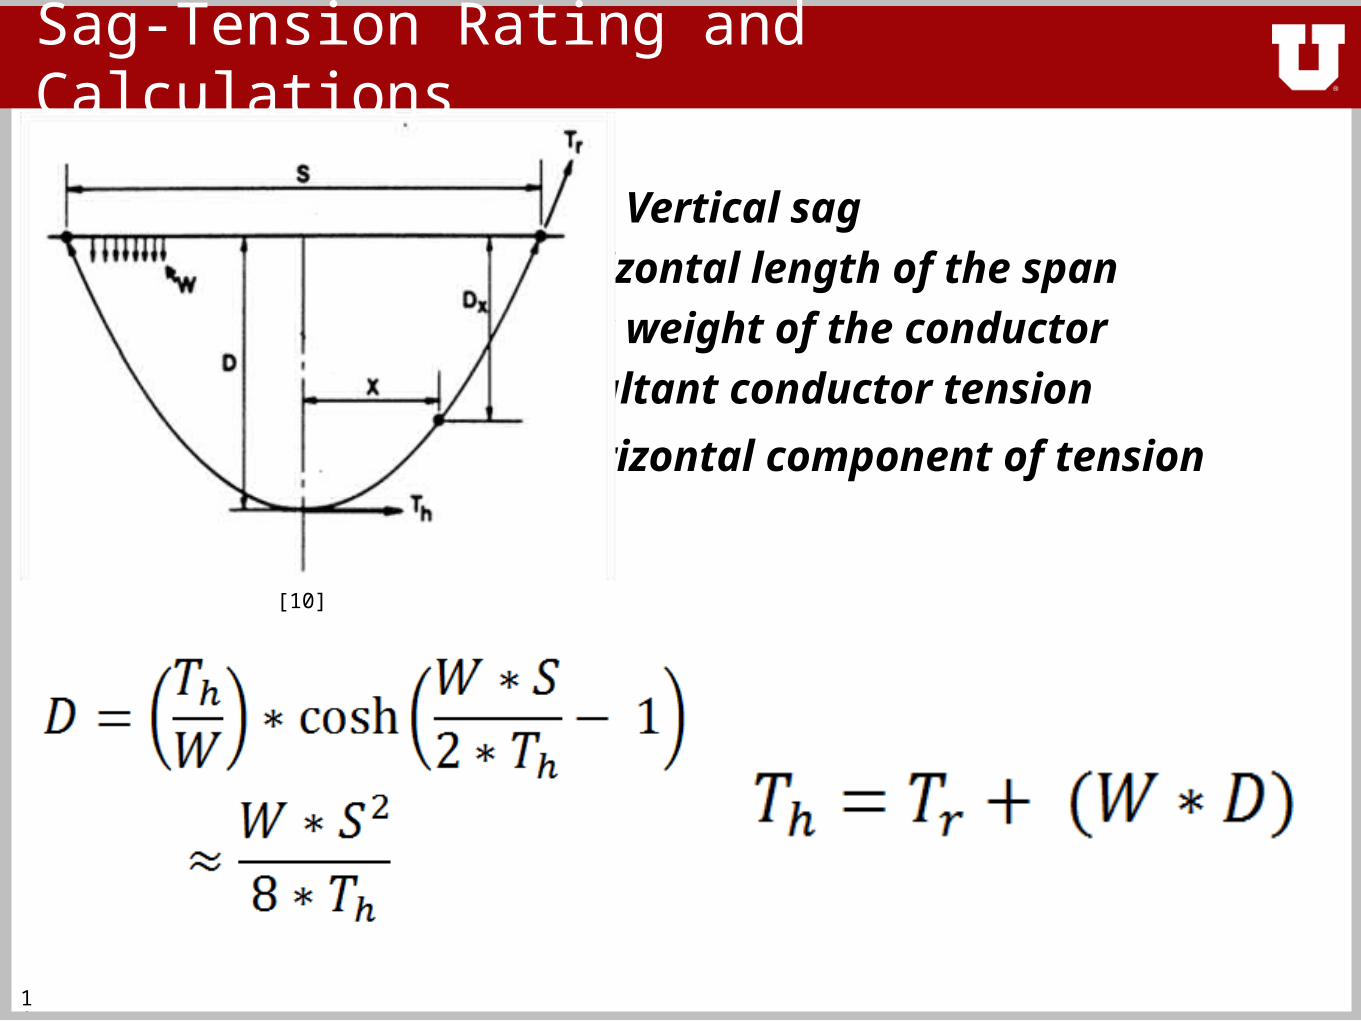
•
D – Vertical sag
S – Horizontal length of the span
W – Unit weight of the conductor
Tr – Resultant conductor tension
Th – Horizontal component of tension
Fig. 1 Parabolic Sag Curve
Sag-Tension Rating and Calculations
[10]
12
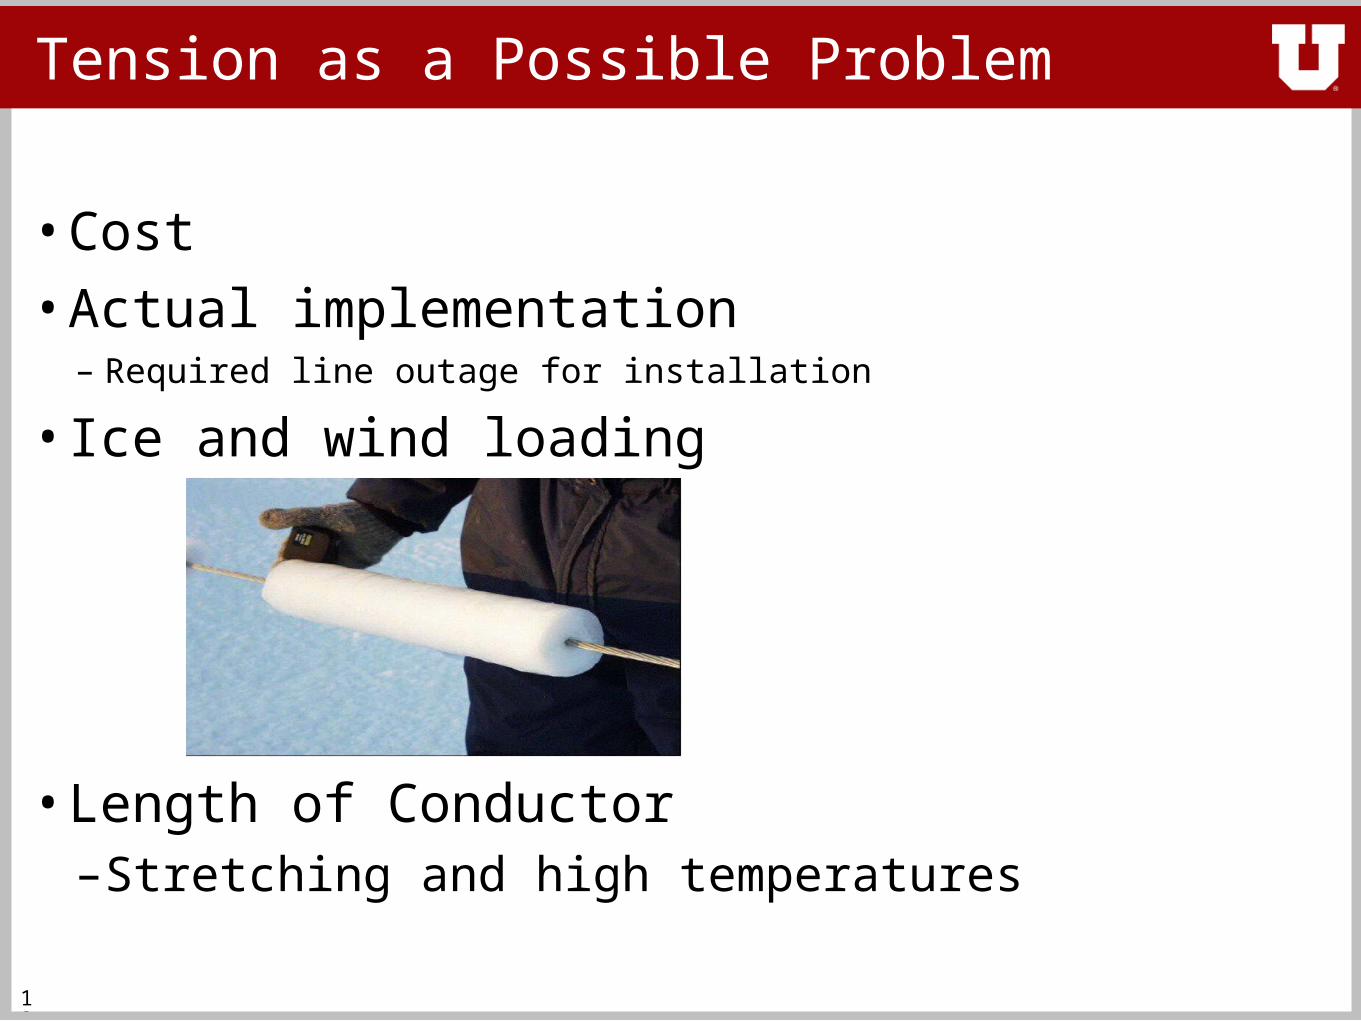
Tension as a Possible Problem
• Cost
• Actual implementation– Required line outage for installation
• Ice and wind loading
• Length of Conductor–Stretching and high temperatures
13
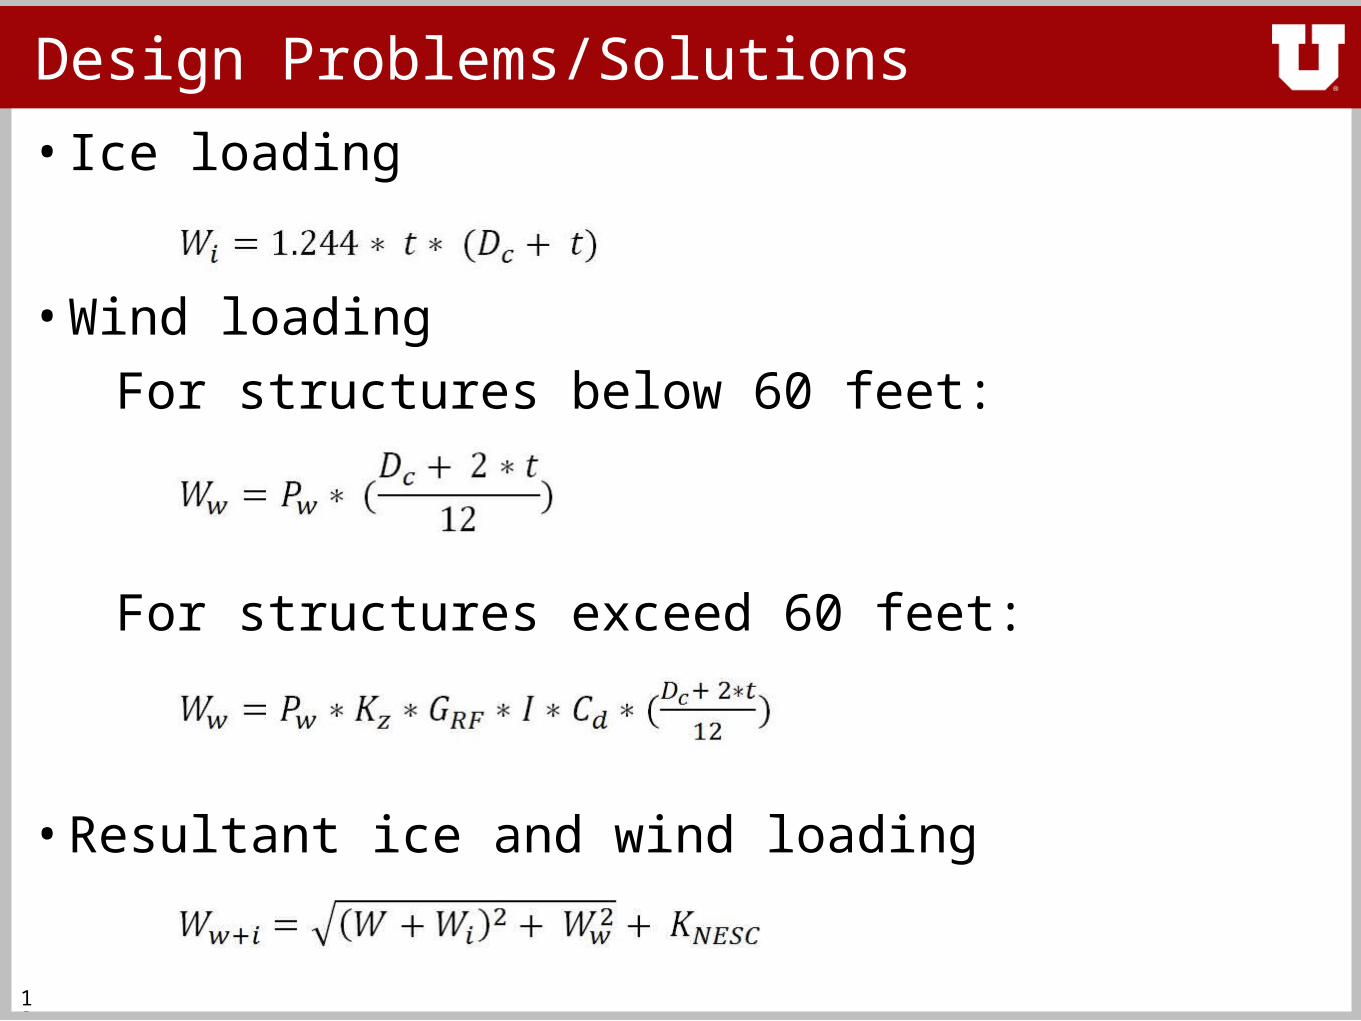
Design Problems/Solutions
• Ice loading
• Wind loading
For structures below 60 feet:
For structures exceed 60 feet:
• Resultant ice and wind loading
14
Conclusion
• Overview of Tension
• Tension pros
• Tension cons
• Solutions to tension cons
15
Overview
• Magnetic Field Sensing
• Implementation difficulties
• Build a model - advantages
• Conclusion
16
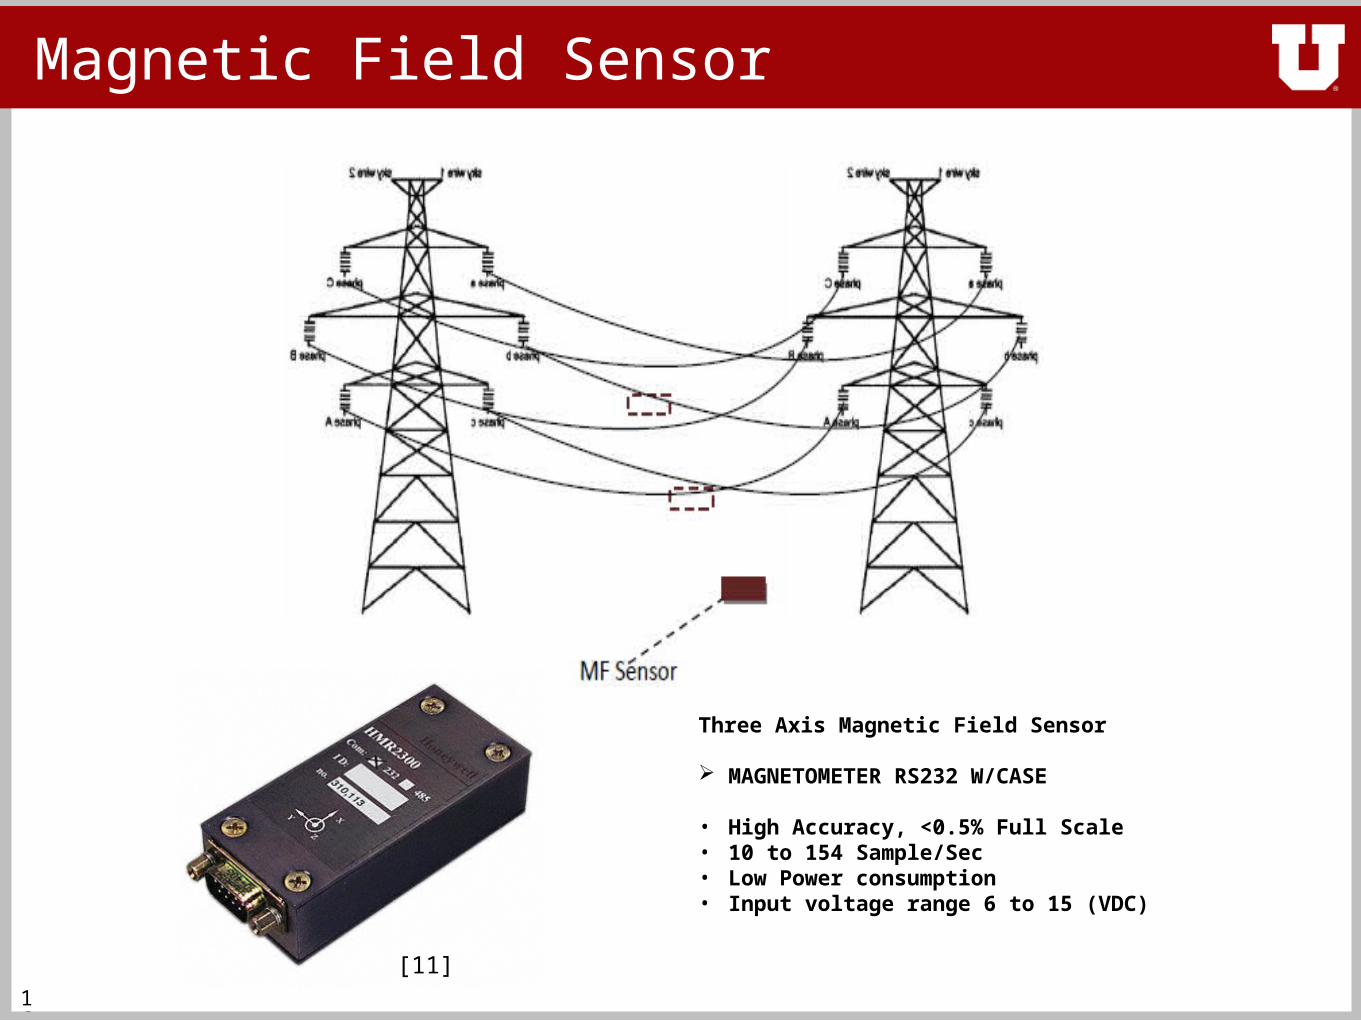
Magnetic Field Sensor
Three Axis Magnetic Field Sensor
MAGNETOMETER RS232 W/CASE
• High Accuracy, <0.5% Full Scale• 10 to 154 Sample/Sec• Low Power consumption• Input voltage range 6 to 15 (VDC)
[11]
17
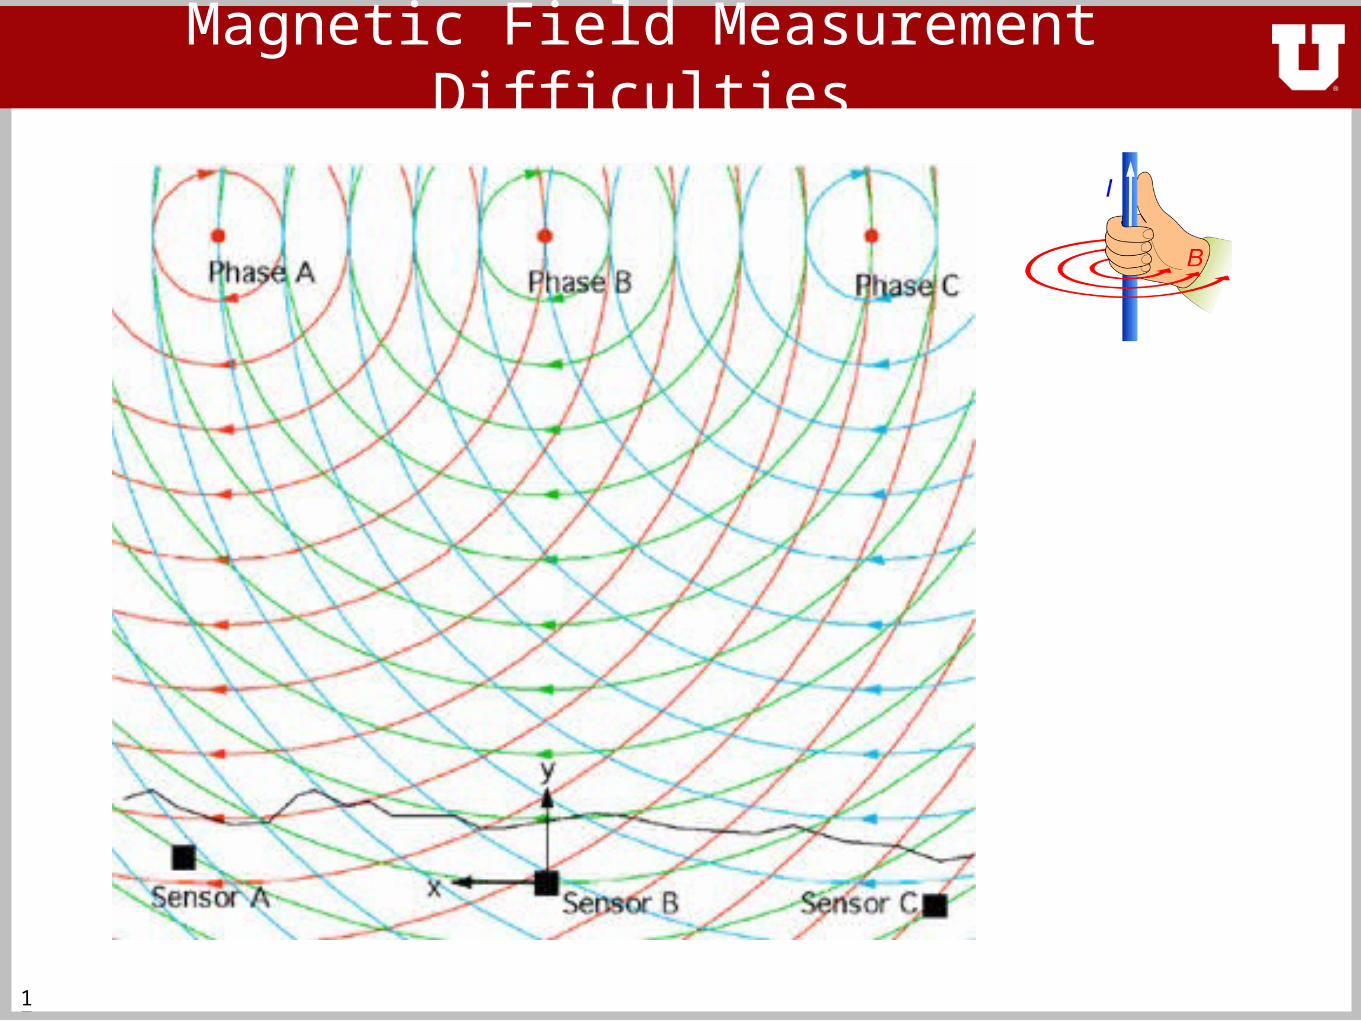
Magnetic Field Measurement Difficulties
18
Build a Model
• Test wide range of aspects
• Control experiment variables and environment
• Develop realistically implementable solutions
• Retain a low budget
19
Conclusion
• Magnetic Sensing
• Magnetic Difficulties
• Advantages of Model
20
Overview
• Proposed Solution
• Math defining model requirements
• Measuring Temperature
• Conclusion
21
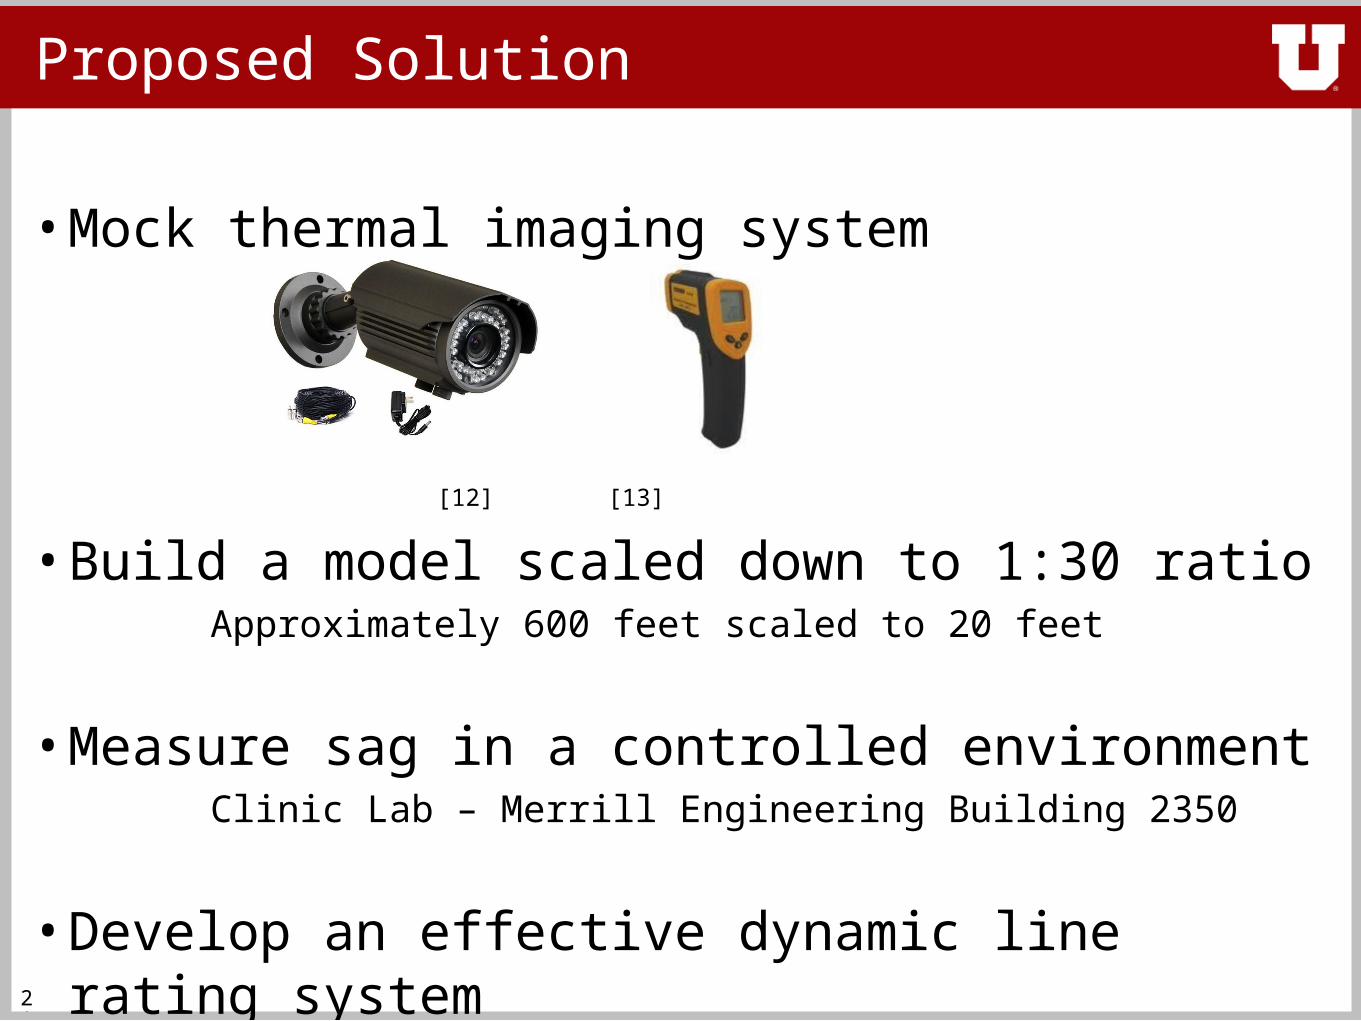
Proposed Solution
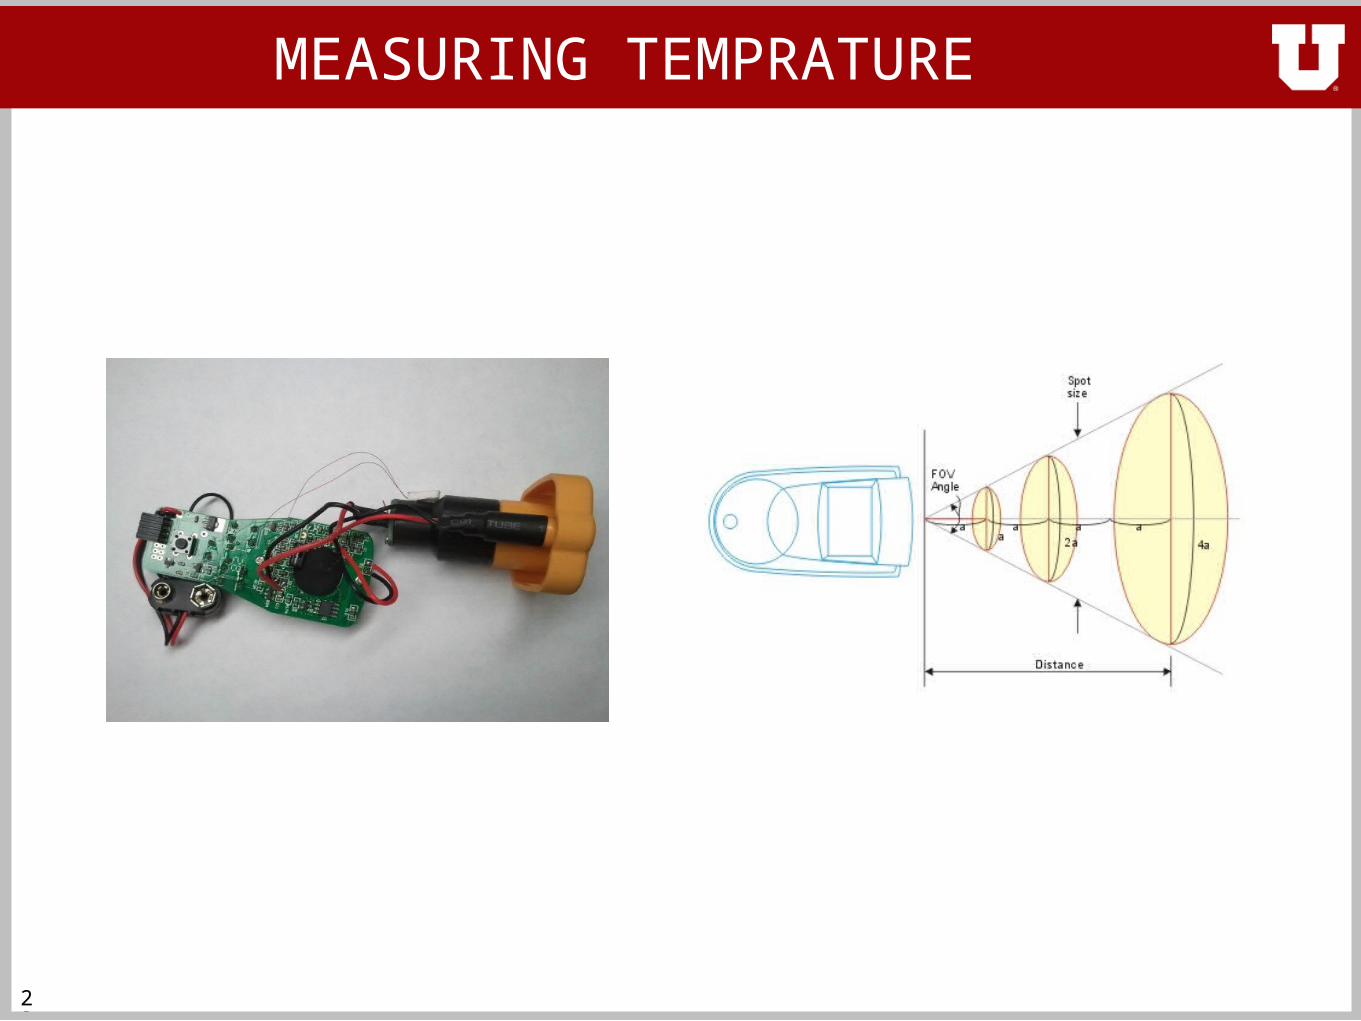
• Mock thermal imaging system
[12] [13]
• Build a model scaled down to 1:30 ratioApproximately 600 feet scaled to 20 feet
• Measure sag in a controlled environmentClinic Lab – Merrill Engineering Building 2350
• Develop an effective dynamic line rating system
22
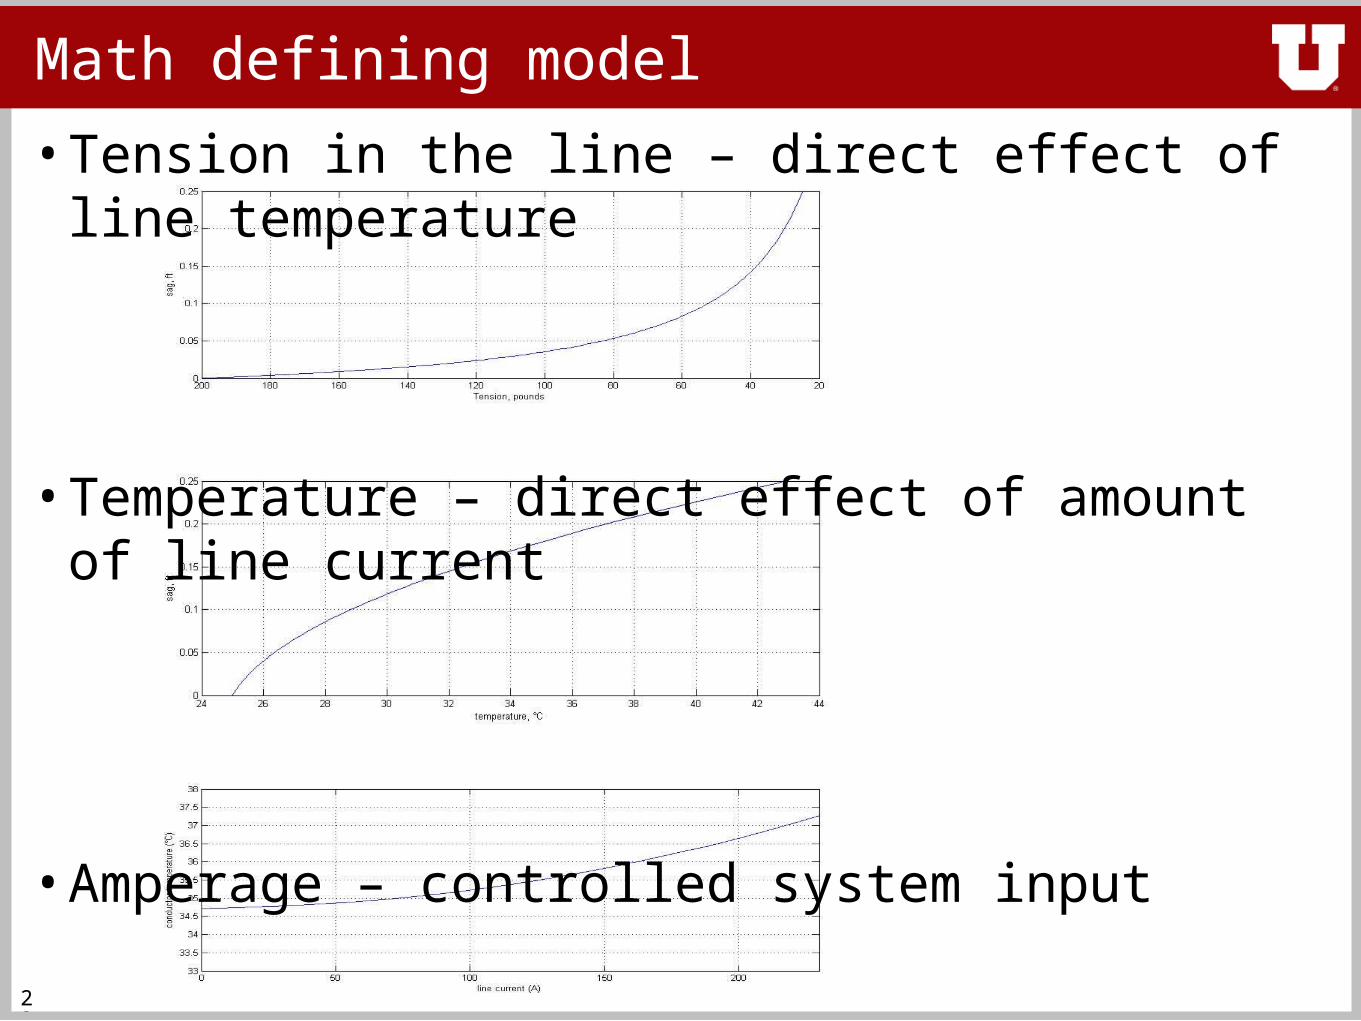
Math defining model
• Tension in the line – direct effect of line temperature
• Temperature – direct effect of amount of line current
• Amperage – controlled system input
23
MEASURING TEMPRATURE
24
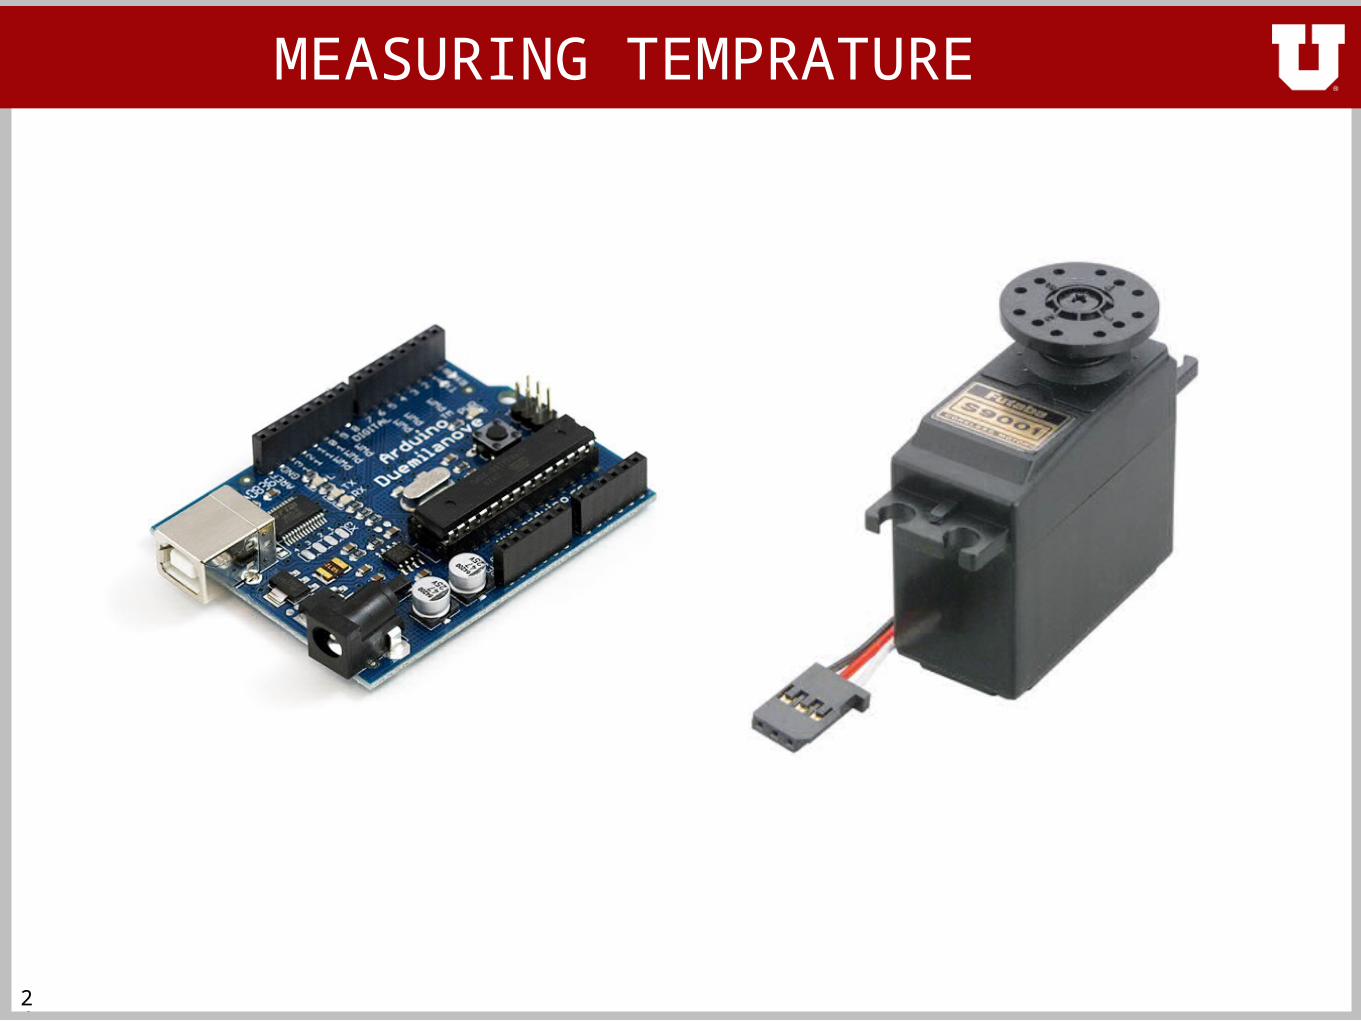
MEASURING TEMPRATURE
25
Conclusion
• Proposed Solution
• Characteristics of model
• Mock thermal imaging–IR thermometer–IR video camera
Physical Model: Introduction
• benefits of in-house scale model
• power supply
• electrical diagram
• conductor span
• expected model performance
26
27
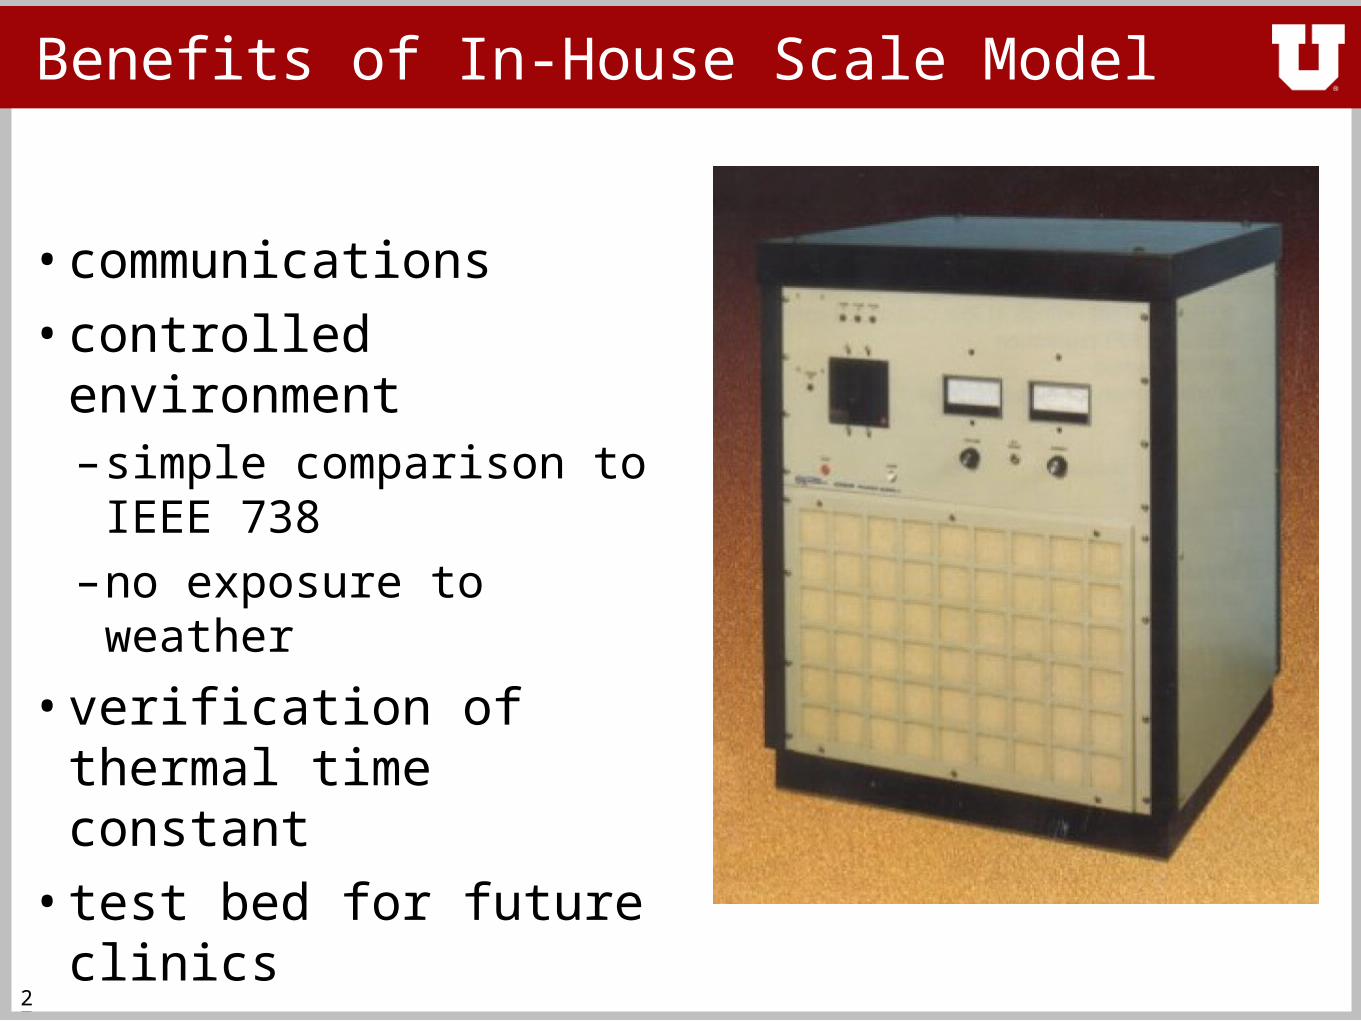
Benefits of In-House Scale Model
• communications
• controlled environment–simple comparison to IEEE
738–no exposure to weather
• verification of thermal time constant
• test bed for future clinics
28
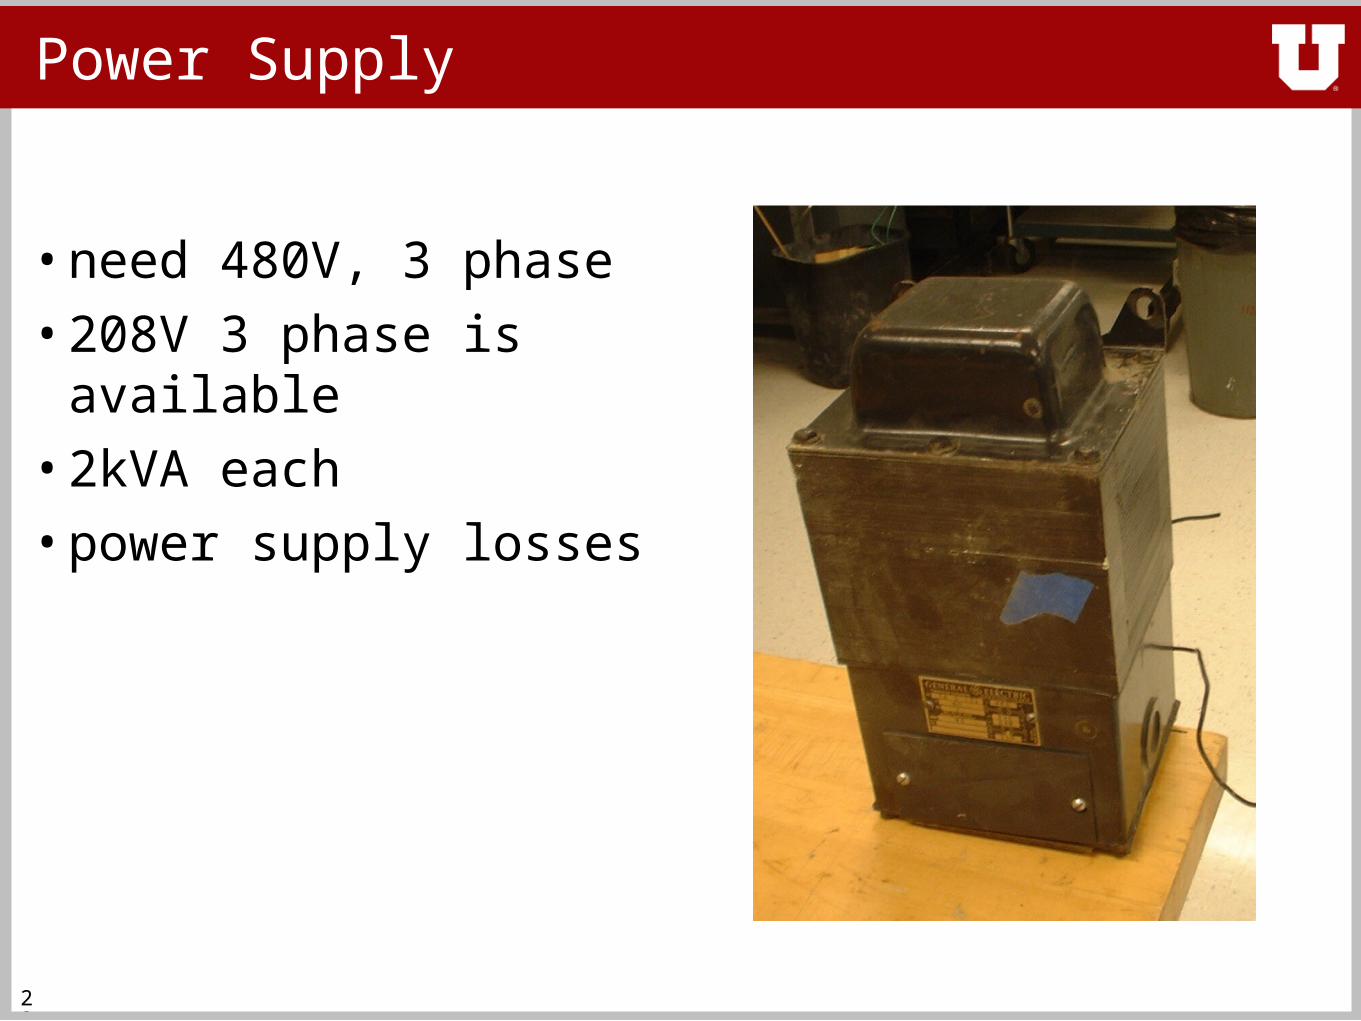
Power Supply
• need 480V, 3 phase
• 208V 3 phase is available
• 2kVA each
• power supply losses
29
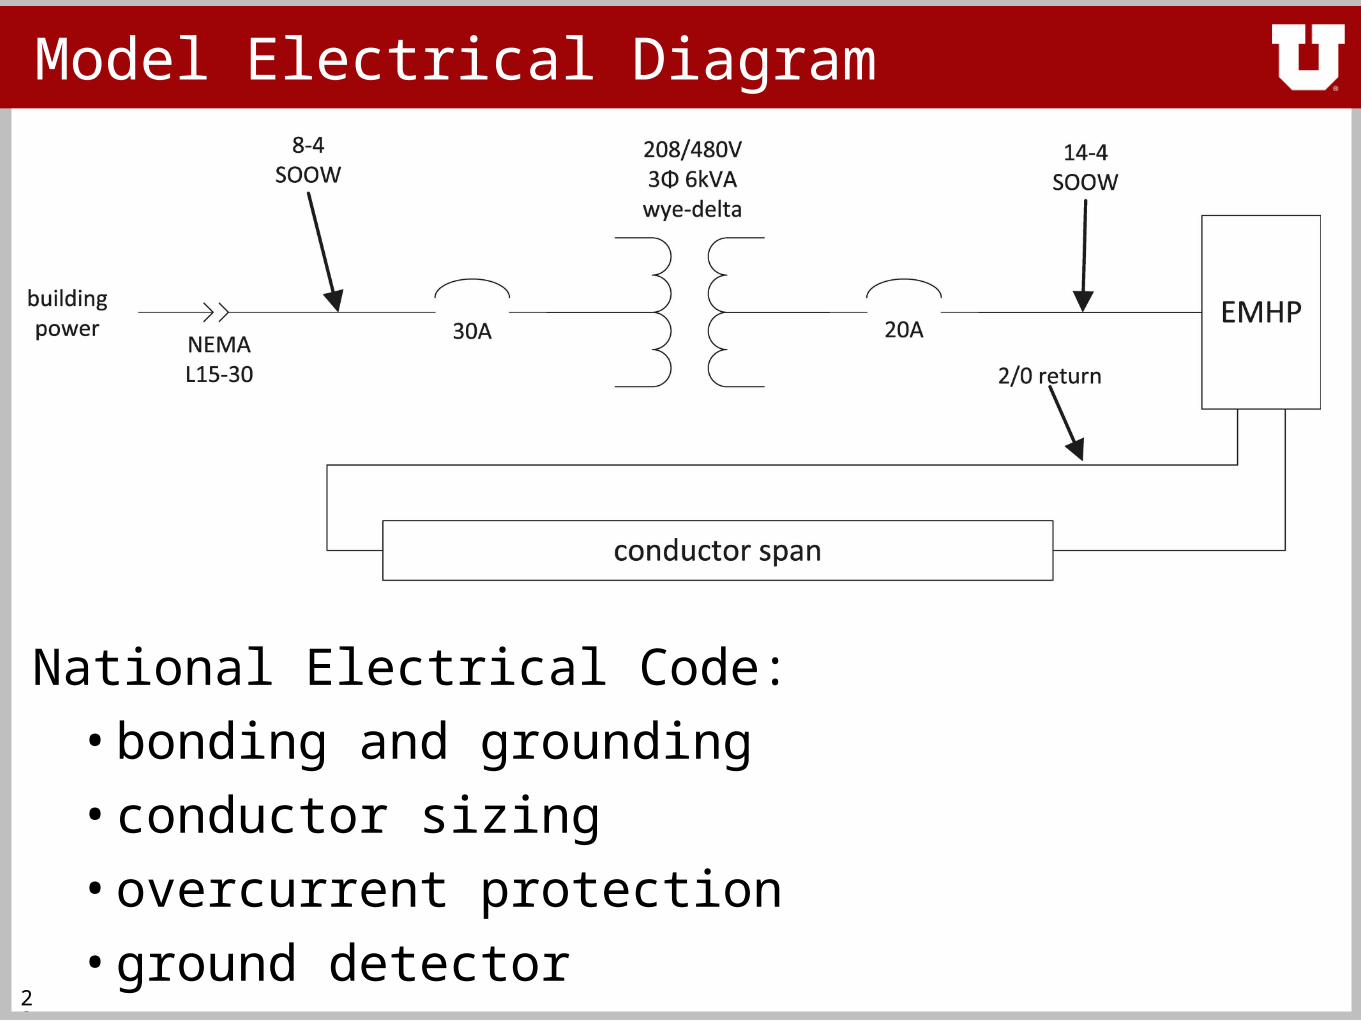
Model Electrical Diagram
National Electrical Code:
• bonding and grounding
• conductor sizing
• overcurrent protection
• ground detector
30
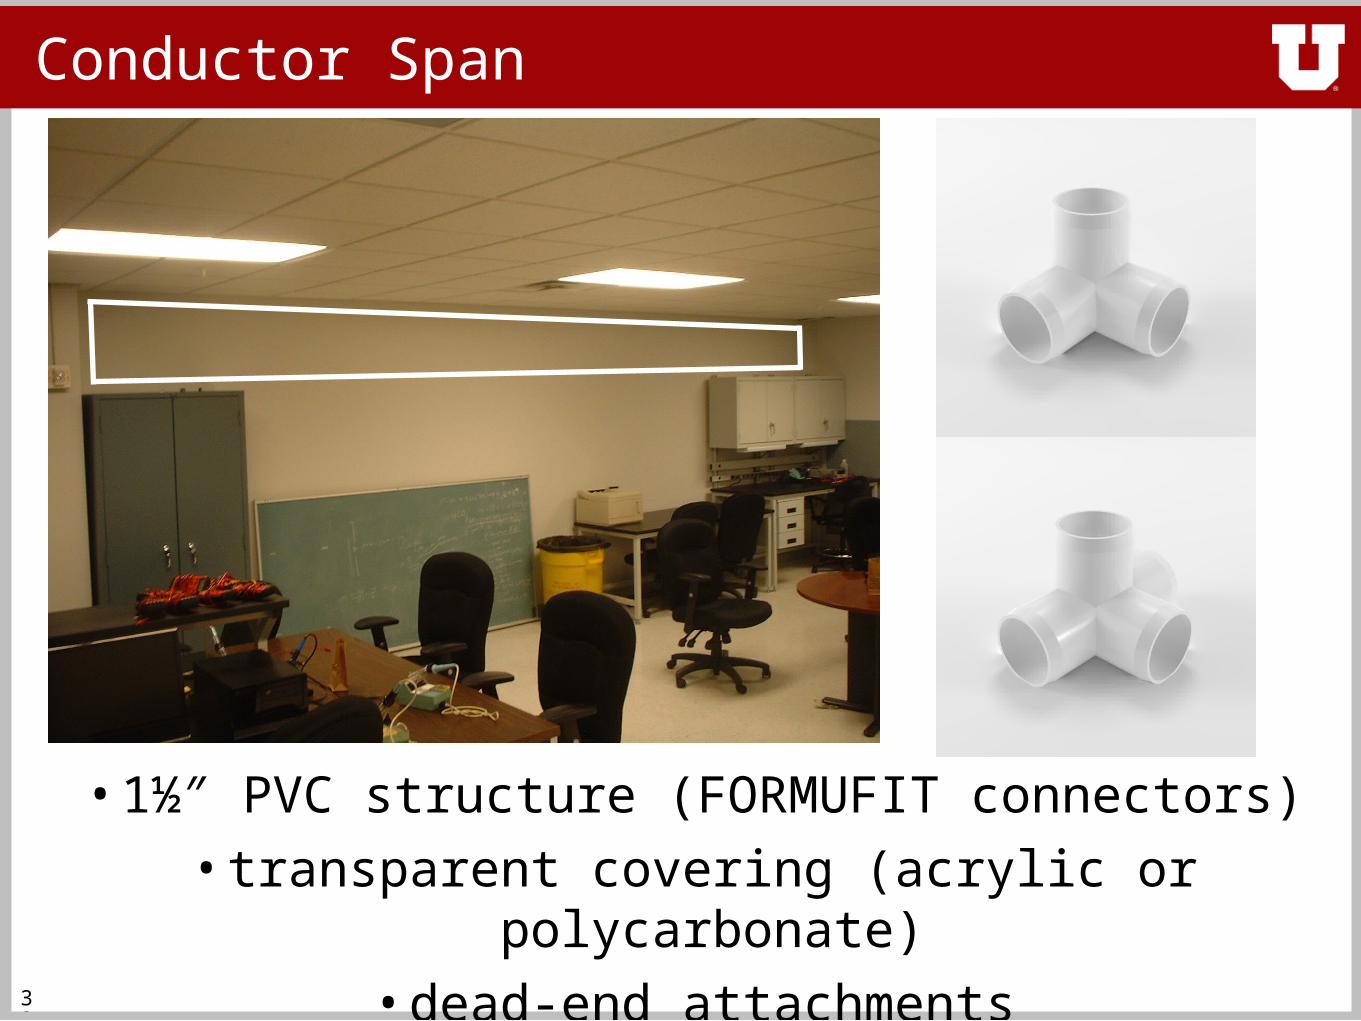
Conductor Span
• 1½″ PVC structure (FORMUFIT connectors)
• transparent covering (acrylic or polycarbonate)
• dead-end attachments
31
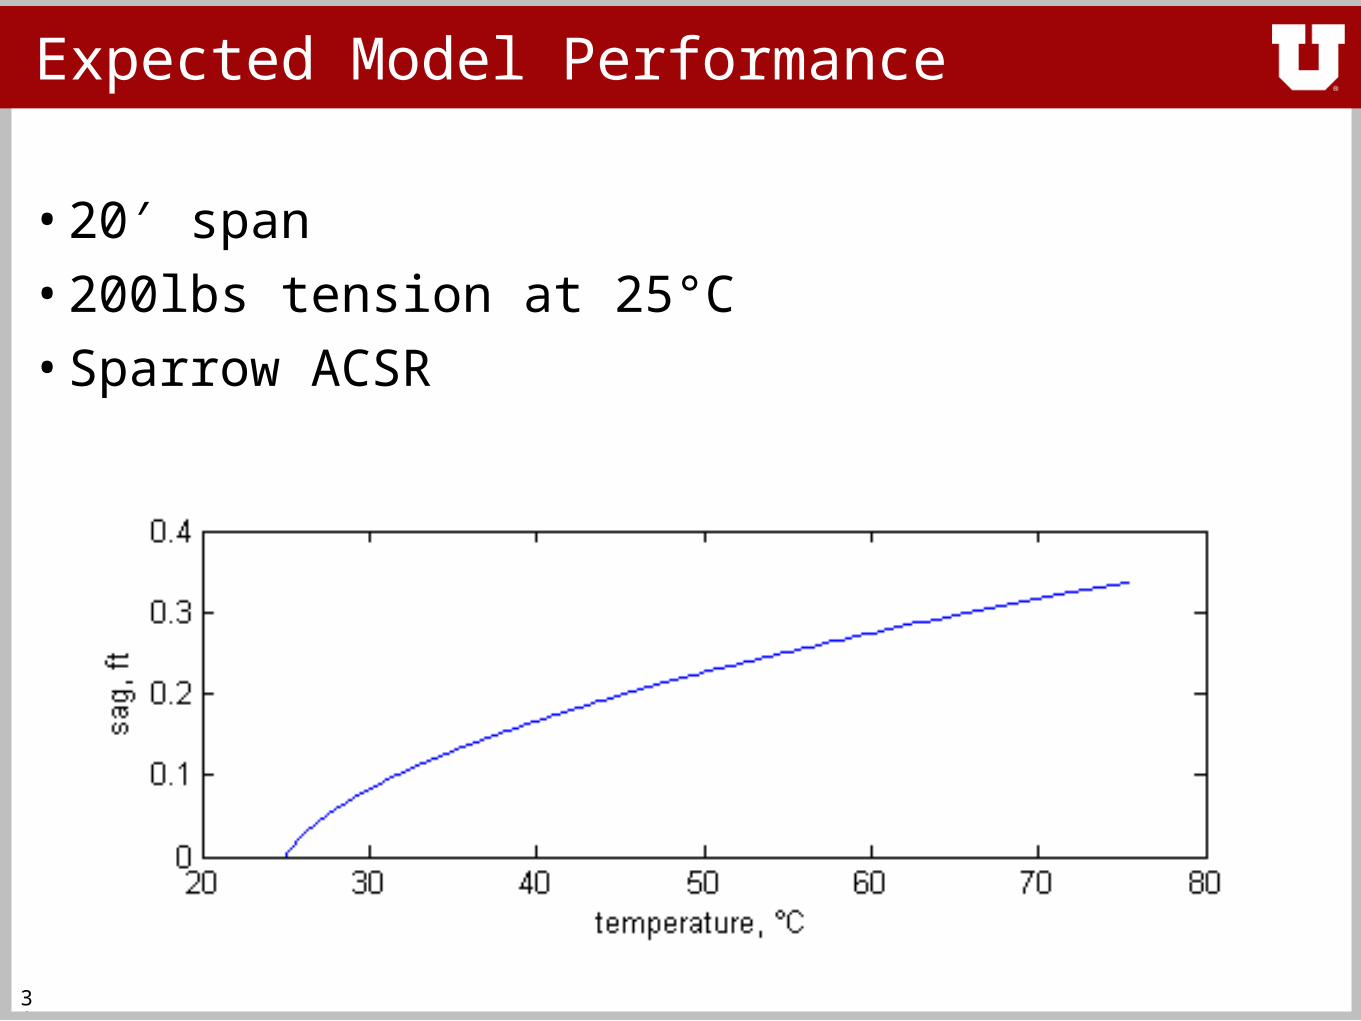
Expected Model Performance
• 20′ span
• 200lbs tension at 25°C
• Sparrow ACSR
Physical Model: Conclusion
• benefits of in-house scale model
• power supply
• electrical diagram
• conductor span
• expected model performance
32
33
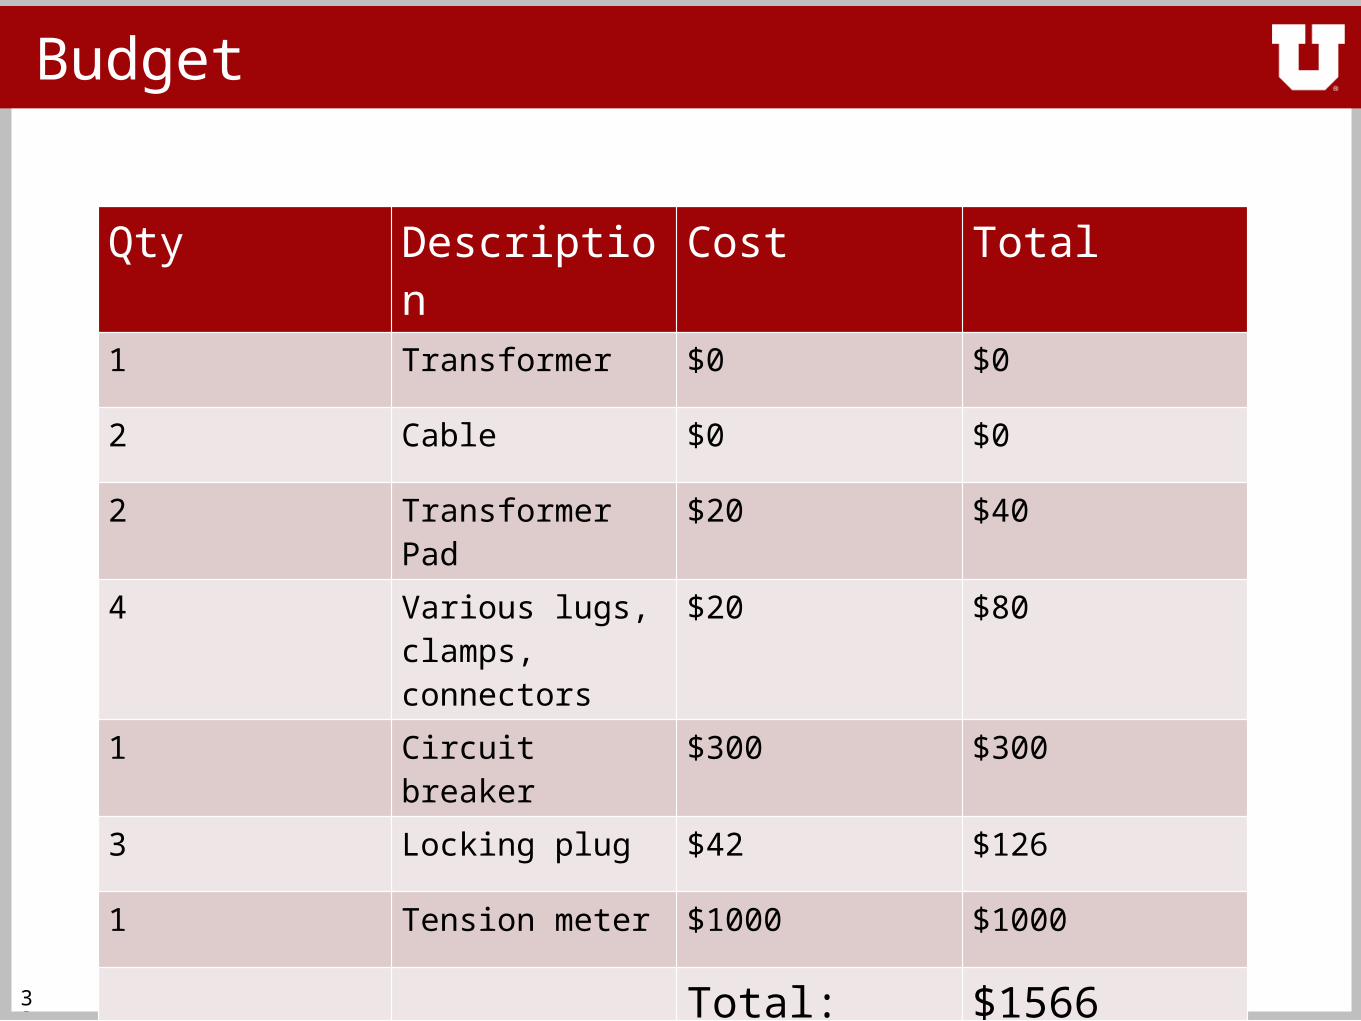
Budget
Qty Description Cost Total
1 Transformer $0 $0
2 Cable $0 $0
2 Transformer Pad $20 $40
4 Various lugs, clamps, connectors
$20 $80
1 Circuit breaker $300 $300
3 Locking plug $42 $126
1 Tension meter $1000 $1000
Total: $1566
34
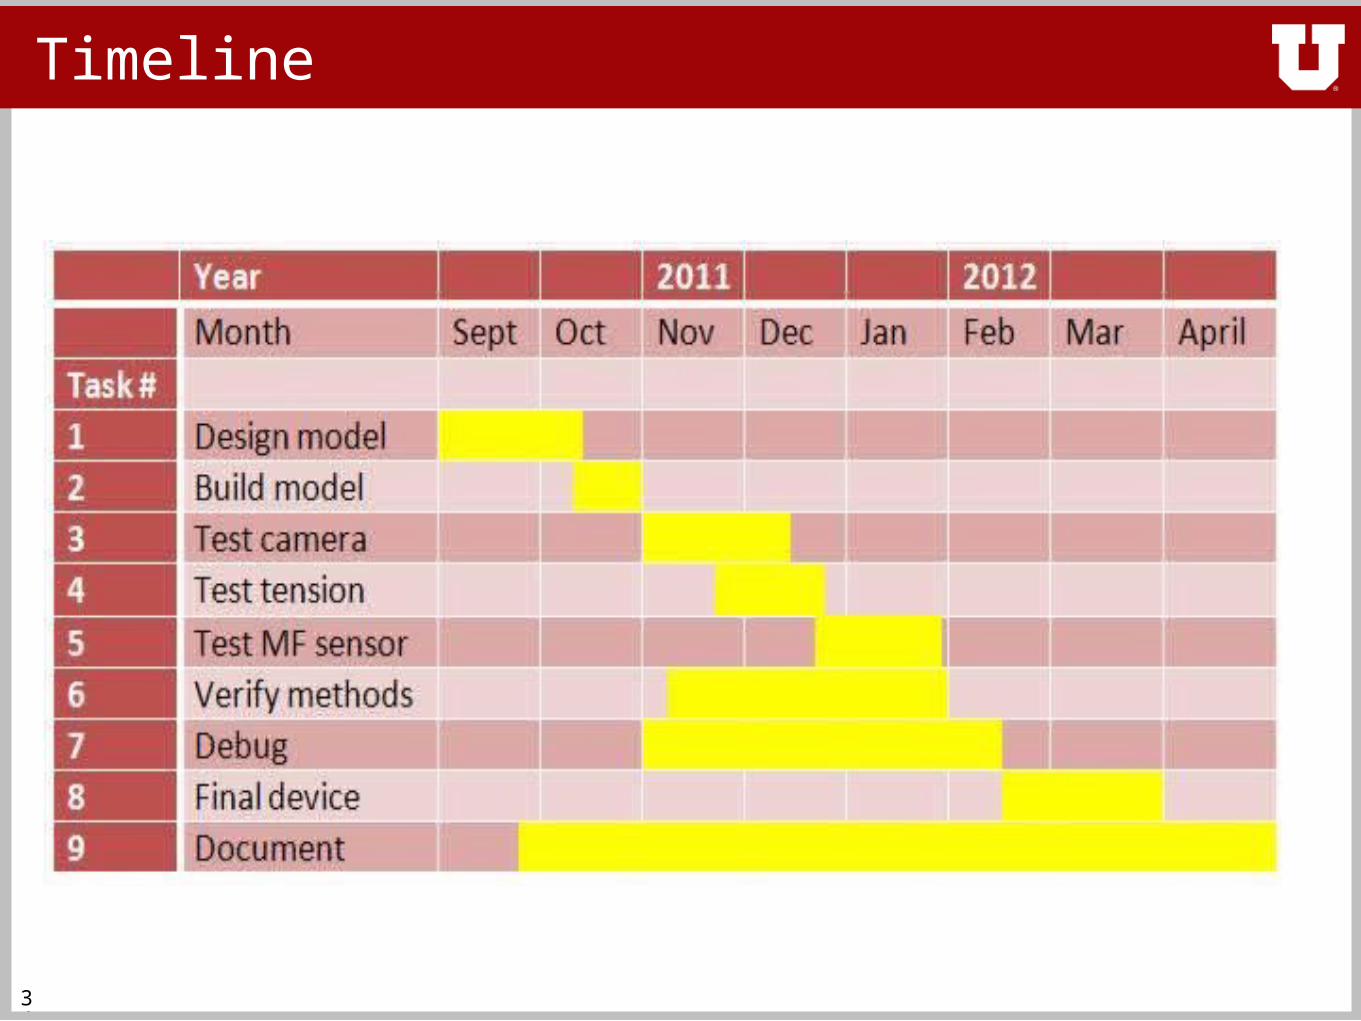
Timeline
35
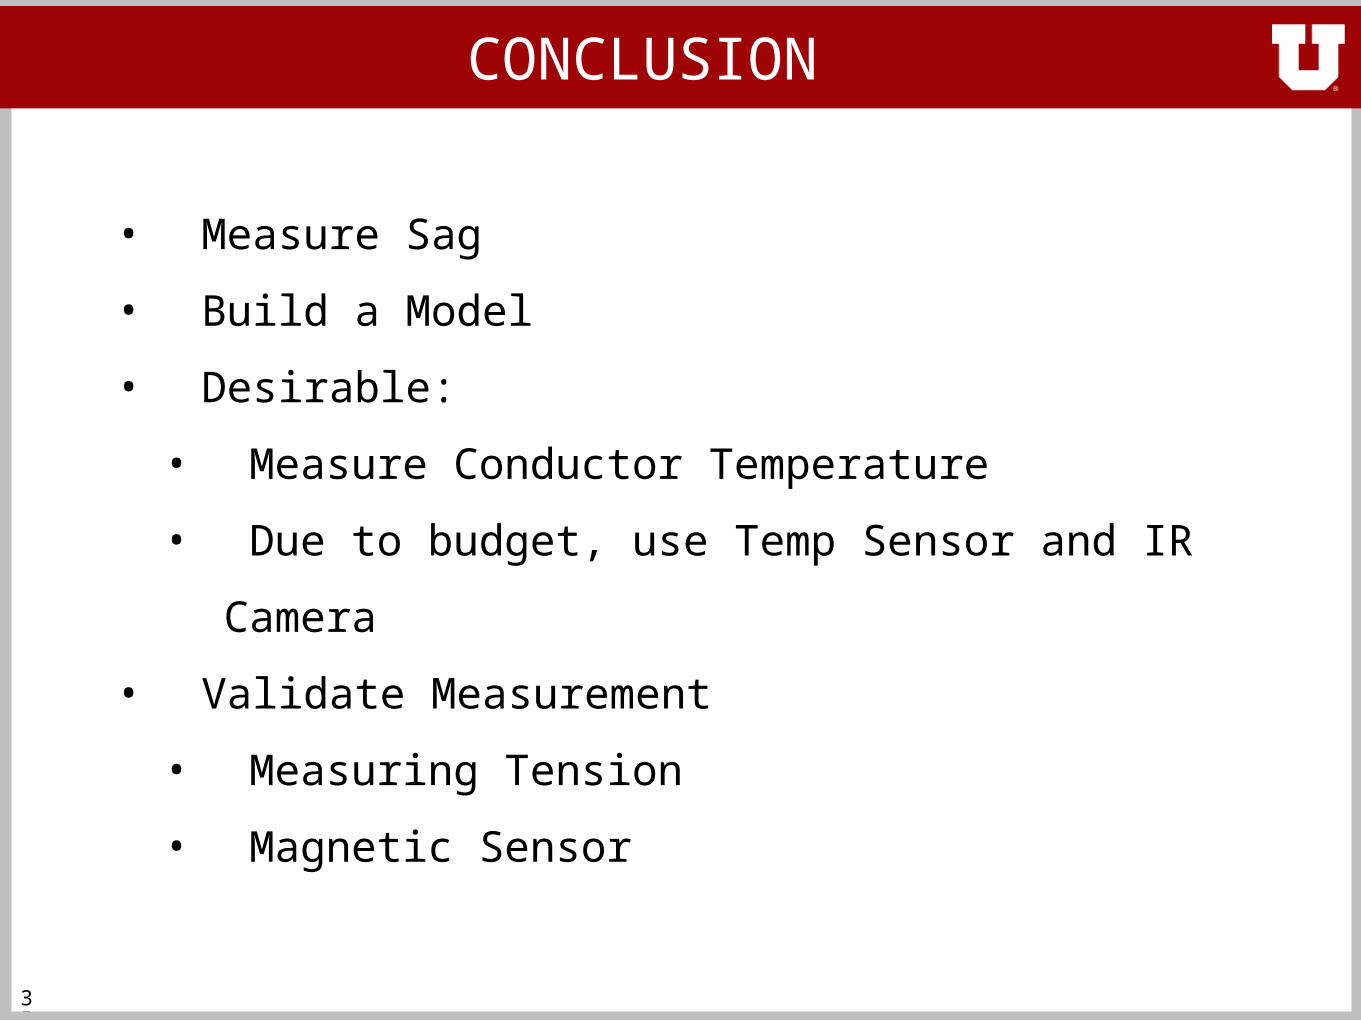
CONCLUSION
• Measure Sag
• Build a Model
• Desirable:
• Measure Conductor Temperature
• Due to budget, use Temp Sensor and IR
Camera
• Validate Measurement
• Measuring Tension
• Magnetic Sensor
36
Contact Info / References
References[1] “Clearance Levels”, Oct. 3, 2011. [Online]. Available: http://www.pge.com/mybusiness/customerservice/otherrequests/treetrimming/faq/orchard/index.shtml.
[2] “Line Sag Illustration”, Oct. 3, 2011. [Online]. Available: http://redefinescience.blogspot.com/2011/05/power-lines.html.
[3] “Tension Illustration”, Oct. 3, 2011. [Online]. Available: http://www.ehow.com/how_8049821_calculate-transmission-line-tension.html.
[4] “Configuration”, Oct. 3, 2011. [Online]. Available: http://www.eng-tips.com/viewthread.cfm?qid=139418&page=274.
[5] ”Power Line View”, Oct. 3, 2011. [Online]. Available: http://forcechange.com/2190/proposed-legislation-would-speed-up-permitting-process-for-transmission-lines.
[6] “Thermal Image”, Oct. 3, 2011. [Online]. Available: http://www.x20.org/thermal/.
[7] “FLIR T620”, Oct. 3, 2011. [Online]. Available: http://www.flir.com/thermography/americas/us/content/?id=18118.
[8] “FLIR SC325”, Oct. 3, 2011. [Online]. Available: http://www.flir.com/thermography/americas/us/content/?id=31095.
[9] “FLIR E60”, Oct. 3, 2011. [Online]. Available: http://www.flir.com/thermography/americas/us/content/?id=36820.
[10] “Sag and Tension”, Sep. 20, 2011. [Online]. Available: http://www.iaei.org/magazine/2004/05/the-effects-of-ruling-span-on-sag-and-tension/
[11] “Smart Digital Magnetometer HMR2300”, Sep. 30, 2011. [Online]. Available: http://www51.honeywell.com/aero/common/documents/myaerospacecatalog-documents/Missiles-Munitions/HMR2300.pdf.
[12] “IR Thermo Gun”, Sep. 29, 2011. [Online]. Available: http://chaermai.en.ecplaza.net/2.asp.
[13] “IR Security Camera”, Sep. 29, 2011. [Online]. Available: http://www.buy.com/retail/product.asp?sku=224174617&listingid=157870950&&
Rocky Mountain Power Clinic TeamUniversity of UtahElectrical and Computer Engineering [email protected]