Embed Size (px)
Citation preview
CBRE RESEARCH
REAL ESTATE MARKET OUTLOOK
Rochester,New York
OUTLOOK 2018 CBRE Research © 2018, CBRE|Rochester | 2
MARKET OUTLOOK 2018 ROCHESTER
RochesterPart of the CBRE affiliate network
ROCHESTER OVERVIEW
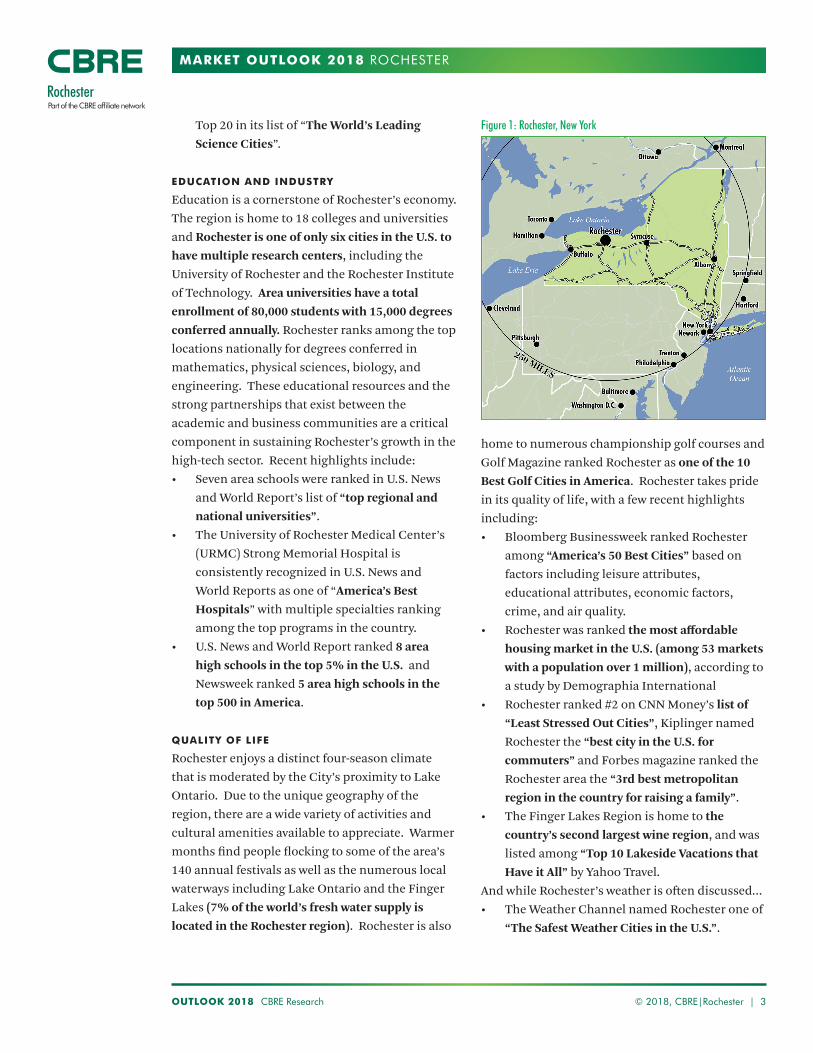
Located on the southern shore of Lake Ontario in the western region of Upstate New York, the Greater Rochester Area is the State’s third largest metropolitan area, home to a population of 1.1 million. Situated on the I-90 (New York State Thruway) corridor, the community is centrally located in the Northeastern United States, within 500 miles of one-third of the U.S. and Canadian populations. Rochester enjoys close proximity to the global business centers of Toronto, New York City and Boston, while offering a lower cost of doing business and quality of life advantages not found in its larger neighbors.
ECONOMIC PROFILE
The presence of Eastman Kodak, Bausch & Lomb and Xerox has traditionally led to Rochester being viewed as a big company town. Today these companies employ just 3% of the area’s total workforce, as Rochester has become home to a much more diversified and balanced economy. Some of the industry clusters for which Rochester is best known include healthcare, photonics, optics, digital & health imaging, precision manufacturing, telecommunications, information technology, higher education, and the biosciences. The established strength of the area’s high-tech industries and the continued investments that are being made in these industry sectors suggest a bright outlook for Rochester’s future economy. A few of the most recent accolades for the Rochester business environment include:• The New Republic named Rochester “One of
the most innovation-intensive metro areas in the country” and Atlantic magazine lists Rochester as one of its “35 innovations hubs in the country” based on the number of start-up companies, patents, and entrepreneurs.
• The Brookings Institute ranked Rochester 13th in the U.S. for patents issued per million residents.
• Scientific Reports ranked Rochester among the
ABOUT US
CBRE|Rochester is an affiliate office of CBRE Group, Inc. and offers a full suite of commercial real estate services to clients in the Greater Rochester Area. Please visit our website at www.cbre.com/rochester to learn more.
CBRE Group, Inc. is the world’s largest commercial real estate services and investment firm, with 2016 revenues of $13.1 billion and more than 75,000 employees. CBRE has been included in the Fortune 500 since 2008, ranking #214 in 2017. It also has been voted the industry’s top brand by the Lipsey Company for 16 consecutive years, and has been named one of Fortune’s “Most Admired Companies” in the real estate sector for five years in a row. Its shares trade on the New York Stock Exchange under the symbol “CBG.”
CBRE offers a broad range of integrated services including property sales and leasing; strategic consulting; corporate services; transaction and project management; property management; investment management; appraisal and valuation; mortgage services; and development services. To learn more, please visit our website at www.cbre.com.
CONTACTS
Angelo NoleManaging Director+1 585 784 [email protected]
Jonathan Murray, CMADirector of Marketing & Research+1 585 784 [email protected]
OFFICE
CBRE|Rochester120 Corporate Woods, Suite 210Rochester, NY 14623 +1 585 240 8080www.cbre.com/rochester
OUTLOOK 2018 CBRE Research © 2018, CBRE|Rochester | 3
MARKET OUTLOOK 2018 ROCHESTER
RochesterPart of the CBRE affiliate network
home to numerous championship golf courses and Golf Magazine ranked Rochester as one of the 10 Best Golf Cities in America. Rochester takes pride in its quality of life, with a few recent highlights including:• Bloomberg Businessweek ranked Rochester
among “America’s 50 Best Cities” based on factors including leisure attributes, educational attributes, economic factors, crime, and air quality.
• Rochester was ranked the most affordable housing market in the U.S. (among 53 markets with a population over 1 million), according to a study by Demographia International
• Rochester ranked #2 on CNN Money’s list of “Least Stressed Out Cities”, Kiplinger named Rochester the “best city in the U.S. for commuters” and Forbes magazine ranked the Rochester area the “3rd best metropolitan region in the country for raising a family”.
• The Finger Lakes Region is home to the country’s second largest wine region, and was listed among “Top 10 Lakeside Vacations that Have it All” by Yahoo Travel.
And while Rochester’s weather is often discussed...• The Weather Channel named Rochester one of
“The Safest Weather Cities in the U.S.”.
Top 20 in its list of “The World’s Leading Science Cities”.
EDUCATION AND INDUSTRY
Education is a cornerstone of Rochester’s economy. The region is home to 18 colleges and universities and Rochester is one of only six cities in the U.S. to have multiple research centers, including the University of Rochester and the Rochester Institute of Technology. Area universities have a total enrollment of 80,000 students with 15,000 degrees conferred annually. Rochester ranks among the top locations nationally for degrees conferred in mathematics, physical sciences, biology, and engineering. These educational resources and the strong partnerships that exist between the academic and business communities are a critical component in sustaining Rochester’s growth in the high-tech sector. Recent highlights include:• Seven area schools were ranked in U.S. News
and World Report’s list of “top regional and national universities”.
• The University of Rochester Medical Center’s (URMC) Strong Memorial Hospital is consistently recognized in U.S. News and World Reports as one of “America’s Best Hospitals” with multiple specialties ranking among the top programs in the country.
• U.S. News and World Report ranked 8 area high schools in the top 5% in the U.S. and Newsweek ranked 5 area high schools in the top 500 in America.
QUALITY OF LIFE
Rochester enjoys a distinct four-season climate that is moderated by the City’s proximity to Lake Ontario. Due to the unique geography of the region, there are a wide variety of activities and cultural amenities available to appreciate. Warmer months find people flocking to some of the area’s 140 annual festivals as well as the numerous local waterways including Lake Ontario and the Finger Lakes (7% of the world’s fresh water supply is located in the Rochester region). Rochester is also
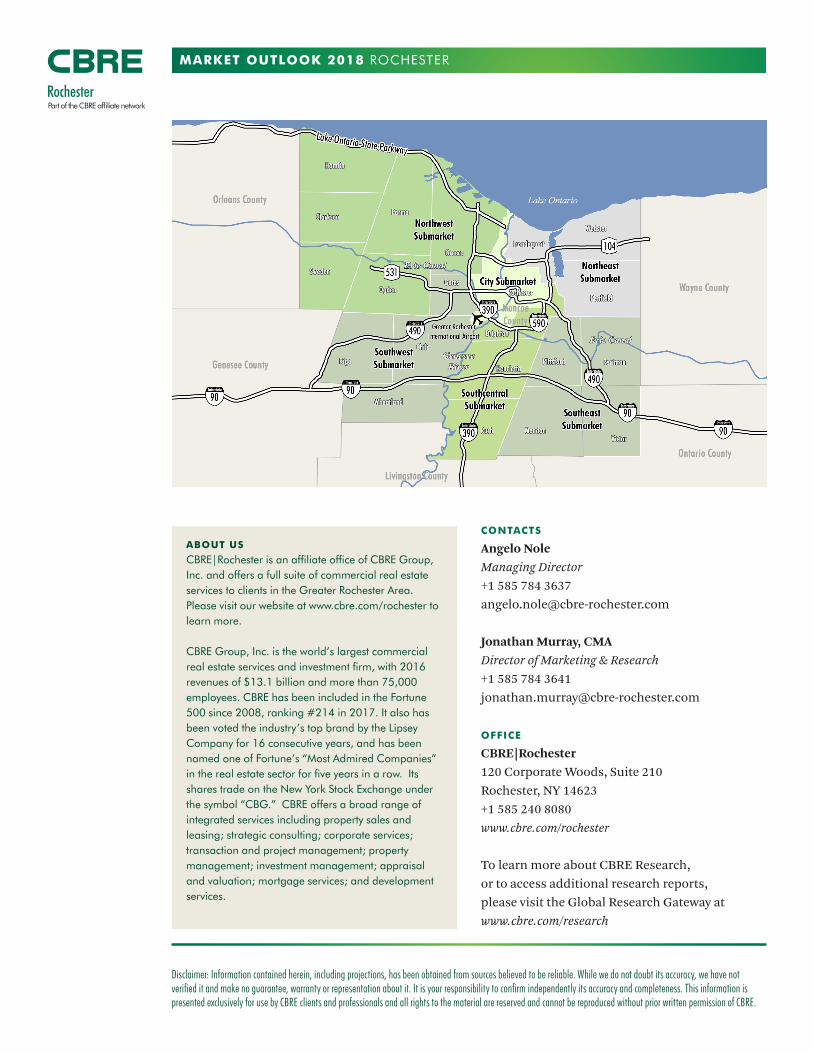
Figure 1: Rochester, New York
OUTLOOK 2018 CBRE Research © 2018, CBRE|Rochester | 4
MARKET OUTLOOK
RochesterPart of the CBRE affiliate network
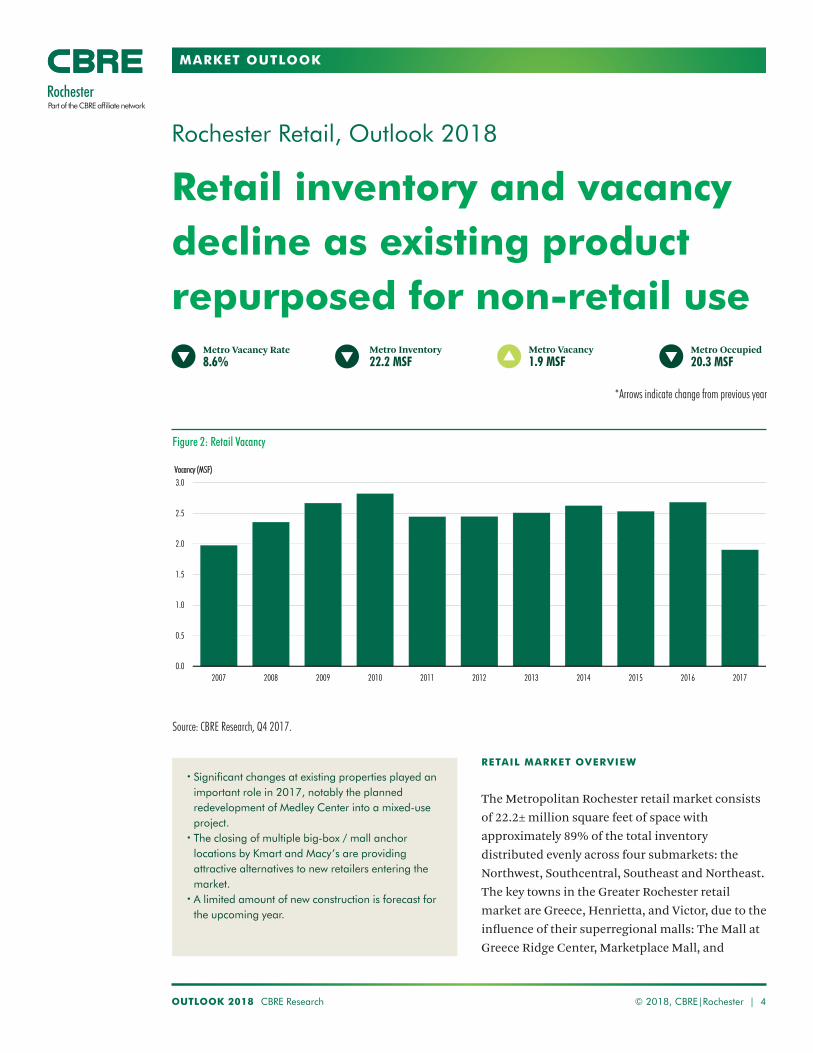
Rochester Retail, Outlook 2018
Retail inventory and vacancy decline as existing product repurposed for non-retail use
Metro Vacancy1.9 MSF
Metro Vacancy Rate 8.6%
RETAIL MARKET OVERVIEW
The Metropolitan Rochester retail market consists of 22.2± million square feet of space with approximately 89% of the total inventory distributed evenly across four submarkets: the Northwest, Southcentral, Southeast and Northeast. The key towns in the Greater Rochester retail market are Greece, Henrietta, and Victor, due to the influence of their superregional malls: The Mall at Greece Ridge Center, Marketplace Mall, and
• Significant changes at existing properties played an important role in 2017, notably the planned redevelopment of Medley Center into a mixed-use project.
• The closing of multiple big-box / mall anchor locations by Kmart and Macy’s are providing attractive alternatives to new retailers entering the market.
• A limited amount of new construction is forecast for the upcoming year.
Source: CBRE Research, Q4 2017.
Metro Occupied20.3 MSF
Figure 2: Retail Vacancy
*Arrows indicate change from previous year
Metro Inventory22.2 MSF
0.0
0.5
1.0
1.5
2.0
2.5
3.0
2007 2008 2009 2010 2011 2012 2013 2014 2015 2016 2017
Vacancy (MSF)
OUTLOOK 2018 CBRE Research © 2018, CBRE|Rochester | 5
MARKET OUTLOOK ROCHESTER RETAIL
RochesterPart of the CBRE affiliate network
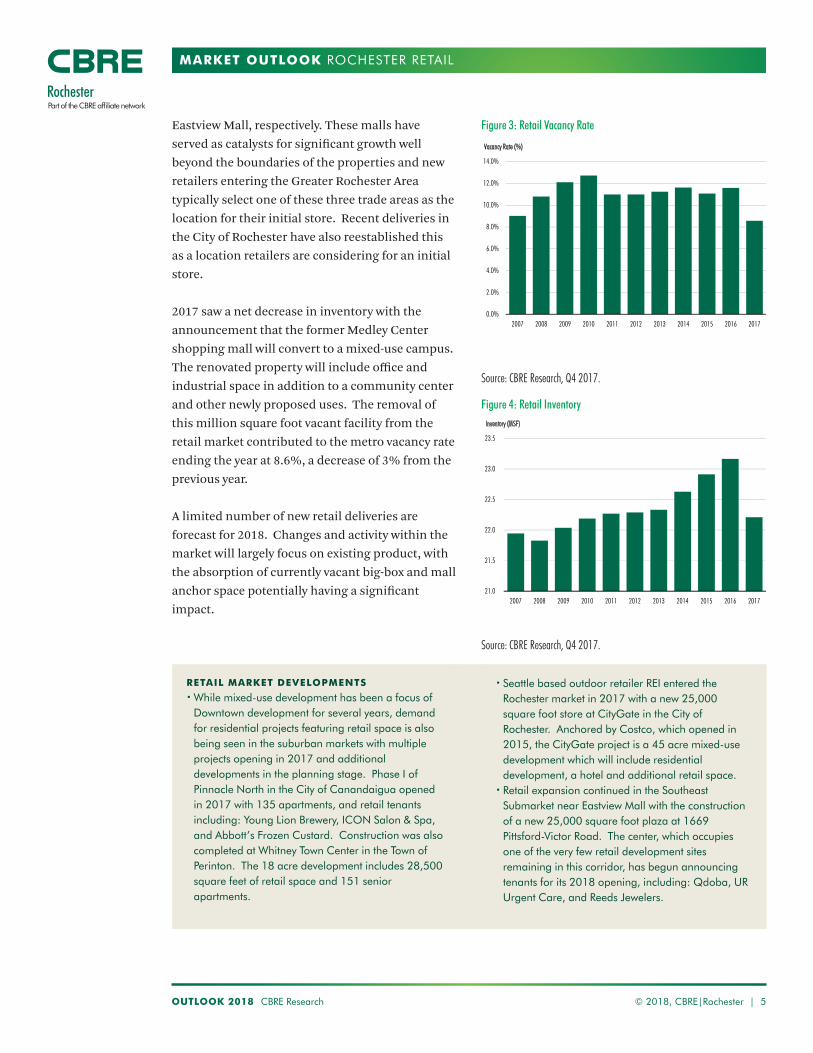
Eastview Mall, respectively. These malls have served as catalysts for significant growth well beyond the boundaries of the properties and new retailers entering the Greater Rochester Area typically select one of these three trade areas as the location for their initial store. Recent deliveries in the City of Rochester have also reestablished this as a location retailers are considering for an initial store.
2017 saw a net decrease in inventory with the announcement that the former Medley Center shopping mall will convert to a mixed-use campus. The renovated property will include office and industrial space in addition to a community center and other newly proposed uses. The removal of this million square foot vacant facility from the retail market contributed to the metro vacancy rate ending the year at 8.6%, a decrease of 3% from the previous year.
A limited number of new retail deliveries are forecast for 2018. Changes and activity within the market will largely focus on existing product, with the absorption of currently vacant big-box and mall anchor space potentially having a significant impact.
Figure 3: Retail Vacancy Rate
Source: CBRE Research, Q4 2017.
Source: CBRE Research, Q4 2017.
0.0%
2.0%
4.0%
6.0%
8.0%
10.0%
12.0%
14.0%
2007 2008 2009 2010 2011 2012 2013 2014 2015 2016 2017
Vacancy Rate (%)
21.0
21.5
22.0
22.5
23.0
23.5
2007 2008 2009 2010 2011 2012 2013 2014 2015 2016 2017
Inventory (MSF)
Figure 4: Retail Inventory
RETAIL MARKET DEVELOPMENTS• While mixed-use development has been a focus of
Downtown development for several years, demand for residential projects featuring retail space is also being seen in the suburban markets with multiple projects opening in 2017 and additional developments in the planning stage. Phase I of Pinnacle North in the City of Canandaigua opened in 2017 with 135 apartments, and retail tenants including: Young Lion Brewery, ICON Salon & Spa, and Abbott’s Frozen Custard. Construction was also completed at Whitney Town Center in the Town of Perinton. The 18 acre development includes 28,500 square feet of retail space and 151 senior apartments.
• Seattle based outdoor retailer REI entered the Rochester market in 2017 with a new 25,000 square foot store at CityGate in the City of Rochester. Anchored by Costco, which opened in 2015, the CityGate project is a 45 acre mixed-use development which will include residential development, a hotel and additional retail space.
• Retail expansion continued in the Southeast Submarket near Eastview Mall with the construction of a new 25,000 square foot plaza at 1669 Pittsford-Victor Road. The center, which occupies one of the very few retail development sites remaining in this corridor, has begun announcing tenants for its 2018 opening, including: Qdoba, UR Urgent Care, and Reeds Jewelers.
OUTLOOK 2018 CBRE Research © 2018, CBRE|Rochester | 6
MARKET OUTLOOK
RochesterPart of the CBRE affiliate network
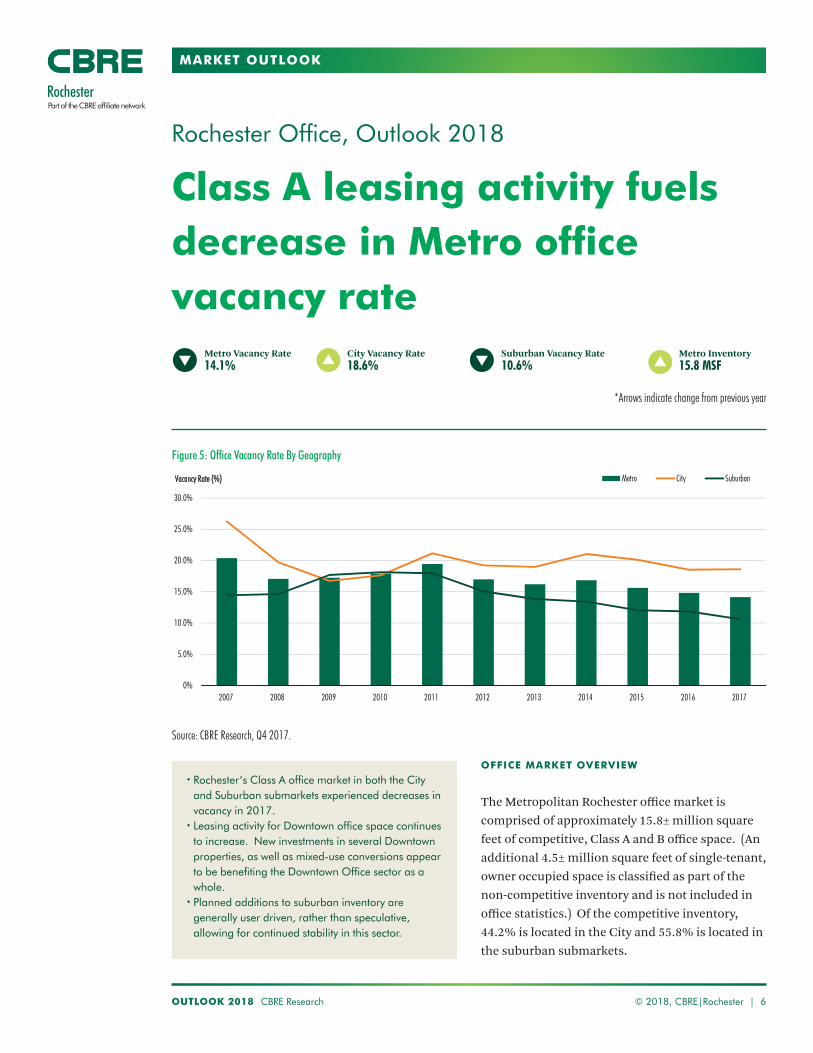
OFFICE MARKET OVERVIEW
The Metropolitan Rochester office market is comprised of approximately 15.8± million square feet of competitive, Class A and B office space. (An additional 4.5± million square feet of single-tenant, owner occupied space is classified as part of the non-competitive inventory and is not included in office statistics.) Of the competitive inventory, 44.2% is located in the City and 55.8% is located in the suburban submarkets.
• Rochester’s Class A office market in both the City and Suburban submarkets experienced decreases in vacancy in 2017.
• Leasing activity for Downtown office space continues to increase. New investments in several Downtown properties, as well as mixed-use conversions appear to be benefiting the Downtown Office sector as a whole.
• Planned additions to suburban inventory are generally user driven, rather than speculative, allowing for continued stability in this sector.
Rochester Office, Outlook 2018
Class A leasing activity fuels decrease in Metro office vacancy rate
Metro Inventory15.8 MSF
Source: CBRE Research, Q4 2017.
Figure 5: Office Vacancy Rate By Geography
*Arrows indicate change from previous year
Suburban Vacancy Rate 10.6%
Metro Vacancy Rate 14.1%
City Vacancy Rate 18.6%
0%
5.0%
10.0%
15.0%
20.0%
25.0%
30.0%
2007 2008 2009 2010 2011 2012 2013 2014 2015 2016 2017
Vacancy Rate (%) Metro City Suburban
OUTLOOK 2018 CBRE Research © 2018, CBRE|Rochester | 7
MARKET OUTLOOK ROCHESTER OFFICE
RochesterPart of the CBRE affiliate network
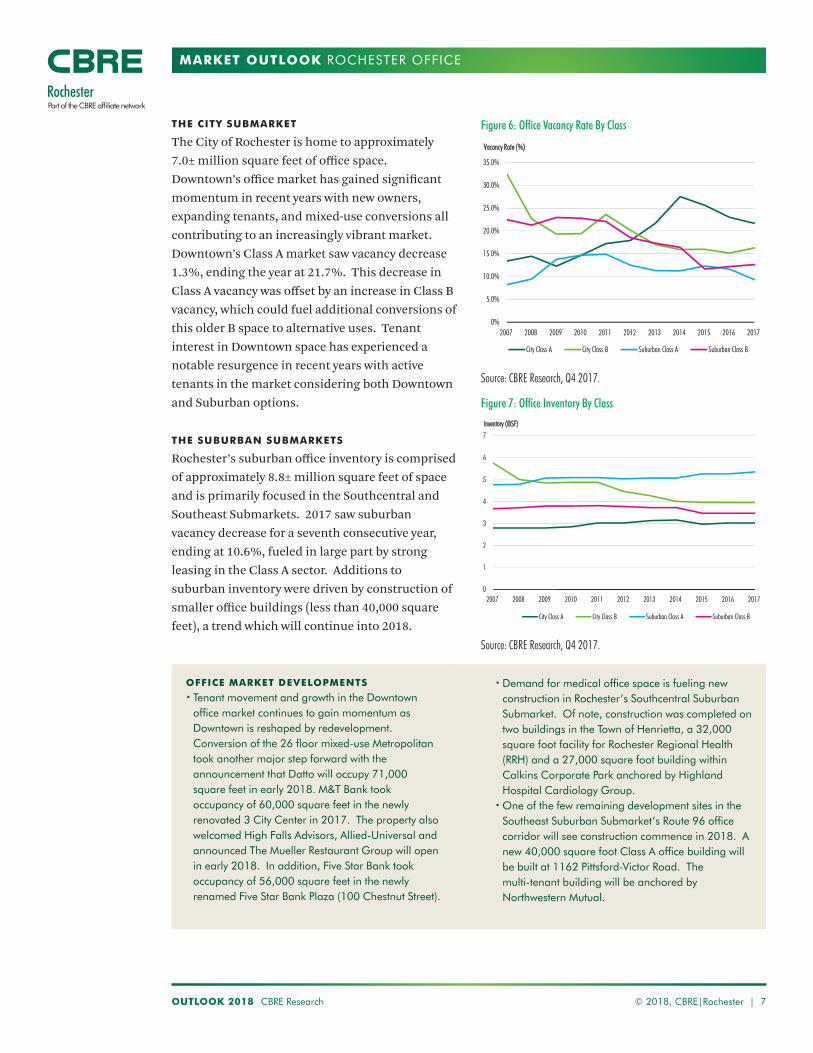
THE CITY SUBMARKET
The City of Rochester is home to approximately 7.0± million square feet of office space. Downtown’s office market has gained significant momentum in recent years with new owners, expanding tenants, and mixed-use conversions all contributing to an increasingly vibrant market. Downtown’s Class A market saw vacancy decrease 1.3%, ending the year at 21.7%. This decrease in Class A vacancy was offset by an increase in Class B vacancy, which could fuel additional conversions of this older B space to alternative uses. Tenant interest in Downtown space has experienced a notable resurgence in recent years with active tenants in the market considering both Downtown and Suburban options. THE SUBURBAN SUBMARKETS
Rochester’s suburban office inventory is comprised of approximately 8.8± million square feet of space and is primarily focused in the Southcentral and Southeast Submarkets. 2017 saw suburban vacancy decrease for a seventh consecutive year, ending at 10.6%, fueled in large part by strong leasing in the Class A sector. Additions to suburban inventory were driven by construction of smaller office buildings (less than 40,000 square feet), a trend which will continue into 2018.
OFFICE MARKET DEVELOPMENTS• Tenant movement and growth in the Downtown
office market continues to gain momentum as Downtown is reshaped by redevelopment. Conversion of the 26 floor mixed-use Metropolitan took another major step forward with the announcement that Datto will occupy 71,000 square feet in early 2018. M&T Bank took occupancy of 60,000 square feet in the newly renovated 3 City Center in 2017. The property also welcomed High Falls Advisors, Allied-Universal and announced The Mueller Restaurant Group will open in early 2018. In addition, Five Star Bank took occupancy of 56,000 square feet in the newly renamed Five Star Bank Plaza (100 Chestnut Street).
• Demand for medical office space is fueling new construction in Rochester’s Southcentral Suburban Submarket. Of note, construction was completed on two buildings in the Town of Henrietta, a 32,000 square foot facility for Rochester Regional Health (RRH) and a 27,000 square foot building within Calkins Corporate Park anchored by Highland Hospital Cardiology Group.
• One of the few remaining development sites in the Southeast Suburban Submarket’s Route 96 office corridor will see construction commence in 2018. A new 40,000 square foot Class A office building will be built at 1162 Pittsford-Victor Road. The multi-tenant building will be anchored by Northwestern Mutual.
Figure 6: Office Vacancy Rate By Class
Figure 7: Office Inventory By Class
Source: CBRE Research, Q4 2017.
Source: CBRE Research, Q4 2017.
0%
5.0%
10.0%
15.0%
20.0%
25.0%
30.0%
35.0%
2007 2008 2009 2010 2011 2012 2013 2014 2015 2016 2017
Vacancy Rate (%)
City Class A City Class B Suburban Class A Suburban Class B
0
1
2
3
4
5
6
7
2007 2008 2009 2010 2011 2012 2013 2014 2015 2016 2017
Inventory (MSF)
City Class A City Class B Suburban Class A Suburban Class B
OUTLOOK 2018 CBRE Research © 2018, CBRE|Rochester | 8
MARKET OUTLOOK
RochesterPart of the CBRE affiliate network
FLEX MARKET OVERVIEW
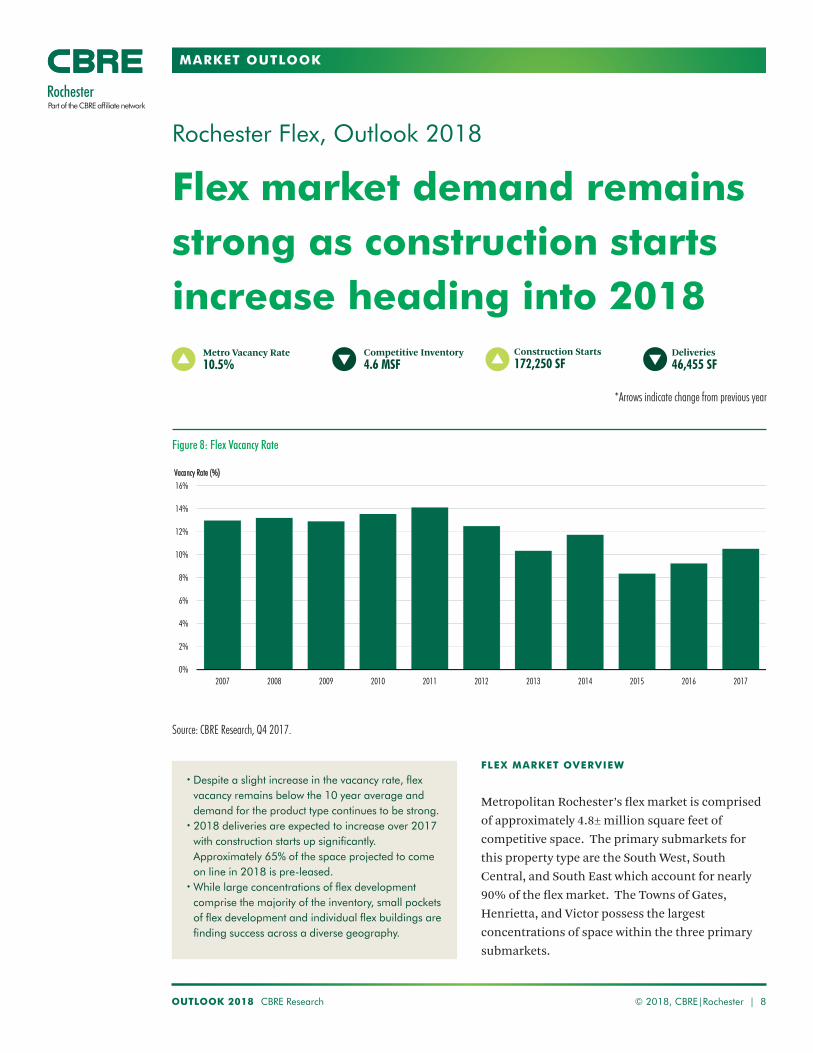
Metropolitan Rochester’s flex market is comprised of approximately 4.8± million square feet of competitive space. The primary submarkets for this property type are the South West, South Central, and South East which account for nearly 90% of the flex market. The Towns of Gates, Henrietta, and Victor possess the largest concentrations of space within the three primary submarkets.
• Despite a slight increase in the vacancy rate, flex vacancy remains below the 10 year average and demand for the product type continues to be strong.
• 2018 deliveries are expected to increase over 2017 with construction starts up significantly. Approximately 65% of the space projected to come on line in 2018 is pre-leased.
• While large concentrations of flex development comprise the majority of the inventory, small pockets of flex development and individual flex buildings are finding success across a diverse geography.
Rochester Flex, Outlook 2018
Flex market demand remains strong as construction starts increase heading into 2018
Source: CBRE Research, Q4 2017.
Deliveries46,455 SF
Construction Starts172,250 SF
Metro Vacancy Rate 10.5%
Figure 8: Flex Vacancy Rate
*Arrows indicate change from previous year
Competitive Inventory4.6 MSF
0%
2%
4%
6%
8%
10%
12%
14%
16%
2007 2008 2009 2010 2011 2012 2013 2014 2015 2016 2017
Vacancy Rate (%)
OUTLOOK 2018 CBRE Research © 2018, CBRE|Rochester | 9
MARKET OUTLOOK ROCHESTER FLEX
RochesterPart of the CBRE affiliate network
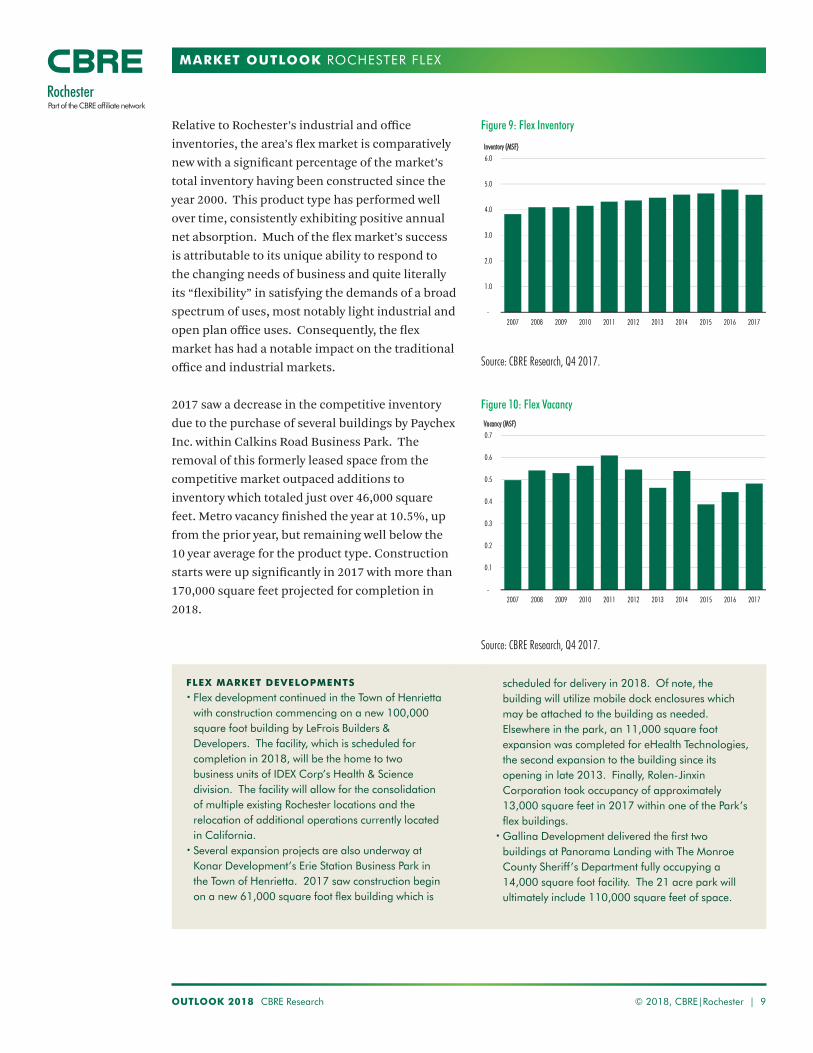
Relative to Rochester’s industrial and office inventories, the area’s flex market is comparatively new with a significant percentage of the market’s total inventory having been constructed since the year 2000. This product type has performed well over time, consistently exhibiting positive annual net absorption. Much of the flex market’s success is attributable to its unique ability to respond to the changing needs of business and quite literally its “flexibility” in satisfying the demands of a broad spectrum of uses, most notably light industrial and open plan office uses. Consequently, the flex market has had a notable impact on the traditional office and industrial markets.
2017 saw a decrease in the competitive inventory due to the purchase of several buildings by Paychex Inc. within Calkins Road Business Park. The removal of this formerly leased space from the competitive market outpaced additions to inventory which totaled just over 46,000 square feet. Metro vacancy finished the year at 10.5%, up from the prior year, but remaining well below the 10 year average for the product type. Construction starts were up significantly in 2017 with more than 170,000 square feet projected for completion in 2018.
Figure 9: Flex Inventory
Source: CBRE Research, Q4 2017.
Source: CBRE Research, Q4 2017.
-
1.0
2.0
3.0
4.0
5.0
6.0
2007 2008 2009 2010 2011 2012 2013 2014 2015 2016 2017
Inventory (MSF)
-
0.1
0.2
0.3
0.4
0.5
0.6
0.7
2007 2008 2009 2010 2011 2012 2013 2014 2015 2016 2017
Vacancy (MSF)
Figure 10: Flex Vacancy
FLEX MARKET DEVELOPMENTS• Flex development continued in the Town of Henrietta
with construction commencing on a new 100,000 square foot building by LeFrois Builders & Developers. The facility, which is scheduled for completion in 2018, will be the home to two business units of IDEX Corp’s Health & Science division. The facility will allow for the consolidation of multiple existing Rochester locations and the relocation of additional operations currently located in California.
• Several expansion projects are also underway at Konar Development’s Erie Station Business Park in the Town of Henrietta. 2017 saw construction begin on a new 61,000 square foot flex building which is
scheduled for delivery in 2018. Of note, the building will utilize mobile dock enclosures which may be attached to the building as needed. Elsewhere in the park, an 11,000 square foot expansion was completed for eHealth Technologies, the second expansion to the building since its opening in late 2013. Finally, Rolen-Jinxin Corporation took occupancy of approximately 13,000 square feet in 2017 within one of the Park’s flex buildings.
• Gallina Development delivered the first two buildings at Panorama Landing with The Monroe County Sheriff’s Department fully occupying a 14,000 square foot facility. The 21 acre park will ultimately include 110,000 square feet of space.
OUTLOOK 2018 CBRE Research © 2018, CBRE|Rochester | 10
MARKET OUTLOOK
RochesterPart of the CBRE affiliate network
Rochester Industrial, Outlook 2018
Industrial vacancy continues to decrease as occupier driven construction increases
Metro Vacancy Rate 7.3%
City Vacancy Rate 9.0%
Suburban Vacancy Rate 6.2%
Metro Inventory76.9 MSF
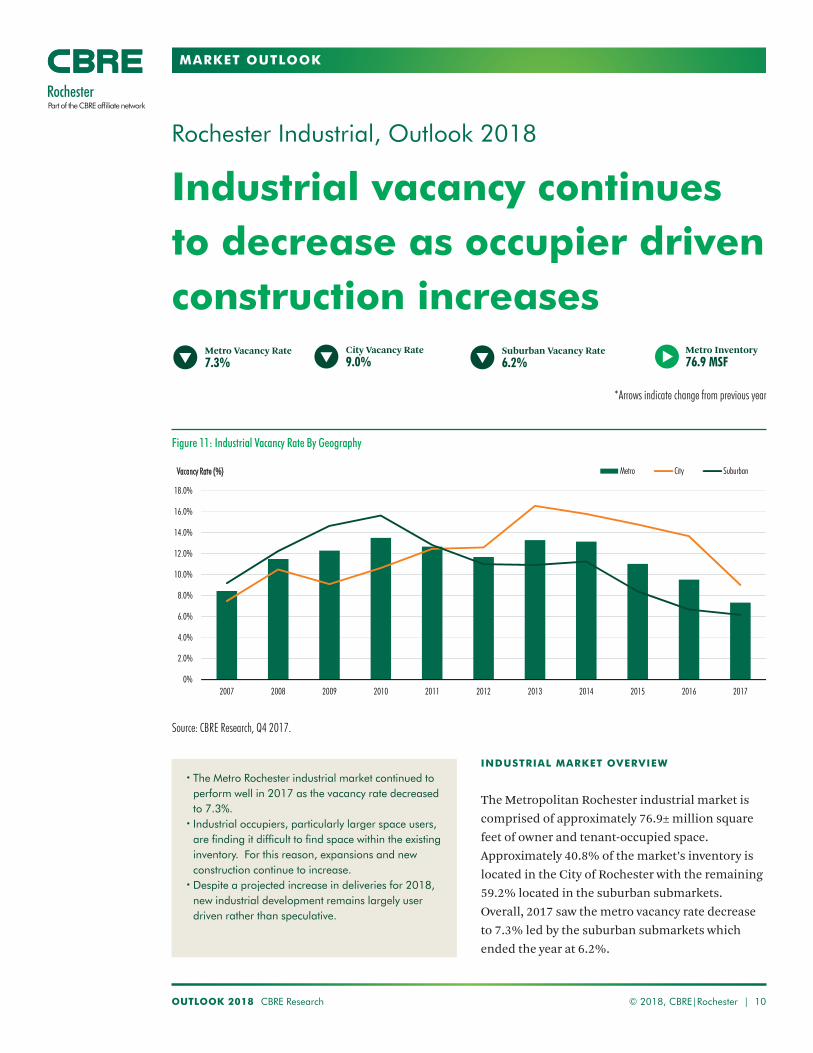
INDUSTRIAL MARKET OVERVIEW
The Metropolitan Rochester industrial market is comprised of approximately 76.9± million square feet of owner and tenant-occupied space. Approximately 40.8% of the market’s inventory is located in the City of Rochester with the remaining 59.2% located in the suburban submarkets. Overall, 2017 saw the metro vacancy rate decrease to 7.3% led by the suburban submarkets which ended the year at 6.2%.
• The Metro Rochester industrial market continued to perform well in 2017 as the vacancy rate decreased to 7.3%.
• Industrial occupiers, particularly larger space users, are finding it difficult to find space within the existing inventory. For this reason, expansions and new construction continue to increase.
• Despite a projected increase in deliveries for 2018, new industrial development remains largely user driven rather than speculative.
Source: CBRE Research, Q4 2017.
Figure 11: Industrial Vacancy Rate By Geography
*Arrows indicate change from previous year
0%
2.0%
4.0%
6.0%
8.0%
10.0%
12.0%
14.0%
16.0%
18.0%
2007 2008 2009 2010 2011 2012 2013 2014 2015 2016 2017
Vacancy Rate (%) Metro City Suburban
OUTLOOK 2018 CBRE Research © 2018, CBRE|Rochester | 11
MARKET OUTLOOK ROCHESTER INDUSTRIAL
RochesterPart of the CBRE affiliate network
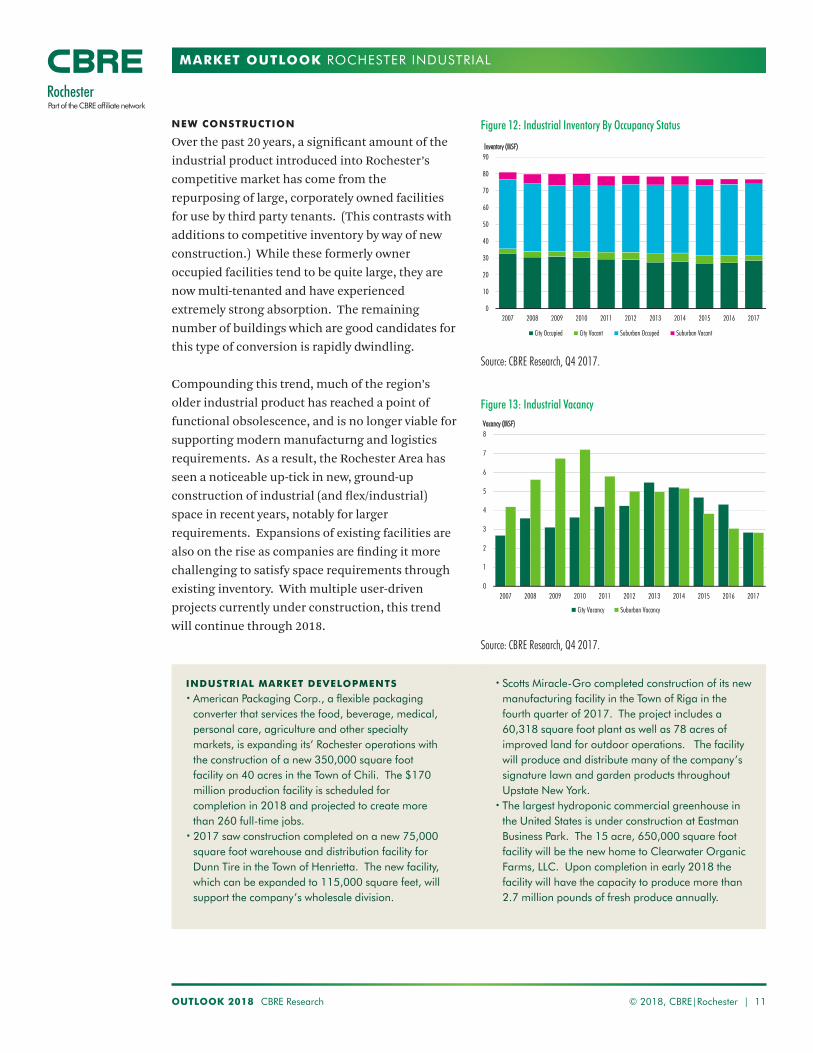
NEW CONSTRUCTION
Over the past 20 years, a significant amount of the industrial product introduced into Rochester’s competitive market has come from the repurposing of large, corporately owned facilities for use by third party tenants. (This contrasts with additions to competitive inventory by way of new construction.) While these formerly owner occupied facilities tend to be quite large, they are now multi-tenanted and have experienced extremely strong absorption. The remaining number of buildings which are good candidates for this type of conversion is rapidly dwindling.
Compounding this trend, much of the region’s older industrial product has reached a point of functional obsolescence, and is no longer viable for supporting modern manufacturng and logistics requirements. As a result, the Rochester Area has seen a noticeable up-tick in new, ground-up construction of industrial (and flex/industrial) space in recent years, notably for larger requirements. Expansions of existing facilities are also on the rise as companies are finding it more challenging to satisfy space requirements through existing inventory. With multiple user-driven projects currently under construction, this trend will continue through 2018.
Figure 12: Industrial Inventory By Occupancy Status
Source: CBRE Research, Q4 2017.
Source: CBRE Research, Q4 2017.
0
10
20
30
40
50
60
70
80
90
2007 2008 2009 2010 2011 2012 2013 2014 2015 2016 2017
Inventory (MSF)
City Occupied City Vacant Suburban Occuped Suburban Vacant
0
1
2
3
4
5
6
7
8
2007 2008 2009 2010 2011 2012 2013 2014 2015 2016 2017
Vacancy (MSF)
City Vacancy Suburban Vacancy
Figure 13: Industrial Vacancy
INDUSTRIAL MARKET DEVELOPMENTS• American Packaging Corp., a flexible packaging
converter that services the food, beverage, medical, personal care, agriculture and other specialty markets, is expanding its’ Rochester operations with the construction of a new 350,000 square foot facility on 40 acres in the Town of Chili. The $170 million production facility is scheduled for completion in 2018 and projected to create more than 260 full-time jobs.
• 2017 saw construction completed on a new 75,000 square foot warehouse and distribution facility for Dunn Tire in the Town of Henrietta. The new facility, which can be expanded to 115,000 square feet, will support the company’s wholesale division.
• Scotts Miracle-Gro completed construction of its new manufacturing facility in the Town of Riga in the fourth quarter of 2017. The project includes a 60,318 square foot plant as well as 78 acres of improved land for outdoor operations. The facility will produce and distribute many of the company’s signature lawn and garden products throughout Upstate New York.
• The largest hydroponic commercial greenhouse in the United States is under construction at Eastman Business Park. The 15 acre, 650,000 square foot facility will be the new home to Clearwater Organic Farms, LLC. Upon completion in early 2018 the facility will have the capacity to produce more than 2.7 million pounds of fresh produce annually.
Disclaimer: Information contained herein, including projections, has been obtained from sources believed to be reliable. While we do not doubt its accuracy, we have not verified it and make no guarantee, warranty or representation about it. It is your responsibility to confirm independently its accuracy and completeness. This information is presented exclusively for use by CBRE clients and professionals and all rights to the material are reserved and cannot be reproduced without prior written permission of CBRE.
MARKET OUTLOOK 2018 ROCHESTER
RochesterPart of the CBRE affiliate network
CONTACTS
Angelo NoleManaging Director+1 585 784 [email protected]
Jonathan Murray, CMADirector of Marketing & Research+1 585 784 [email protected]
OFFICE
CBRE|Rochester120 Corporate Woods, Suite 210Rochester, NY 14623 +1 585 240 8080www.cbre.com/rochester
To learn more about CBRE Research,or to access additional research reports,please visit the Global Research Gateway atwww.cbre.com/research
ABOUT US
CBRE|Rochester is an affiliate office of CBRE Group, Inc. and offers a full suite of commercial real estate services to clients in the Greater Rochester Area. Please visit our website at www.cbre.com/rochester to learn more.
CBRE Group, Inc. is the world’s largest commercial real estate services and investment firm, with 2016 revenues of $13.1 billion and more than 75,000 employees. CBRE has been included in the Fortune 500 since 2008, ranking #214 in 2017. It also has been voted the industry’s top brand by the Lipsey Company for 16 consecutive years, and has been named one of Fortune’s “Most Admired Companies” in the real estate sector for five years in a row. Its shares trade on the New York Stock Exchange under the symbol “CBG.” CBRE offers a broad range of integrated services including property sales and leasing; strategic consulting; corporate services; transaction and project management; property management; investment management; appraisal and valuation; mortgage services; and development services.