Embed Size (px)
Citation preview
CBRE RESEARCH | ROCHESTER
REALESTATEMARKETOUTLOOK
2020ROCHESTER
OUTLOOK 2020 CBRE|Rochester Research © 2020, CBRE|Rochester | 2
MARKET OUTLOOK 2020 ROCHESTER
RochesterPart of the CBRE affiliate network
ROCHESTER OVERVIEW
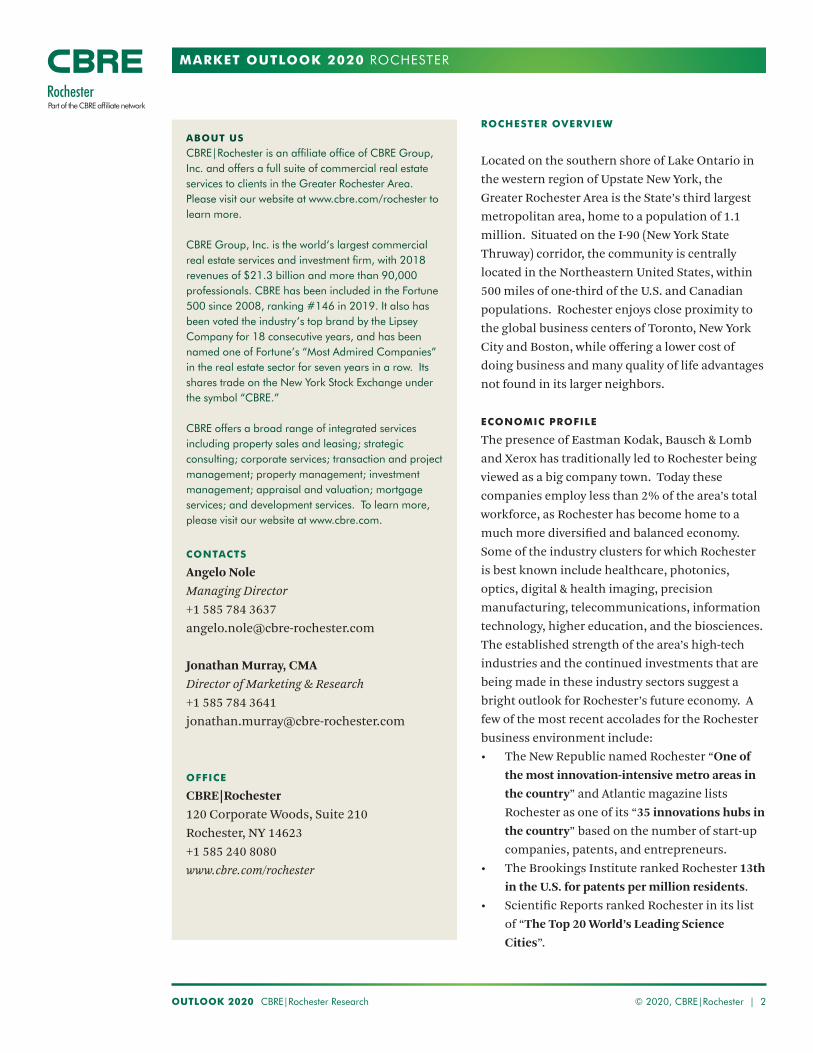
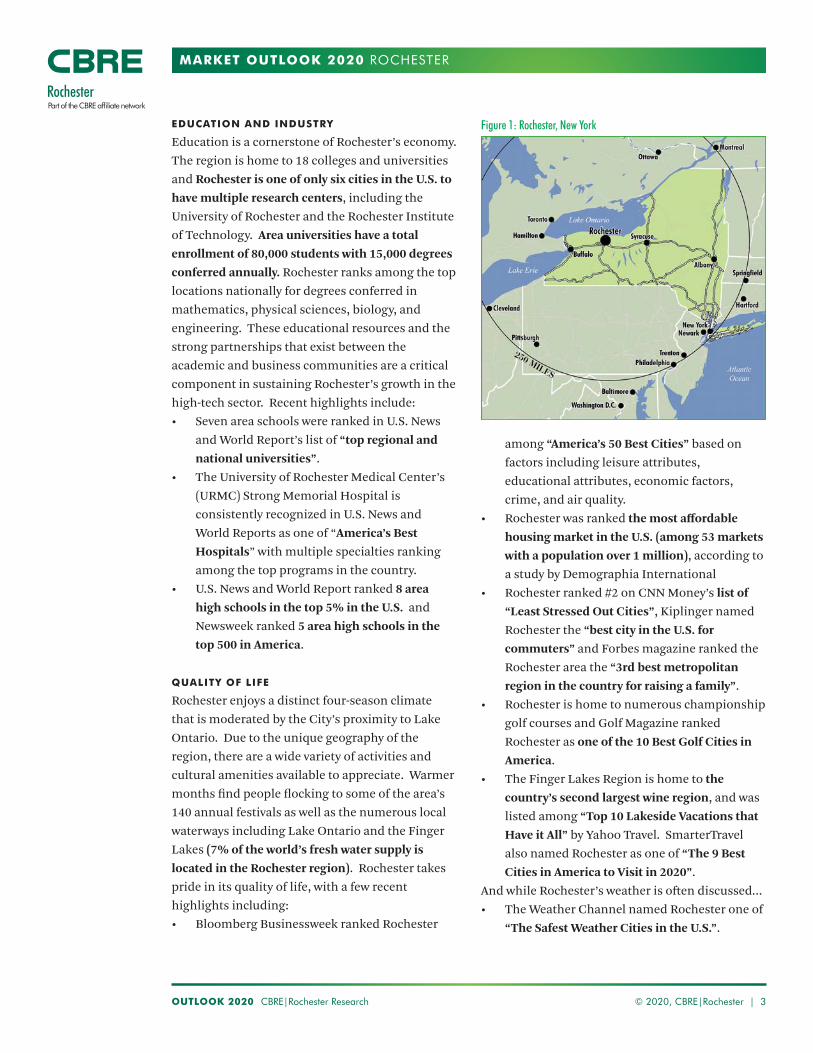
Located on the southern shore of Lake Ontario in the western region of Upstate New York, the Greater Rochester Area is the State’s third largest metropolitan area, home to a population of 1.1 million. Situated on the I-90 (New York State Thruway) corridor, the community is centrally located in the Northeastern United States, within 500 miles of one-third of the U.S. and Canadian populations. Rochester enjoys close proximity to the global business centers of Toronto, New York City and Boston, while offering a lower cost of doing business and many quality of life advantages not found in its larger neighbors.
ECONOMIC PROFILE
The presence of Eastman Kodak, Bausch & Lomb and Xerox has traditionally led to Rochester being viewed as a big company town. Today these companies employ less than 2% of the area’s total workforce, as Rochester has become home to a much more diversified and balanced economy. Some of the industry clusters for which Rochester is best known include healthcare, photonics, optics, digital & health imaging, precision manufacturing, telecommunications, information technology, higher education, and the biosciences. The established strength of the area’s high-tech industries and the continued investments that are being made in these industry sectors suggest a bright outlook for Rochester’s future economy. A few of the most recent accolades for the Rochester business environment include:• The New Republic named Rochester “One of
the most innovation-intensive metro areas in the country” and Atlantic magazine lists Rochester as one of its “35 innovations hubs in the country” based on the number of start-up companies, patents, and entrepreneurs.
• The Brookings Institute ranked Rochester 13th in the U.S. for patents per million residents.
• Scientific Reports ranked Rochester in its list of “The Top 20 World’s Leading Science Cities”.
ABOUT US
CBRE|Rochester is an affiliate office of CBRE Group, Inc. and offers a full suite of commercial real estate services to clients in the Greater Rochester Area. Please visit our website at www.cbre.com/rochester to learn more.
CBRE Group, Inc. is the world’s largest commercial real estate services and investment firm, with 2018 revenues of $21.3 billion and more than 90,000 professionals. CBRE has been included in the Fortune 500 since 2008, ranking #146 in 2019. It also has been voted the industry’s top brand by the Lipsey Company for 18 consecutive years, and has been named one of Fortune’s “Most Admired Companies” in the real estate sector for seven years in a row. Its shares trade on the New York Stock Exchange under the symbol “CBRE.”
CBRE offers a broad range of integrated services including property sales and leasing; strategic consulting; corporate services; transaction and project management; property management; investment management; appraisal and valuation; mortgage services; and development services. To learn more, please visit our website at www.cbre.com.
CONTACTS
Angelo NoleManaging Director+1 585 784 [email protected]
Jonathan Murray, CMADirector of Marketing & Research+1 585 784 [email protected]
OFFICE
CBRE|Rochester120 Corporate Woods, Suite 210Rochester, NY 14623 +1 585 240 8080www.cbre.com/rochester
OUTLOOK 2020 CBRE|Rochester Research © 2020, CBRE|Rochester | 3
MARKET OUTLOOK 2020 ROCHESTER
RochesterPart of the CBRE affiliate network
among “America’s 50 Best Cities” based on factors including leisure attributes, educational attributes, economic factors, crime, and air quality.
• Rochester was ranked the most affordable housing market in the U.S. (among 53 markets with a population over 1 million), according to a study by Demographia International
• Rochester ranked #2 on CNN Money’s list of “Least Stressed Out Cities”, Kiplinger named Rochester the “best city in the U.S. for commuters” and Forbes magazine ranked the Rochester area the “3rd best metropolitan region in the country for raising a family”.
• Rochester is home to numerous championship golf courses and Golf Magazine ranked Rochester as one of the 10 Best Golf Cities in America.
• The Finger Lakes Region is home to the country’s second largest wine region, and was listed among “Top 10 Lakeside Vacations that Have it All” by Yahoo Travel. SmarterTravel also named Rochester as one of “The 9 Best Cities in America to Visit in 2020”.
And while Rochester’s weather is often discussed...• The Weather Channel named Rochester one of
“The Safest Weather Cities in the U.S.”.
EDUCATION AND INDUSTRY
Education is a cornerstone of Rochester’s economy. The region is home to 18 colleges and universities and Rochester is one of only six cities in the U.S. to have multiple research centers, including the University of Rochester and the Rochester Institute of Technology. Area universities have a total enrollment of 80,000 students with 15,000 degrees conferred annually. Rochester ranks among the top locations nationally for degrees conferred in mathematics, physical sciences, biology, and engineering. These educational resources and the strong partnerships that exist between the academic and business communities are a critical component in sustaining Rochester’s growth in the high-tech sector. Recent highlights include:• Seven area schools were ranked in U.S. News
and World Report’s list of “top regional and national universities”.
• The University of Rochester Medical Center’s (URMC) Strong Memorial Hospital is consistently recognized in U.S. News and World Reports as one of “America’s Best Hospitals” with multiple specialties ranking among the top programs in the country.
• U.S. News and World Report ranked 8 area high schools in the top 5% in the U.S. and Newsweek ranked 5 area high schools in the top 500 in America.
QUALITY OF LIFE
Rochester enjoys a distinct four-season climate that is moderated by the City’s proximity to Lake Ontario. Due to the unique geography of the region, there are a wide variety of activities and cultural amenities available to appreciate. Warmer months find people flocking to some of the area’s 140 annual festivals as well as the numerous local waterways including Lake Ontario and the Finger Lakes (7% of the world’s fresh water supply is located in the Rochester region). Rochester takes pride in its quality of life, with a few recent highlights including: • Bloomberg Businessweek ranked Rochester
Figure 1: Rochester, New York
OUTLOOK 2020 CBRE|Rochester Research © 2020, CBRE|Rochester | 4
MARKET OUTLOOK
RochesterPart of the CBRE affiliate network
Rochester Retail, Outlook 2020
Significant changes at big-box properties continuing to reshape the retail market
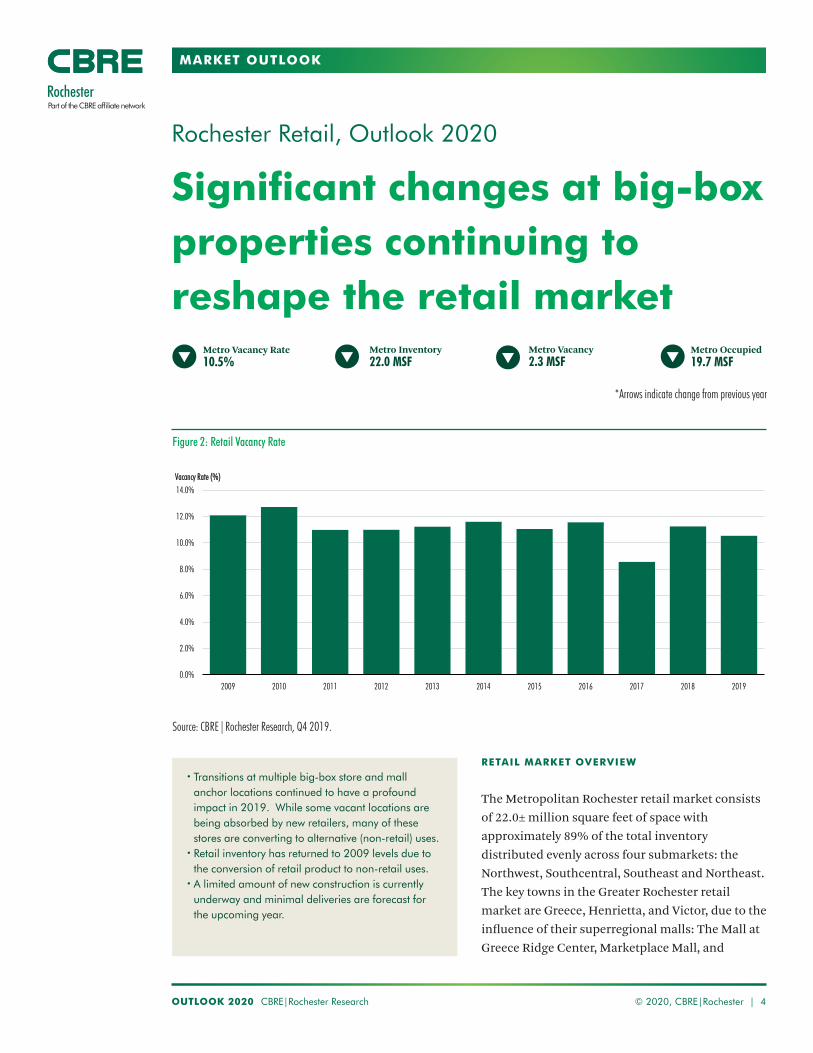
Metro Vacancy2.3 MSF
Metro Vacancy Rate 10.5%
RETAIL MARKET OVERVIEW
The Metropolitan Rochester retail market consists of 22.0± million square feet of space with approximately 89% of the total inventory distributed evenly across four submarkets: the Northwest, Southcentral, Southeast and Northeast. The key towns in the Greater Rochester retail market are Greece, Henrietta, and Victor, due to the influence of their superregional malls: The Mall at Greece Ridge Center, Marketplace Mall, and
• Transitions at multiple big-box store and mall anchor locations continued to have a profound impact in 2019. While some vacant locations are being absorbed by new retailers, many of these stores are converting to alternative (non-retail) uses.
• Retail inventory has returned to 2009 levels due to the conversion of retail product to non-retail uses.
• A limited amount of new construction is currently underway and minimal deliveries are forecast for the upcoming year.
Source: CBRE|Rochester Research, Q4 2019.
Metro Occupied19.7 MSF
Figure 2: Retail Vacancy Rate
*Arrows indicate change from previous year
Metro Inventory22.0 MSF
0.0%
2.0%
4.0%
6.0%
8.0%
10.0%
12.0%
14.0%
2009 2010 2011 2012 2013 2014 2015 2016 2017 2018 2019
VVaaccaannccyy RRaattee ((%%))
OUTLOOK 2020 CBRE|Rochester Research © 2020, CBRE|Rochester | 5
MARKET OUTLOOK ROCHESTER RETAIL
RochesterPart of the CBRE affiliate network
Eastview Mall, respectively. These malls have served as catalysts for significant growth well beyond the boundaries of the properties and new retailers entering the Greater Rochester Area typically select one of these three trade areas as the location for their initial store. Recent deliveries in the City of Rochester have also reestablished this as a location retailers are considering for an initial store.
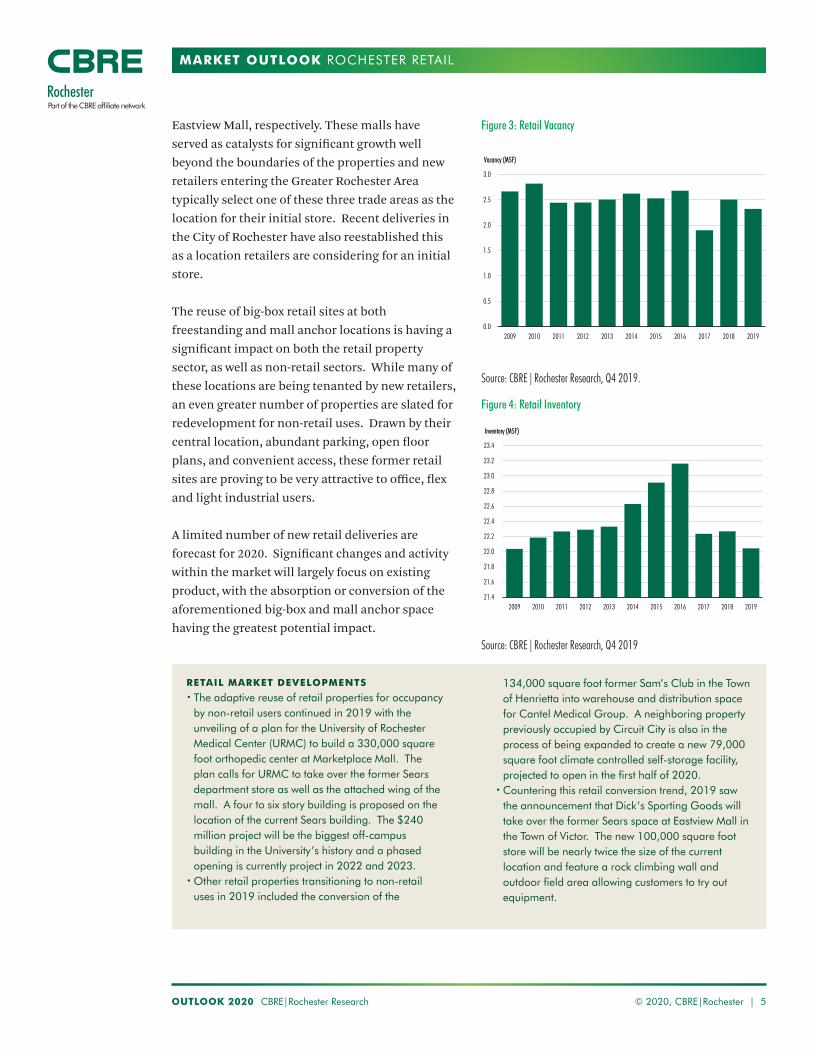
The reuse of big-box retail sites at both freestanding and mall anchor locations is having a significant impact on both the retail property sector, as well as non-retail sectors. While many of these locations are being tenanted by new retailers, an even greater number of properties are slated for redevelopment for non-retail uses. Drawn by their central location, abundant parking, open floor plans, and convenient access, these former retail sites are proving to be very attractive to office, flex and light industrial users.
A limited number of new retail deliveries are forecast for 2020. Significant changes and activity within the market will largely focus on existing product, with the absorption or conversion of the aforementioned big-box and mall anchor space having the greatest potential impact.
Figure 3: Retail Vacancy
Source: CBRE|Rochester Research, Q4 2019.
Source: CBRE|Rochester Research, Q4 2019
0.0
0.5
1.0
1.5
2.0
2.5
3.0
2009 2010 2011 2012 2013 2014 2015 2016 2017 2018 2019
VVaaccaannccyy ((MMSSFF))
21.4
21.6
21.8
22.0
22.2
22.4
22.6
22.8
23.0
23.2
23.4
2009 2010 2011 2012 2013 2014 2015 2016 2017 2018 2019
IInnvveennttoorryy ((MMSSFF))
Figure 4: Retail Inventory
RETAIL MARKET DEVELOPMENTS• The adaptive reuse of retail properties for occupancy
by non-retail users continued in 2019 with the unveiling of a plan for the University of Rochester Medical Center (URMC) to build a 330,000 square foot orthopedic center at Marketplace Mall. The plan calls for URMC to take over the former Sears department store as well as the attached wing of the mall. A four to six story building is proposed on the location of the current Sears building. The $240 million project will be the biggest off-campus building in the University’s history and a phased opening is currently project in 2022 and 2023.
• Other retail properties transitioning to non-retail uses in 2019 included the conversion of the
134,000 square foot former Sam’s Club in the Town of Henrietta into warehouse and distribution space for Cantel Medical Group. A neighboring property previously occupied by Circuit City is also in the process of being expanded to create a new 79,000 square foot climate controlled self-storage facility, projected to open in the first half of 2020.
• Countering this retail conversion trend, 2019 saw the announcement that Dick’s Sporting Goods will take over the former Sears space at Eastview Mall in the Town of Victor. The new 100,000 square foot store will be nearly twice the size of the current location and feature a rock climbing wall and outdoor field area allowing customers to try out equipment.
OUTLOOK 2020 CBRE|Rochester Research © 2020, CBRE|Rochester | 6
MARKET OUTLOOK
RochesterPart of the CBRE affiliate network
OFFICE MARKET OVERVIEW
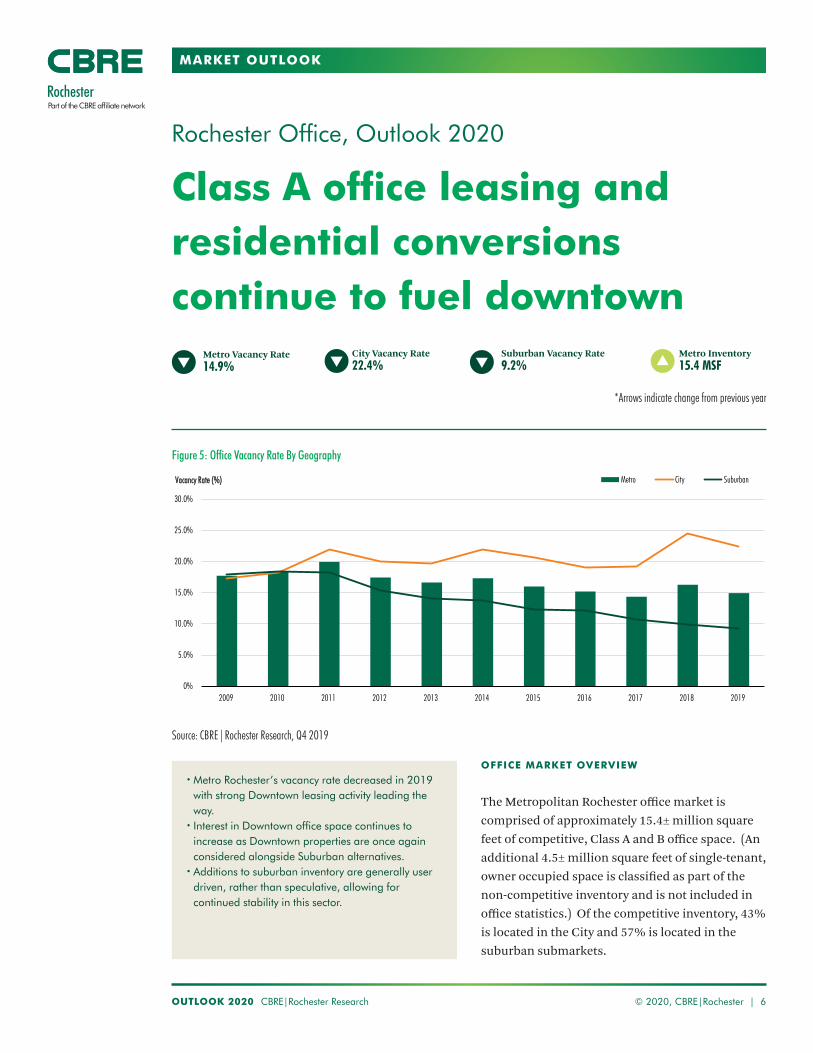
The Metropolitan Rochester office market is comprised of approximately 15.4± million square feet of competitive, Class A and B office space. (An additional 4.5± million square feet of single-tenant, owner occupied space is classified as part of the non-competitive inventory and is not included in office statistics.) Of the competitive inventory, 43% is located in the City and 57% is located in the suburban submarkets.
• Metro Rochester’s vacancy rate decreased in 2019 with strong Downtown leasing activity leading the way.
• Interest in Downtown office space continues to increase as Downtown properties are once again considered alongside Suburban alternatives.
• Additions to suburban inventory are generally user driven, rather than speculative, allowing for continued stability in this sector.
Rochester Office, Outlook 2020
Class A office leasing and residential conversions continue to fuel downtown
Metro Inventory15.4 MSF
Source: CBRE|Rochester Research, Q4 2019
Figure 5: Office Vacancy Rate By Geography
*Arrows indicate change from previous year
Suburban Vacancy Rate 9.2%
Metro Vacancy Rate 14.9%
City Vacancy Rate 22.4%
0%
5.0%
10.0%
15.0%
20.0%
25.0%
30.0%
2009 2010 2011 2012 2013 2014 2015 2016 2017 2018 2019
VVaaccaannccyy RRaattee ((%%)) Metro City Suburban
OUTLOOK 2020 CBRE|Rochester Research © 2020, CBRE|Rochester | 7
MARKET OUTLOOK ROCHESTER OFFICE
RochesterPart of the CBRE affiliate network
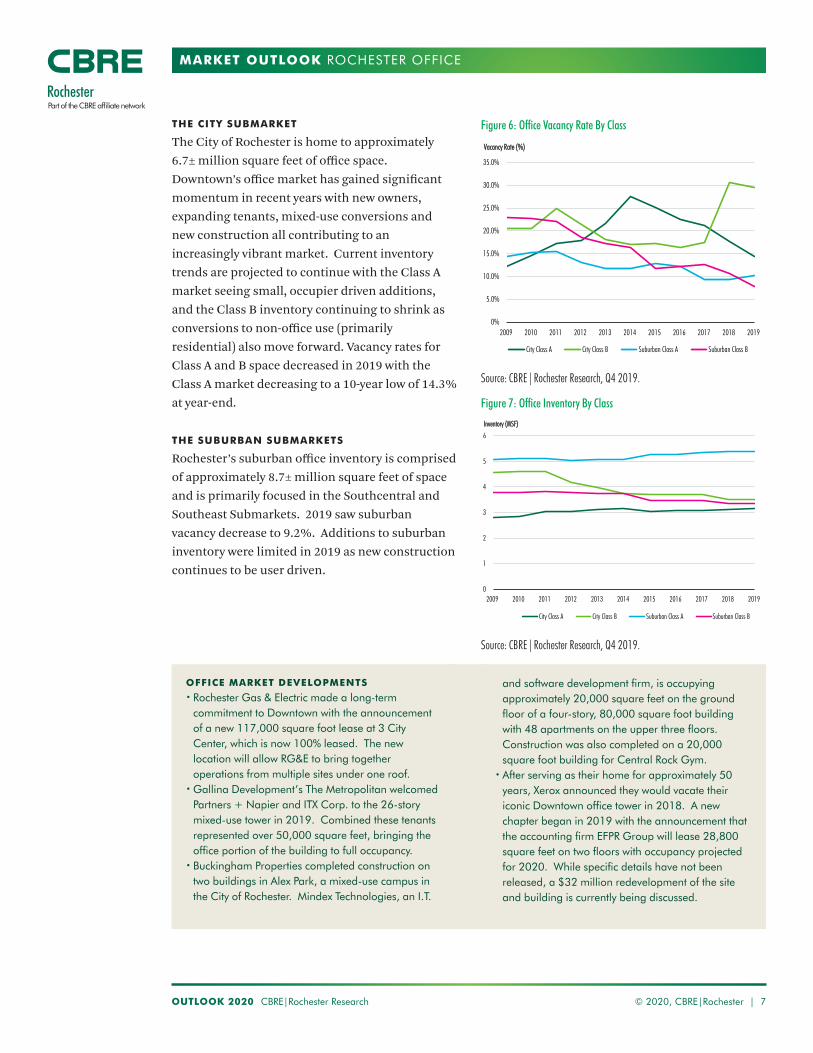
THE CITY SUBMARKET
The City of Rochester is home to approximately 6.7± million square feet of office space. Downtown’s office market has gained significant momentum in recent years with new owners, expanding tenants, mixed-use conversions and new construction all contributing to an increasingly vibrant market. Current inventory trends are projected to continue with the Class A market seeing small, occupier driven additions, and the Class B inventory continuing to shrink as conversions to non-office use (primarily residential) also move forward. Vacancy rates for Class A and B space decreased in 2019 with the Class A market decreasing to a 10-year low of 14.3% at year-end. THE SUBURBAN SUBMARKETS
Rochester’s suburban office inventory is comprised of approximately 8.7± million square feet of space and is primarily focused in the Southcentral and Southeast Submarkets. 2019 saw suburban vacancy decrease to 9.2%. Additions to suburban inventory were limited in 2019 as new construction continues to be user driven.
OFFICE MARKET DEVELOPMENTS• Rochester Gas & Electric made a long-term
commitment to Downtown with the announcement of a new 117,000 square foot lease at 3 City Center, which is now 100% leased. The new location will allow RG&E to bring together operations from multiple sites under one roof.
• Gallina Development’s The Metropolitan welcomed Partners + Napier and ITX Corp. to the 26-story mixed-use tower in 2019. Combined these tenants represented over 50,000 square feet, bringing the office portion of the building to full occupancy.
• Buckingham Properties completed construction on two buildings in Alex Park, a mixed-use campus in the City of Rochester. Mindex Technologies, an I.T.
and software development firm, is occupying approximately 20,000 square feet on the ground floor of a four-story, 80,000 square foot building with 48 apartments on the upper three floors. Construction was also completed on a 20,000 square foot building for Central Rock Gym.
• After serving as their home for approximately 50 years, Xerox announced they would vacate their iconic Downtown office tower in 2018. A new chapter began in 2019 with the announcement that the accounting firm EFPR Group will lease 28,800 square feet on two floors with occupancy projected for 2020. While specific details have not been released, a $32 million redevelopment of the site and building is currently being discussed.
Figure 6: Office Vacancy Rate By Class
Figure 7: Office Inventory By Class
Source: CBRE|Rochester Research, Q4 2019.
Source: CBRE|Rochester Research, Q4 2019.
0%
5.0%
10.0%
15.0%
20.0%
25.0%
30.0%
35.0%
2009 2010 2011 2012 2013 2014 2015 2016 2017 2018 2019
VVaaccaannccyy RRaattee ((%%))
City Class A City Class B Suburban Class A Suburban Class B
0
1
2
3
4
5
6
2009 2010 2011 2012 2013 2014 2015 2016 2017 2018 2019
IInnvveennttoorryy ((MMSSFF))
City Class A City Class B Suburban Class A Suburban Class B
OUTLOOK 2020 CBRE|Rochester Research © 2020, CBRE|Rochester | 8
MARKET OUTLOOK
RochesterPart of the CBRE affiliate network
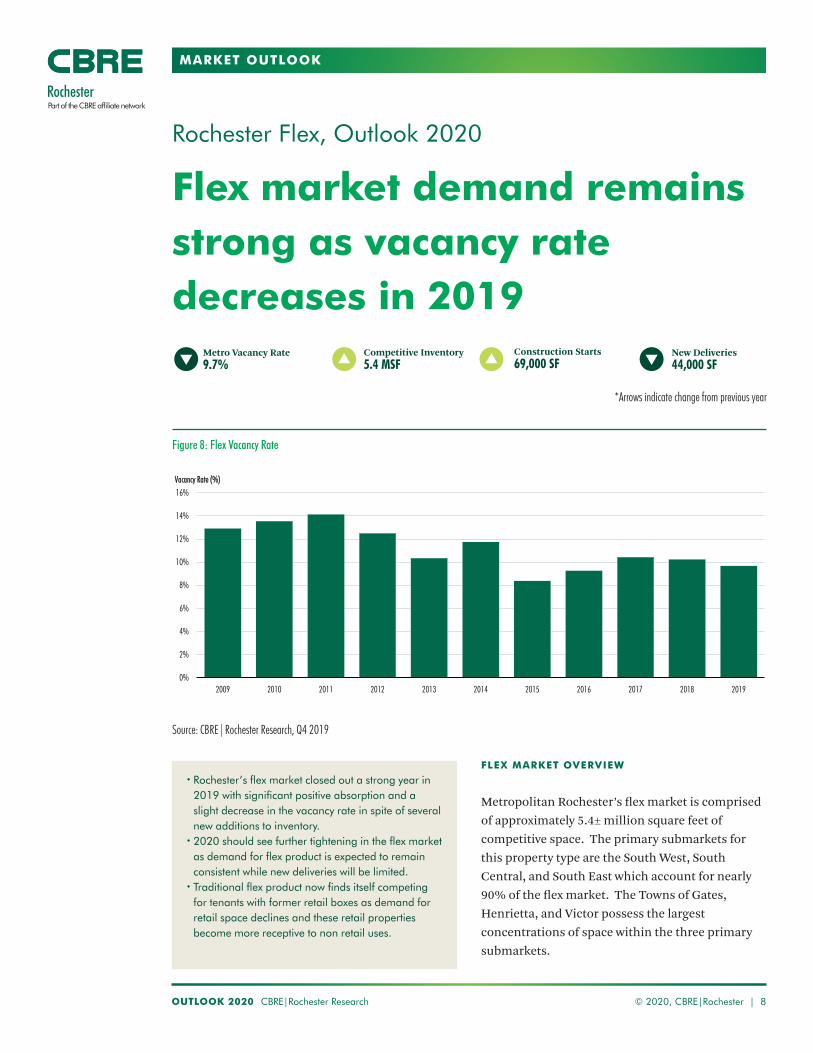
FLEX MARKET OVERVIEW
Metropolitan Rochester’s flex market is comprised of approximately 5.4± million square feet of competitive space. The primary submarkets for this property type are the South West, South Central, and South East which account for nearly 90% of the flex market. The Towns of Gates, Henrietta, and Victor possess the largest concentrations of space within the three primary submarkets.
• Rochester’s flex market closed out a strong year in 2019 with significant positive absorption and a slight decrease in the vacancy rate in spite of several new additions to inventory.
• 2020 should see further tightening in the flex market as demand for flex product is expected to remain consistent while new deliveries will be limited.
• Traditional flex product now finds itself competing for tenants with former retail boxes as demand for retail space declines and these retail properties become more receptive to non retail uses.
Rochester Flex, Outlook 2020
Flex market demand remains strong as vacancy rate decreases in 2019
Source: CBRE|Rochester Research, Q4 2019
New Deliveries44,000 SF
Construction Starts69,000 SF
Metro Vacancy Rate 9.7%
Figure 8: Flex Vacancy Rate
*Arrows indicate change from previous year
Competitive Inventory5.4 MSF
0%
2%
4%
6%
8%
10%
12%
14%
16%
2009 2010 2011 2012 2013 2014 2015 2016 2017 2018 2019
VVaaccaannccyy RRaattee ((%%))
OUTLOOK 2020 CBRE|Rochester Research © 2020, CBRE|Rochester | 9
MARKET OUTLOOK ROCHESTER FLEX
RochesterPart of the CBRE affiliate network
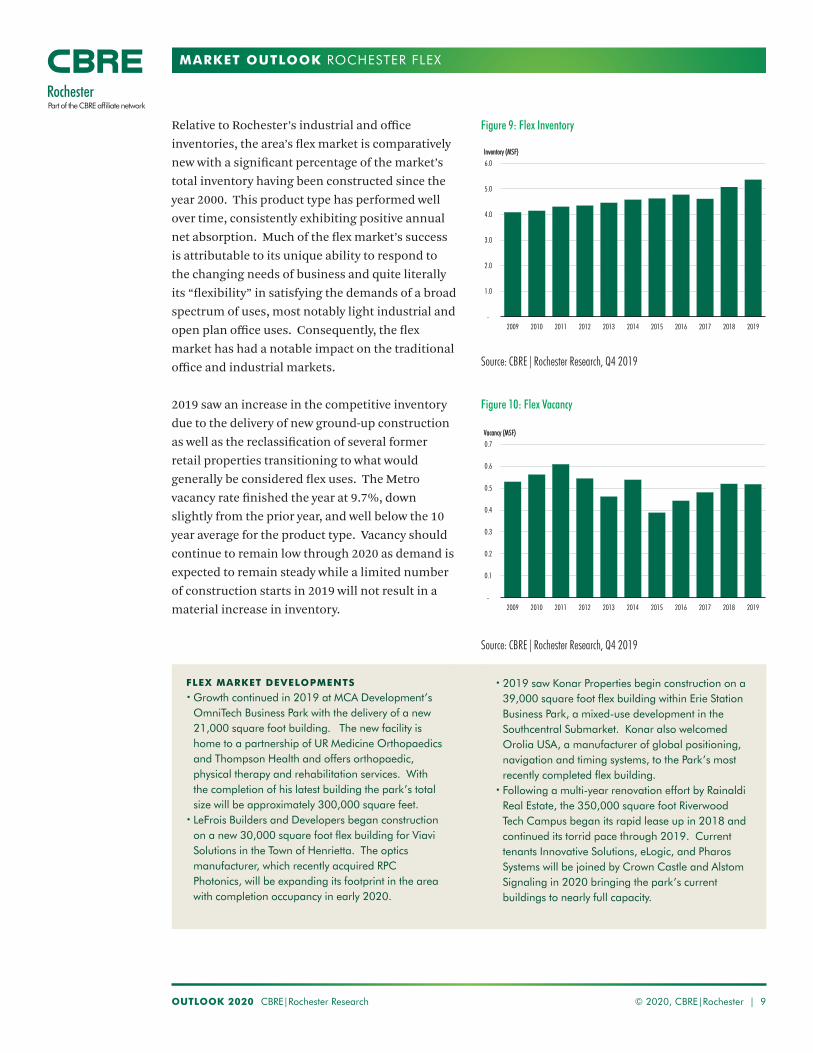
Relative to Rochester’s industrial and office inventories, the area’s flex market is comparatively new with a significant percentage of the market’s total inventory having been constructed since the year 2000. This product type has performed well over time, consistently exhibiting positive annual net absorption. Much of the flex market’s success is attributable to its unique ability to respond to the changing needs of business and quite literally its “flexibility” in satisfying the demands of a broad spectrum of uses, most notably light industrial and open plan office uses. Consequently, the flex market has had a notable impact on the traditional office and industrial markets.
2019 saw an increase in the competitive inventory due to the delivery of new ground-up construction as well as the reclassification of several former retail properties transitioning to what would generally be considered flex uses. The Metro vacancy rate finished the year at 9.7%, down slightly from the prior year, and well below the 10 year average for the product type. Vacancy should continue to remain low through 2020 as demand is expected to remain steady while a limited number of construction starts in 2019 will not result in a material increase in inventory.
Figure 9: Flex Inventory
Source: CBRE|Rochester Research, Q4 2019
Source: CBRE|Rochester Research, Q4 2019
-
1.0
2.0
3.0
4.0
5.0
6.0
2009 2010 2011 2012 2013 2014 2015 2016 2017 2018 2019
IInnvveennttoorryy ((MMSSFF))
-
0.1
0.2
0.3
0.4
0.5
0.6
0.7
2009 2010 2011 2012 2013 2014 2015 2016 2017 2018 2019
VVaaccaannccyy ((MMSSFF))
Figure 10: Flex Vacancy
FLEX MARKET DEVELOPMENTS• Growth continued in 2019 at MCA Development’s
OmniTech Business Park with the delivery of a new 21,000 square foot building. The new facility is home to a partnership of UR Medicine Orthopaedics and Thompson Health and offers orthopaedic, physical therapy and rehabilitation services. With the completion of his latest building the park’s total size will be approximately 300,000 square feet.
• LeFrois Builders and Developers began construction on a new 30,000 square foot flex building for Viavi Solutions in the Town of Henrietta. The optics manufacturer, which recently acquired RPC Photonics, will be expanding its footprint in the area with completion occupancy in early 2020.
• 2019 saw Konar Properties begin construction on a 39,000 square foot flex building within Erie Station Business Park, a mixed-use development in the Southcentral Submarket. Konar also welcomed Orolia USA, a manufacturer of global positioning, navigation and timing systems, to the Park’s most recently completed flex building.
• Following a multi-year renovation effort by Rainaldi Real Estate, the 350,000 square foot Riverwood Tech Campus began its rapid lease up in 2018 and continued its torrid pace through 2019. Current tenants Innovative Solutions, eLogic, and Pharos Systems will be joined by Crown Castle and Alstom Signaling in 2020 bringing the park’s current buildings to nearly full capacity.
OUTLOOK 2020 CBRE|Rochester Research © 2020, CBRE|Rochester | 10
MARKET OUTLOOK
RochesterPart of the CBRE affiliate network
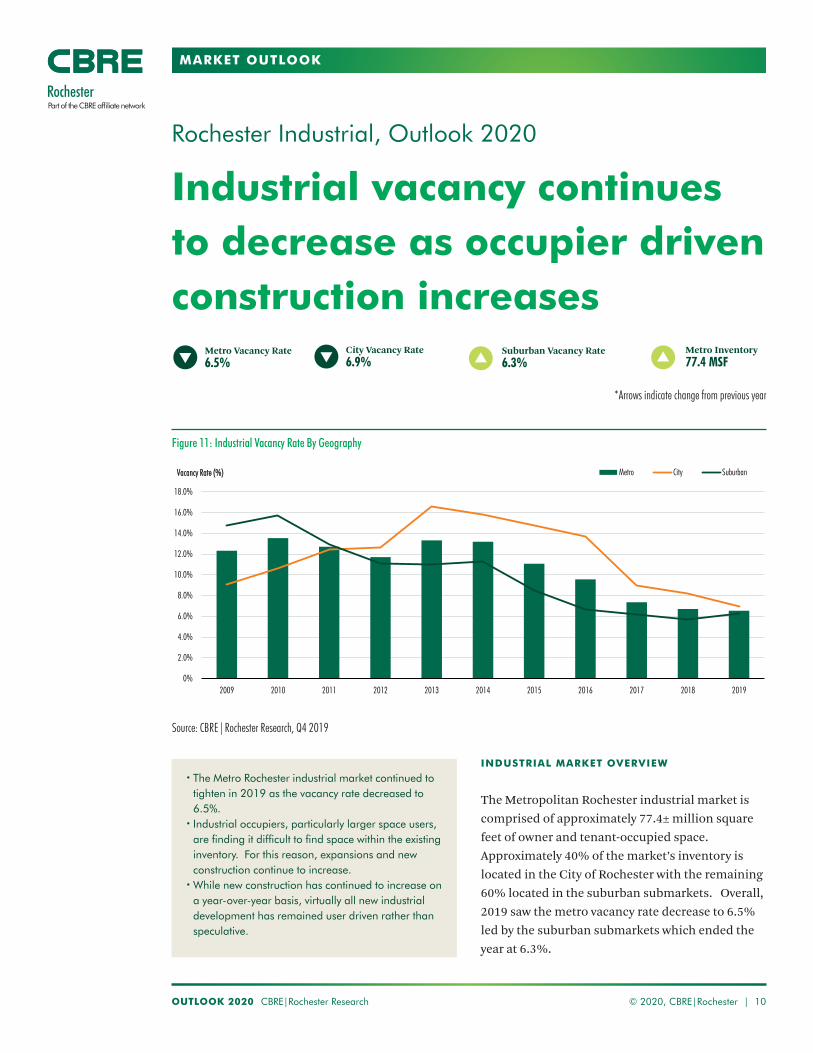
Rochester Industrial, Outlook 2020
Industrial vacancy continues to decrease as occupier driven construction increases
Metro Vacancy Rate 6.5%
City Vacancy Rate 6.9%
Suburban Vacancy Rate 6.3%
Metro Inventory77.4 MSF
INDUSTRIAL MARKET OVERVIEW
The Metropolitan Rochester industrial market is comprised of approximately 77.4± million square feet of owner and tenant-occupied space. Approximately 40% of the market’s inventory is located in the City of Rochester with the remaining 60% located in the suburban submarkets. Overall, 2019 saw the metro vacancy rate decrease to 6.5% led by the suburban submarkets which ended the year at 6.3%.
• The Metro Rochester industrial market continued to tighten in 2019 as the vacancy rate decreased to 6.5%.
• Industrial occupiers, particularly larger space users, are finding it difficult to find space within the existing inventory. For this reason, expansions and new construction continue to increase.
• While new construction has continued to increase on a year-over-year basis, virtually all new industrial development has remained user driven rather than speculative.
Source: CBRE|Rochester Research, Q4 2019
Figure 11: Industrial Vacancy Rate By Geography
*Arrows indicate change from previous year
0%
2.0%
4.0%
6.0%
8.0%
10.0%
12.0%
14.0%
16.0%
18.0%
2009 2010 2011 2012 2013 2014 2015 2016 2017 2018 2019
VVaaccaannccyy RRaattee ((%%)) Metro City Suburban
OUTLOOK 2020 CBRE|Rochester Research © 2020, CBRE|Rochester | 11
MARKET OUTLOOK ROCHESTER INDUSTRIAL
RochesterPart of the CBRE affiliate network
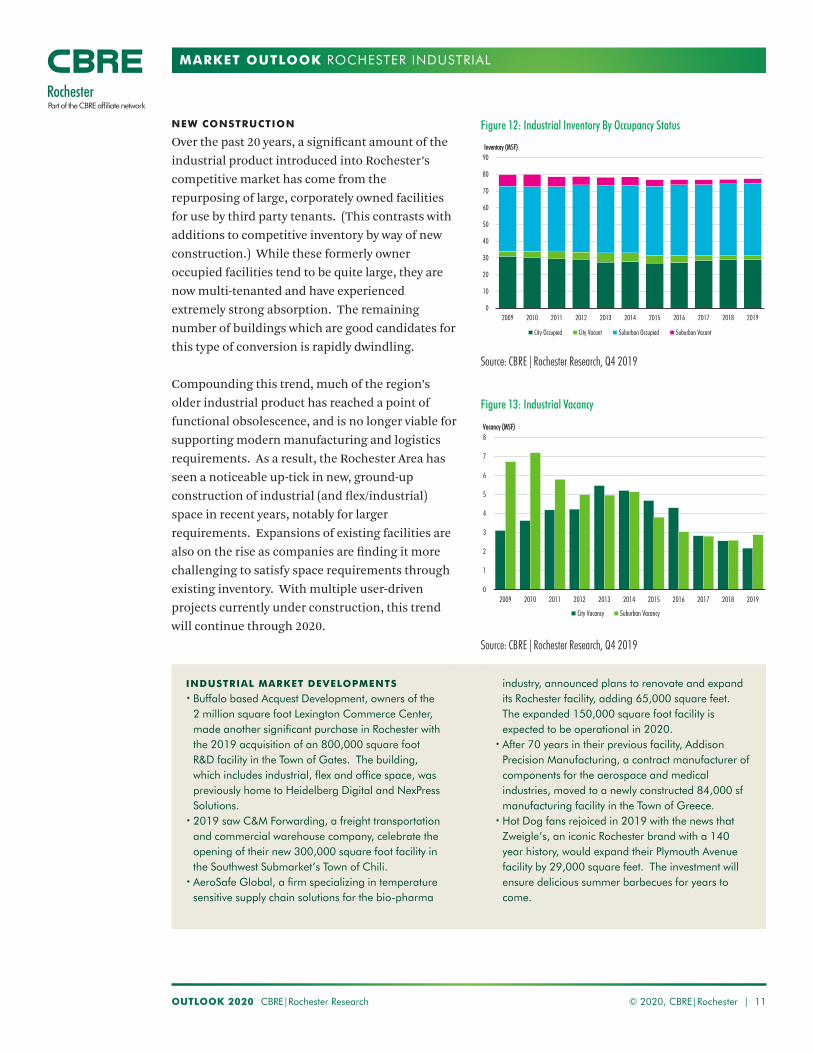
NEW CONSTRUCTION
Over the past 20 years, a significant amount of the industrial product introduced into Rochester’s competitive market has come from the repurposing of large, corporately owned facilities for use by third party tenants. (This contrasts with additions to competitive inventory by way of new construction.) While these formerly owner occupied facilities tend to be quite large, they are now multi-tenanted and have experienced extremely strong absorption. The remaining number of buildings which are good candidates for this type of conversion is rapidly dwindling.
Compounding this trend, much of the region’s older industrial product has reached a point of functional obsolescence, and is no longer viable for supporting modern manufacturing and logistics requirements. As a result, the Rochester Area has seen a noticeable up-tick in new, ground-up construction of industrial (and flex/industrial) space in recent years, notably for larger requirements. Expansions of existing facilities are also on the rise as companies are finding it more challenging to satisfy space requirements through existing inventory. With multiple user-driven projects currently under construction, this trend will continue through 2020.
Figure 12: Industrial Inventory By Occupancy Status
Source: CBRE|Rochester Research, Q4 2019
Source: CBRE|Rochester Research, Q4 2019
0
10
20
30
40
50
60
70
80
90
2009 2010 2011 2012 2013 2014 2015 2016 2017 2018 2019
IInnvveennttoorryy ((MMSSFF))
City Occupied City Vacant Suburban Occupied Suburban Vacant
0
1
2
3
4
5
6
7
8
2009 2010 2011 2012 2013 2014 2015 2016 2017 2018 2019
VVaaccaannccyy ((MMSSFF))
City Vacancy Suburban Vacancy
Figure 13: Industrial Vacancy
INDUSTRIAL MARKET DEVELOPMENTS• Buffalo based Acquest Development, owners of the
2 million square foot Lexington Commerce Center, made another significant purchase in Rochester with the 2019 acquisition of an 800,000 square foot R&D facility in the Town of Gates. The building, which includes industrial, flex and office space, was previously home to Heidelberg Digital and NexPress Solutions.
• 2019 saw C&M Forwarding, a freight transportation and commercial warehouse company, celebrate the opening of their new 300,000 square foot facility in the Southwest Submarket’s Town of Chili.
• AeroSafe Global, a firm specializing in temperature sensitive supply chain solutions for the bio-pharma
industry, announced plans to renovate and expand its Rochester facility, adding 65,000 square feet. The expanded 150,000 square foot facility is expected to be operational in 2020.
• After 70 years in their previous facility, Addison Precision Manufacturing, a contract manufacturer of components for the aerospace and medical industries, moved to a newly constructed 84,000 sf manufacturing facility in the Town of Greece.
• Hot Dog fans rejoiced in 2019 with the news that Zweigle’s, an iconic Rochester brand with a 140 year history, would expand their Plymouth Avenue facility by 29,000 square feet. The investment will ensure delicious summer barbecues for years to come.
Disclaimer: Information contained herein, including projections, has been obtained from sources believed to be reliable. While we do not doubt its accuracy, we have not verified it and make no guarantee, warranty or representation about it. It is your responsibility to confirm independently its accuracy and completeness. This information is presented exclusively for use by CBRE|Rochester clients and professionals and all rights to the material are reserved and cannot be reproduced without prior written permission of CBRE|Rochester.
MARKET OUTLOOK 2020 ROCHESTER
RochesterPart of the CBRE affiliate network
CONTACTS
Angelo NoleManaging Director+1 585 784 [email protected]
Jonathan Murray, CMADirector of Marketing & Research+1 585 784 [email protected]
OFFICE
CBRE|Rochester120 Corporate Woods, Suite 210Rochester, NY 14623 +1 585 240 8080www.cbre.com/rochester
To learn more about CBRE Research,or to access additional research reports,please visit the Global Research Gateway atwww.cbre.com/research
ABOUT US
CBRE|Rochester is an affiliate office of CBRE Group, Inc. and offers a full suite of commercial real estate services to clients in the Greater Rochester Area. Please visit our website at www.cbre.com/rochester to learn more.
CBRE Group, Inc. is the world’s largest commercial real estate services and investment firm, with 2018 revenues of $21.3 billion and more than 90,000 professionals. CBRE has been included in the Fortune 500 since 2008, ranking #146 in 2019. It also has been voted the industry’s top brand by the Lipsey Company for 18 consecutive years, and has been named one of Fortune’s “Most Admired Companies” in the real estate sector for seven years in a row. Its shares trade on the New York Stock Exchange under the symbol “CBRE.” CBRE offers a broad range of integrated services including property sales and leasing; strategic consulting; corporate services; transaction and project management; property management; investment management; appraisal and valuation; mortgage services; and development services.