Embed Size (px)
Citation preview
Robust Action Recognition Using Multi-Scale Spatial-Temporal Concatenations of Local Features as NaturalAction StructuresXiaoyuan Zhu1,2, Meng Li1,2, Xiaojian Li1,2, Zhiyong Yang1,3*, Joe Z. Tsien1,2*
1 Brain and Behavior Discovery Institute, Medical College of Georgia, Georgia Regents University, Augusta, Georgia, United States of America, 2 Department of Neurology,
Medical College of Georgia, Georgia Regents University, Augusta, Georgia, United States of America, 3 Department of Ophthalmology, Medical College of Georgia, Georgia
Regents University, Augusta, Georgia, United States of America
Abstract
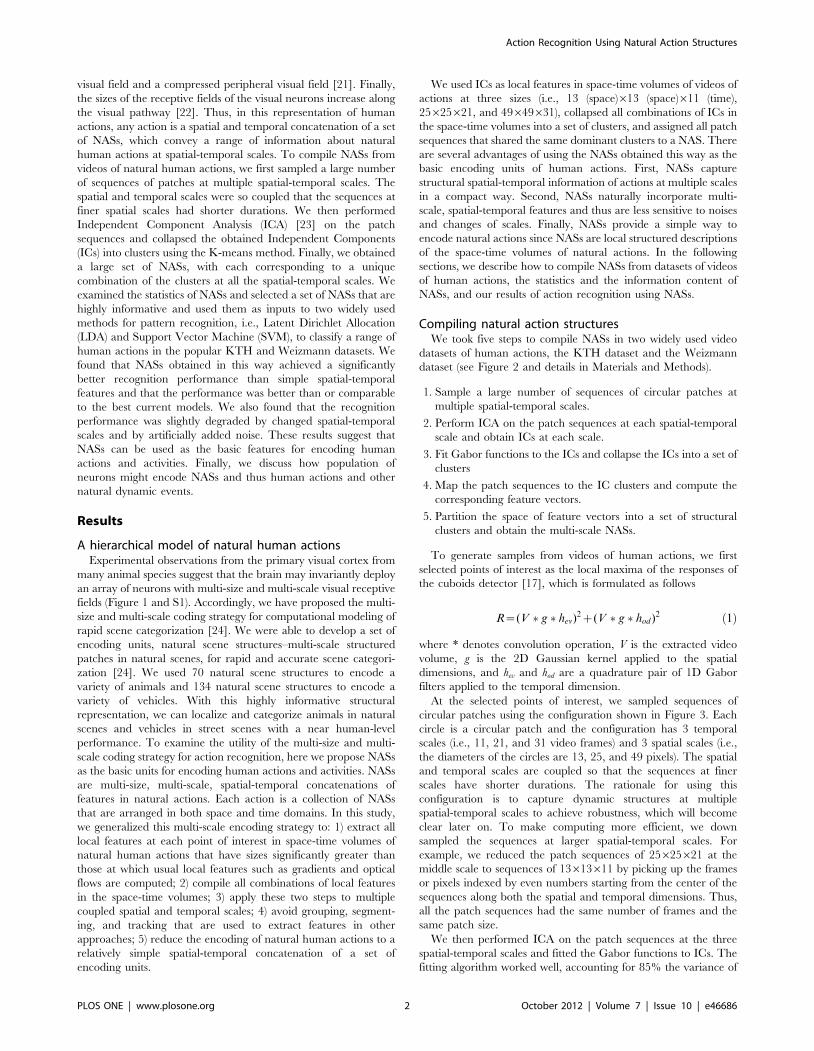
Human and many other animals can detect, recognize, and classify natural actions in a very short time. How this is achievedby the visual system and how to make machines understand natural actions have been the focus of neurobiological studiesand computational modeling in the last several decades. A key issue is what spatial-temporal features should be encodedand what the characteristics of their occurrences are in natural actions. Current global encoding schemes depend heavily onsegmenting while local encoding schemes lack descriptive power. Here, we propose natural action structures, i.e., multi-size,multi-scale, spatial-temporal concatenations of local features, as the basic features for representing natural actions. In thisconcept, any action is a spatial-temporal concatenation of a set of natural action structures, which convey a full range ofinformation about natural actions. We took several steps to extract these structures. First, we sampled a large number ofsequences of patches at multiple spatial-temporal scales. Second, we performed independent component analysis on thepatch sequences and classified the independent components into clusters. Finally, we compiled a large set of natural actionstructures, with each corresponding to a unique combination of the clusters at the selected spatial-temporal scales. Toclassify human actions, we used a set of informative natural action structures as inputs to two widely used models. Wefound that the natural action structures obtained here achieved a significantly better recognition performance than low-level features and that the performance was better than or comparable to the best current models. We also found that theclassification performance with natural action structures as features was slightly affected by changes of scale and artificiallyadded noise. We concluded that the natural action structures proposed here can be used as the basic encoding units ofactions and may hold the key to natural action understanding.
Citation: Zhu X, Li M, Li X, Yang Z, Tsien JZ (2012) Robust Action Recognition Using Multi-Scale Spatial-Temporal Concatenations of Local Features as NaturalAction Structures. PLoS ONE 7(10): e46686. doi:10.1371/journal.pone.0046686
Editor: Stefan Kiebel, Max Planck Institute for Human Cognitive and Brain Sciences, Germany
Received February 6, 2012; Accepted September 7, 2012; Published October 4, 2012
Copyright: � 2012 Zhu et al. This is an open-access article distributed under the terms of the Creative Commons Attribution License, which permits unrestricteduse, distribution, and reproduction in any medium, provided the original author and source are credited.
Funding: This research was supported by funds from National Institute of Mental Health (NIMH), National Institute of Aging (NIA), GHSU fund, and GeorgiaResearch Alliance (all to JZT). The funders had no role in study design,data collection and analysis, decision to publish, or preparation of the manuscript.
Competing Interests: The authors have declared that no competing interests exist.
* E-mail: [email protected] (ZY); [email protected] (JZT)
Introduction
Human and many other animals can easily detect, recognize,
and classify a range of actions very quickly. How this is
accomplished by the visual system has been intensively studied
over the past several decades [1–3]. Extensive studies suggest that
both the ventral and dorsal streams of visual cortex are involved in
the processing of human or animal actions [4,5]. Along the
hierarchical visual pathways, neurons at early levels have small
receptive fields and encode simple features such as orientation and
direction of motion. Neurons at higher levels have large receptive
fields and encode complex features such as complex shapes and
motion trajectories. These neurobiological studies motivated, to
varying degrees, a number of computational models of human
action understanding [5–10]. Because of its many applications in
surveillance, human-machine interaction, and robotics, action
recognition and understanding resurges as an active research area
of computer vision.
A key issue of action recognition is what spatial-temporal
features should be used. There are two broad feature represen-
tations of actions, global representations and local representations.
In global representations [11,12], actions are segmented from
background first and space-time volumes extracted from the
segmented videos are used for recognition. Global representations
can be highly informative, but they depend heavily on segmen-
tation and tracking, and are sensitive to changes of viewpoints and
occlusions. In local representations [13–16], a set of local, multi-
scale features compiled at the selected points of interest, including
cuboids descriptors [17], histograms of gradient orientation or
optic flow [18], extended speeded up robust features [19], are used
for action recognition. Local representations are not sensitive to
changes of viewpoints and occlusions, but lack descriptive power
and subject models of action recognition to extensive training.
In this paper, we propose Natural Action Structures (NASs), i.e.,
multi-size, multi-scale, spatial-temporal concatenations of local
features, as the basic features for representing natural human
actions. There are several reasons for using multi-scale represen-
tations. First, visual information processing at the retina appears to
be multi-scale [20]. Second, the retinotopic map of the visual
world has a multi-scale structure, having an expanded central
PLOS ONE | www.plosone.org 1 October 2012 | Volume 7 | Issue 10 | e46686
visual field and a compressed peripheral visual field [21]. Finally,
the sizes of the receptive fields of the visual neurons increase along
the visual pathway [22]. Thus, in this representation of human
actions, any action is a spatial and temporal concatenation of a set
of NASs, which convey a range of information about natural
human actions at spatial-temporal scales. To compile NASs from
videos of natural human actions, we first sampled a large number
of sequences of patches at multiple spatial-temporal scales. The
spatial and temporal scales were so coupled that the sequences at
finer spatial scales had shorter durations. We then performed
Independent Component Analysis (ICA) [23] on the patch
sequences and collapsed the obtained Independent Components
(ICs) into clusters using the K-means method. Finally, we obtained
a large set of NASs, with each corresponding to a unique
combination of the clusters at all the spatial-temporal scales. We
examined the statistics of NASs and selected a set of NASs that are
highly informative and used them as inputs to two widely used
methods for pattern recognition, i.e., Latent Dirichlet Allocation
(LDA) and Support Vector Machine (SVM), to classify a range of
human actions in the popular KTH and Weizmann datasets. We
found that NASs obtained in this way achieved a significantly
better recognition performance than simple spatial-temporal
features and that the performance was better than or comparable
to the best current models. We also found that the recognition
performance was slightly degraded by changed spatial-temporal
scales and by artificially added noise. These results suggest that
NASs can be used as the basic features for encoding human
actions and activities. Finally, we discuss how population of
neurons might encode NASs and thus human actions and other
natural dynamic events.
Results
A hierarchical model of natural human actionsExperimental observations from the primary visual cortex from
many animal species suggest that the brain may invariantly deploy
an array of neurons with multi-size and multi-scale visual receptive
fields (Figure 1 and S1). Accordingly, we have proposed the multi-
size and multi-scale coding strategy for computational modeling of
rapid scene categorization [24]. We were able to develop a set of
encoding units, natural scene structures–multi-scale structured
patches in natural scenes, for rapid and accurate scene categori-
zation [24]. We used 70 natural scene structures to encode a
variety of animals and 134 natural scene structures to encode a
variety of vehicles. With this highly informative structural
representation, we can localize and categorize animals in natural
scenes and vehicles in street scenes with a near human-level
performance. To examine the utility of the multi-size and multi-
scale coding strategy for action recognition, here we propose NASs
as the basic units for encoding human actions and activities. NASs
are multi-size, multi-scale, spatial-temporal concatenations of
features in natural actions. Each action is a collection of NASs
that are arranged in both space and time domains. In this study,
we generalized this multi-scale encoding strategy to: 1) extract all
local features at each point of interest in space-time volumes of
natural human actions that have sizes significantly greater than
those at which usual local features such as gradients and optical
flows are computed; 2) compile all combinations of local features
in the space-time volumes; 3) apply these two steps to multiple
coupled spatial and temporal scales; 4) avoid grouping, segment-
ing, and tracking that are used to extract features in other
approaches; 5) reduce the encoding of natural human actions to a
relatively simple spatial-temporal concatenation of a set of
encoding units.
We used ICs as local features in space-time volumes of videos of
actions at three sizes (i.e., 13 (space)613 (space)611 (time),
25625621, and 49649631), collapsed all combinations of ICs in
the space-time volumes into a set of clusters, and assigned all patch
sequences that shared the same dominant clusters to a NAS. There
are several advantages of using the NASs obtained this way as the
basic encoding units of human actions. First, NASs capture
structural spatial-temporal information of actions at multiple scales
in a compact way. Second, NASs naturally incorporate multi-
scale, spatial-temporal features and thus are less sensitive to noises
and changes of scales. Finally, NASs provide a simple way to
encode natural actions since NASs are local structured descriptions
of the space-time volumes of natural actions. In the following
sections, we describe how to compile NASs from datasets of videos
of human actions, the statistics and the information content of
NASs, and our results of action recognition using NASs.
Compiling natural action structuresWe took five steps to compile NASs in two widely used video
datasets of human actions, the KTH dataset and the Weizmann
dataset (see Figure 2 and details in Materials and Methods).
1. Sample a large number of sequences of circular patches at
multiple spatial-temporal scales.
2. Perform ICA on the patch sequences at each spatial-temporal
scale and obtain ICs at each scale.
3. Fit Gabor functions to the ICs and collapse the ICs into a set of
clusters
4. Map the patch sequences to the IC clusters and compute the
corresponding feature vectors.
5. Partition the space of feature vectors into a set of structural
clusters and obtain the multi-scale NASs.
To generate samples from videos of human actions, we first
selected points of interest as the local maxima of the responses of
the cuboids detector [17], which is formulated as follows
R~(V � g � hev)2z(V � g � hod )2 ð1Þ
where * denotes convolution operation, V is the extracted video
volume, g is the 2D Gaussian kernel applied to the spatial
dimensions, and hev and hod are a quadrature pair of 1D Gabor
filters applied to the temporal dimension.
At the selected points of interest, we sampled sequences of
circular patches using the configuration shown in Figure 3. Each
circle is a circular patch and the configuration has 3 temporal
scales (i.e., 11, 21, and 31 video frames) and 3 spatial scales (i.e.,
the diameters of the circles are 13, 25, and 49 pixels). The spatial
and temporal scales are coupled so that the sequences at finer
scales have shorter durations. The rationale for using this
configuration is to capture dynamic structures at multiple
spatial-temporal scales to achieve robustness, which will become
clear later on. To make computing more efficient, we down
sampled the sequences at larger spatial-temporal scales. For
example, we reduced the patch sequences of 25625621 at the
middle scale to sequences of 13613611 by picking up the frames
or pixels indexed by even numbers starting from the center of the
sequences along both the spatial and temporal dimensions. Thus,
all the patch sequences had the same number of frames and the
same patch size.
We then performed ICA on the patch sequences at the three
spatial-temporal scales and fitted the Gabor functions to ICs. The
fitting algorithm worked well, accounting for 85% the variance of
Action Recognition Using Natural Action Structures
PLOS ONE | www.plosone.org 2 October 2012 | Volume 7 | Issue 10 | e46686
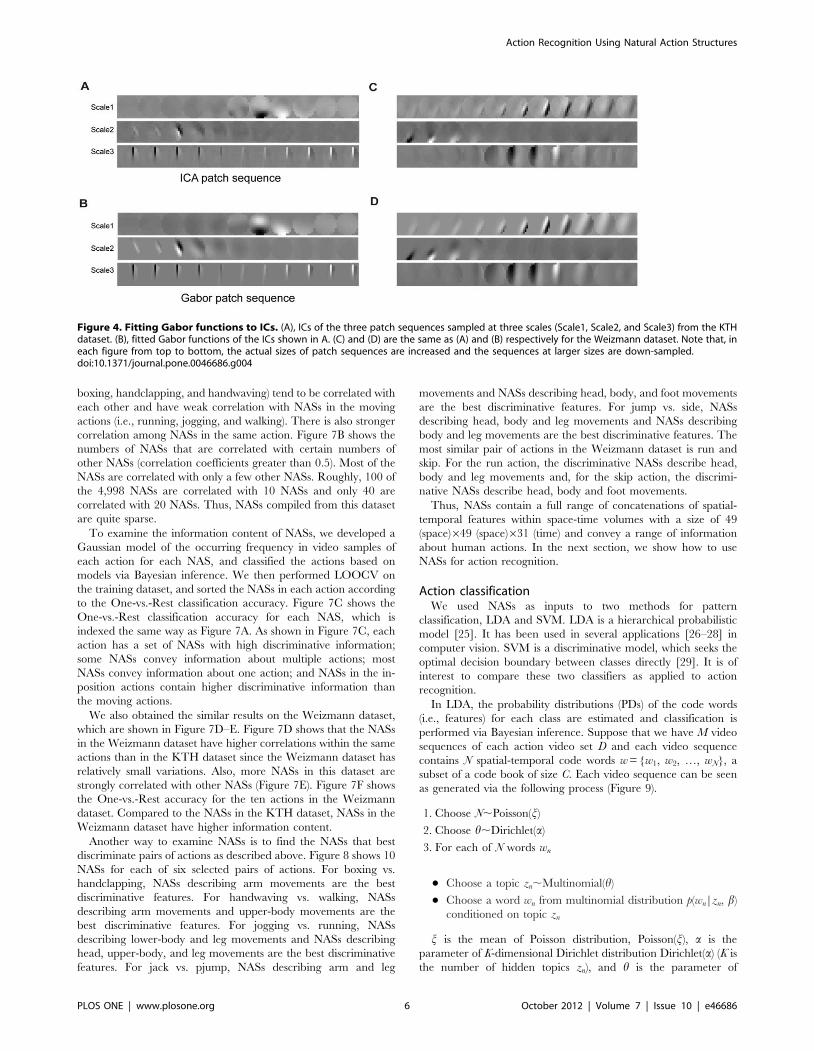
the ICs. Figure 4 shows a few examples. In these examples, as
expected, the sequences of the ICs entail appearance, disappear-
ance, rotation, translation, and phase shift of oriented bars, all of
which are well captured by the fitted Gabor functions.
To derive a compact representation of the ICs obtained above,
we performed clustering in the parameter space of the fitted Gabor
functions. For this purpose, we used 6 parameters of the Gabor
functions, i.e., 4 parameters for the scale and location of the
Gaussian envelope and 2 parameters for the orientation and the
phase of the sinusoid carrier. Since different values of the
parameters may correspond to the same Gabor function (e.g.,
adding 2p to the phase does not change Gabor function), we
converted the estimated parameters to pre-set intervals (see details
in Materials and Methods). We then performed clustering using
the K-means method with the Euclidean distance metric. Let
A = {A1, A2, …, Am} denote the i-th IC cluster containing m filters
at a spatial-temporal scale, each of which is a column vector with l
elements, where l is the number of pixels in each patch sequence.
Then the feature, ai, of a patch sequence P (which is a row vector
with l elements) projected to the i-th IC cluster is calculated as
follows
ai~
ffiffiffiffiffiffiffiffiffiffiffiffiffiffiffiffiffiffiffiffiffiffiffiffiffiffiffiffi1
m
Xm
k~1
P:Akð Þ2s
ð2Þ
Thus, for N IC clusters, there are N features which form a feature
vector at the spatial-temporal scale. Since the patch sequences
sampled from a set of actions do not uniformly pack the high-
dimensional feature space, we need to partition the feature space
into discrete blocks. To this end, at each spatial-temporal scale, we
classified the feature vectors into a set of clusters (referred to as
structural clusters) using the K-means method with the Euclidean
distance metric. We call all the patch sequences that share the
same structural clusters at the three spatial-temporal scales a NAS.
Note that, for illustration purpose only, each of the NASs shown in
the figures is the average of the patch sequences corresponding to
that NAS.
In contrast to simple features, such as ICs and cuboids
descriptors and simple spatial-temporal statistics (e.g., histogram
of optical flow in a small region), NASs are highly structured patch
sequences that are building blocks of natural actions. Roughly
speaking, as a result of the K-means clustering procedures,
instances of any NAS are patch sequences cropped from videos of
human actions that share the same structural indices described
above and the NASs for any natural human action can range from
simple to complex spatial-temporal concatenations of local
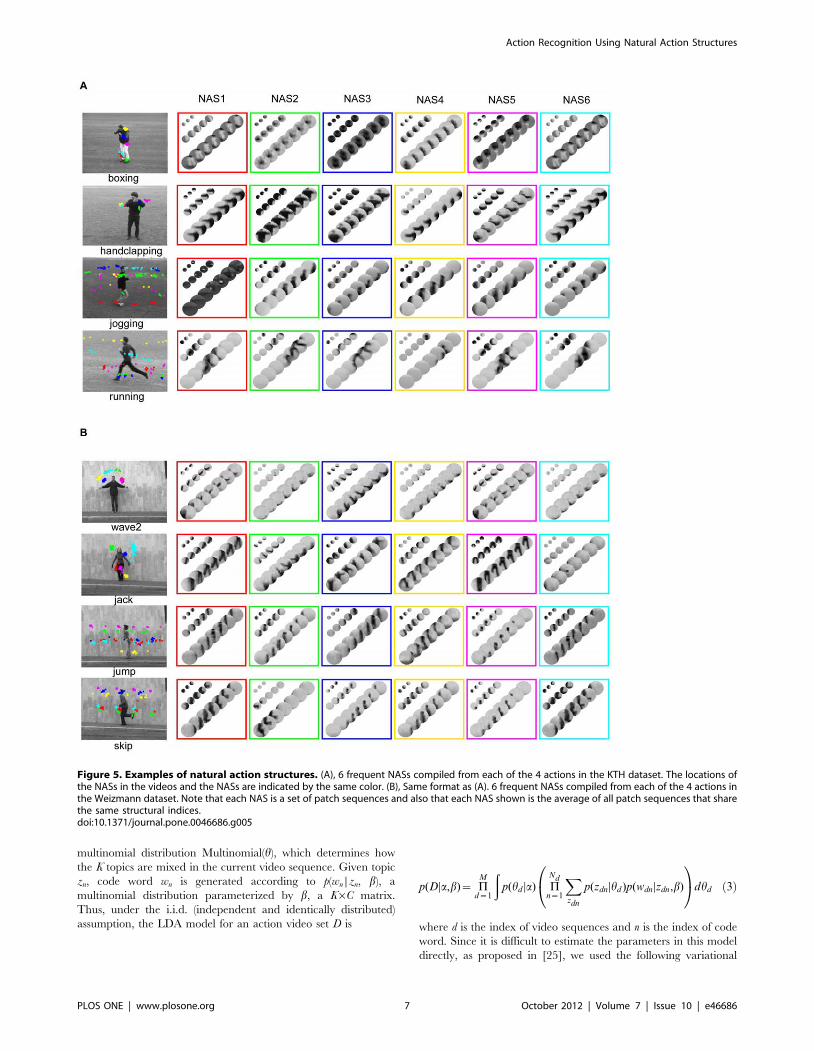
features. Figure 5A shows 6 most frequent NASs of each of the
four selected actions in the KTH dataset. These structures
represent coarse but informative descriptions of a variety of
movements of body parts. For example, in the boxing action, the
six most frequent action structures (indicated by six different
colors) describe, respectively, the movements of the right leg, the
left foot, the left arm, the left shoulder, the waist, and the right leg.
In the jogging action, the six most frequent action structures
describe, respectively, the movements of the foot, the shoulder, the
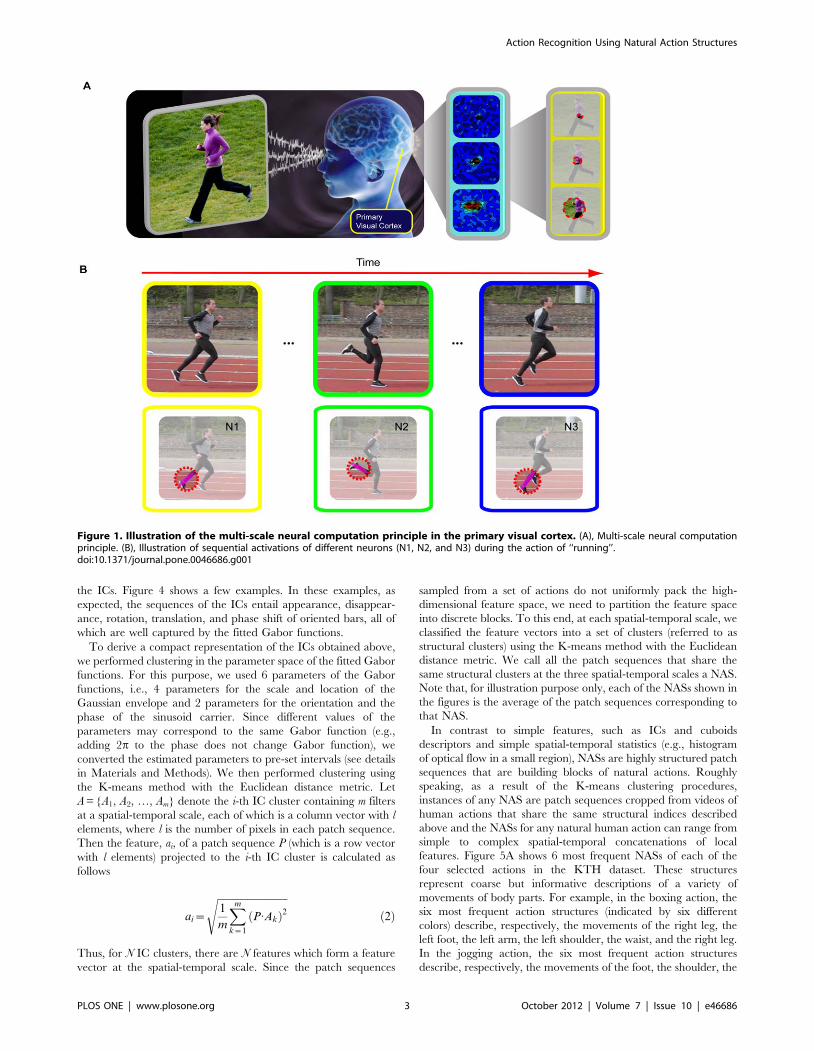
Figure 1. Illustration of the multi-scale neural computation principle in the primary visual cortex. (A), Multi-scale neural computationprinciple. (B), Illustration of sequential activations of different neurons (N1, N2, and N3) during the action of ‘‘running’’.doi:10.1371/journal.pone.0046686.g001
Action Recognition Using Natural Action Structures
PLOS ONE | www.plosone.org 3 October 2012 | Volume 7 | Issue 10 | e46686
head, the shoulder, the body, and the head. Figure 5B shows 6
most frequent NASs for each of the four selected actions in the
Weizmann dataset. As with the KTH dataset, these structures are
informative descriptions of various parts of the body movements.
For example, in the wave2 action, the six most frequent action
structures describe, respectively, the movements of the left arm,
the right hand, the right arm, the right arm, the left arm, and the
right hand. In the jump action, the six most frequent action
structures describe, respectively, the movements of the waist, the
shoulder, the waist, the foot, the head, and the waist.
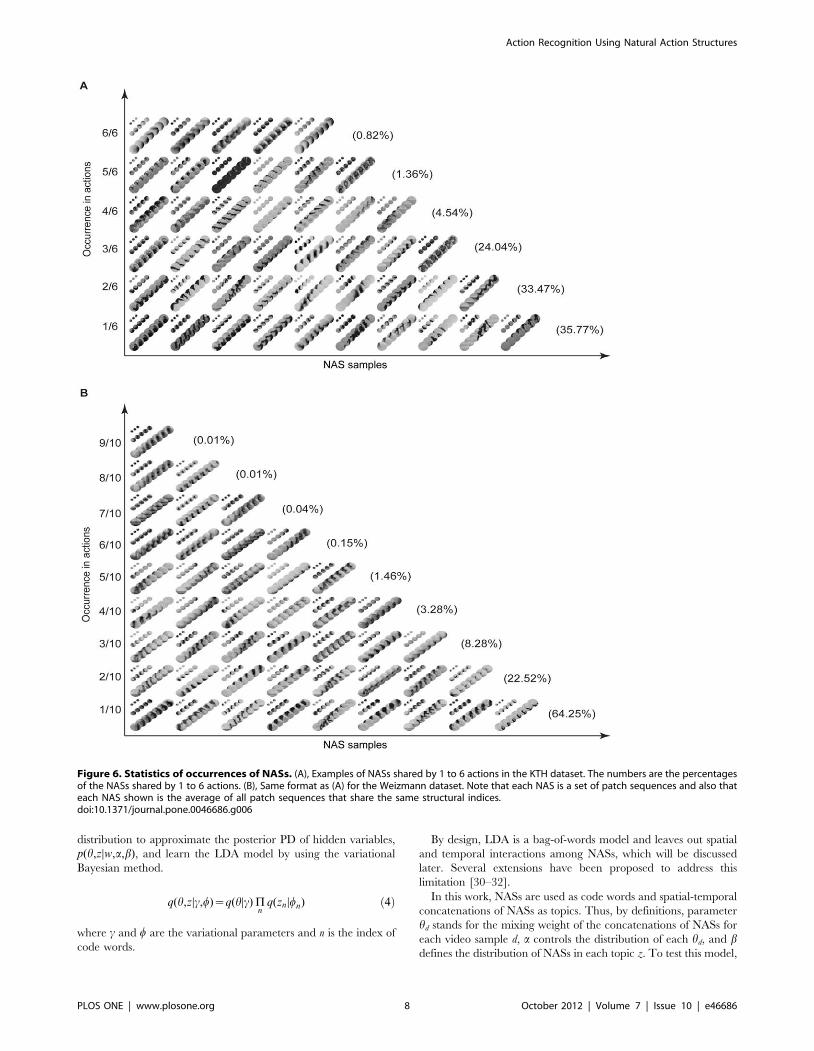
Statistics of natural action structuresWe obtained 193,600 NASs in the KTH dataset and 11,540
NASs in the Weizmann dataset. As shown in Figure 6, NASs
shared by more actions tend to be blurry while NASs occurring in
only one or two actions are usually coarse local movements in the
actions. To use NASs to categorize human actions, we need a
procedure to select informative NASs. We selected NASs for
action classification in two steps. In the first step, we selected NASs
that occurred more than Mc times in the training set to exclude
rarely occurring NASs. In the second step, we used a One-vs.-One
strategy to select discriminative NASs based on the histograms of
the NASs. For each pair of actions, we selected the first Nc most
discriminative NASs of each action by comparing the histograms
of the NASs in the two actions. Take boxing vs. handclapping as
an example. For the boxing action, we selected the Nc NASs that
had the smallest occurring frequency in the handclapping action
and the biggest difference in occurring frequency in the two
actions. We defined these Nc NASs as the most discriminative
NASs for boxing in boxing vs. handclapping. We then applied the
same procedure to the handclapping action. To set the thresholds,
Mc and Nc, we used a procedure called Leave-One-Out Cross-
Validation (LOOCV) (see definition in Material and Methods). As
a result, we selected 4,998 NASs in the KTH dataset and 6,392
NASs in the Weizmann dataset.
Next, we examined the statistics of the NASs, which include: 1)
the occurring frequencies of NASs, 2) the correlation between
NASs, and 3) the information content of NASs, defined as One-
vs.-Rest classification performance for each action. Figure 6 shows
the statistics of occurrence of NASs in the two datasets. Simpler
NASs (e.g., the NASs in the first row (6/6) of Figure 6A) occur
more frequently and are shared by more actions, and most NASs
are shared by only a few actions. The percentages of the NASs that
are shared by 1 to 6 actions in the KTH dataset are 35.77%,
33.47%, 20.04%, 4.54%, 1.36%, and 0.82% respectively
(Figure 6A). The percentages of the NASs that are shared by 1
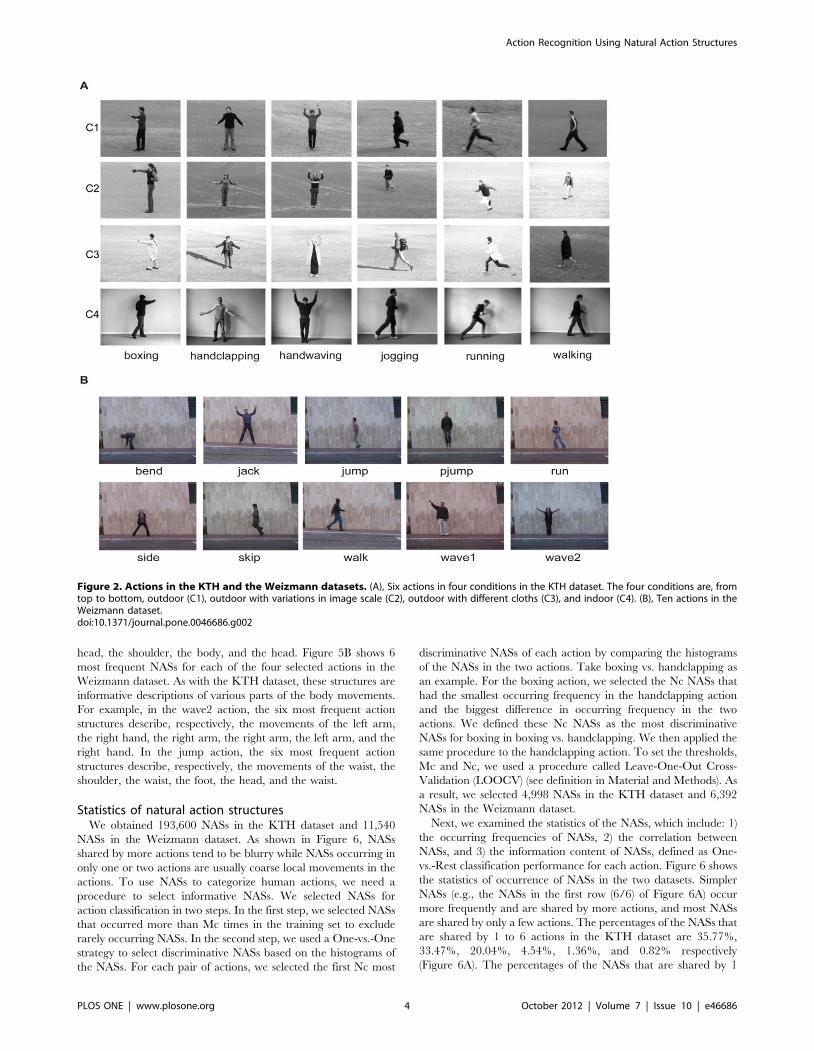
Figure 2. Actions in the KTH and the Weizmann datasets. (A), Six actions in four conditions in the KTH dataset. The four conditions are, fromtop to bottom, outdoor (C1), outdoor with variations in image scale (C2), outdoor with different cloths (C3), and indoor (C4). (B), Ten actions in theWeizmann dataset.doi:10.1371/journal.pone.0046686.g002
Action Recognition Using Natural Action Structures
PLOS ONE | www.plosone.org 4 October 2012 | Volume 7 | Issue 10 | e46686
to 9 actions in the Weizmann dataset are 64.25%, 22.52%, 8.28%,
3.28%, 1.46%, 0.15%, 0.04%, 0.01%, and 0.01% respectively
(Figure 6B). Thus, in both datasets, only a few percent of the NASs
are shared by more than three actions. NASs shared by most of the
actions contain few structures and are blurry. For example, the
third NAS in the first row (6/6) of Figure 6A is shared by all the
actions, but conveys little information about any of the actions. On
the other hand, NASs shared by only one or two actions contain
more structures and more action-specific information. For
example, in Figure 6A, the fourth NAS in the fifth row (2/6)
occurs in handclapping and jogging classes and describes arm
movements and leg movements in the two actions, respectively. In
Figure 6B, the NAS in the first row (9/10) is shared by all the
actions except run. We can see a blurry body shape in it. The
fourth NAS in the seventh row (3/10) is shared by jump, skip, and
walk and describes body movements shared by the three actions.
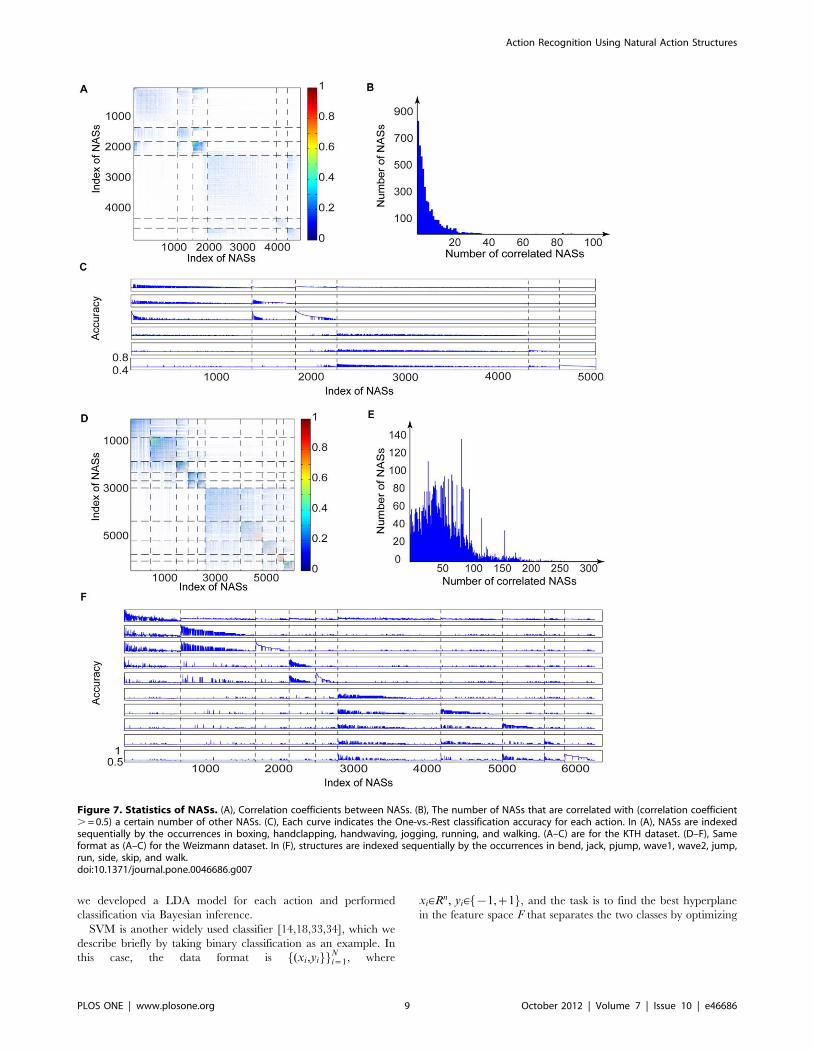
Figure 7A shows the correlation matrix of the NASs in the KTH
dataset. The dashed lines indicate the ranges of the indices of the
NASs complied from each action. The indices are so arranged that
no two or more NASs share the same index. There are two clusters
in the matrix in the upper left corner and the lower right corner.
These clusters indicate that NASs in the in-position actions (i.e.,
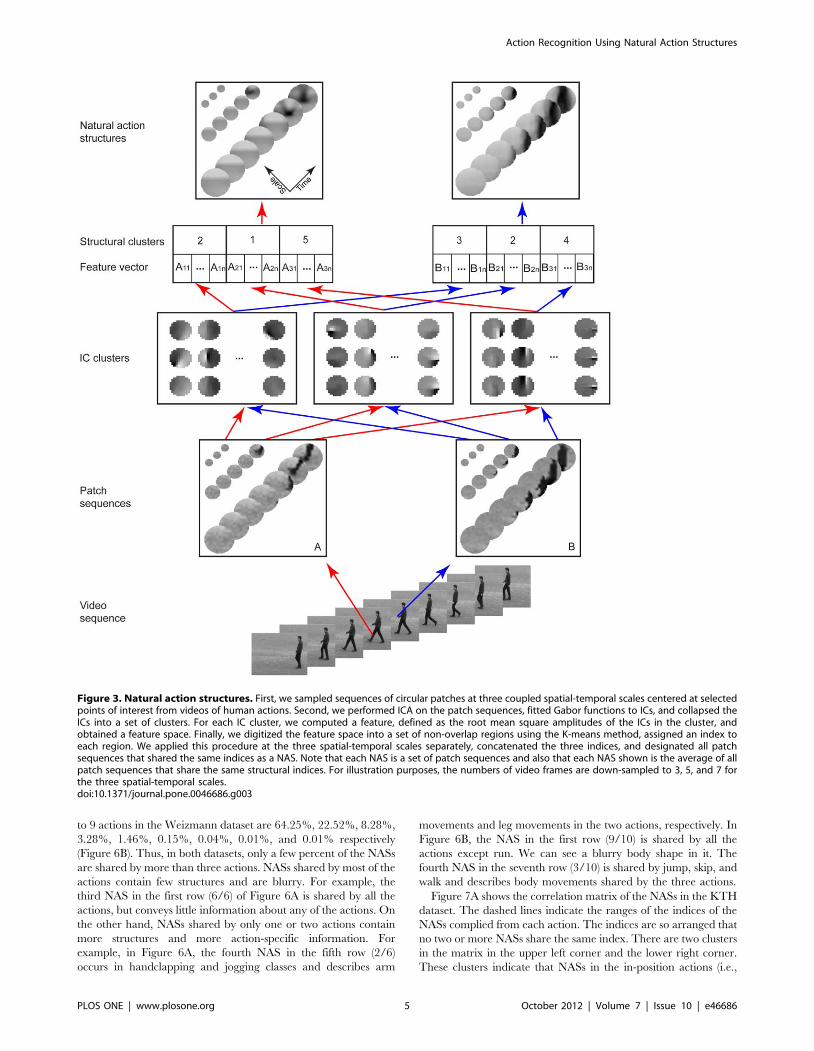
Figure 3. Natural action structures. First, we sampled sequences of circular patches at three coupled spatial-temporal scales centered at selectedpoints of interest from videos of human actions. Second, we performed ICA on the patch sequences, fitted Gabor functions to ICs, and collapsed theICs into a set of clusters. For each IC cluster, we computed a feature, defined as the root mean square amplitudes of the ICs in the cluster, andobtained a feature space. Finally, we digitized the feature space into a set of non-overlap regions using the K-means method, assigned an index toeach region. We applied this procedure at the three spatial-temporal scales separately, concatenated the three indices, and designated all patchsequences that shared the same indices as a NAS. Note that each NAS is a set of patch sequences and also that each NAS shown is the average of allpatch sequences that share the same structural indices. For illustration purposes, the numbers of video frames are down-sampled to 3, 5, and 7 forthe three spatial-temporal scales.doi:10.1371/journal.pone.0046686.g003
Action Recognition Using Natural Action Structures
PLOS ONE | www.plosone.org 5 October 2012 | Volume 7 | Issue 10 | e46686
boxing, handclapping, and handwaving) tend to be correlated with
each other and have weak correlation with NASs in the moving
actions (i.e., running, jogging, and walking). There is also stronger
correlation among NASs in the same action. Figure 7B shows the
numbers of NASs that are correlated with certain numbers of
other NASs (correlation coefficients greater than 0.5). Most of the
NASs are correlated with only a few other NASs. Roughly, 100 of
the 4,998 NASs are correlated with 10 NASs and only 40 are
correlated with 20 NASs. Thus, NASs compiled from this dataset
are quite sparse.
To examine the information content of NASs, we developed a
Gaussian model of the occurring frequency in video samples of
each action for each NAS, and classified the actions based on
models via Bayesian inference. We then performed LOOCV on
the training dataset, and sorted the NASs in each action according
to the One-vs.-Rest classification accuracy. Figure 7C shows the
One-vs.-Rest classification accuracy for each NAS, which is
indexed the same way as Figure 7A. As shown in Figure 7C, each
action has a set of NASs with high discriminative information;
some NASs convey information about multiple actions; most
NASs convey information about one action; and NASs in the in-
position actions contain higher discriminative information than
the moving actions.
We also obtained the similar results on the Weizmann dataset,
which are shown in Figure 7D–E. Figure 7D shows that the NASs
in the Weizmann dataset have higher correlations within the same
actions than in the KTH dataset since the Weizmann dataset has
relatively small variations. Also, more NASs in this dataset are
strongly correlated with other NASs (Figure 7E). Figure 7F shows
the One-vs.-Rest accuracy for the ten actions in the Weizmann
dataset. Compared to the NASs in the KTH dataset, NASs in the
Weizmann dataset have higher information content.
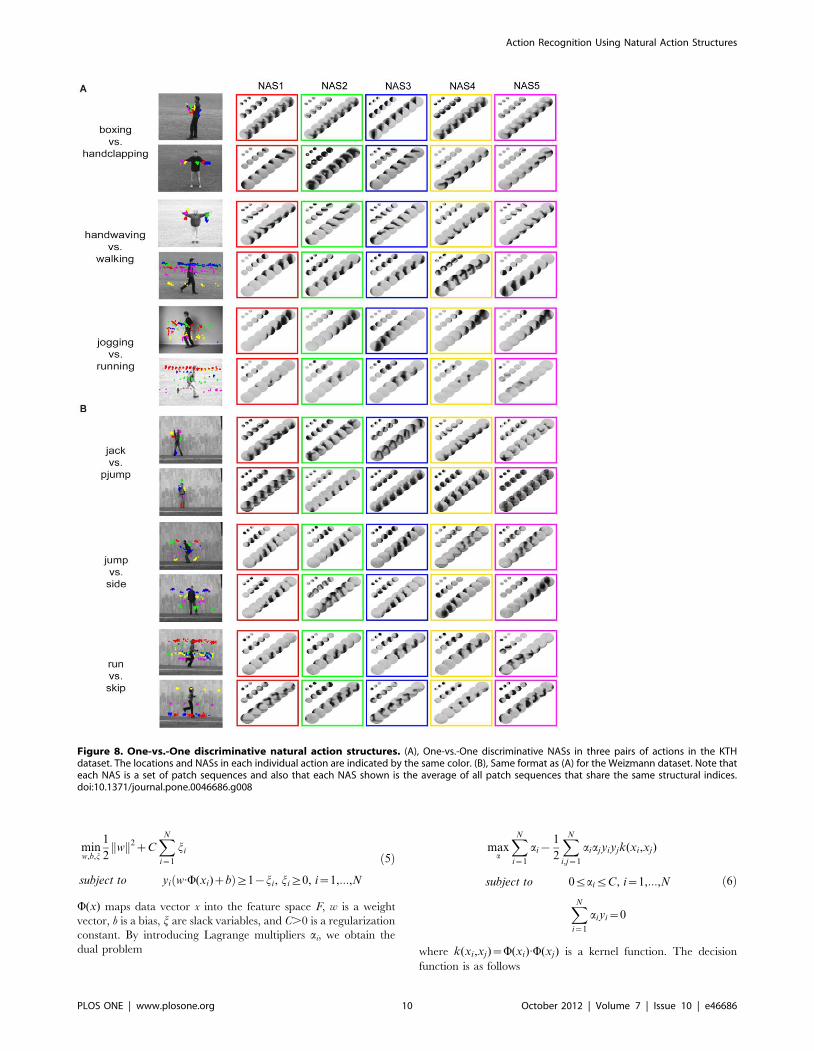
Another way to examine NASs is to find the NASs that best
discriminate pairs of actions as described above. Figure 8 shows 10
NASs for each of six selected pairs of actions. For boxing vs.
handclapping, NASs describing arm movements are the best
discriminative features. For handwaving vs. walking, NASs
describing arm movements and upper-body movements are the
best discriminative features. For jogging vs. running, NASs
describing lower-body and leg movements and NASs describing
head, upper-body, and leg movements are the best discriminative
features. For jack vs. pjump, NASs describing arm and leg
movements and NASs describing head, body, and foot movements
are the best discriminative features. For jump vs. side, NASs
describing head, body and leg movements and NASs describing
body and leg movements are the best discriminative features. The
most similar pair of actions in the Weizmann dataset is run and
skip. For the run action, the discriminative NASs describe head,
body and leg movements and, for the skip action, the discrimi-
native NASs describe head, body and foot movements.
Thus, NASs contain a full range of concatenations of spatial-
temporal features within space-time volumes with a size of 49
(space)649 (space)631 (time) and convey a range of information
about human actions. In the next section, we show how to use
NASs for action recognition.
Action classificationWe used NASs as inputs to two methods for pattern
classification, LDA and SVM. LDA is a hierarchical probabilistic
model [25]. It has been used in several applications [26–28] in
computer vision. SVM is a discriminative model, which seeks the
optimal decision boundary between classes directly [29]. It is of
interest to compare these two classifiers as applied to action
recognition.
In LDA, the probability distributions (PDs) of the code words
(i.e., features) for each class are estimated and classification is
performed via Bayesian inference. Suppose that we have M video
sequences of each action video set D and each video sequence
contains N spatial-temporal code words w = {w1, w2, …, wN}, a
subset of a code book of size C. Each video sequence can be seen
as generated via the following process (Figure 9).
1. Choose N,Poisson(j)
2. Choose h,Dirichlet(a)
3. For each of N words wn
N Choose a topic zn,Multinomial(h)
N Choose a word wn from multinomial distribution p(wn|zn, b)
conditioned on topic zn
j is the mean of Poisson distribution, Poisson(j), a is the
parameter of K-dimensional Dirichlet distribution Dirichlet(a) (K is
the number of hidden topics zn), and h is the parameter of
Figure 4. Fitting Gabor functions to ICs. (A), ICs of the three patch sequences sampled at three scales (Scale1, Scale2, and Scale3) from the KTHdataset. (B), fitted Gabor functions of the ICs shown in A. (C) and (D) are the same as (A) and (B) respectively for the Weizmann dataset. Note that, ineach figure from top to bottom, the actual sizes of patch sequences are increased and the sequences at larger sizes are down-sampled.doi:10.1371/journal.pone.0046686.g004
Action Recognition Using Natural Action Structures
PLOS ONE | www.plosone.org 6 October 2012 | Volume 7 | Issue 10 | e46686
multinomial distribution Multinomial(h), which determines how
the K topics are mixed in the current video sequence. Given topic
zn, code word wn is generated according to p(wn|zn, b), a
multinomial distribution parameterized by b, a K6C matrix.
Thus, under the i.i.d. (independent and identically distributed)
assumption, the LDA model for an action video set D is
p(DDa,b)~ PM
d~1
ðp(hd Da) P
Nd
n~1
Xzdn
p(zdnDhd )p(wdnDzdn,b)
0@
1Adhd ð3Þ
where d is the index of video sequences and n is the index of code
word. Since it is difficult to estimate the parameters in this model
directly, as proposed in [25], we used the following variational
Figure 5. Examples of natural action structures. (A), 6 frequent NASs compiled from each of the 4 actions in the KTH dataset. The locations ofthe NASs in the videos and the NASs are indicated by the same color. (B), Same format as (A). 6 frequent NASs compiled from each of the 4 actions inthe Weizmann dataset. Note that each NAS is a set of patch sequences and also that each NAS shown is the average of all patch sequences that sharethe same structural indices.doi:10.1371/journal.pone.0046686.g005
Action Recognition Using Natural Action Structures
PLOS ONE | www.plosone.org 7 October 2012 | Volume 7 | Issue 10 | e46686
distribution to approximate the posterior PD of hidden variables,
p(h,zDw,a,b), and learn the LDA model by using the variational
Bayesian method.
q(h,zDc,w)~q(hDc)Pn
q(znDwn) ð4Þ
where c and w are the variational parameters and n is the index of
code words.
By design, LDA is a bag-of-words model and leaves out spatial
and temporal interactions among NASs, which will be discussed
later. Several extensions have been proposed to address this
limitation [30–32].
In this work, NASs are used as code words and spatial-temporal
concatenations of NASs as topics. Thus, by definitions, parameter
hd stands for the mixing weight of the concatenations of NASs for
each video sample d, a controls the distribution of each hd, and bdefines the distribution of NASs in each topic z. To test this model,
Figure 6. Statistics of occurrences of NASs. (A), Examples of NASs shared by 1 to 6 actions in the KTH dataset. The numbers are the percentagesof the NASs shared by 1 to 6 actions. (B), Same format as (A) for the Weizmann dataset. Note that each NAS is a set of patch sequences and also thateach NAS shown is the average of all patch sequences that share the same structural indices.doi:10.1371/journal.pone.0046686.g006
Action Recognition Using Natural Action Structures
PLOS ONE | www.plosone.org 8 October 2012 | Volume 7 | Issue 10 | e46686
we developed a LDA model for each action and performed
classification via Bayesian inference.
SVM is another widely used classifier [14,18,33,34], which we
describe briefly by taking binary classification as an example. In
this case, the data format is (xi,yigf gNi~1, where
xi[Rn, yi[f{1,z1g, and the task is to find the best hyperplane
in the feature space F that separates the two classes by optimizing
Figure 7. Statistics of NASs. (A), Correlation coefficients between NASs. (B), The number of NASs that are correlated with (correlation coefficient. = 0.5) a certain number of other NASs. (C), Each curve indicates the One-vs.-Rest classification accuracy for each action. In (A), NASs are indexedsequentially by the occurrences in boxing, handclapping, handwaving, jogging, running, and walking. (A–C) are for the KTH dataset. (D–F), Sameformat as (A–C) for the Weizmann dataset. In (F), structures are indexed sequentially by the occurrences in bend, jack, pjump, wave1, wave2, jump,run, side, skip, and walk.doi:10.1371/journal.pone.0046686.g007
Action Recognition Using Natural Action Structures
PLOS ONE | www.plosone.org 9 October 2012 | Volume 7 | Issue 10 | e46686
minw,b,j
1
2wk k2
zCXN
i~1
ji
subject to yi w:W(xi)zbð Þ§1{ji, ji§0, i~1,:::,N
ð5Þ
W(x) maps data vector x into the feature space F, w is a weight
vector, b is a bias, j are slack variables, and C.0 is a regularization
constant. By introducing Lagrange multipliers ai, we obtain the
dual problem
maxa
XN
i~1
ai{1
2
XN
i,j~1
aiajyiyjk(xi,xj)
subject to 0ƒaiƒC, i~1,:::,N
XN
i~1
aiyi~0
ð6Þ
where k(xi,xj)~W(xi):W(xj) is a kernel function. The decision
function is as follows
Figure 8. One-vs.-One discriminative natural action structures. (A), One-vs.-One discriminative NASs in three pairs of actions in the KTHdataset. The locations and NASs in each individual action are indicated by the same color. (B), Same format as (A) for the Weizmann dataset. Note thateach NAS is a set of patch sequences and also that each NAS shown is the average of all patch sequences that share the same structural indices.doi:10.1371/journal.pone.0046686.g008
Action Recognition Using Natural Action Structures
PLOS ONE | www.plosone.org 10 October 2012 | Volume 7 | Issue 10 | e46686
y~signXMl~1
alylk(x,xl)zb
!ð7Þ
where M is the number of non-zero a and l is the index of non-
zero a.
In this work, we used 1-x2 kernel [35,36].
k(x1,x2)~2Xn
i~1
x1i:x2i
x1izx2i
ð8Þ
where x1i is the i-th element of x1. To use this formulation for
multi-class action recognition, we used the One-vs.-Rest strategy
and LIBSVM implementation of SVM [37,38]. To incorporate
spatial information into the SVM classifier, inspired by [18], we
partitioned spatial and temporal dimensions of the video
sequences into n-m-k grids (i.e., n equal grids in vertical
dimension, m equal grids in horizontal dimension, and k equal
grids in temporal dimension), concatenated the histograms of
NASs in the grids into a big feature vector, and used the pooled
histograms as inputs to the SVM model.
We compared the performance of the two classifiers with NASs
as inputs on the KTH and the Weizmann datasets to the
performance of two baseline methods (Table 1). In the baseline
methods, we used the cuboids descriptors as inputs to the LDA
model and the SVM classifier described above. For the LDA
classifier with NASs as inputs, the recognition rate is 89.5% on the
KTH dataset and 94.4% on the Weizmann dataset. For the SVM
classifier with NASs as inputs, the recognition rate is 92.7% on the
KTH dataset and 96.7% on the Weizmann dataset. For both
classifiers, using NASs as inputs improves recognition perfor-
mance. The error reduction rate relative to the performance of the
cuboids model (i.e., the ratio of improvement to the error in the
cuboids model) is up to 37% on the KTH dataset and up to 41%
on the Weizmann dataset.
These results also show that the SVM model achieves better
performance than LDA consistently. There are two reasons. First,
SVM seeks a decision surface with the maximal margin of
separation, which is usually beneficial for classification with a large
number of features and relatively small number of training
samples. Second, we concatenated the histograms of NASs in
multiple partitions of the video sequences in our implantation of
SVM, but we did not model any spatial-temporal interactions
among NASs in LDA.
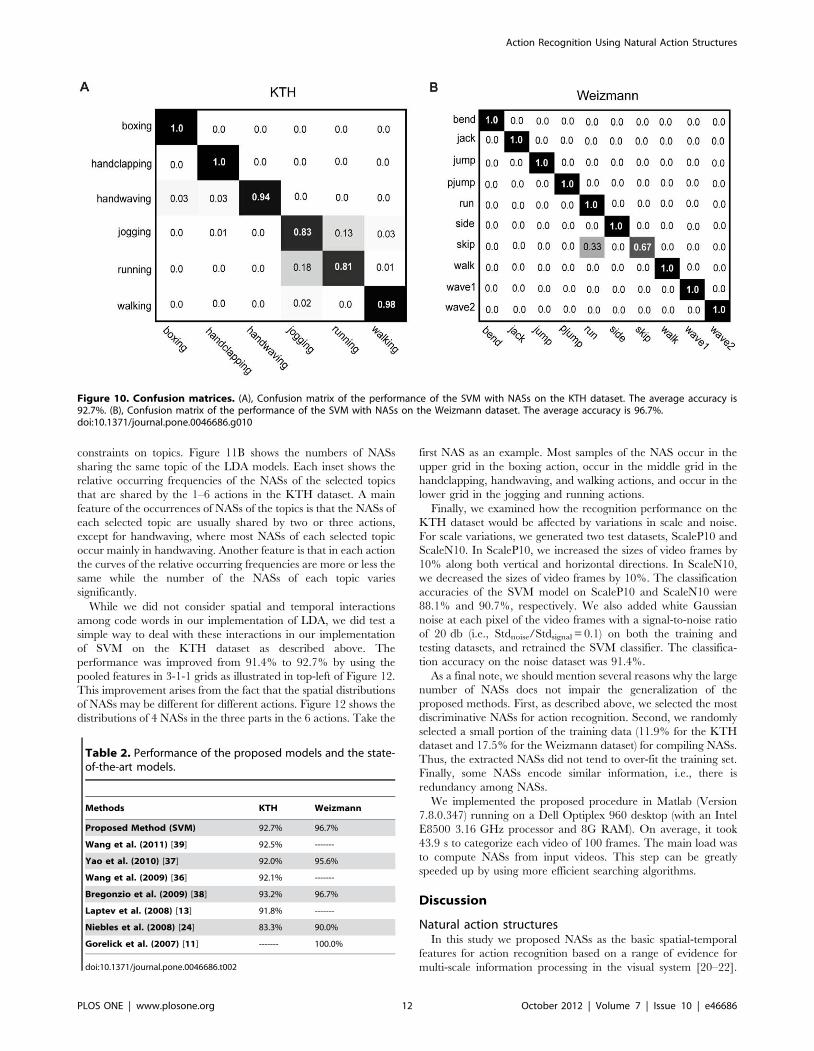
Figure 10 shows the confusion matrices of the performance of
the SVM model on the KTH dataset and the Weizmann dataset.
For the KTH dataset, the in-position actions and the moving
actions can be well classified, while ,16% of the incidences of
jogging and running were misclassified. On the Weizmann
dataset, our model only misclassifies 33% of the incidences of
skipping as running. These two actions are indeed very similar.
We compared our model with the best current methods
(Table 2). For the KTH dataset, we used the training-testing
separation coming with the dataset, the same scheme used in
[18,39]. In the other models cited in the table [27,40–42],
LOOCV was used to obtain the performance (in [42], the authors
used 20-fold cross validation based on randomly selected training
and testing datasets), which is usually better than performance
obtained without cross-validation. For the Weizmann dataset,
because of the limited samples, all the results were obtained using
LOOCV. It should be also noted that the 100% performance on
the Weizmann dataset was achieved by using global space-time
shape features segmented from background. Based on these
comparisons, we concluded that the performance of the SVM
classifier with NASs as features on both datasets of human actions
is among the best current models.
We also examined the topics of the LDA models of the actions
in the KTH dataset. In LDA, topics are on a higher hierarchy
than code words, which can be seen as being sampled from PDs
conditioned on topics (Figure 9). Since we compiled NASs and
used them as code words, it is of interest to examine the topics in
these models. We developed a LDA model for each action and
signed NASs to a topic z according to the following equation
p(zDw,b,h)~p(wDz,b)p(zDh)P
z
p(wDz,b)p(zDh)ð9Þ
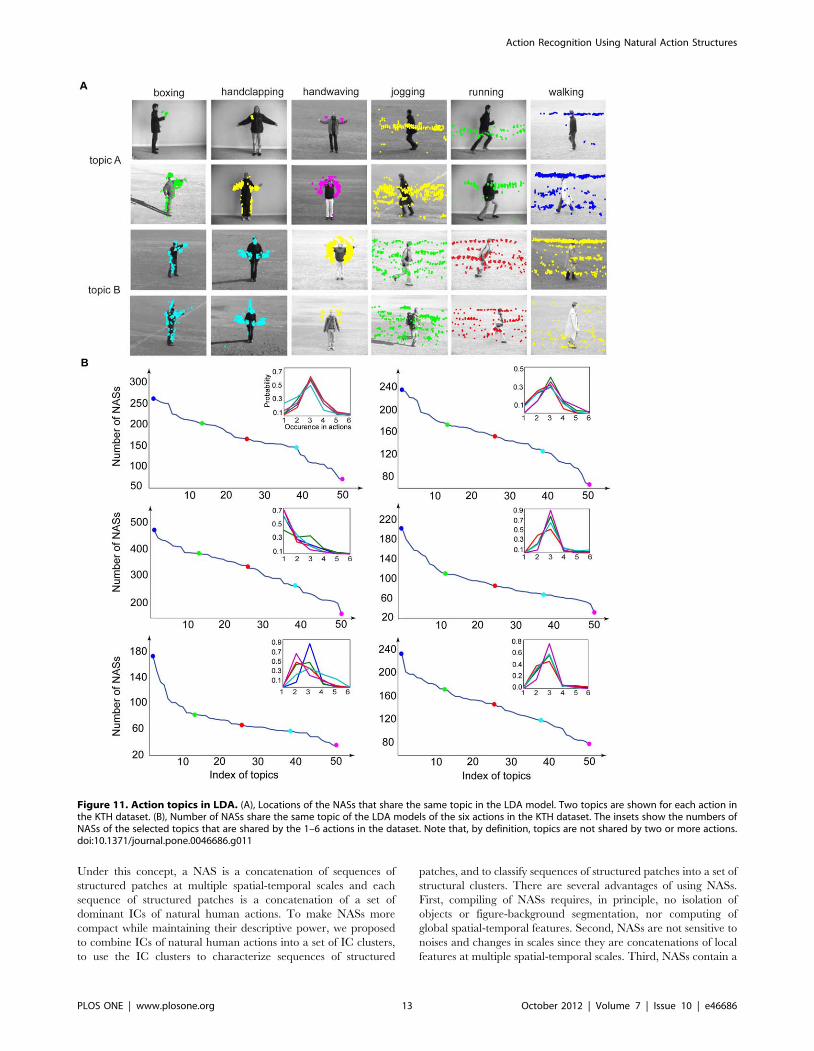
We obtained 50 topics for each action in the KTH dataset.
Figure 11A shows two topics A and B (indicated by different
colors) in 4 examples of each of the 6 actions in the KTH dataset.
Although code words (i.e., NASs) usually describe specific
movements of body parts (Figure 5), topics are much less specific
in terms of body parts and/or movements. For example, in the
boxing action, topic A can be hand movement (top panel) or
movements of head, arms, and legs (middle panel). In another
example, topic B covers almost all the body movements in the
boxing action. In the running action, topic A can be leg
movements (top panel) or upper-body movements (middle panel);
topic B covers almost all the body movements in the action. Thus,
there are no fixed spatial positions of the topics in the LDA model.
The underlying reason is that spatial and temporal relationships
among code words are ignored in LDA and that there are no other
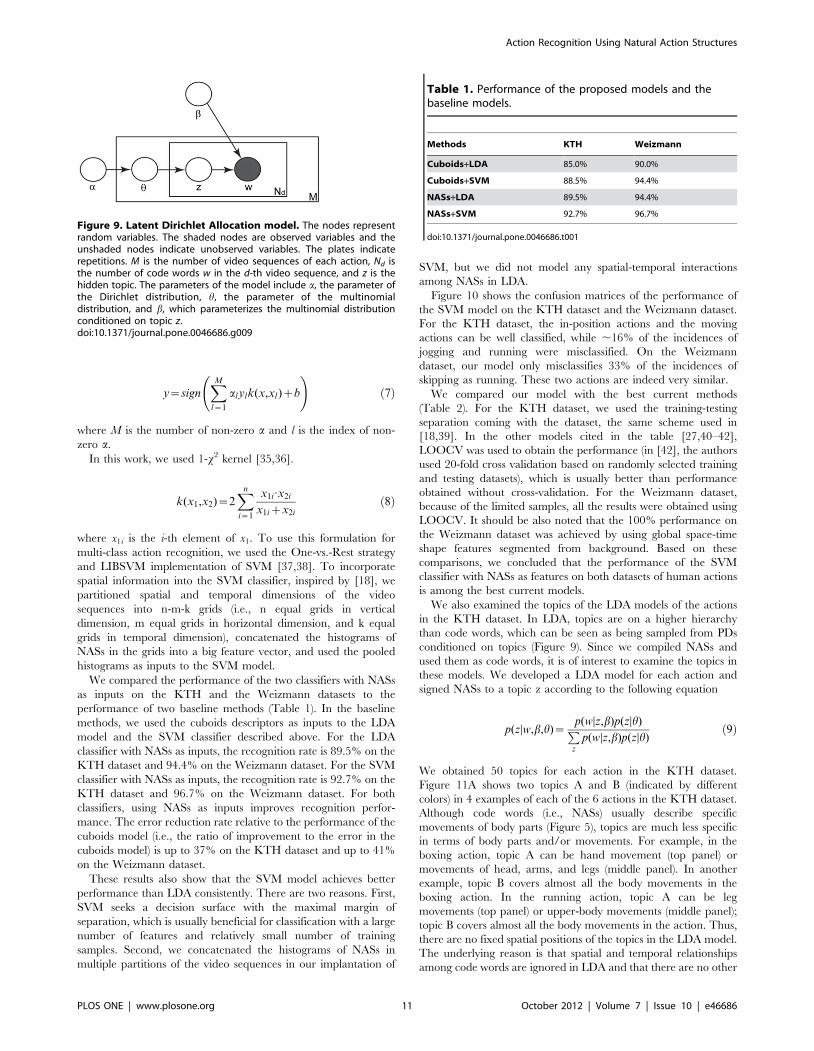
Figure 9. Latent Dirichlet Allocation model. The nodes representrandom variables. The shaded nodes are observed variables and theunshaded nodes indicate unobserved variables. The plates indicaterepetitions. M is the number of video sequences of each action, Nd isthe number of code words w in the d-th video sequence, and z is thehidden topic. The parameters of the model include a, the parameter ofthe Dirichlet distribution, h, the parameter of the multinomialdistribution, and b, which parameterizes the multinomial distributionconditioned on topic z.doi:10.1371/journal.pone.0046686.g009
Table 1. Performance of the proposed models and thebaseline models.
Methods KTH Weizmann
Cuboids+LDA 85.0% 90.0%
Cuboids+SVM 88.5% 94.4%
NASs+LDA 89.5% 94.4%
NASs+SVM 92.7% 96.7%
doi:10.1371/journal.pone.0046686.t001
Action Recognition Using Natural Action Structures
PLOS ONE | www.plosone.org 11 October 2012 | Volume 7 | Issue 10 | e46686
constraints on topics. Figure 11B shows the numbers of NASs
sharing the same topic of the LDA models. Each inset shows the
relative occurring frequencies of the NASs of the selected topics
that are shared by the 1–6 actions in the KTH dataset. A main
feature of the occurrences of NASs of the topics is that the NASs of
each selected topic are usually shared by two or three actions,
except for handwaving, where most NASs of each selected topic
occur mainly in handwaving. Another feature is that in each action
the curves of the relative occurring frequencies are more or less the
same while the number of the NASs of each topic varies
significantly.
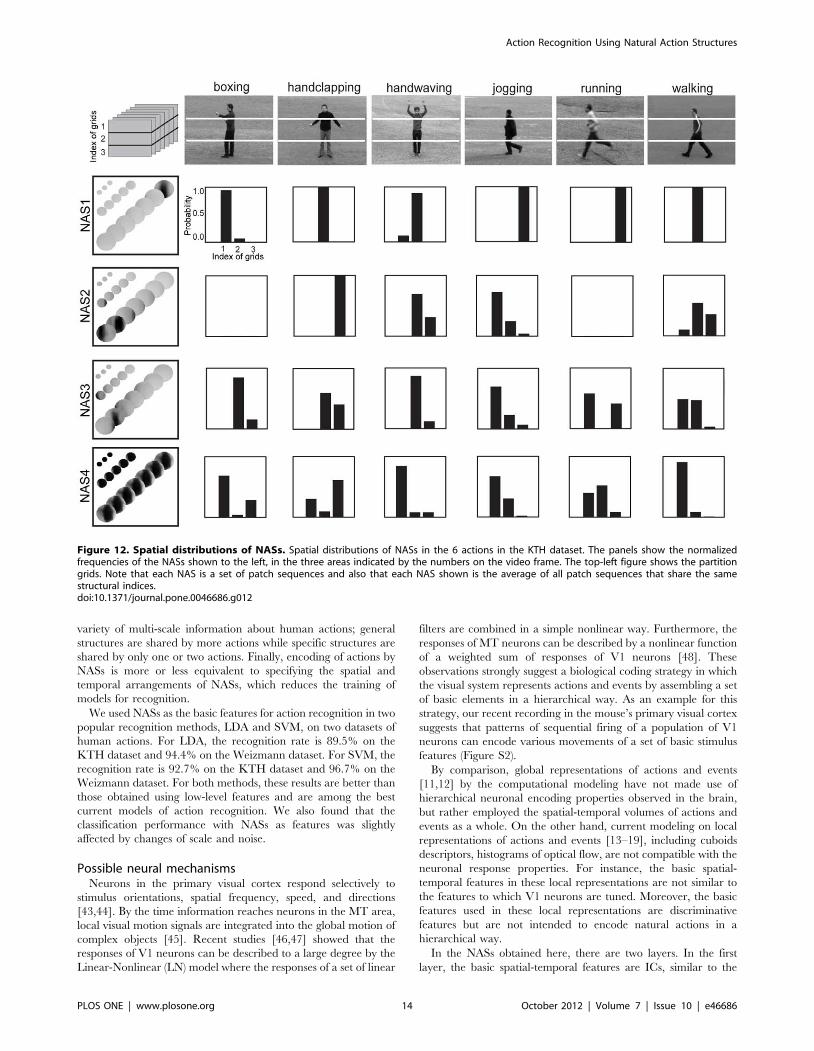
While we did not consider spatial and temporal interactions
among code words in our implementation of LDA, we did test a
simple way to deal with these interactions in our implementation
of SVM on the KTH dataset as described above. The
performance was improved from 91.4% to 92.7% by using the
pooled features in 3-1-1 grids as illustrated in top-left of Figure 12.
This improvement arises from the fact that the spatial distributions
of NASs may be different for different actions. Figure 12 shows the
distributions of 4 NASs in the three parts in the 6 actions. Take the
first NAS as an example. Most samples of the NAS occur in the
upper grid in the boxing action, occur in the middle grid in the
handclapping, handwaving, and walking actions, and occur in the
lower grid in the jogging and running actions.
Finally, we examined how the recognition performance on the
KTH dataset would be affected by variations in scale and noise.
For scale variations, we generated two test datasets, ScaleP10 and
ScaleN10. In ScaleP10, we increased the sizes of video frames by
10% along both vertical and horizontal directions. In ScaleN10,
we decreased the sizes of video frames by 10%. The classification
accuracies of the SVM model on ScaleP10 and ScaleN10 were
88.1% and 90.7%, respectively. We also added white Gaussian
noise at each pixel of the video frames with a signal-to-noise ratio
of 20 db (i.e., Stdnoise/Stdsignal = 0.1) on both the training and
testing datasets, and retrained the SVM classifier. The classifica-
tion accuracy on the noise dataset was 91.4%.
As a final note, we should mention several reasons why the large
number of NASs does not impair the generalization of the
proposed methods. First, as described above, we selected the most
discriminative NASs for action recognition. Second, we randomly
selected a small portion of the training data (11.9% for the KTH
dataset and 17.5% for the Weizmann dataset) for compiling NASs.
Thus, the extracted NASs did not tend to over-fit the training set.
Finally, some NASs encode similar information, i.e., there is
redundancy among NASs.
We implemented the proposed procedure in Matlab (Version
7.8.0.347) running on a Dell Optiplex 960 desktop (with an Intel
E8500 3.16 GHz processor and 8G RAM). On average, it took
43.9 s to categorize each video of 100 frames. The main load was
to compute NASs from input videos. This step can be greatly
speeded up by using more efficient searching algorithms.
Discussion
Natural action structuresIn this study we proposed NASs as the basic spatial-temporal
features for action recognition based on a range of evidence for
multi-scale information processing in the visual system [20–22].
Figure 10. Confusion matrices. (A), Confusion matrix of the performance of the SVM with NASs on the KTH dataset. The average accuracy is92.7%. (B), Confusion matrix of the performance of the SVM with NASs on the Weizmann dataset. The average accuracy is 96.7%.doi:10.1371/journal.pone.0046686.g010
Table 2. Performance of the proposed models and the state-of-the-art models.
Methods KTH Weizmann
Proposed Method (SVM) 92.7% 96.7%
Wang et al. (2011) [39] 92.5% -------
Yao et al. (2010) [37] 92.0% 95.6%
Wang et al. (2009) [36] 92.1% -------
Bregonzio et al. (2009) [38] 93.2% 96.7%
Laptev et al. (2008) [13] 91.8% -------
Niebles et al. (2008) [24] 83.3% 90.0%
Gorelick et al. (2007) [11] ------- 100.0%
doi:10.1371/journal.pone.0046686.t002
Action Recognition Using Natural Action Structures
PLOS ONE | www.plosone.org 12 October 2012 | Volume 7 | Issue 10 | e46686
Under this concept, a NAS is a concatenation of sequences of
structured patches at multiple spatial-temporal scales and each
sequence of structured patches is a concatenation of a set of
dominant ICs of natural human actions. To make NASs more
compact while maintaining their descriptive power, we proposed
to combine ICs of natural human actions into a set of IC clusters,
to use the IC clusters to characterize sequences of structured
patches, and to classify sequences of structured patches into a set of
structural clusters. There are several advantages of using NASs.
First, compiling of NASs requires, in principle, no isolation of
objects or figure-background segmentation, nor computing of
global spatial-temporal features. Second, NASs are not sensitive to
noises and changes in scales since they are concatenations of local
features at multiple spatial-temporal scales. Third, NASs contain a
Figure 11. Action topics in LDA. (A), Locations of the NASs that share the same topic in the LDA model. Two topics are shown for each action inthe KTH dataset. (B), Number of NASs share the same topic of the LDA models of the six actions in the KTH dataset. The insets show the numbers ofNASs of the selected topics that are shared by the 1–6 actions in the dataset. Note that, by definition, topics are not shared by two or more actions.doi:10.1371/journal.pone.0046686.g011
Action Recognition Using Natural Action Structures
PLOS ONE | www.plosone.org 13 October 2012 | Volume 7 | Issue 10 | e46686
variety of multi-scale information about human actions; general
structures are shared by more actions while specific structures are
shared by only one or two actions. Finally, encoding of actions by
NASs is more or less equivalent to specifying the spatial and
temporal arrangements of NASs, which reduces the training of
models for recognition.
We used NASs as the basic features for action recognition in two
popular recognition methods, LDA and SVM, on two datasets of
human actions. For LDA, the recognition rate is 89.5% on the
KTH dataset and 94.4% on the Weizmann dataset. For SVM, the
recognition rate is 92.7% on the KTH dataset and 96.7% on the
Weizmann dataset. For both methods, these results are better than
those obtained using low-level features and are among the best
current models of action recognition. We also found that the
classification performance with NASs as features was slightly
affected by changes of scale and noise.
Possible neural mechanismsNeurons in the primary visual cortex respond selectively to
stimulus orientations, spatial frequency, speed, and directions
[43,44]. By the time information reaches neurons in the MT area,
local visual motion signals are integrated into the global motion of
complex objects [45]. Recent studies [46,47] showed that the
responses of V1 neurons can be described to a large degree by the
Linear-Nonlinear (LN) model where the responses of a set of linear
filters are combined in a simple nonlinear way. Furthermore, the
responses of MT neurons can be described by a nonlinear function
of a weighted sum of responses of V1 neurons [48]. These
observations strongly suggest a biological coding strategy in which
the visual system represents actions and events by assembling a set
of basic elements in a hierarchical way. As an example for this
strategy, our recent recording in the mouse’s primary visual cortex
suggests that patterns of sequential firing of a population of V1
neurons can encode various movements of a set of basic stimulus
features (Figure S2).
By comparison, global representations of actions and events
[11,12] by the computational modeling have not made use of
hierarchical neuronal encoding properties observed in the brain,
but rather employed the spatial-temporal volumes of actions and
events as a whole. On the other hand, current modeling on local
representations of actions and events [13–19], including cuboids
descriptors, histograms of optical flow, are not compatible with the
neuronal response properties. For instance, the basic spatial-
temporal features in these local representations are not similar to
the features to which V1 neurons are tuned. Moreover, the basic
features used in these local representations are discriminative
features but are not intended to encode natural actions in a
hierarchical way.
In the NASs obtained here, there are two layers. In the first
layer, the basic spatial-temporal features are ICs, similar to the
Figure 12. Spatial distributions of NASs. Spatial distributions of NASs in the 6 actions in the KTH dataset. The panels show the normalizedfrequencies of the NASs shown to the left, in the three areas indicated by the numbers on the video frame. The top-left figure shows the partitiongrids. Note that each NAS is a set of patch sequences and also that each NAS shown is the average of all patch sequences that share the samestructural indices.doi:10.1371/journal.pone.0046686.g012
Action Recognition Using Natural Action Structures
PLOS ONE | www.plosone.org 14 October 2012 | Volume 7 | Issue 10 | e46686
features to which V1 neurons are tuned. The feature element ai of
each patch sequence is the root mean square of the amplitudes of
the ICs in an IC cluster (Equation (2)). In the second layer, each
structural cluster in the space of feature vector contains a
combination of the IC clusters, some of which may be more
dominant than others. Thus, each NAS is characterized by a set of
IC clusters at multiple spatial-temporal scales. At this time, we can
only speculate the possible neural mechanisms for this coding
scheme of natural actions. First, the feature element ai corre-
sponding to an IC cluster cannot be encoded by a single V1
neuron but may be expressed as a nonlinear function of the
responses of a set of V1 neurons whose tuning to orientation,
speed, direction, frequency, and phase are similar (since the ICs in
an IC cluster have similar parameters). This neural model of ai
would be a straightforward generalization of the LN model to the
population level. Second, an NAS, which usually contains multiple
IC clusters, may not be encoded by a single MT neuron but may
be expressed as a nonlinear function of the responses of a set of
MT neurons whose tuning characteristics are broadly similar
(since the dominant IC clusters in a structural cluster are broadly
similar). This neural model of NAS can be viewed as a critical
generalization of the MT neuron model [48] to the population
level. Thus, it is conceivable that the population coding strategy
can give rise to various NASs along the visual pathways.
Future directionsOur present study can be extended in three major ways. The
first extension is to develop parameterized, probabilistic models of
NASs. Because of the limited sizes of the datasets used in this
study, we did not attempt to develop probabilistic models on the
NASs. For this purpose, we are currently developing a large
dataset of human actions. With parameterized, probabilistic
models of NASs, we will be able to perform a range of statistical
analyses on NASs and develop a hierarchical, probabilistic model
of action recognition. The second extension is to develop
combinatorial principles for encoding natural human actions.
These principles, acting like a stochastic grammar, similar to
image grammars [49], specify the spatial and temporal concate-
nations of NASs for action encoding, and NASs are the
probabilistic code words in this action grammar. The third
extension is to combine this model with our models of motion
saliency [50] and object detection in natural contexts [24] to
categorize scenes and detect objects, animals and humans, and
their actions simultaneously. These directions need to be pursued
in the future.
Materials and Methods
Datasets of human actionsWe used two video datasets of human actions, the KTH dataset
[14] and the Weizmann dataset [11]. The KTH dataset contains
2,391 videos of six actions, boxing, handclapping, handwaving,
jogging, running, and walking, performed by 25 human subjects.
Each video contains repeated executions of a single action and has
a resolution of 1606120 pixels and a frame rate of 25 frames/
second. These videos were recorded under four conditions:
outdoor, outdoor with variations in scale, outdoor with different
cloths, and indoor. Figure 2A shows 4 samples of each action in
the dataset.
The Weizmann dataset contains 90 videos of 10 actions
performed outdoors by 9 human subjects, including bend
(bending), jack (jumping jack), jump (jumping forward on two
legs), pjump (jumping in place on two legs), run (running), side
(galloping sideways), skip (skipping), walk (walking), wave1 (waving
with one hand), and wave2 (waving with two hands). Each video
contains repeated executions of a single action and has a resolution
of 1806144 pixels and a frame rate of 25 frames/second.
Figure 2B shows one sample of each action in this dataset.
Training and cross-validationTo test our models of action recognition on the KTH dataset,
we used the separation of the training set (subjects: 1, 4, and 11–
25) and testing set (subjects: 2, 3, 5–10, and 22) coming with the
dataset. Cross-Validation (CV) is a way to keep in control over-
fitting and is widely used in pattern recognition. We used LOOCV
on the training set to select model parameters, which included: 1)
the number of clusters obtained by the K-means method, 2) the
thresholds, Mc and Nc, for selecting NASs, 3) the partition grids
for the SVM classifier, and 4) the parameters of the LDA and
SVM classifiers. In this procedure, we tested on the video samples
of a single subject using the remaining samples as the training set.
We repeated this procedure until the video samples of all subjects
were tested. To test our models on the Weizmann dataset, we used
LOOCV on the whole dataset since this dataset is small.
Pre-processingWe used Dollar’s cuboids detector and descriptor on both KTH
and Weizmann dataset as a baseline method. We set the spatial
scale to 2 and the temporal scale to 3 in the cuboids detector and
the size of cuboids to 13 (space)613 (space)619 (time). To detect
points of interests in space-time volumes for compiling NASs, we
used the cuboids detector, defined as the local maxima of the
response function. At the selected points of interests, we sampled
sequences of circular patches of sizes of 13613611, 25625621,
and 49649631 and aligned to each other the centers of the
middle frames in the patch sequences (i.e., 6th, 11th, and 16th).
Testing on KTH datasetWe randomly sampled 66105 patch sequences, performed ICA
on the sequences, and obtained 1,200 ICs that accounted for
99.5% of the variance of the patch sequences. We fitted Gabor
functions to the 1,200 ICs, converted the fitted parameters into
pre-set intervals (i.e., the scale of the Gaussian envelope to [0, +‘),
the orientation of sinusoid carrier to [0, p), and the phase of the
sinusoid carrier to [0, 2p)). However, we did not convert the
location of the Gaussian envelope. We then collapsed the ICs into
480 IC clusters using the K-means method with the Euclidean
distance as a function of the parameters of the Gabor function.
To compile NASs, we randomly selected 56105 patch
sequences, mapped them to the 480 IC clusters, and collapsed
them to 1,000 structural clusters at each scale using the K-means
method. The distance used in this step was the Euclidean distance
between the root mean square of the amplitudes of the ICs in the
IC clusters. We call all the patch sequences that share the same
structural clusters at the three spatial-temporal scales a NAS. The
total number of NASs is 193,600.
To select NASs for the SVM classifier, we set the thresholds, Mc
and Nc, to 2 and 400 respectively. The total number of selected
NASs is 4,998. We used the 1- x2 kernel in the SVM classifier and
set C to 0.125. Also, we partitioned the video sequences into 3-1-1
grids (i.e., 3 equal grids in the vertical dimension and 1 grid in the
horizontal and temporal dimensions). For LDA classifier, we set
the thresholds Mc and Nc to 3 and 300 respectively. The total
number of the selected NASs is 4,349 and the number of topics is
50.
Action Recognition Using Natural Action Structures
PLOS ONE | www.plosone.org 15 October 2012 | Volume 7 | Issue 10 | e46686
Testing on Weizmann datasetWe randomly sampled 1.26106 patch sequences, performed
ICA on the sequences, and obtained 1,200 ICs that accounted for
99.9% of the variance of the patch sequences. We fitted Gabor
functions to the 1,200 ICs, converted the fitted parameters (see
above), and collapsed the 1,200 ICs into 440 clusters using the K-
means method with the Euclidean distance. To compile NASs, we
randomly selected 23,000 samples, mapped them to the 440 IC
clusters, and collapsed them to 700 structural clusters using the K-
means method (see above). The total number of NASs is 11,540.
To select NASs for the SVM classifier, we set the thresholds, Mc
and Nc, to 1 and 500 respectively. The total number of selected
NASs is 6,392. We used the 1- x2 kernel in the SVM classifier and
set C to 0.125. For this dataset, we used grid 1-1-1. For LDA
classifier, we set the thresholds, Mc and Nc, to 0 and 100
respectively. The total number of the selected NASs was 1,526 and
the number of topics is 30.
Supporting Information
Figure S1 Representative visual receptive fields record-ed from the mouse primary visual cortex. The visual
receptive fields were recorded by using 64-channel recording array
in stereotrode format. The mouse’s head was fixed to a crossbar,
and standing or running on tread mill.
(TIF)
Figure S2 Neural correlates of action recognition re-sponses in the mouse’s V1 cortex. (A–C), Neurons #1, 2,
and 3 have the preferred orientation at 45u, 67.5u, and 135u,respectively, based on their responses to drifting grating stimuli.
Eight orientations were given as shown. (D), Sequential firings of
Neurons #1, 2, and 3 may provide a mechanism for computing
upper body and head motion information along the visual
pathway during the action recognition of ‘‘standing up’’.
(TIF)
Acknowledgments
We thank Drs. He Cui, Weibing Wan, Hongmiao Zhang, and the
anonymous reviewers for highly constructive and helpful comments.
Author Contributions
Conceived and designed the experiments: ZY JZT. Performed the
experiments: XZ ZY. Analyzed the data: XZ ZY JZT. Contributed
reagents/materials/analysis tools: XZ ZY JZT ML XL. Wrote the paper:
XZ ZY JZT ML XL.
References
1. Blake R, Shiffrar M (2007) Perception of human motion. Annu Rev Psychol
58:47–73.
2. Rizzolatti G, Fogassi L, Gallese V (2001) Neurophysiological mechanisms
underlying the understanding and imitation of action. Nat Rev Neurosci 2:661–
670
3. Decety J, Grezes J (1999) Neural mechanisms subserving the perception of
human actions. Trends Cogn Sci 3:172–178.
4. Nassi JJ, Callaway EM (2009) Parallel processing strategies of the primate visual
system. Nat Rev Neurosci 10:360–372.
5. Giese MA, Poggio T (2003) Neural mechanisms for the recognition of biological
movements. Nat Rev Neurosci 4:179–192.
6. Poppe R (2010) A survey on vision-based human action recognition. Image Vis
Comput 28: 976–990.
7. Aggarwal JK, Ryoo MS (2011) Human activity analysis: a review. ACM
Comput Surv 43: 1–43.
8. Serre T, Oliva A, Poggio T (2007) A feedforward architecture accounts for rapid
categorization. Proc Natl Acad Sci U S A 104: 6424–6429.
9. Ullman S (2000) High-level vision: object recognition and visual cognition. The
MIT Press. 412 p.
10. Pinto N, Doukhan D, DiCarlo JJ, Cox DD (2009) A high-throughput screening
approach to discovering good forms of biologically inspired visual representa-
tion. PLoS Comput Biol 5(11): e1000579. doi:10.1371/journal.pcbi.1000579.
11. Gorelick L, Blank M, Shechtman E, Irani M, Basri R (2007) Actions as space–
time shapes. IEEE Trans on Pattern Anal Mach Intell 29:2247–2253.
12. Weinland D, Ronfard R, Boyer E (2006) Free viewpoint action recognition using
motion history volumes. Comput Vis Image Underst 104:249–257.
13. Laptev I, Lindeberg T (2003) Space–time interest points. Proc IEEE Int Conf
Comput Vis 1:432–439.
14. Schuldt C, Laptev I, Caputo B (2004) Recognizing human actions: a local SVM
approach. Proc IAPR Int Conf Pattern Recogn 3:32–36.
15. Klaser A, Marszałek M, Schmid C (2008) A spatio-temporal descriptor based on
3d-gradients. Proc British Machine Vision Conference 1:995–1004.
16. Scovanner P, Ali S, Shah M (2007) A 3-dimensional SIFT descriptor and its
application to action recognition. Proc ACM Int Conf Multimed 1:357–360.
17. Dollar P, Rabaud V, Cottrell G, Belongie S (2005) Behavior recognition via
sparse spatio-temporal features. Proc IEEE International Workshop on Visual
Surveillance and Performance Evaluation of Tracking and Surveillance 1:65–72.
18. Laptev I, Marszałek M, Schmid C, Rozenfeld B (2008) Learning realistic human
actions from movies. Proc IEEE Comput Soc Conf Comput Vis Pattern
Recognit 1:1–8.
19. Willems G, Tuytelaars T, Van Gool LJ (2008) An efficient dense and scale-
invariant spatio-temporal interest point detector. Proc European Conference on
Computer Vision 2:650–663.
20. Field GD, Chichilnisky EJ (2007) Information processing in the primate retina:
circuitry and coding. Annu Rev Neurosci 30:1–30.
21. Adams DL, Horton JC (2003) A precise retinotopic map of primate striate cortex
generated from the representation of angioscotomas. J Neurosci 23: 3771–3789.
22. Nassi JJ, Callaway EM (2009) Parallel processing strategies of the primate visual
system. Nat Rev Neurosci 10:360–372.
23. Hyvarinen A, Oja E (2000) Independent component analysis: algorithms and
application. Neural Netw 13:411–430.
24. He X, Yang Z, Tsien JZ, (2011) A hierarchical probabilistic model for rapid
object categorization in natural scenes. PloS ONE 6(5): e20002.doi:10.1371/
journal.pone.002 0002.
25. Blei D, Ng A, Jordan M (2003) Latent Dirichlet allocation. J Mach Learn Res
3:993–1022.
26. Li FF, Perona P (2005) A Bayesian hierarchical model for learning natural scene
categories. Proc IEEE Comput Soc Conf Comput Vis Pattern Recognit 2:524–
531.
27. Niebles JC, Wang HC, Li FF (2008) Unsupervised learning of human action
categories using spatial-temporal words. Int J Comput Vis 79:299–318.
28. Wong SF, Kim TK, Cipolla R (2007) Learning motion categories using both
semantic and structural information. Proc IEEE Comput Soc Conf Comput Vis
Pattern Recognit 1:1–6.
29. Muller KR, Mika S, Ratsch G, Tsuda K, Schoelkopf B (2001) An introduction
to kernel-based learning algorithms. IEEE Trans Neural Netw 12:181–201.
30. Blei D, Lafferty J (2006) Dynamic topic models. Proc Int Conf Mach Learn
1:113–120.
31. Boyd-Graber J, Blei D (2008) Syntactic topic models. Adv Neural Inf Process
Syst 1:185–192.
32. Hospedales T, Gong S, Xiang T (2009) A Markov clustering topic model for
mining behaviour in video. Proc IEEE Int Conf Comput Vis 1:1165–1172.
33. Lazebnik S, Schmid C, Ponce J (2006) Beyond bags of features: spatial pyramid
matching for recognizing natural scene categories. Proc IEEE Comput Soc Conf
Comput Vis Pattern Recognit 2:2169–2178.
34. Zhang J, Marszalek M, Lazebnik S, Schmid C (2007) Local features and kernels
for classification of texture and object categories: a comprehensive study.
Int J Comput Vis 73:213–238.
35. Fowlkes C, Belongie S, Chung F, Malik J (2004) Spectral grouping using the
Nystrom method. IEEE Trans Pattern Anal Mach Intell 2:214–225.
36. Bosch A, Zisserman A, Munoz X (2007) Representing shape with a spatial
pyramid kernel. Proc ACM International Conference on Image and Video
Retrieval 1:401–408.
37. Huang TK, Weng RC, Lin CJ (2006) Generalized Bradley-Terry models and
multi-class probability estimates. J Mach Learn Res 7:85–115.
38. Chang CC, Lin CJ (2011) LIBSVM: a library for support vector machines.
ACM Transactions on Intelligent Systems and Technology 2:1–27.
39. Wang H, Ullah MM, Klaser A, Laptev I, Schmid C (2009) Evaluation of local
spatio-temporal features for action recognition. Proc British Machine Vision
Conference 1:1–8.
40. Yao A, Gall J, Van Gool LJ (2010) A Hough transform-based voting framework
for action recognition. Proc IEEE Comput Soc Conf Comput Vis Pattern
Recognit 1:2061–2068.
41. Bregonzio M, Gong S, Xiang T (2009) Recognizing action as clouds of space-
time interest points. Proc IEEE Comput Soc Conf Comput Vis Pattern Recognit
1:1948–1955.
42. Wang L, Wang Y, Gao W (2011) Mining layered grammar rules for action
recognition. Int J Comput Vis 93:162–182.
Action Recognition Using Natural Action Structures
PLOS ONE | www.plosone.org 16 October 2012 | Volume 7 | Issue 10 | e46686

43. Movshon JA, Thompson ID, Tolhurst DJ (1978) Spatial summation in the
receptive fields of simple cells in the cat’s striate cortex. J Physiol 283:53–77.44. Movshon JA, Thompson ID, Tolhurst DJ (1978) Receptive field organization of
complex cells in the cat’s striate cortex. J Physiol 283:79–99.
45. Movshon JA, Adelson EH, Gizzi MS, Newsome WT (1985) The analysis ofmoving visual patterns. Pattern Recognition Mechanisms 54:117–151.
46. Chen X, Han F, Poo MM, Dan Y (2007) Excitatory and suppressive receptivefield subunits in awake monkey primary visual cortex (V1). Proc Natl Acad
Sci U S A 104: 19120–19125.
47. Rust NC, Schwartz O, Movshon JA, Simoncelli EP (2005) Spatiotemporal
elements of macaque v1 receptive fields. Neuron 46: 945–956.48. Rust NC, Mante V, Simoncelli EP, Movshon JA (2006) How MT cells analyze
the motion of visual patterns. Nat Neurosci 9:1421–1431.
49. Zhu SC, Mumford D (2006) A stochastic grammar of images. Foundations andtrends in computer graphics and vision 2:259–362.
50. Xu J, Yang Z, Tsien JZ (2010) Emergence of visual saliency from natural scenesvia context-mediated probability distribution coding. PLoS ONE
5(12):e15796.doi:10.1371/journal.pone.0015796.
Action Recognition Using Natural Action Structures
PLOS ONE | www.plosone.org 17 October 2012 | Volume 7 | Issue 10 | e46686