Embed Size (px)
Citation preview

International Energy Agency
Th j i tThe joint IEA/Eurostat/UNECE
questionnaires
Roberta QuadrelliIEA Energy Statistics Division
Non-OECD statistics, Head of section
ESCWA EGM on compilationESCWA EGM on compilation and analysis of energy
statistics and indicators
UN House, Beirut, 3-5 March 2009UN House, Beirut, 3 5 March 2009
© OECD/IEA, 2009

Energy statistics in the world
MEDSTAT II Lot 2 Euro-Mediterranean Statistical Co-operation © OECD/IEA, 2009

The International Energy Agency: www.iea.org
MEDSTAT II Lot 2 Euro-Mediterranean Statistical Co-operation © OECD/IEA, 2009

International Energy Agency
Member countries Autonomous Agency of the OECDE t bli h d i 1974 ft 1 t Oil C i i
MEDSTAT II Lot 2 Euro-Mediterranean Statistical Co-operation © OECD/IEA, 2009
IEAOECD
Established in 1974 after 1st Oil Crisis28 Members Countries (vs. 30 for OECD)3 Es: Energy security, Economy and Environment

European Union - Eurostat
MEDSTAT II Lot 2 Euro-Mediterranean Statistical Co-operation © OECD/IEA, 2009

UN Economic Commission for Europe
MEDSTAT II Lot 2 Euro-Mediterranean Statistical Co-operation © OECD/IEA, 2009

The five IEA/Eurostat/UNECE Questionnaires
A l f ti b t diff t i tiAn example of co-operation between different organisationsworking on energy statistics
MEDSTAT II Lot 2 Euro-Mediterranean Statistical Co-operation © OECD/IEA, 2009

The five IEA/Eurostat/UNECE Questionnaires
Coal and coal products
Oil and petroleum productsOil and petroleum products
Gas
Renewables and wasteRenewables and waste
Electricity and Heat
MEDSTAT II Lot 2 Euro-Mediterranean Statistical Co-operation © OECD/IEA, 2009

The data process
Prepared in
National Administrations
Work from August toPrepared in June-July
S t d J l
Work from August to September/October
Sent end July
Sent back to the IEA
MEDSTAT II Lot 2 Euro-Mediterranean Statistical Co-operation © OECD/IEA, 2009
before end of November
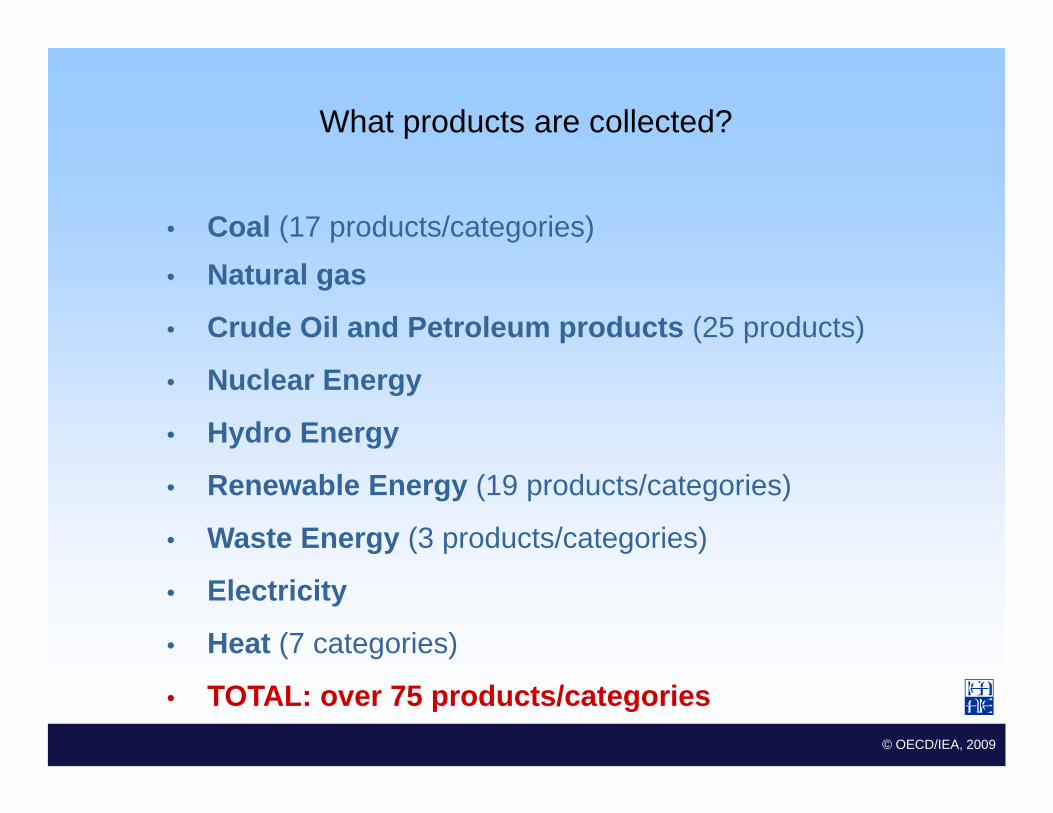
What products are collected?
• Coal (17 products/categories)• Natural gas
• Crude Oil and Petroleum products (25 products)
• Nuclear Energy
• Hydro Energy
• Renewable Energy (19 products/categories)
• Waste Energy (3 products/categories)
• Electricity
• Heat (7 categories)
MEDSTAT II Lot 2 Euro-Mediterranean Statistical Co-operation © OECD/IEA, 2009
• TOTAL: over 75 products/categories
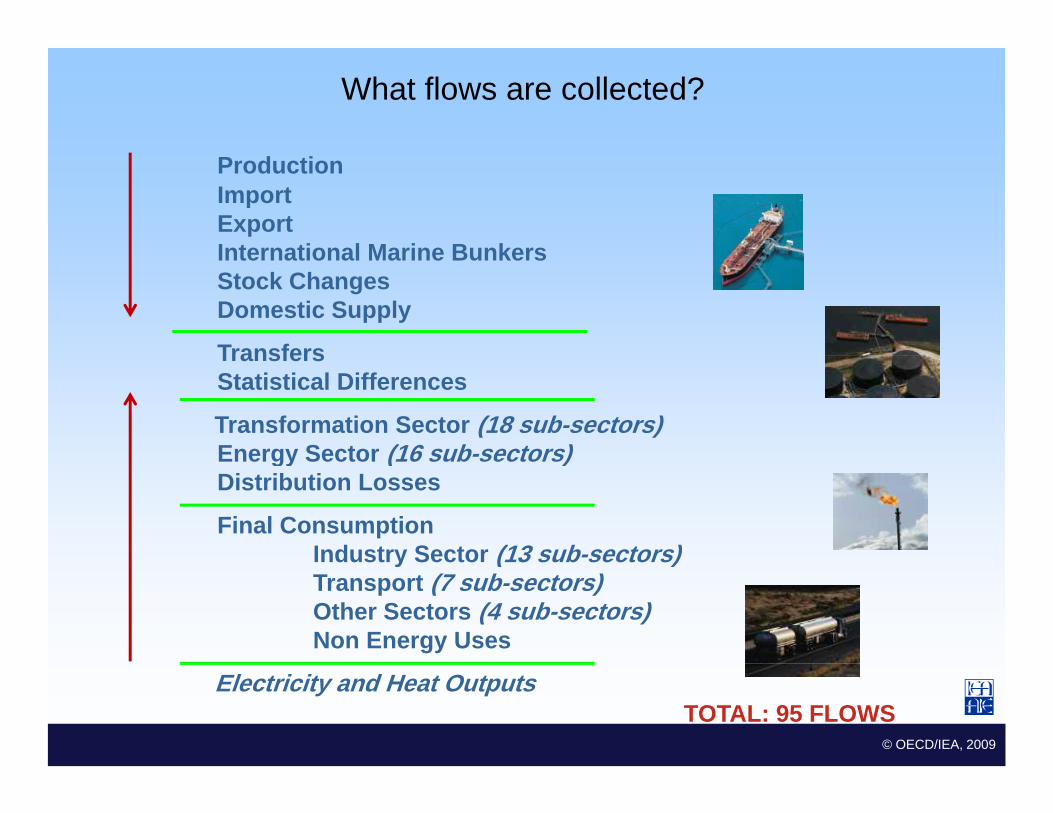
What flows are collected?
ProductionImport ExportInternational Marine BunkersInternational Marine BunkersStock ChangesDomestic Supply
TransfersTransfersStatistical Differences
Transformation Sector (18 sub-sectors)Energy Sector (16 sub-sectors)Energy Sector (16 sub sectors)Distribution Losses
Final ConsumptionIndustry Sector (13 sub-sectors)Industry Sector (13 sub sectors)Transport (7 sub-sectors)Other Sectors (4 sub-sectors)Non Energy Uses
MEDSTAT II Lot 2 Euro-Mediterranean Statistical Co-operation © OECD/IEA, 2009
Electricity and Heat Outputs TOTAL: 95 FLOWS

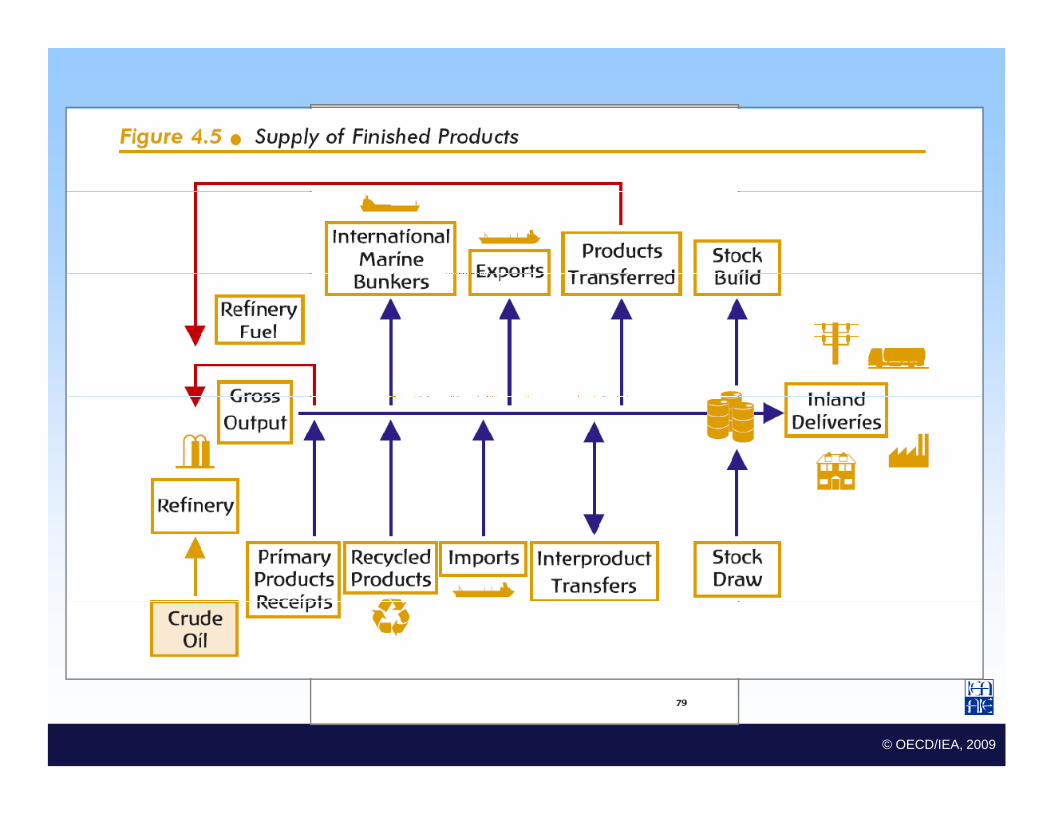
Supply
Production
Marketable
.Marketable
Import
Export+-
Trade excludes transit (except electricity)
International marine bunkers
E l d d f l
-Excluded from supply
Stock changes
Fulfill strategic need
+Fulfill strategic need
= Domestic supply
MEDSTAT II Lot 2 Euro-Mediterranean Statistical Co-operation © OECD/IEA, 2009
Quantity of energy available in a country

Transformation - Energy
Transformation
Quantities of fuel transformed into another
GROSS INLAND DELIVERIES (1)
TOTAL TRANSFORMATION SECTORMain Activity Producer Electricity Plants (2) Quantities of fuel transformed into another
energy formMain Activity Producer Electricity Plants (2)Autoproducer Electricity Plants (3)Main Activity Producer CHP Plants (2)Autoproducer CHP Plants (3)Main Activity Producer Heat Plants (2)Autoproducer Heat Plants (3)Gas Works (Transformation)Blended Natural GasCoke Ovens (Transformation)Blast FurnacesPetrochemical Industry
Energy
Patent Fuel PlantsNon Specified (Transformation)
TOTAL ENERGY SECTORCoal MinesOil and Gas Extraction
Quantities of fuel consumed to support the energy extraction or the transformation activity
Oil and Gas ExtractionCoke Ovens (Energy)Blast FurnacesGas Works (Energy)Power PlantsNon Specified (Energy)
MEDSTAT II Lot 2 Euro-Mediterranean Statistical Co-operation © OECD/IEA, 2009
Distribution Losses
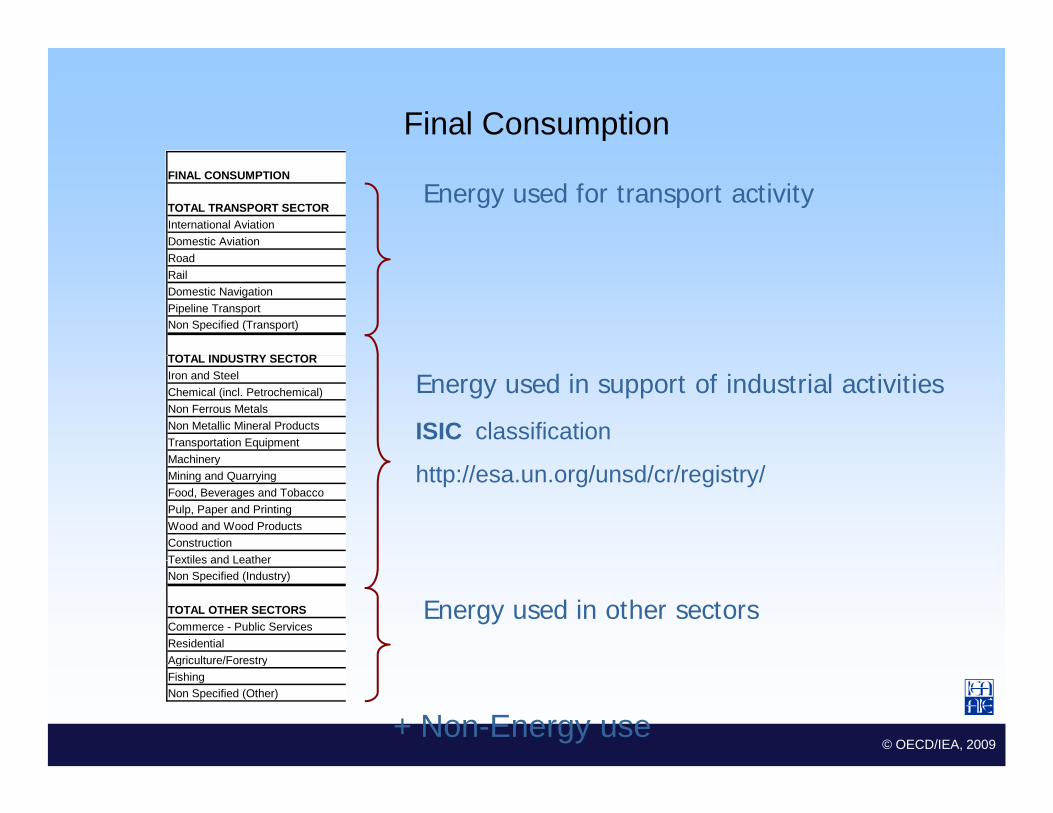
Final Consumption
Energy used for transport activityFINAL CONSUMPTION
TOTAL TRANSPORT SECTORInternational AviationDomestic AviationRoadRailDomestic NavigationPipeline TransportNon Specified (Transport)
TOTAL INDUSTRY SECTOR
Energy used in support of industrial activities
ISIC classification
TOTAL INDUSTRY SECTORIron and SteelChemical (incl. Petrochemical)Non Ferrous MetalsNon Metallic Mineral ProductsTransportation EquipmentMachinery
http://esa.un.org/unsd/cr/registry/MachineryMining and QuarryingFood, Beverages and TobaccoPulp, Paper and PrintingWood and Wood ProductsConstructionTextiles and Leather
Energy used in other sectors
Textiles and LeatherNon Specified (Industry)
TOTAL OTHER SECTORSCommerce - Public ServicesResidentialAgriculture/Forestry
MEDSTAT II Lot 2 Euro-Mediterranean Statistical Co-operation © OECD/IEA, 2009
Agriculture/ForestryFishingNon Specified (Other)
+ Non-Energy use

P l ' R bli f Chi / Ré bli l i d Chi 2005Energy Balance
The energy balance
People's Republic of China / République populaire de Chine : 2005
Thousand tonnes of oil equivalent / Milliers de tonnes d'équivalent pétrole
SUPPLY AND Coal Crude Petroleum Gas Nuclear Hydro Geotherm. Combust. Electricity Heat TotalCONSUMPTION Oil Products Solar Renew.
etc. & Waste
APPROVISIONNEMENT Charbon Pétrole Produits Gaz Nucléaire Hydro Géotherm. Comb. Electricité Chaleur TotalET DEMANDE brut pétroliers solaire ren. &
déchets
Production 1145355 181427 - 42621 13835 34143 - 223561 - - 1640944Imports 14893 126817 41493 - - - - - 431 - 183634
Energy BalanceData collected
through questionnaires Imports 14893 126817 41493 431 183634
Exports -55279 -8067 -16722 -2484 - - - - -963 - -83514Intl. Marine Bunkers - - -7642 - - - - - - - -7642Stock Changes -17345 788 288 - - - - - - - -16269
TPES 1087624 300965 17417 40137 13835 34143 - 223561 -532 - 1717153
Transfers - -74 88 - - - - - - - 13Statistical Differences 7118 -1328 917 -1137 - - - - - - 5570Electricity Plants -527596 -213 -15059 -2637 -13835 -34143 - -861 214780 - -379565CHP Plants - - - - - - - - - - -Heat Plants -71089 -3 -2672 -1938 - - - -503 - 54660 -21545Gas Works -6640 - -144 4841 - - - - - - -1943Petroleum Refineries - -290405 283439 - - - - - - - -6966Coal Transformation -69485 - - - - - - - - - -69485
qare the basis for a country energy
balanceCoa a s o a o 69 85 69 85Liquefaction Plants - - - - - - - - - - -Other Transformation - - - - - - - - - - -Own Use -46624 -5037 -17434 -6549 - - - - -28398 -10647 -114690Distribution Losses - - -20 -864 - - - - -14494 -630 -16009
TFC 373308 3905 266532 31852 - - - 222197 171355 43383 1112532
INDUSTRY SECTOR 279763 2509 35753 12366 - - - - 116217 29153 475761Iron and Steel 102809 - 3011 894 - - - - 21882 3667 132263Chemical and Petrochemical 28095 - 5380 5589 - - - - 21588 12899 73550Non-Ferrous Metals 8147 - 1559 791 - - - - 12639 1811 24947Non-Metallic Minerals 85282 - 8904 2540 - - - - 12179 149 109054Transport Equipment 3226 - 1067 459 - - - - 2580 625 7956Machinery 9117 - 3834 1360 - - - - 13801 978 29091yMining and Quarrying 3628 - 1225 151 - - - - 4337 303 9644Food and Tobacco 11818 - 1577 218 - - - - 4123 1977 19714Paper Pulp and Printing 8551 - 761 65 - - - - 4019 2373 15768Wood and Wood Products 1870 - 268 14 - - - - 1114 127 3392Construction 3200 - 4161 125 - - - - 2012 111 9608Textile and Leather 9378 - 1572 64 - - - - 8288 3685 22987Non-specified 4642 2509 2434 98 - - - - 7656 448 17788
TRANSPORT SECTOR 4080 - 108334 79 - - - - 1737 - 114230International Aviation - - 2095 - - - - - - - 2095Domestic Aviation - - 7566 - - - - - - - 7566Road - - 75670 70 - - - - - - 75740Rail 4079 - 9129 - - - - - 1737 - 14944Pipeline Transport - - 4627 9 - - - - - - 4636Domestic Navigation 1 - 9247 - - - - - - - 9248Non-specified 1 - - - - - - - - - 1
OTHER SECTORS 67380 238 61076 12071 - - - 222197 53401 14230 430593Residential 46162 - 17598 8895 - - - 222197 24293 12356 331502Comm. and Publ. Services 5190 - 22302 3177 - - - - 10040 867 41576Agriculture/Forestry 12155 - 21175 - - - - - 7536 18 40885Fishing - - - - - - - - - - -Non-specified 3872 238 - - - - - - 11532 988 16630
NON-ENERGY USE 22085 1158 61369 7336 - - - - - - 91948in Industry/Transf./Energy 22085 1158 61369 7336 - - - - - - 91948 of which: Feedstocks - 1158 33590 7336 - - - - - - 42084
MEDSTAT II Lot 2 Euro-Mediterranean Statistical Co-operation © OECD/IEA, 2009
in Transport - - - - - - - - - - -in Other Sectors - - - - - - - - - - -
Electr. Generated - GWh 1972267 - 60634 11931 53088 397017 - 2504 - - 2497441 Electricity Plants 1972267 - 60634 11931 53088 397017 - 2504 - - 2497441 CHP Plants - - - - - - - - - - -
Heat Generated - TJ 2091954 - 94145 90203 - - - 12645 - - 2288947 CHP Plants - - - - - - - - - - - Heat Plants 2091954 - 94145 90203 - - - 12645 - - 2288947

Basic indicators
OECD China India World
Production Mtoe 3 834 1 641 419 11 468
TPES Mtoe 5 548 1 717 537 11 434TPES Mtoe 5 548 1 717 537 11 434
Electricity Consumption TWh 9 800 2 322 525 16 695
CO2 Emissions Mt of CO2 12 910 5 059 1 147 27 136
P d ti /TPES 0 69 0 96 0 78 1 00Data collectedProduction/TPES 0.69 0.96 0.78 1.00
TPES/GDP toe / 000 2000$ 0.20 0.91 0.83 0.32
TPES/GDP(PPP) toe / 000 2000$ PPP 0.18 0.22 0.16 0.21
TPES/Population toe / capita 4.74 1.32 0.49 1.78
Data collected through
questionnaires are the basis for
Elec. Cons/Population kWh / capita 8 365 1 781 480 2 596
CO2 / TPES t CO2 / toe 2.33 2.95 2.14 2.37
a set of basic indicators
CO2 / GDP kg CO2 / 2000 $ 0.45 2.68 1.78 0.75
CO2 / GDP (PPP) kg CO2 / 2000 $ PPP 0.43 0.65 0.34 0.50
CO2 / Population t CO2 / capita 11.02 3.88 1.05 4.22
MEDSTAT II Lot 2 Euro-Mediterranean Statistical Co-operation © OECD/IEA, 2009

IEA: how OECD data are collectedFive Annual Energy Questionnaires
IEA: how OECD data are collected
Quarterly Questionnaires: Prices and Taxes questionnaire
Monthly Questionnaires:Monthly Oil and Gas Statistics, Joint Oil Data InitiativeElectricity production and trade
MEDSTAT II Lot 2 Euro-Mediterranean Statistical Co-operation © OECD/IEA, 2009
Electricity production and trade
Exceptional Questionnaires: Mainly in case of oil crisis

IEA: how non-OECD data are collected
OECD Non OECD EuropeFormer Soviet Union
(15 countries)
OECD (30 countries)
Non OECD Europe(11 countries)
D t ll t d d dAsia
(17 countries)
Data are collected, processed and published for over 130 countries
Latin AmericaMiddle East (13 countries)
MEDSTAT II Lot 2 Euro-Mediterranean Statistical Co-operation © OECD/IEA, 2009
Latin America(22 countries)
Africa(26 countries)
(13 countries)

How non-OECD data are collected
Contact with national administrations
Secondary sources
Co operation with other organisations
FAO UN EUROST
Co-operation with other organisations
FAOAT
WORLD BANK
OAPEC
OPEC
MEDSTAT II Lot 2 Euro-Mediterranean Statistical Co-operation © OECD/IEA, 2009AFREP
REN

The five IEA/Eurostat/UNECE questionnaires
MEDSTAT II Lot 2 Euro-Mediterranean Statistical Co-operation © OECD/IEA, 2009
http://www.iea.org/Textbase/stats/questionnaire/quest.asp

The questionnaires in Excel format
MEDSTAT II Lot 2 Euro-Mediterranean Statistical Co-operation © OECD/IEA, 2009

The online submission of questionnaires
MEDSTAT II Lot 2 Euro-Mediterranean Statistical Co-operation © OECD/IEA, 2009
The IEA/Eurostat energy statistics manual
A f i dl l tA user-friendly manual to help newcomers to
understand and complete annual questionnaires
MEDSTAT II Lot 2 Euro-Mediterranean Statistical Co-operation © OECD/IEA, 2009
q

MEDSTAT II Lot 2 Euro-Mediterranean Statistical Co-operation © OECD/IEA, 2009
MEDSTAT II Lot 2 Euro-Mediterranean Statistical Co-operation © OECD/IEA, 2009

The manual website
MEDSTAT II Lot 2 Euro-Mediterranean Statistical Co-operation © OECD/IEA, 2009
http://www.iea.org/Textbase/publications/free_new_Desc.asp?PUBS_ID=1461

Available versions of the manual
EnglishEnglish FrenchFrench GermanGerman TurkishTurkish
SpanishSpanish RussianRussian ChineseChinese
MEDSTAT II Lot 2 Euro-Mediterranean Statistical Co-operation © OECD/IEA, 2009
SpanishSpanish RussianRussian ChineseChinese
Arabic and Indonesian versions are in preparation
Prepared byPrepared by
IEFS,IEFS,
A manual on the Joint Oil Data InitiativeIEFS,IEFS,
APEC,APEC,
Eurostat,Eurostat,
Manuals
IEA,IEA,
OLADE,OLADE,
OPEC,OPEC,
UNSDUNSD
MEDSTAT II Lot 2 Euro-Mediterranean Statistical Co-operation © OECD/IEA, 2009

Any questions, comments, feedback….?
Thank you
MEDSTAT II Lot 2 Euro-Mediterranean Statistical Co-operation © OECD/IEA, 2009