Embed Size (px)
Citation preview
ROADSHOW PRESENTATION
June 2018
DISCLAIMER
2
This document (the Document) was prepared by ORSERO S.p.A. (Company) only for the purposes of presenting theCompany.
The information contained herein may not be complete and exhaustive and no guarantee can be given as to its accuracy.
This Document was drafted on the basis of data and information of the Company and/or in the public domain, and onparameters and assumptions determined in good faith by the Company. However, these parameters and assumptions arenot the only ones that could have been selected for the purpose of preparing this Document, therefore the application ofadditional parameters and assumptions, or the existence of different market conditions, could lead, in good faith, toanalyses and assessments that may differ, in whole or in part, from those contained herein.
The information and/or the assessments contained herein have not been subjected to verification by independent experts,and are subject to changes and/or updates. The Company undertakes no obligation to give prior or subsequentcommunication in the event that any such changes and additions may become necessary or appropriate.No information contained in this Document can or shall be considered a guarantee or an indication of future operating,financial and equity results of the Company.To the extent permitted by applicable law, the Company and its corporate officers, managers, employees, and consultantsdo not make any declaration or guarantee and do not assume any obligation, either express or implied, or responsibility asto the accuracy, sufficiency, completeness and update of any information contained in the Document nor in respect of anyerrors, omissions, inaccuracies or negligence herein.
This Document is provided merely for information and indicative purposes and does not constitute in any way a proposalto enter into any contract nor a public offering of financial products, nor advice or a recommendation to buy or sell anyfinancial products.
You are the exclusive addressee of this Document which as such cannot be delivered nor disclosed to any third parties norreproduced, in whole or in part, without the prior authorization of the Company.
To the purpose of representing the financial data consistently with the current perimeter of consolidation, all financial datadisplayed and commented in the “Key Financials – Pro forma“ section of this document refers to Consolidated FinancialReports prepared on a pro forma basis in order to include all the effects of the acquisition carried on during the year 2017.Limited to this purpose, the acquired companies have been assumed fully controlled from Jan. 1,2017 and consolidatedwith the line-by-line method from that date onwards. All the comparison between 2017 Pro forma data are based on the2016 Pro-forma Financial Data disclosed on April 12,2017, and prepared to take into account the effect of the businesscombination between GF Group S.p.A. and Glenalta Food S.p.A..
3
AGENDA
➢ GROUP OVERVIEW Pag. 4
➢ CORE ACTIVITIES Pag. 8
➢ KEY FINANCIALS – Pro forma FY 2017 & MID-LONG TERM STRATEGY Pag. 16
➢ APPENDIX Pag. 23
GROUP OVERVIEW
MAIN MILESTONES FROM 1940 TO DATE
5
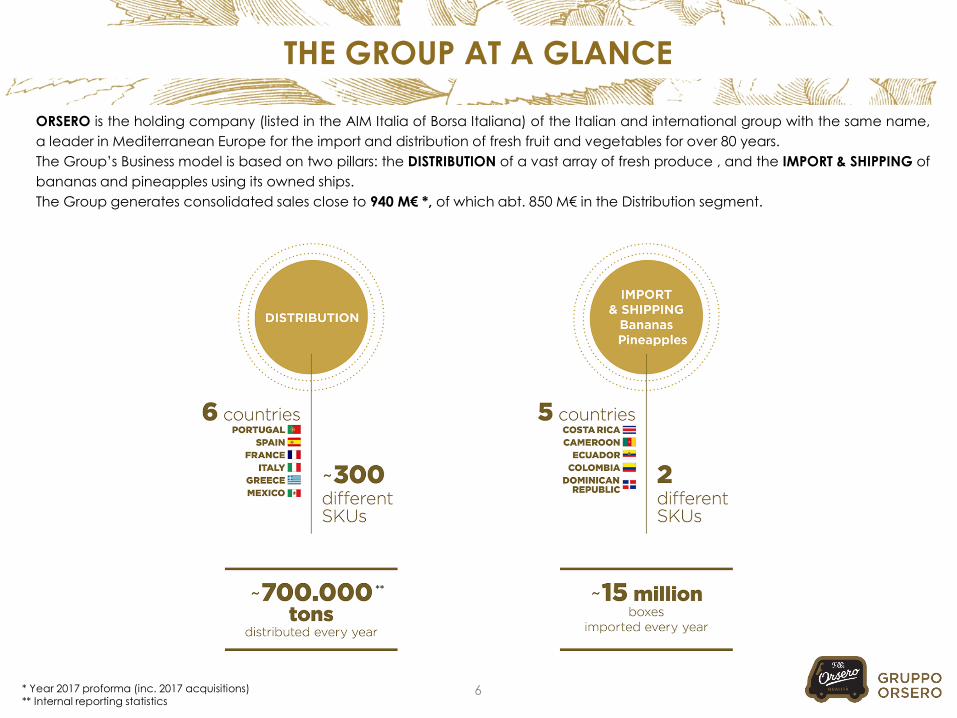
THE GROUP AT A GLANCE
6
**
* Year 2017 proforma (inc. 2017 acquisitions)** Internal reporting statistics
ORSERO is the holding company (listed in the AIM Italia of Borsa Italiana) of the Italian and international group with the same name,
a leader in Mediterranean Europe for the import and distribution of fresh fruit and vegetables for over 80 years.
The Group’s Business model is based on two pillars: the DISTRIBUTION of a vast array of fresh produce , and the IMPORT & SHIPPING of
bananas and pineapples using its owned ships.
The Group generates consolidated sales close to 940 M€ *, of which abt. 850 M€ in the Distribution segment.
GOVERNANCE & SHAREHOLDERS’ STRUCTURE
7
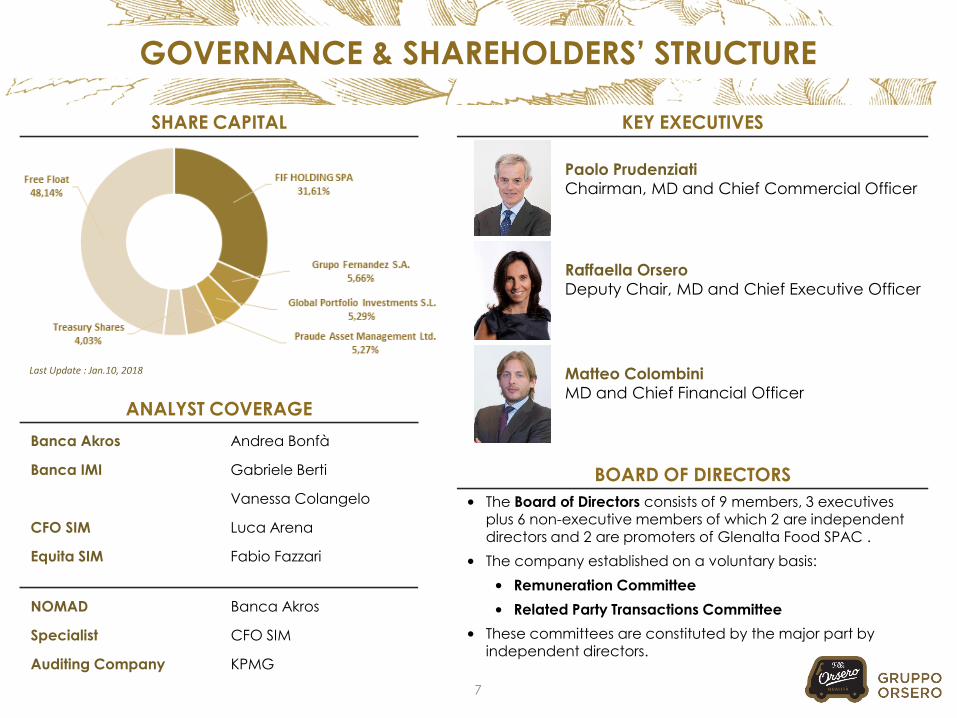
SHARE CAPITAL
Last Update : Jan.10, 2018
• The Board of Directors consists of 9 members, 3 executives plus 6 non-executive members of which 2 are independent directors and 2 are promoters of Glenalta Food SPAC .
• The company established on a voluntary basis:
• Remuneration Committee
• Related Party Transactions Committee
• These committees are constituted by the major part by independent directors.
KEY EXECUTIVES
Paolo Prudenziati
Chairman, MD and Chief Commercial Officer
Raffaella Orsero
Deputy Chair, MD and Chief Executive Officer
Matteo Colombini
MD and Chief Financial OfficerANALYST COVERAGE
Banca Akros Andrea Bonfà
Banca IMI Gabriele Berti
Vanessa Colangelo
CFO SIM Luca Arena
Equita SIM Fabio Fazzari
NOMAD Banca Akros
Specialist CFO SIM
Auditing Company KPMG
BOARD OF DIRECTORS

CORE ACTIVITIES
9
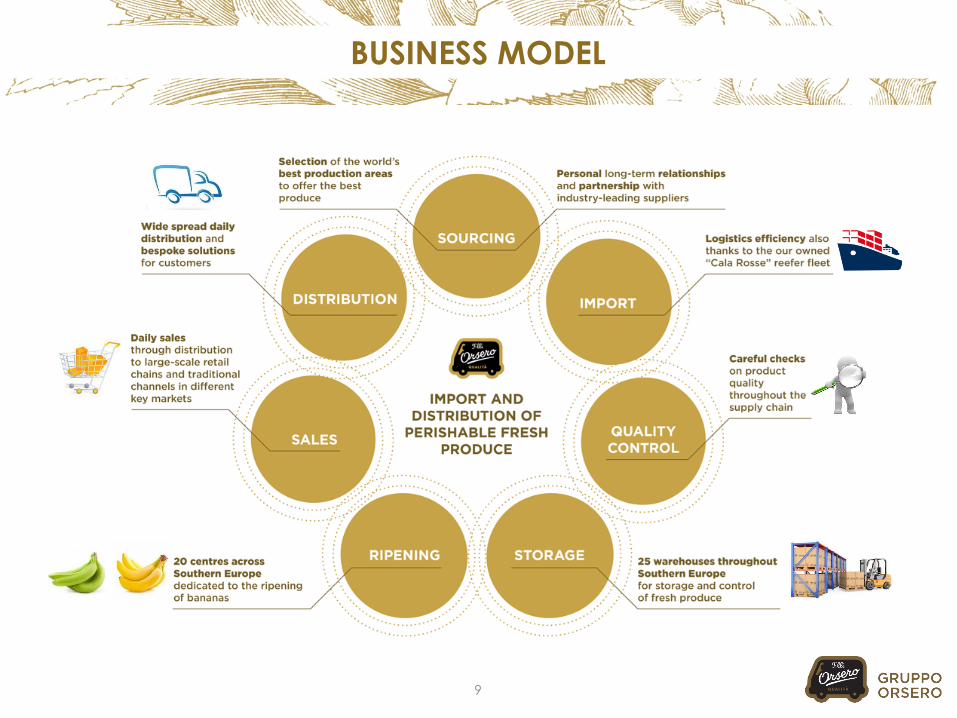
BUSINESS MODEL
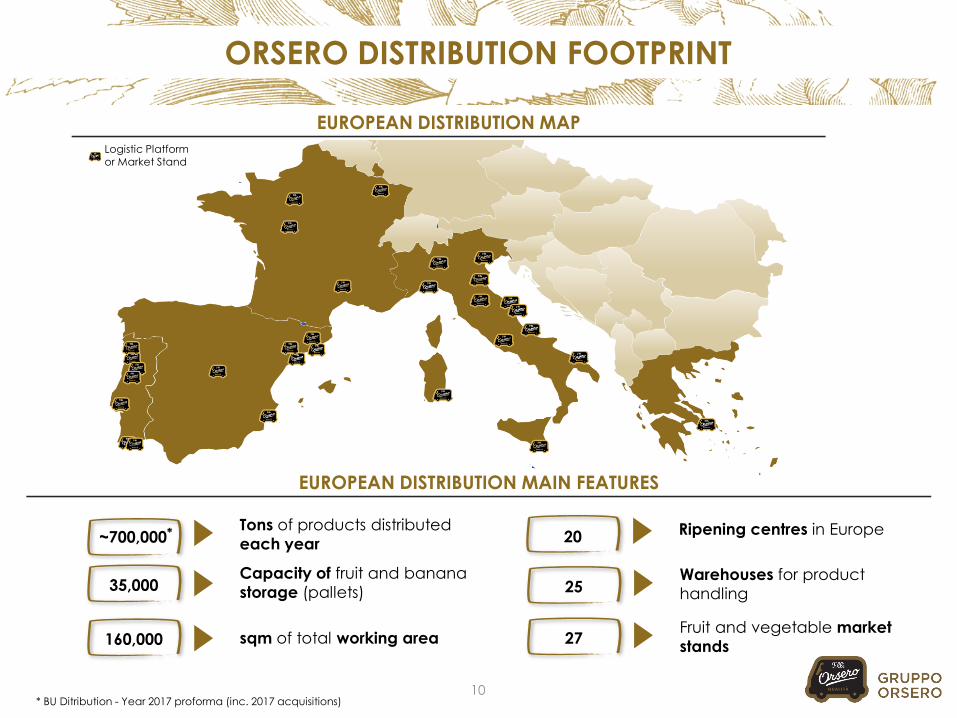
ORSERO DISTRIBUTION FOOTPRINT
27Fruit and vegetable market
stands
35,000Capacity of fruit and banana
storage (pallets)
160,000 sqm of total working area
25Warehouses for product
handling
20 Ripening centres in Europe~700,000*
Tons of products distributed
each year
10* BU Ditribution - Year 2017 proforma (inc. 2017 acquisitions)
Logistic Platform or Market Stand
EUROPEAN DISTRIBUTION MAIN FEATURES
EUROPEAN DISTRIBUTION MAP
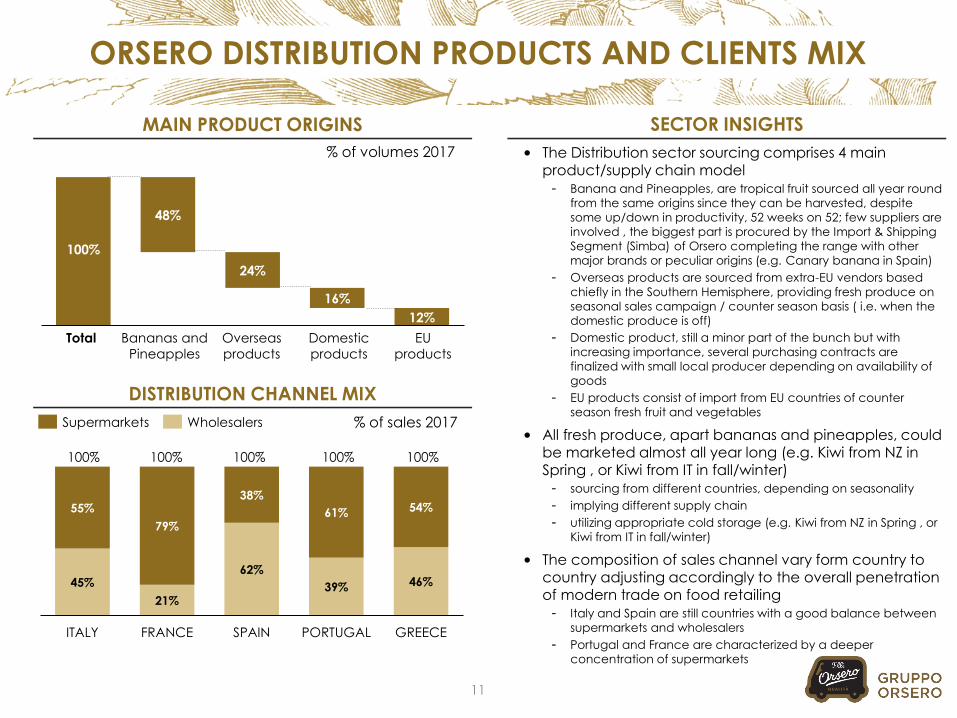
45%
21%
62%
39% 46%
55%
79%
38%
61% 54%
ITALY FRANCE SPAIN PORTUGAL GREECE
ORSERO DISTRIBUTION PRODUCTS AND CLIENTS MIX
DISTRIBUTION CHANNEL MIX
100%100%100% 100%100%
Supermarkets Wholesalers
11
100%
48%
24%
16%
12%
1 2 3 4 5
MAIN PRODUCT ORIGINS
% of volumes 2017
Overseas
products
Bananas and
Pineapples
Total EU
products
Domestic
products
% of sales 2017
• The Distribution sector sourcing comprises 4 main product/supply chain model- Banana and Pineapples, are tropical fruit sourced all year round
from the same origins since they can be harvested, despite
some up/down in productivity, 52 weeks on 52; few suppliers are
involved , the biggest part is procured by the Import & Shipping
Segment (Simba) of Orsero completing the range with other
major brands or peculiar origins (e.g. Canary banana in Spain)
- Overseas products are sourced from extra-EU vendors based
chiefly in the Southern Hemisphere, providing fresh produce on
seasonal sales campaign / counter season basis ( i.e. when the
domestic produce is off)
- Domestic product, still a minor part of the bunch but with
increasing importance, several purchasing contracts are
finalized with small local producer depending on availability of
goods
- EU products consist of import from EU countries of counter
season fresh fruit and vegetables
• All fresh produce, apart bananas and pineapples, could be marketed almost all year long (e.g. Kiwi from NZ in Spring , or Kiwi from IT in fall/winter)- sourcing from different countries, depending on seasonality
- implying different supply chain
- utilizing appropriate cold storage (e.g. Kiwi from NZ in Spring , or
Kiwi from IT in fall/winter)
• The composition of sales channel vary form country to country adjusting accordingly to the overall penetration of modern trade on food retailing- Italy and Spain are still countries with a good balance between
supermarkets and wholesalers
- Portugal and France are characterized by a deeper
concentration of supermarkets
SECTOR INSIGHTS
SHIPPING SERVICE FOR THE IMPORT OF BANANAS AND PINEAPPLES
THE "CALA ROSSA" ROUTE
"CALA ROSSA" MAIN FEATURES
Rio Haina
Moin
Turbo
Central
America
Europe
Tarragona
Vado Ligure
Lisbon
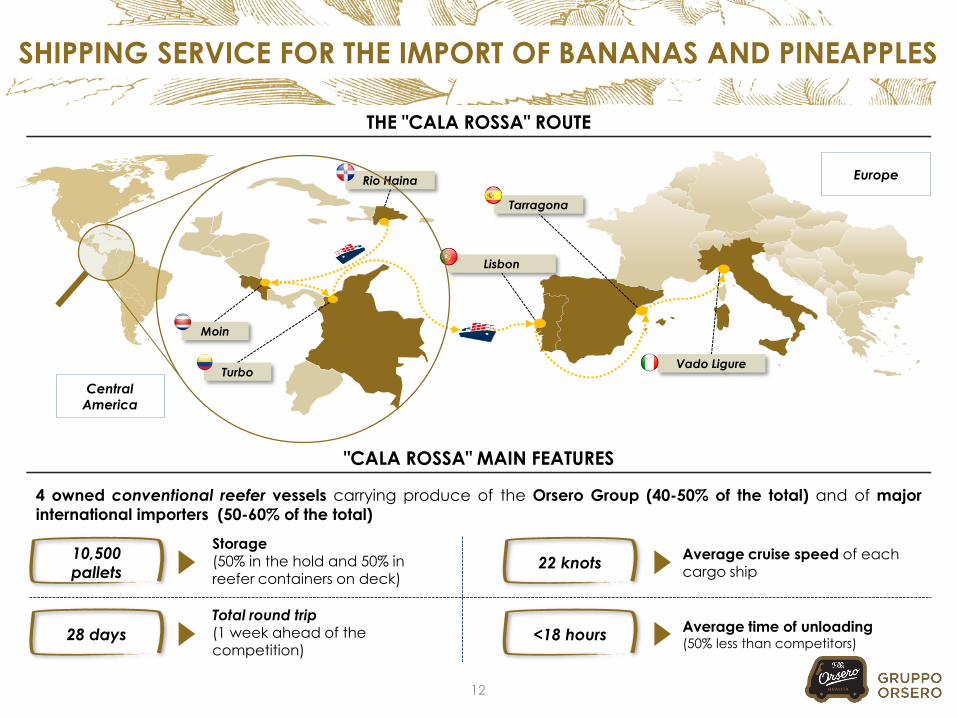
4 owned conventional reefer vessels carrying produce of the Orsero Group (40-50% of the total) and of major
international importers (50-60% of the total)
Storage (50% in the hold and 50% in reefer containers on deck)
10,500
palletsAverage cruise speed of each cargo ship
22 knots
Total round trip (1 week ahead of the competition)
28 daysAverage time of unloading(50% less than competitors)
<18 hours
12
COMPETITIVE LANDSCAPE
PRODUCER/IMPORTER
VERTICALLY INTEGRATED & COMMODITY
SPECIALIST
DISTRIBUTOR
HORIZONTALLY INTEGRATED &
WIDE PRODUCT RANGE
Activity
Main features
Players
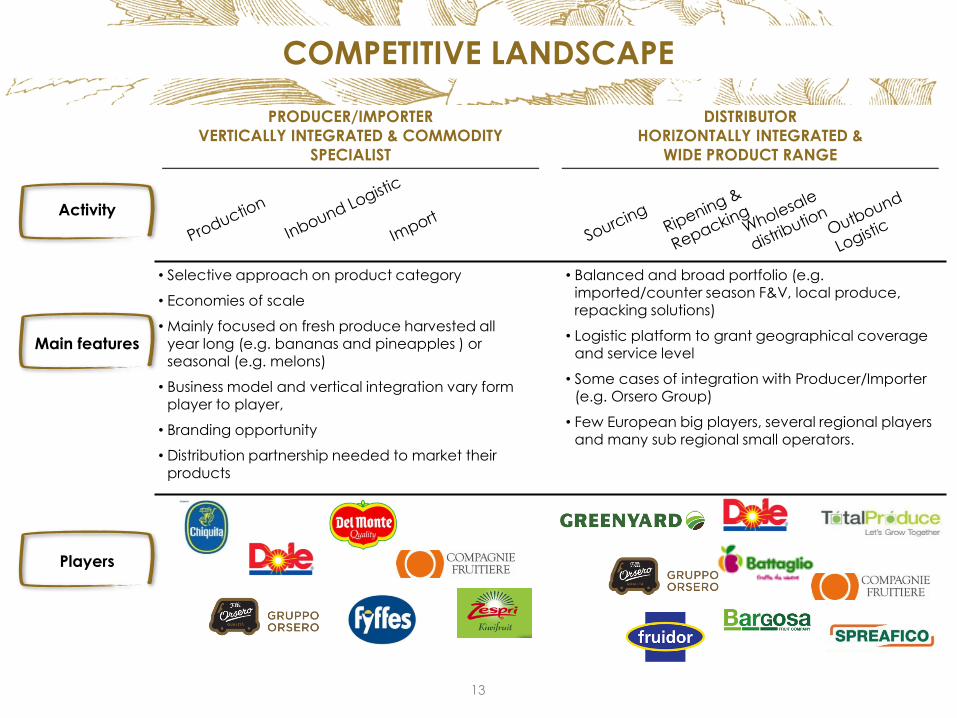
• Selective approach on product category
• Economies of scale
• Mainly focused on fresh produce harvested all year long (e.g. bananas and pineapples ) or seasonal (e.g. melons)
• Business model and vertical integration vary form player to player,
• Branding opportunity
• Distribution partnership needed to market their products
• Balanced and broad portfolio (e.g. imported/counter season F&V, local produce, repacking solutions)
• Logistic platform to grant geographical coverage and service level
• Some cases of integration with Producer/Importer (e.g. Orsero Group)
• Few European big players, several regional players and many sub regional small operators.
13
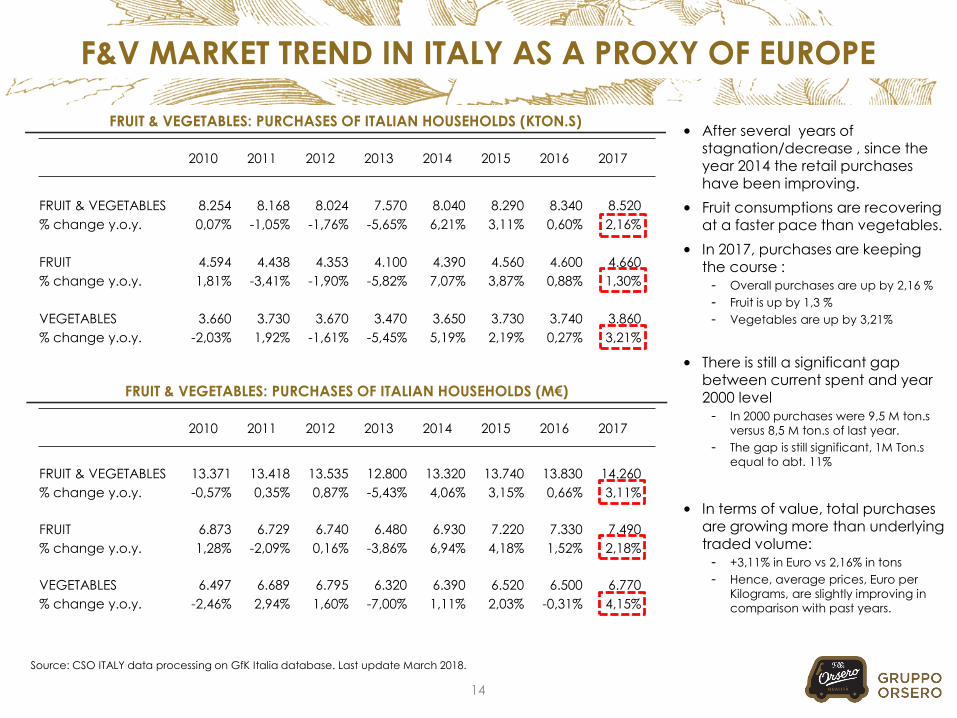
2010 2011 2012 2013 2014 2015 2016 2017
FRUIT & VEGETABLES 13.371 13.418 13.535 12.800 13.320 13.740 13.830 14.260
% change y.o.y. -0,57% 0,35% 0,87% -5,43% 4,06% 3,15% 0,66% 3,11%
FRUIT 6.873 6.729 6.740 6.480 6.930 7.220 7.330 7.490
% change y.o.y. 1,28% -2,09% 0,16% -3,86% 6,94% 4,18% 1,52% 2,18%
VEGETABLES 6.497 6.689 6.795 6.320 6.390 6.520 6.500 6.770
% change y.o.y. -2,46% 2,94% 1,60% -7,00% 1,11% 2,03% -0,31% 4,15%
2010 2011 2012 2013 2014 2015 2016 2017
FRUIT & VEGETABLES 8.254 8.168 8.024 7.570 8.040 8.290 8.340 8.520
% change y.o.y. 0,07% -1,05% -1,76% -5,65% 6,21% 3,11% 0,60% 2,16%
FRUIT 4.594 4.438 4.353 4.100 4.390 4.560 4.600 4.660
% change y.o.y. 1,81% -3,41% -1,90% -5,82% 7,07% 3,87% 0,88% 1,30%
VEGETABLES 3.660 3.730 3.670 3.470 3.650 3.730 3.740 3.860
% change y.o.y. -2,03% 1,92% -1,61% -5,45% 5,19% 2,19% 0,27% 3,21%
F&V MARKET TREND IN ITALY AS A PROXY OF EUROPE
• After several years of stagnation/decrease , since the year 2014 the retail purchases have been improving.
• Fruit consumptions are recovering at a faster pace than vegetables.
• In 2017, purchases are keeping the course : - Overall purchases are up by 2,16 %
- Fruit is up by 1,3 %
- Vegetables are up by 3,21%
• There is still a significant gap between current spent and year 2000 level
- In 2000 purchases were 9,5 M ton.s
versus 8,5 M ton.s of last year.
- The gap is still significant, 1M Ton.s
equal to abt. 11%
• In terms of value, total purchases are growing more than underlying traded volume:- +3,11% in Euro vs 2,16% in tons
- Hence, average prices, Euro per
Kilograms, are slightly improving in
comparison with past years.
Source: CSO ITALY data processing on GfK Italia database. Last update March 2018.
14
FRUIT & VEGETABLES: PURCHASES OF ITALIAN HOUSEHOLDS (KTON.S)
FRUIT & VEGETABLES: PURCHASES OF ITALIAN HOUSEHOLDS (M€)
15
F&V MARKET IN EU-28
F&V – SUPPLY(*) BY COUNTRY
F&V – SUPPLY(*) PER CAPITA/PER DAY
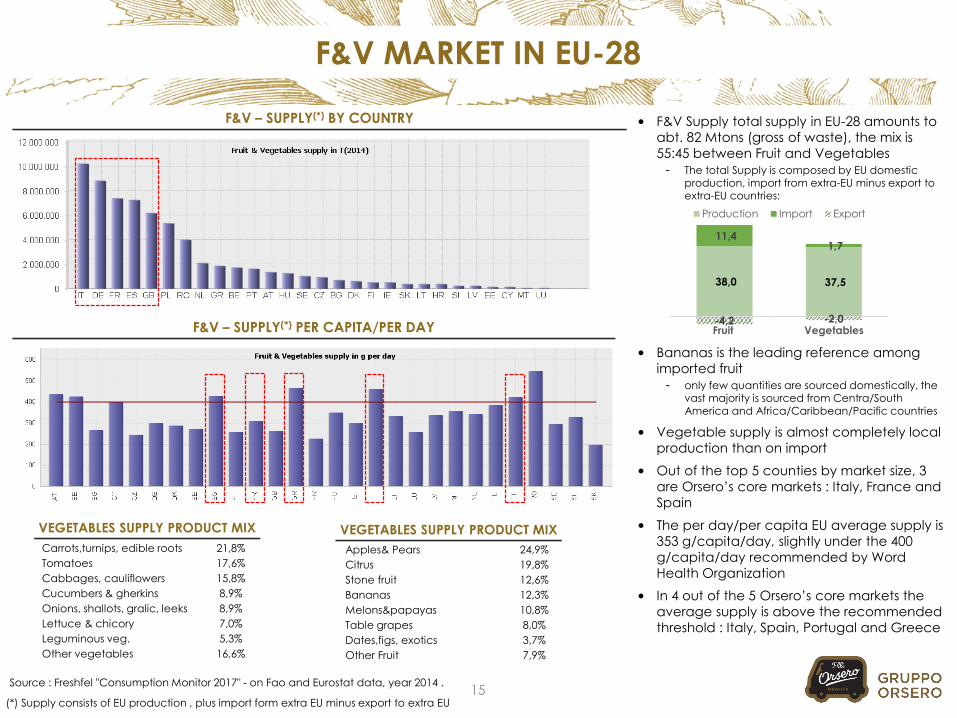
• F&V Supply total supply in EU-28 amounts to
abt. 82 Mtons (gross of waste), the mix is
55:45 between Fruit and Vegetables
- The total Supply is composed by EU domestic production, import from extra-EU minus export to extra-EU countries:
• Bananas is the leading reference among
imported fruit
- only few quantities are sourced domestically, the vast majority is sourced from Centra/South America and Africa/Caribbean/Pacific countries
• Vegetable supply is almost completely local
production than on import
• Out of the top 5 counties by market size, 3
are Orsero’s core markets : Italy, France and
Spain
• The per day/per capita EU average supply is
353 g/capita/day, slightly under the 400
g/capita/day recommended by Word
Health Organization
• In 4 out of the 5 Orsero’s core markets the
average supply is above the recommended
threshold : Italy, Spain, Portugal and Greece
Source : Freshfel "Consumption Monitor 2017" - on Fao and Eurostat data, year 2014 .
(*) Supply consists of EU production , plus import form extra EU minus export to extra EU
Apples& Pears 24,9%
Citrus 19,8%
Stone fruit 12,6%
Bananas 12,3%
Melons&papayas 10,8%
Table grapes 8,0%
Dates,figs, exotics 3,7%
Other Fruit 7,9%
Carrots,turnips, edible roots 21,8%
Tomatoes 17,6%
Cabbages, cauliflowers 15,8%
Cucumbers & gherkins 8,9%
Onions, shallots, gralic, leeks 8,9%
Lettuce & chicory 7,0%
Leguminous veg. 5,3%
Other vegetables 16,6%
VEGETABLES SUPPLY PRODUCT MIX VEGETABLES SUPPLY PRODUCT MIX
38,0 37,5
11,4 1,7
-4,2 -2,0 Fruit Vegetables
Production Import Export
KEY FINANCIALS – PRO FORMA FY 2017
& MID-LONG TERM STRATEGY
ACHIEVEMENTS 2017
17
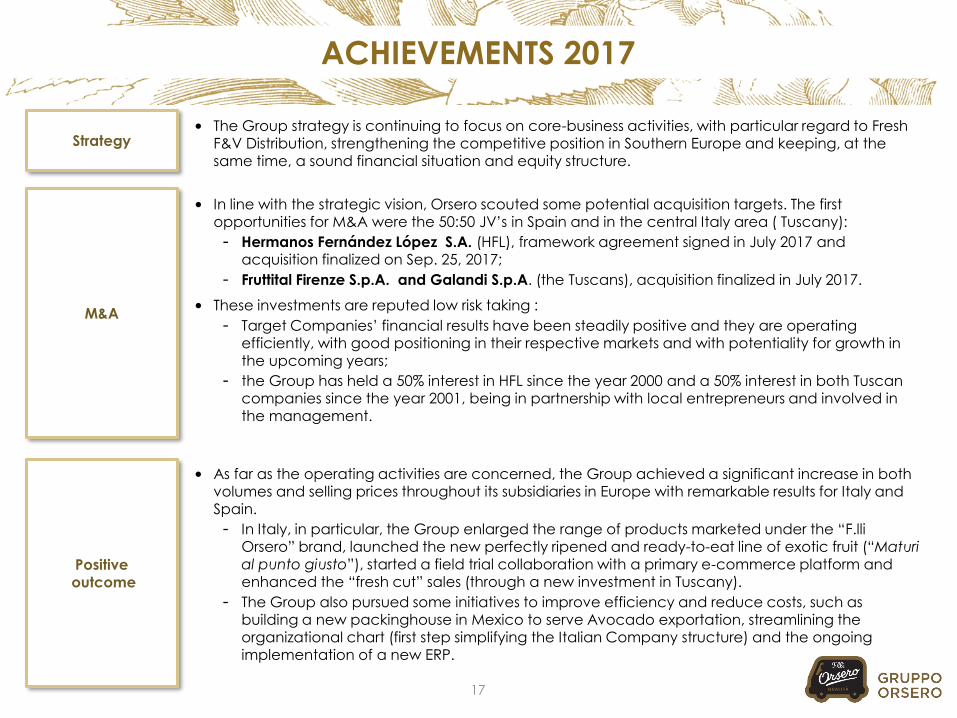
• In line with the strategic vision, Orsero scouted some potential acquisition targets. The first opportunities for M&A were the 50:50 JV’s in Spain and in the central Italy area ( Tuscany):
- Hermanos Fernández López S.A. (HFL), framework agreement signed in July 2017 and acquisition finalized on Sep. 25, 2017;
- Fruttital Firenze S.p.A. and Galandi S.p.A. (the Tuscans), acquisition finalized in July 2017.
• These investments are reputed low risk taking :
- Target Companies’ financial results have been steadily positive and they are operating efficiently, with good positioning in their respective markets and with potentiality for growth in the upcoming years;
- the Group has held a 50% interest in HFL since the year 2000 and a 50% interest in both Tuscan companies since the year 2001, being in partnership with local entrepreneurs and involved in the management.
• As far as the operating activities are concerned, the Group achieved a significant increase in both volumes and selling prices throughout its subsidiaries in Europe with remarkable results for Italy and Spain.
- In Italy, in particular, the Group enlarged the range of products marketed under the “F.lliOrsero” brand, launched the new perfectly ripened and ready-to-eat line of exotic fruit (“Maturial punto giusto”), started a field trial collaboration with a primary e-commerce platform and enhanced the “fresh cut” sales (through a new investment in Tuscany).
- The Group also pursued some initiatives to improve efficiency and reduce costs, such as building a new packinghouse in Mexico to serve Avocado exportation, streamlining the organizational chart (first step simplifying the Italian Company structure) and the ongoing implementation of a new ERP.
M&A
Positiveoutcome
Strategy• The Group strategy is continuing to focus on core-business activities, with particular regard to Fresh
F&V Distribution, strengthening the competitive position in Southern Europe and keeping, at the same time, a sound financial situation and equity structure.
M€ FY 2017 FY 2016 Change
pro-forma pro-forma
Net Sales 937,8 685,0 252,9
of which : Like-for-like 707,0 685,0 22,0
M&A 230,8 230,8
Adjusted EBITDA 31,3 35,2 ( 3,9)
Net Profit 15,1 18,3 ( 3,2)
M€ FY 2017 FY 2016 Change
pro-forma pro-forma Chg.
Net Invested Capital 192,2 165,6 26,7
Total Equity 145,7 116,5 29,3
Net Financial Position 46,5 49,1 ( 2,6)
NFP/ Total Equity 0,32 0,42
NFP/ Adjusted EBITDA 1,48 1,39
EXECUTIVE SUMMARY
18
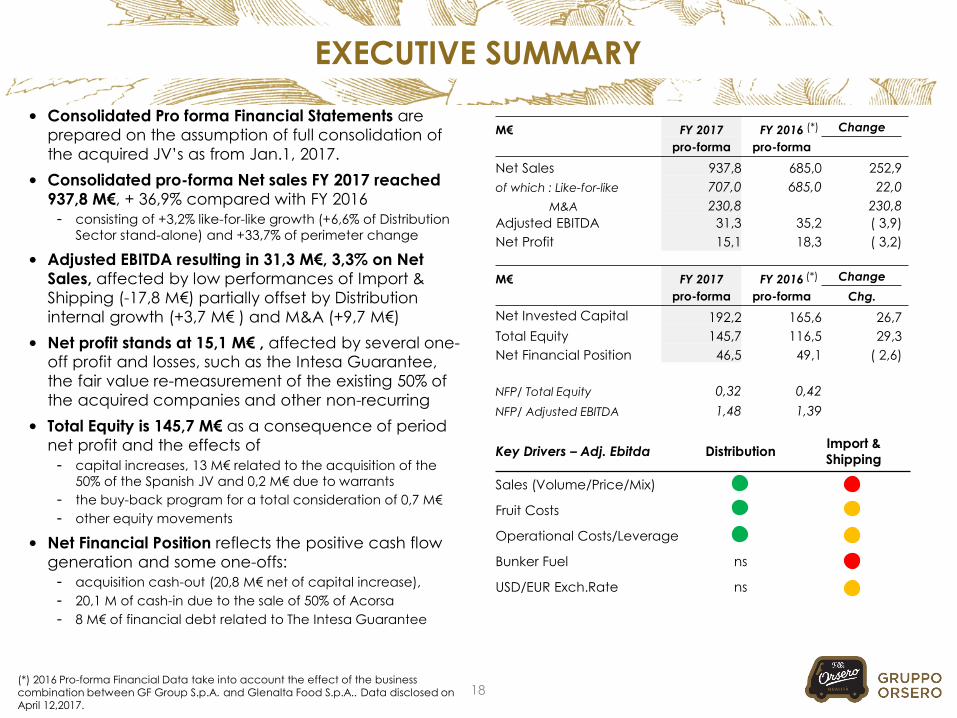
• Consolidated Pro forma Financial Statements are
prepared on the assumption of full consolidation of
the acquired JV’s as from Jan.1, 2017.
• Consolidated pro-forma Net sales FY 2017 reached
937,8 M€, + 36,9% compared with FY 2016
- consisting of +3,2% like-for-like growth (+6,6% of Distribution
Sector stand-alone) and +33,7% of perimeter change
• Adjusted EBITDA resulting in 31,3 M€, 3,3% on Net
Sales, affected by low performances of Import &
Shipping (-17,8 M€) partially offset by Distribution
internal growth (+3,7 M€ ) and M&A (+9,7 M€)
• Net profit stands at 15,1 M€ , affected by several one-off profit and losses, such as the Intesa Guarantee,
the fair value re-measurement of the existing 50% of
the acquired companies and other non-recurring
• Total Equity is 145,7 M€ as a consequence of period
net profit and the effects of
- capital increases, 13 M€ related to the acquisition of the
50% of the Spanish JV and 0,2 M€ due to warrants
- the buy-back program for a total consideration of 0,7 M€
- other equity movements
• Net Financial Position reflects the positive cash flow
generation and some one-offs:
- acquisition cash-out (20,8 M€ net of capital increase),
- 20,1 M of cash-in due to the sale of 50% of Acorsa
- 8 M€ of financial debt related to The Intesa Guarantee
(*) 2016 Pro-forma Financial Data take into account the effect of the business combination between GF Group S.p.A. and Glenalta Food S.p.A.. Data disclosed on April 12,2017.
(*)
Key Drivers – Adj. Ebitda DistributionImport &
Shipping
Sales (Volume/Price/Mix)
Fruit Costs
Operational Costs/Leverage
Bunker Fuel ns
USD/EUR Exch.Rate ns
(*)
SEGMENT REPORTING HIGHLIGHTS
19
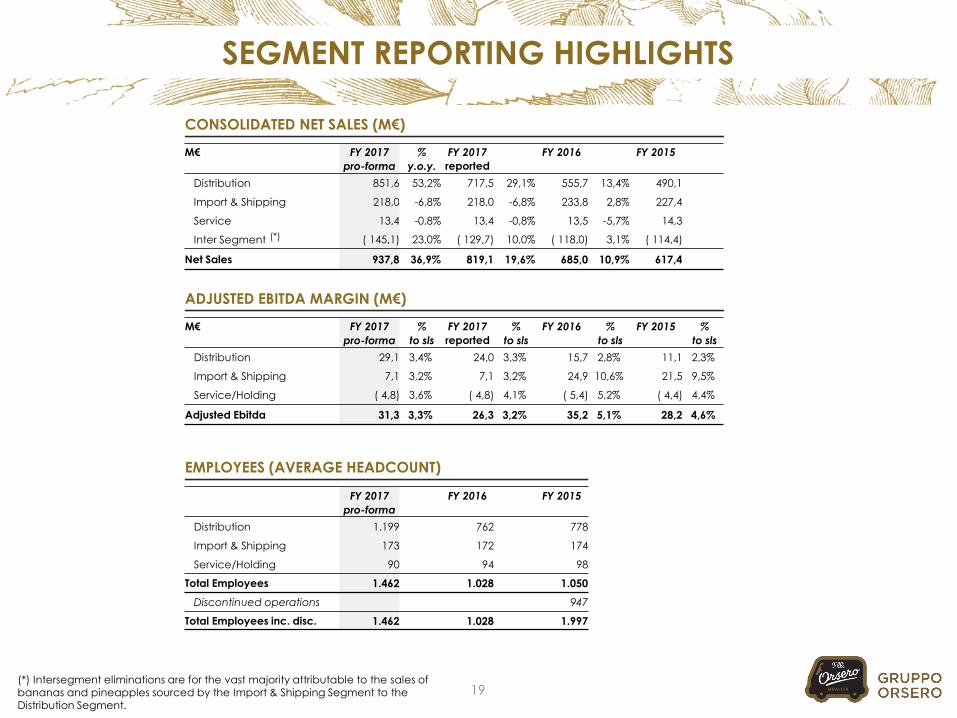
CONSOLIDATED NET SALES (M€)
ADJUSTED EBITDA MARGIN (M€)
EMPLOYEES (AVERAGE HEADCOUNT)
M€ FY 2017 % FY 2017 FY 2016 FY 2015
pro-forma y.o.y. reported
Distribution 851,6 53,2% 717,5 29,1% 555,7 13,4% 490,1
Import & Shipping 218,0 -6,8% 218,0 -6,8% 233,8 2,8% 227,4
Service 13,4 -0,8% 13,4 -0,8% 13,5 -5,7% 14,3
Inter Segment ( 145,1) 23,0% ( 129,7) 10,0% ( 118,0) 3,1% ( 114,4)
Net Sales 937,8 36,9% 819,1 19,6% 685,0 10,9% 617,4
M€ FY 2017 % FY 2017 % FY 2016 % FY 2015 %
pro-forma to sls reported to sls to sls to sls
Distribution 29,1 3,4% 24,0 3,3% 15,7 2,8% 11,1 2,3%
Import & Shipping 7,1 3,2% 7,1 3,2% 24,9 10,6% 21,5 9,5%
Service/Holding ( 4,8) 3,6% ( 4,8) 4,1% ( 5,4) 5,2% ( 4,4) 4,4%
Adjusted Ebitda 31,3 3,3% 26,3 3,2% 35,2 5,1% 28,2 4,6%
FY 2017 FY 2016 FY 2015
pro-forma
Distribution 1.199 762 778
Import & Shipping 173 172 174
Service/Holding 90 94 98
Total Employees 1.462 1.028 1.050
Discontinued operations 947
Total Employees inc. disc. 1.462 1.028 1.997
(*) Intersegment eliminations are for the vast majority attributable to the sales of bananas and pineapples sourced by the Import & Shipping Segment to the Distribution Segment.
(*)
Banana
30%
Pines
5%
Exotic
13%Kiwi
13%
Citrus
9%
Apples/
Pears
7%
Others Fruit and
Vegetables
23%
FOCUS ON DISTRIBUTION SEGMENT ECONOMICS
20
490 556 592
490 556 592
852
66 37
259
11,1 15,7
19,4
11,1 15,7
19,4
29,1 4,7
3,7
9,7
DISTRIBUTION GEOGRAPHICAL MIX FY 2017 PRO-FORMA
Italy
42%
France
23%
Spain
23%
Portugal
6%
Greece
3%
Mexico
3%
DISTRIBUTION PRODUCT MIX FY 2017 PRO-FORMA (*)DISTRIBUTION SEGMENT – SALES TREND (M€)
DISTRIBUTION SEGMENT – EBITDA TREND (M€)
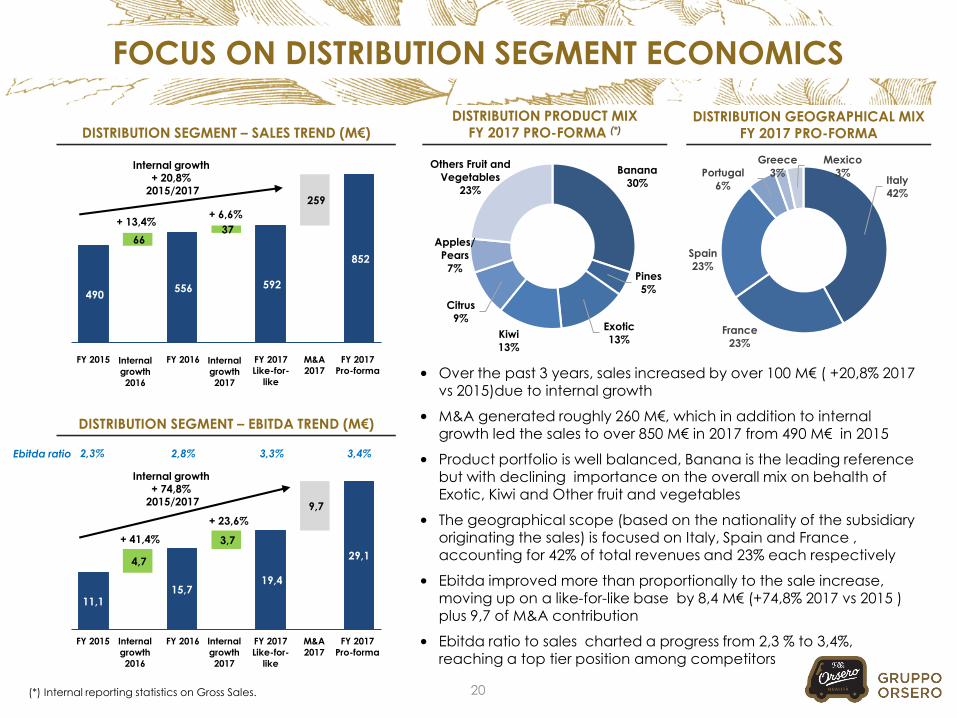
• Over the past 3 years, sales increased by over 100 M€ ( +20,8% 2017 vs 2015)due to internal growth
• M&A generated roughly 260 M€, which in addition to internal growth led the sales to over 850 M€ in 2017 from 490 M€ in 2015
• Product portfolio is well balanced, Banana is the leading reference but with declining importance on the overall mix on behalth of Exotic, Kiwi and Other fruit and vegetables
• The geographical scope (based on the nationality of the subsidiary originating the sales) is focused on Italy, Spain and France , accounting for 42% of total revenues and 23% each respectively
• Ebitda improved more than proportionally to the sale increase, moving up on a like-for-like base by 8,4 M€ (+74,8% 2017 vs 2015 ) plus 9,7 of M&A contribution
• Ebitda ratio to sales charted a progress from 2,3 % to 3,4%, reaching a top tier position among competitors
+ 6,6%+ 13,4%
FY 2015 Internal
growth
2016
FY 2016 FY 2017
Like-for-
like
M&A
2017Internal
growth
2017
FY 2017
Pro-forma
FY 2015 Internal
growth
2016
FY 2016 FY 2017
Like-for-
like
M&A
2017
Internal
growth
2017
FY 2017
Pro-forma
+ 41,4%
+ 23,6%
Internal growth + 74,8%
2015/2017
2,3% 2,8% 3,3% 3,4%Ebitda ratio
Internal growth + 20,8%
2015/2017
(*) Internal reporting statistics on Gross Sales.
MID-LONG TERM STRATEGY
21
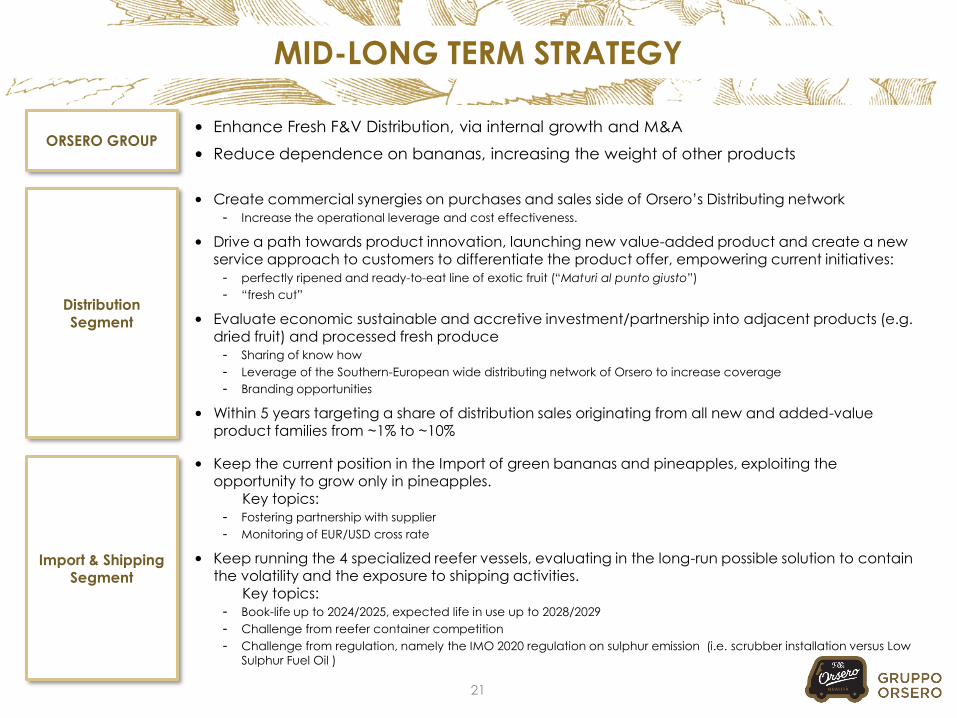
• Create commercial synergies on purchases and sales side of Orsero’s Distributing network- Increase the operational leverage and cost effectiveness.
• Drive a path towards product innovation, launching new value-added product and create a new service approach to customers to differentiate the product offer, empowering current initiatives:
- perfectly ripened and ready-to-eat line of exotic fruit (“Maturi al punto giusto”)
- “fresh cut”
• Evaluate economic sustainable and accretive investment/partnership into adjacent products (e.g. dried fruit) and processed fresh produce- Sharing of know how
- Leverage of the Southern-European wide distributing network of Orsero to increase coverage
- Branding opportunities
• Within 5 years targeting a share of distribution sales originating from all new and added-value product families from ~1% to ~10%
• Keep the current position in the Import of green bananas and pineapples, exploiting the opportunity to grow only in pineapples.
Key topics:- Fostering partnership with supplier
- Monitoring of EUR/USD cross rate
• Keep running the 4 specialized reefer vessels, evaluating in the long-run possible solution to contain the volatility and the exposure to shipping activities.
Key topics:- Book-life up to 2024/2025, expected life in use up to 2028/2029
- Challenge from reefer container competition
- Challenge from regulation, namely the IMO 2020 regulation on sulphur emission (i.e. scrubber installation versus Low
Sulphur Fuel Oil )
Distribution Segment
Import & Shipping Segment
ORSERO GROUP• Enhance Fresh F&V Distribution, via internal growth and M&A
• Reduce dependence on bananas, increasing the weight of other products
ORSERO GROUP IN A NUTSHELL
22
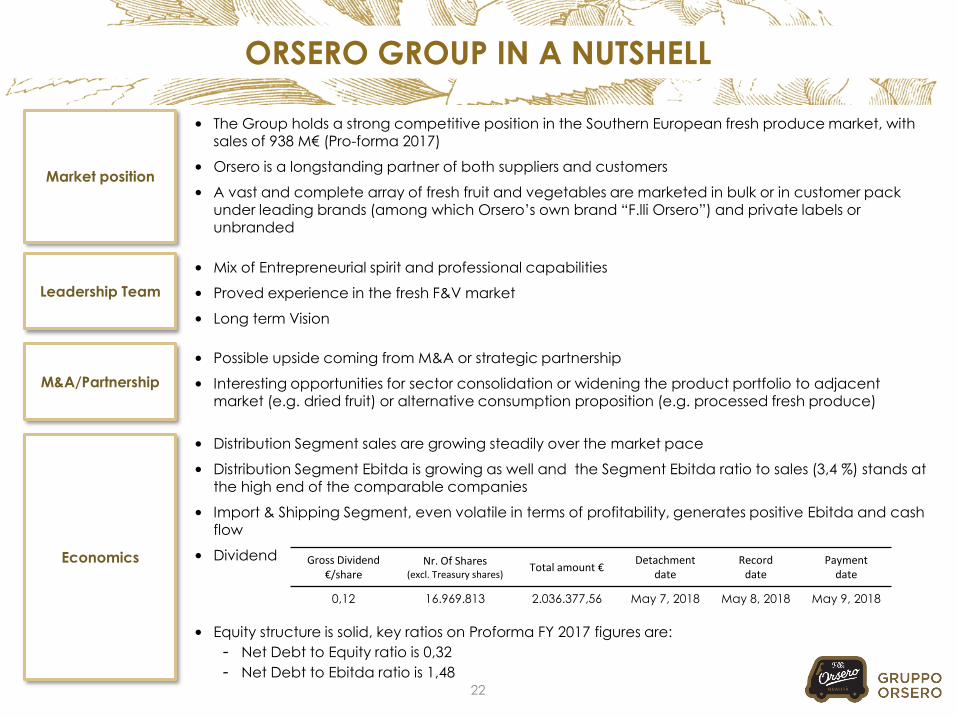
• Mix of Entrepreneurial spirit and professional capabilities
• Proved experience in the fresh F&V market
• Long term Vision
• Distribution Segment sales are growing steadily over the market pace
• Distribution Segment Ebitda is growing as well and the Segment Ebitda ratio to sales (3,4 %) stands at the high end of the comparable companies
• Import & Shipping Segment, even volatile in terms of profitability, generates positive Ebitda and cash flow
• Dividend
• Equity structure is solid, key ratios on Proforma FY 2017 figures are:
- Net Debt to Equity ratio is 0,32
- Net Debt to Ebitda ratio is 1,48
Leadership Team
Economics
Market position
• The Group holds a strong competitive position in the Southern European fresh produce market, with sales of 938 M€ (Pro-forma 2017)
• Orsero is a longstanding partner of both suppliers and customers
• A vast and complete array of fresh fruit and vegetables are marketed in bulk or in customer pack under leading brands (among which Orsero’s own brand “F.lli Orsero”) and private labels or unbranded
M&A/Partnership
• Possible upside coming from M&A or strategic partnership
• Interesting opportunities for sector consolidation or widening the product portfolio to adjacent market (e.g. dried fruit) or alternative consumption proposition (e.g. processed fresh produce)
Gross Dividend€/share
Nr. Of Shares (excl. Treasury shares)
Total amount €Detachment
dateRecord
datePayment
date
0,12 16.969.813 2.036.377,56 May 7, 2018 May 8, 2018 May 9, 2018
APPENDIX
SHAREHOLDERS’ STRUCTURE DETAILS
24
Current
# Shares
% of share
capital
% of voting
rights
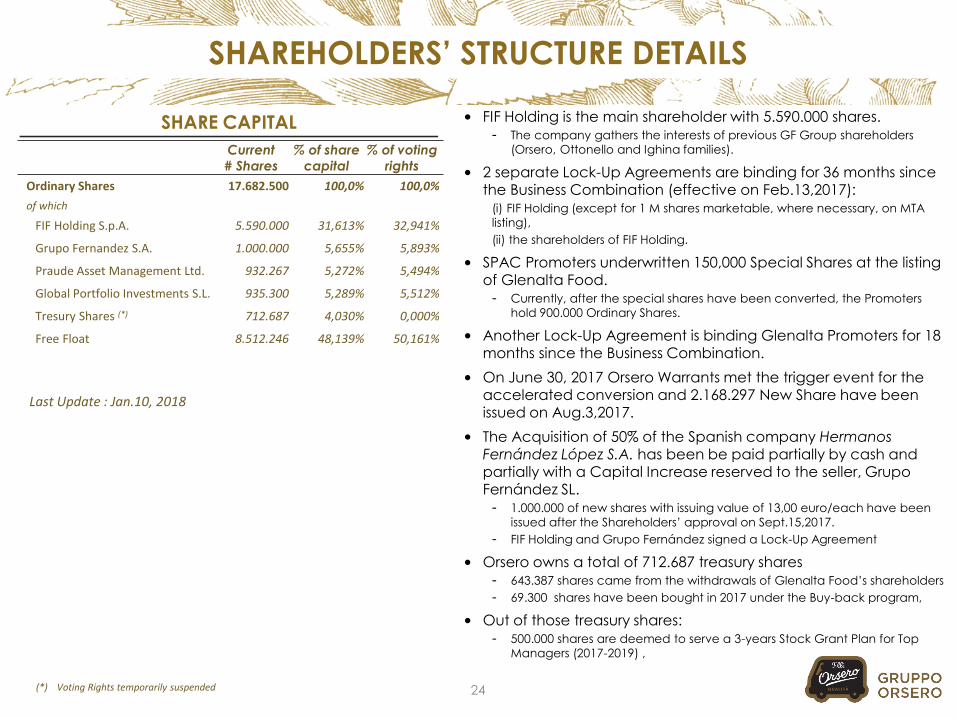
Ordinary Shares 17.682.500 100,0% 100,0%
of which
FIF Holding S.p.A. 5.590.000 31,613% 32,941%
Grupo Fernandez S.A. 1.000.000 5,655% 5,893%
Praude Asset Management Ltd. 932.267 5,272% 5,494%
Global Portfolio Investments S.L. 935.300 5,289% 5,512%
Tresury Shares (*) 712.687 4,030% 0,000%
Free Float 8.512.246 48,139% 50,161%
SHARE CAPITAL
(*) Voting Rights temporarily suspended
Last Update : Jan.10, 2018
• FIF Holding is the main shareholder with 5.590.000 shares. - The company gathers the interests of previous GF Group shareholders
(Orsero, Ottonello and Ighina families).
• 2 separate Lock-Up Agreements are binding for 36 months since the Business Combination (effective on Feb.13,2017):
(i) FIF Holding (except for 1 M shares marketable, where necessary, on MTA
listing),
(ii) the shareholders of FIF Holding.
• SPAC Promoters underwritten 150,000 Special Shares at the listing of Glenalta Food. - Currently, after the special shares have been converted, the Promoters
hold 900.000 Ordinary Shares.
• Another Lock-Up Agreement is binding Glenalta Promoters for 18 months since the Business Combination.
• On June 30, 2017 Orsero Warrants met the trigger event for the accelerated conversion and 2.168.297 New Share have been issued on Aug.3,2017.
• The Acquisition of 50% of the Spanish company Hermanos Fernández López S.A. has been be paid partially by cash and partially with a Capital Increase reserved to the seller, Grupo Fernández SL.- 1.000.000 of new shares with issuing value of 13,00 euro/each have been
issued after the Shareholders’ approval on Sept.15,2017.
- FIF Holding and Grupo Fernández signed a Lock-Up Agreement
• Orsero owns a total of 712.687 treasury shares - 643.387 shares came from the withdrawals of Glenalta Food’s shareholders
- 69.300 shares have been bought in 2017 under the Buy-back program,
• Out of those treasury shares: - 500.000 shares are deemed to serve a 3-years Stock Grant Plan for Top
Managers (2017-2019) ,
GOVERNANCE DETAILS
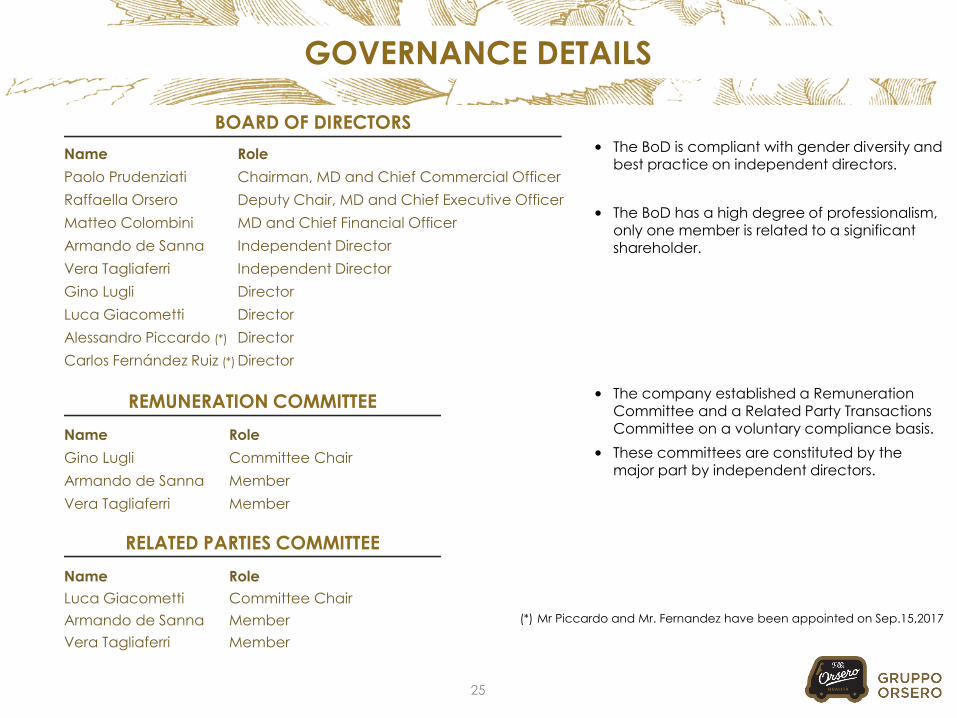
• The BoD is compliant with gender diversity and best practice on independent directors.
• The BoD has a high degree of professionalism, only one member is related to a significant shareholder.
• The company established a Remuneration Committee and a Related Party Transactions Committee on a voluntary compliance basis.
• These committees are constituted by the major part by independent directors.
25
BOARD OF DIRECTORS
Name Role
Paolo Prudenziati Chairman, MD and Chief Commercial Officer
Raffaella Orsero Deputy Chair, MD and Chief Executive Officer
Matteo Colombini MD and Chief Financial Officer
Armando de Sanna Independent Director
Vera Tagliaferri Independent Director
Gino Lugli Director
Luca Giacometti Director
Alessandro Piccardo (*) Director
Carlos Fernández Ruiz (*) Director
Name Role
Luca Giacometti Committee Chair
Armando de Sanna Member
Vera Tagliaferri Member
Name Role
Gino Lugli Committee Chair
Armando de Sanna Member
Vera Tagliaferri Member
REMUNERATION COMMITTEE
RELATED PARTIES COMMITTEE
(*) Mr Piccardo and Mr. Fernandez have been appointed on Sep.15,2017
CONDENSED COMPANY STRUCTURE
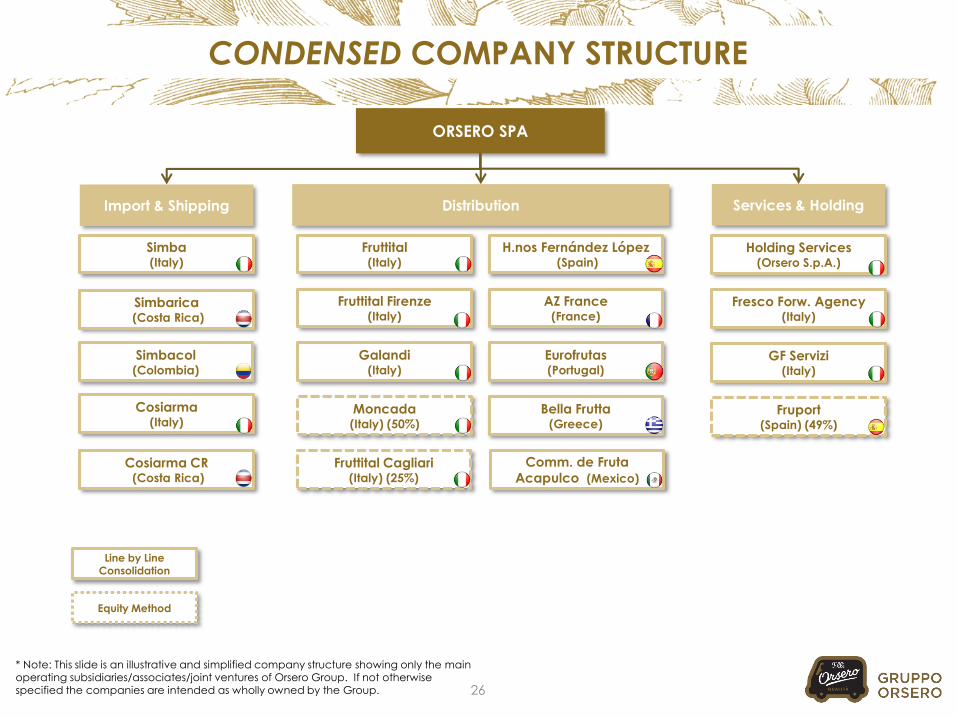
ORSERO SPA
DistributionImport & Shipping Services & Holding
Fruttital(Italy)
AZ France(France)
Eurofrutas(Portugal)
Bella Frutta(Greece)
H.nos Fernández López(Spain)
Fruttital Firenze(Italy)
Galandi(Italy)
26
Moncada(Italy) (50%)
Fruttital Cagliari(Italy) (25%)
Cosiarma(Italy)
Simba(Italy)
Simbarica(Costa Rica)
Simbacol(Colombia)
Cosiarma CR(Costa Rica)
Comm. de Fruta
Acapulco (Mexico)
Fresco Forw. Agency(Italy)
Fruport(Spain) (49%)
GF Servizi (Italy)
Holding Services(Orsero S.p.A.)
Line by Line Consolidation
Equity Method
* Note: This slide is an illustrative and simplified company structure showing only the main operating subsidiaries/associates/joint ventures of Orsero Group. If not otherwise specified the companies are intended as wholly owned by the Group.
GROUP MANAGEMENT TEAM – ORSERO S.P.A.
27
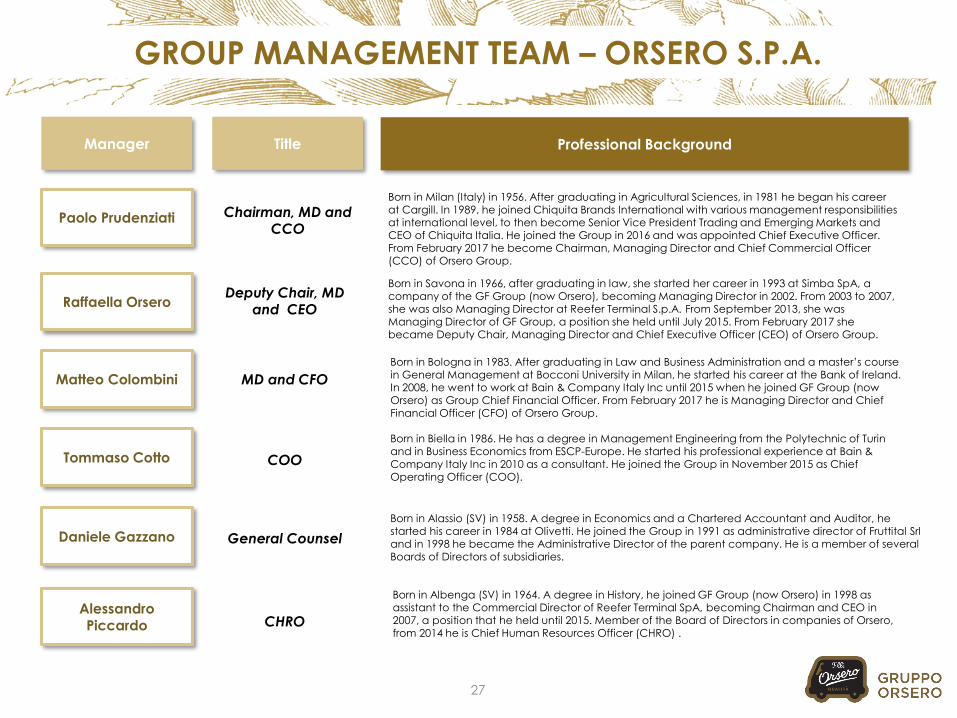
Manager Title Professional Background
Raffaella Orsero
Paolo Prudenziati
Matteo Colombini
Tommaso Cotto
Daniele Gazzano
Born in Savona in 1966, after graduating in law, she started her career in 1993 at Simba SpA, a company of the GF Group (now Orsero), becoming Managing Director in 2002. From 2003 to 2007, she was also Managing Director at Reefer Terminal S.p.A. From September 2013, she was Managing Director of GF Group, a position she held until July 2015. From February 2017 she became Deputy Chair, Managing Director and Chief Executive Officer (CEO) of Orsero Group.
Born in Milan (Italy) in 1956. After graduating in Agricultural Sciences, in 1981 he began his career at Cargill. In 1989, he joined Chiquita Brands International with various management responsibilities at international level, to then become Senior Vice President Trading and Emerging Markets and CEO of Chiquita Italia. He joined the Group in 2016 and was appointed Chief Executive Officer. From February 2017 he become Chairman, Managing Director and Chief Commercial Officer (CCO) of Orsero Group.
Born in Bologna in 1983. After graduating in Law and Business Administration and a master’s course in General Management at Bocconi University in Milan, he started his career at the Bank of Ireland. In 2008, he went to work at Bain & Company Italy Inc until 2015 when he joined GF Group (now Orsero) as Group Chief Financial Officer. From February 2017 he is Managing Director and Chief Financial Officer (CFO) of Orsero Group.
Born in Biella in 1986. He has a degree in Management Engineering from the Polytechnic of Turin and in Business Economics from ESCP-Europe. He started his professional experience at Bain & Company Italy Inc in 2010 as a consultant. He joined the Group in November 2015 as Chief Operating Officer (COO).
Born in Alassio (SV) in 1958. A degree in Economics and a Chartered Accountant and Auditor, he started his career in 1984 at Olivetti. He joined the Group in 1991 as administrative director of Fruttital Srland in 1998 he became the Administrative Director of the parent company. He is a member of several Boards of Directors of subsidiaries.
Alessandro Piccardo
Born in Albenga (SV) in 1964. A degree in History, he joined GF Group (now Orsero) in 1998 as assistant to the Commercial Director of Reefer Terminal SpA, becoming Chairman and CEO in 2007, a position that he held until 2015. Member of the Board of Directors in companies of Orsero, from 2014 he is Chief Human Resources Officer (CHRO) .
Deputy Chair, MD and CEO
Chairman, MD and CCO
MD and CFO
COO
General Counsel
CHRO
MAIN SUBSIDIARIES’ MANAGEMENT TEAM
28
Manager Company Professional Background
Philippe Pons
João Mendes
AZ France (FR)
Eurofrutas (PT)
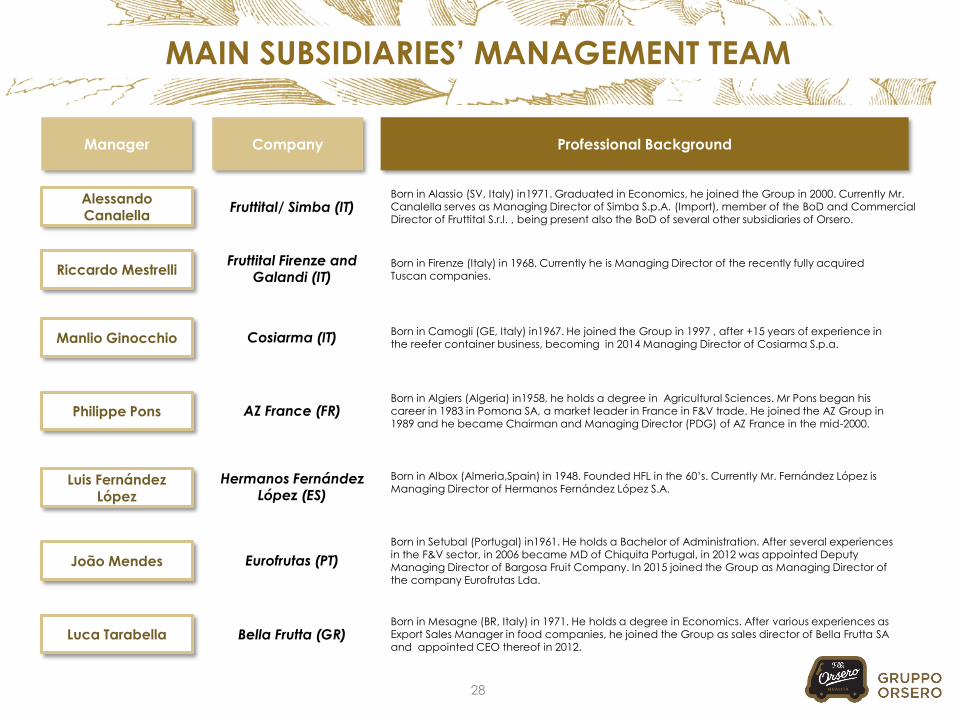
Born in Algiers (Algeria) in1958, he holds a degree in Agricultural Sciences. Mr Pons began his career in 1983 in Pomona SA, a market leader in France in F&V trade. He joined the AZ Group in 1989 and he became Chairman and Managing Director (PDG) of AZ France in the mid-2000.
Born in Setubal (Portugal) in1961. He holds a Bachelor of Administration. After several experiences in the F&V sector, in 2006 became MD of Chiquita Portugal, in 2012 was appointed Deputy Managing Director of Bargosa Fruit Company. In 2015 joined the Group as Managing Director of the company Eurofrutas Lda.
Manlio Ginocchio
Luca Tarabella
Cosiarma (IT)
Bella Frutta (GR)
Born in Camogli (GE, Italy) in1967. He joined the Group in 1997 , after +15 years of experience in the reefer container business, becoming in 2014 Managing Director of Cosiarma S.p.a.
Born in Mesagne (BR, Italy) in 1971. He holds a degree in Economics. After various experiences as Export Sales Manager in food companies, he joined the Group as sales director of Bella Frutta SA and appointed CEO thereof in 2012.
AlessandoCanalella
Fruttital/ Simba (IT)Born in Alassio (SV, Italy) in1971. Graduated in Economics, he joined the Group in 2000. Currently Mr. Canalella serves as Managing Director of Simba S.p.A. (Import), member of the BoD and Commercial Director of Fruttital S.r.l. , being present also the BoD of several other subsidiaries of Orsero.
Luis Fernández López
Hermanos Fernández López (ES)
Born in Albox (Almeria,Spain) in 1948. Founded HFL in the 60’s. Currently Mr. Fernández López is Managing Director of Hermanos Fernández López S.A.
Riccardo MestrelliFruttital Firenze and
Galandi (IT)Born in Firenze (Italy) in 1968. Currently he is Managing Director of the recently fully acquired Tuscan companies.
37
259-16 -27
556
852
234
218
13
13
-118 -145
Inter
Segment
Service
Import &
shipping
Distribution
PRO FORMA CONSOLIDATED NET SALES
NET SALES VARIANCE
DISTRIBUTION SEGMENT – MIX SNAPSHOT (*)
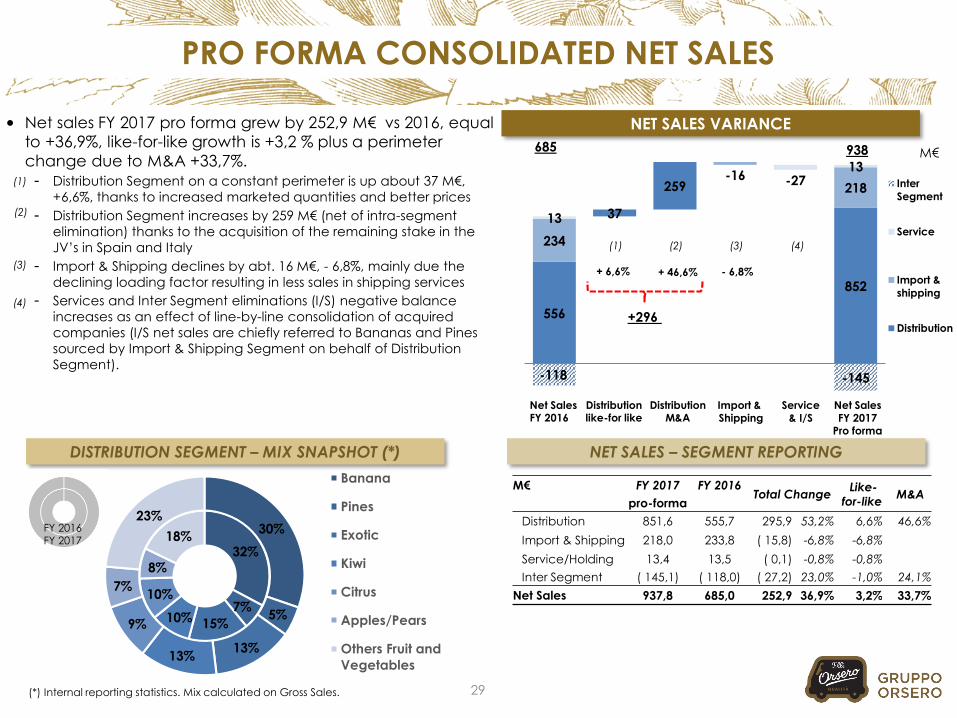
• Net sales FY 2017 pro forma grew by 252,9 M€ vs 2016, equal
to +36,9%, like-for-like growth is +3,2 % plus a perimeter
change due to M&A +33,7%.
- Distribution Segment on a constant perimeter is up about 37 M€,
+6,6%, thanks to increased marketed quantities and better prices
- Distribution Segment increases by 259 M€ (net of intra-segment
elimination) thanks to the acquisition of the remaining stake in the
JV’s in Spain and Italy
- Import & Shipping declines by abt. 16 M€, - 6,8%, mainly due the
declining loading factor resulting in less sales in shipping services
- Services and Inter Segment eliminations (I/S) negative balance
increases as an effect of line-by-line consolidation of acquired
companies (I/S net sales are chiefly referred to Bananas and Pines
sourced by Import & Shipping Segment on behalf of Distribution
Segment).
NET SALES – SEGMENT REPORTING
29
+ 6,6% + 46,6%
685 938
(1) (2) (3)
M€
(1)
(2)
(3)
Net SalesFY 2016
Distribution like-for like
Import & Shipping
Service & I/S
Net SalesFY 2017
Pro forma
(4)
Distribution M&A
(*) Internal reporting statistics. Mix calculated on Gross Sales.
(4)
- 6,8%
FY 2016FY 2017
32%
7%
15%10%
10%
8%
18%30%
5%
13%13%
9%
7%
23%
Banana
Pines
Exotic
Kiwi
Citrus
Apples/Pears
Others Fruit and
Vegetables
+296
M€ FY 2017 FY 2016Total Change
Like-
for-likeM&A
pro-forma
Distribution 851,6 555,7 295,9 53,2% 6,6% 46,6%
Import & Shipping 218,0 233,8 ( 15,8) -6,8% -6,8%
Service/Holding 13,4 13,5 ( 0,1) -0,8% -0,8%
Inter Segment ( 145,1) ( 118,0) ( 27,2) 23,0% -1,0% 24,1%
Net Sales 937,8 685,0 252,9 36,9% 3,2% 33,7%
3,79,7
0,6
-17,8
15,7
29,1
24,9
7,1
-5,4 -4,8
Service/
Holding
Import &
shipping
Distribution
PRO FORMA CONSOLIDATED ADJUSTED EBITDA
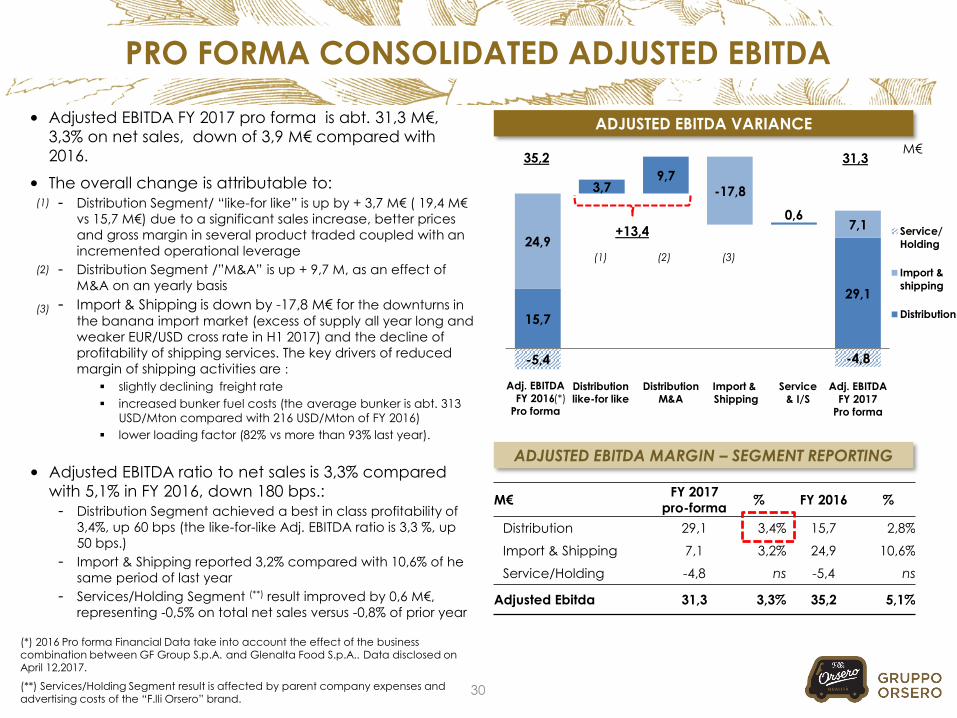
ADJUSTED EBITDA VARIANCE• Adjusted EBITDA FY 2017 pro forma is abt. 31,3 M€,
3,3% on net sales, down of 3,9 M€ compared with
2016.
• The overall change is attributable to:
- Distribution Segment/ “like-for like” is up by + 3,7 M€ ( 19,4 M€
vs 15,7 M€) due to a significant sales increase, better prices
and gross margin in several product traded coupled with an
incremented operational leverage
- Distribution Segment /”M&A” is up + 9,7 M, as an effect of
M&A on an yearly basis
- Import & Shipping is down by -17,8 M€ for the downturns in
the banana import market (excess of supply all year long and
weaker EUR/USD cross rate in H1 2017) and the decline of
profitability of shipping services. The key drivers of reduced
margin of shipping activities are :
▪ slightly declining freight rate
▪ increased bunker fuel costs (the average bunker is abt. 313
USD/Mton compared with 216 USD/Mton of FY 2016)
▪ lower loading factor (82% vs more than 93% last year).
ADJUSTED EBITDA MARGIN – SEGMENT REPORTING
30
35,2 31,3M€
(1) (2) (3)
(1)
(2)
(3)
Distribution like-for like
Import & Shipping
Service & I/S
Adj. EBITDAFY 2017
Pro forma
Distribution M&A
M€FY 2017
pro-forma% FY 2016 %
Distribution 29,1 3,4% 15,7 2,8%
Import & Shipping 7,1 3,2% 24,9 10,6%
Service/Holding -4,8 ns -5,4 ns
Adjusted Ebitda 31,3 3,3% 35,2 5,1%
(*) 2016 Pro forma Financial Data take into account the effect of the business combination between GF Group S.p.A. and Glenalta Food S.p.A.. Data disclosed on April 12,2017.
Adj. EBITDAFY 2016
Pro forma(*)
• Adjusted EBITDA ratio to net sales is 3,3% compared
with 5,1% in FY 2016, down 180 bps.:
- Distribution Segment achieved a best in class profitability of
3,4%, up 60 bps (the like-for-like Adj. EBITDA ratio is 3,3 %, up
50 bps.)
- Import & Shipping reported 3,2% compared with 10,6% of he
same period of last year
- Services/Holding Segment (**) result improved by 0,6 M€,
representing -0,5% on total net sales versus -0,8% of prior year
(**) Services/Holding Segment result is affected by parent company expenses and advertising costs of the “F.lli Orsero” brand.
+13,4
PRO FORMA CONSOLIDATED NET PROFIT
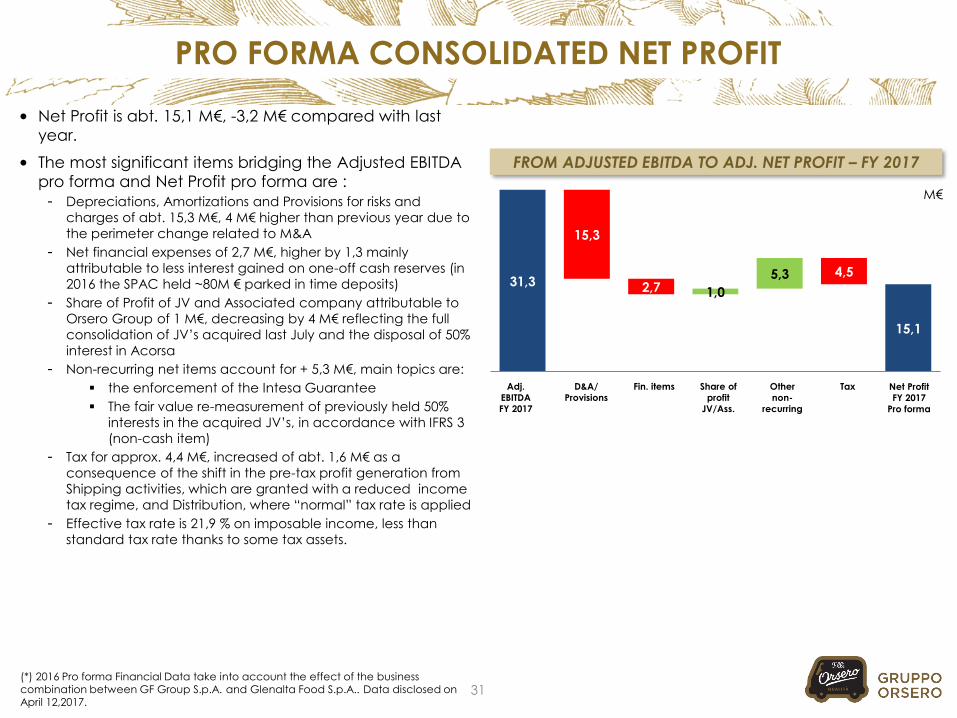
• Net Profit is abt. 15,1 M€, -3,2 M€ compared with last
year.
• The most significant items bridging the Adjusted EBITDA
pro forma and Net Profit pro forma are :
- Depreciations, Amortizations and Provisions for risks and
charges of abt. 15,3 M€, 4 M€ higher than previous year due to
the perimeter change related to M&A
- Net financial expenses of 2,7 M€, higher by 1,3 mainly
attributable to less interest gained on one-off cash reserves (in
2016 the SPAC held ~80M € parked in time deposits)
- Share of Profit of JV and Associated company attributable to
Orsero Group of 1 M€, decreasing by 4 M€ reflecting the full
consolidation of JV’s acquired last July and the disposal of 50%
interest in Acorsa
- Non-recurring net items account for + 5,3 M€, main topics are:
▪ the enforcement of the Intesa Guarantee
▪ The fair value re-measurement of previously held 50%
interests in the acquired JV’s, in accordance with IFRS 3
(non-cash item)
- Tax for approx. 4,4 M€, increased of abt. 1,6 M€ as a
consequence of the shift in the pre-tax profit generation from
Shipping activities, which are granted with a reduced income
tax regime, and Distribution, where “normal” tax rate is applied
- Effective tax rate is 21,9 % on imposable income, less than
standard tax rate thanks to some tax assets.
FROM ADJUSTED EBITDA TO ADJ. NET PROFIT – FY 2017
31
M€
Adj.
EBITDA
FY 2017
Net Profit
FY 2017
Pro forma
D&A/
Provisions
Fin. items Share of
profit
JV/Ass.
TaxOther
non-
recurring
(*) 2016 Pro forma Financial Data take into account the effect of the business combination between GF Group S.p.A. and Glenalta Food S.p.A.. Data disclosed on April 12,2017.
1,0
5,3
15,3
2,74,5
31,3
15,1

15,1
13,0
0,2 1,60,7
116,5
145,7
33,8
2,8 8,0
13,0
20,114,1
49,1 46,5
PRO FORMA CONSOLIDATED NET EQUITY AND NFP
NET EQUITY VARIANCE• Total Shareholders’ Equity is abt. 145,7 M€, increasing
by abt. 29 M€ compared with the end of 2016.
• Main changes are due to:
- Net profit of the period of circa 15,1 M€
- Capital increase reserved to Grupo Fernández related to
the contribution in kind of shares of Hermanos Fernández
López, 13 M€ (1.000.000 new shares valued 13,00 €/each)
- Capital increase due to the exercise of Orsero Warrants
- The buy back program of approx. -0,7 M€ (out of the 2 M€
overall program approved by the GSM)
- Other equity effects for a positive impact of +1,6 M€,
relevant to currency effects on net equity and the Stock
Grant program
32
M€
NET FINANCIAL POSITION VARIANCE-ILLUSTRATIVE• Group NFP is equal to 46,5 M€, down by abt. 2,6 M€
in respect to the end of 2016.
• Main changes are due to:
- M&A net cash impact of circa 20,8 M€ consisting of the
total investment in the acquired companies (33,4 M€
already settled + 0,4 M€ deferred considerations) less the
reserved capital increase (13 M€)
- The proceeding of 20,1 M€ from the disposal of 50% of
Acorsa (banana farming business in Costa Rica)
- Financial items of 2,8 M€ comprising interests expenses (2,4
M€), the capital increase related to the exercise of warrants
(+0,2 M) and the repurchase of shares (-0,7 M€)
- Operating Free Cash Flow generation of 14,1 M€, including
abt. 8,6 M of recurring capex
M€
FY 2016Pro forma
Net Profit FY 2017
Capital Increase
Fernandez
FY 2017Pro forma
Others
FY 2016Pro forma
M&A FY 2017Pro forma
Cash Flow
Disposalof Acorsa
(*) 2016 Pro forma Financial Data take into account the effect of the business combination between GF Group S.p.A. and Glenalta Food S.p.A.. Data disclosed on April 12,2017.
(*)
(*)
Net Cash Impact 20,8 M€
Buy-back
Capital IncreaseWarrant
Capital Increase
Fernandez
Intesa Guarantee
Financial Items
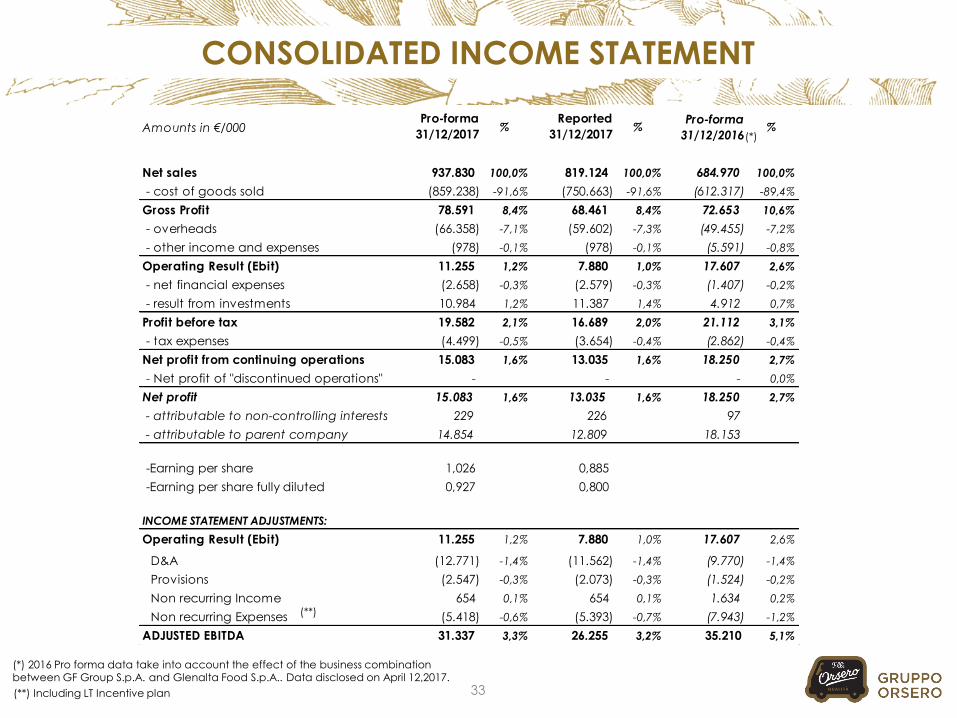
Amounts in €/000 Pro-forma
31/12/2017 %
Reported
31/12/2017 %
Pro-forma
31/12/2016 %
Net sales 937.830 100,0% 819.124 100,0% 684.970 100,0%
- cost of goods sold (859.238) -91,6% (750.663) -91,6% (612.317) -89,4%
Gross Profit 78.591 8,4% 68.461 8,4% 72.653 10,6%
- overheads (66.358) -7,1% (59.602) -7,3% (49.455) -7,2%
- other income and expenses (978) -0,1% (978) -0,1% (5.591) -0,8%
Operating Result (Ebit) 11.255 1,2% 7.880 1,0% 17.607 2,6%
- net financial expenses (2.658) -0,3% (2.579) -0,3% (1.407) -0,2%
- result from investments 10.984 1,2% 11.387 1,4% 4.912 0,7%
Profit before tax 19.582 2,1% 16.689 2,0% 21.112 3,1%
- tax expenses (4.499) -0,5% (3.654) -0,4% (2.862) -0,4%
Net profit from continuing operations 15.083 1,6% 13.035 1,6% 18.250 2,7%
- Net profit of "discontinued operations" - - - 0,0%
Net profit 15.083 1,6% 13.035 1,6% 18.250 2,7%
- attributable to non-controlling interests 229 226 97
- attributable to parent company 14.854 12.809 18.153
-Earning per share 1,026 0,885
-Earning per share fully diluted 0,927 0,800
INCOME STATEMENT ADJUSTMENTS:
Operating Result (Ebit) 11.255 1,2% 7.880 1,0% 17.607 2,6%0
D&A (12.771) -1,4% (11.562) -1,4% (9.770) -1,4%
Provisions (2.547) -0,3% (2.073) -0,3% (1.524) -0,2%
Non recurring Income 654 0,1% 654 0,1% 1.634 0,2%
Non recurring Expenses (5.418) -0,6% (5.393) -0,7% (7.943) -1,2%
ADJUSTED EBITDA 31.337 3,3% 26.255 3,2% 35.210 5,1%
CONSOLIDATED INCOME STATEMENT
33
(*) 2016 Pro forma data take into account the effect of the business combination between GF Group S.p.A. and Glenalta Food S.p.A.. Data disclosed on April 12,2017.
(**)
(**) Including LT Incentive plan
(*)
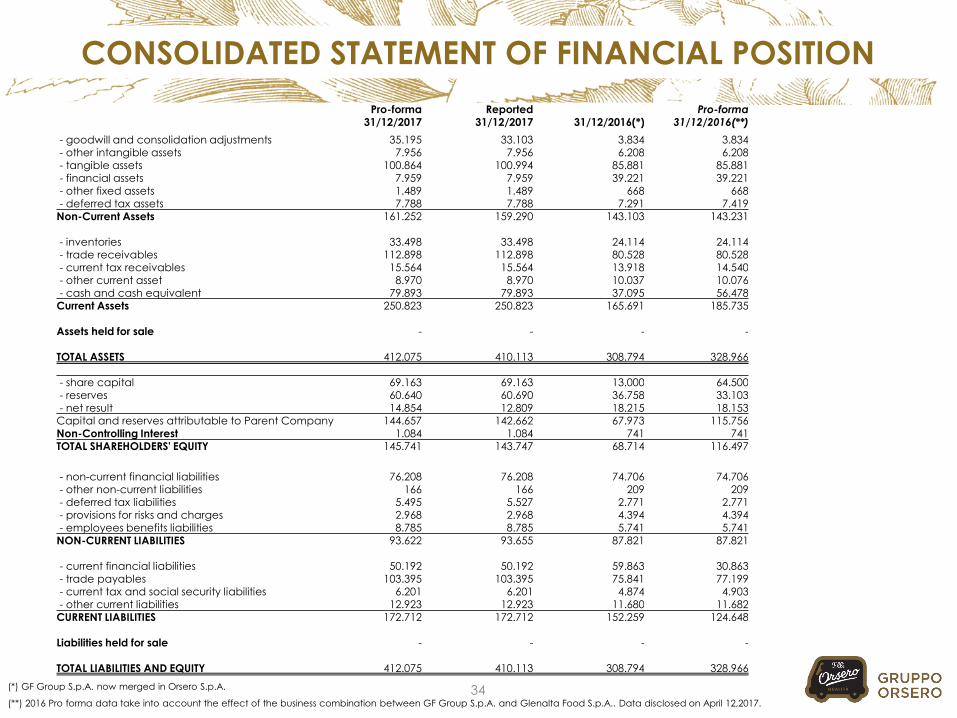
CONSOLIDATED STATEMENT OF FINANCIAL POSITION
34
Pro-forma 31/12/2017
Reported31/12/2017 31/12/2016(*)
Pro-forma 31/12/2016(**)
- goodwill and consolidation adjustments 35.195 33.103 3.834 3.834 - other intangible assets 7.956 7.956 6.208 6.208 - tangible assets 100.864 100.994 85.881 85.881 - financial assets 7.959 7.959 39.221 39.221
- other fixed assets 1.489 1.489 668 668 - deferred tax assets 7.788 7.788 7.291 7.419
Non-Current Assets 161.252 159.290 143.103 143.231
- inventories 33.498 33.498 24.114 24.114 - trade receivables 112.898 112.898 80.528 80.528 - current tax receivables 15.564 15.564 13.918 14.540 - other current asset 8.970 8.970 10.037 10.076 - cash and cash equivalent 79.893 79.893 37.095 56.478
Current Assets 250.823 250.823 165.691 185.735
Assets held for sale - - - -
TOTAL ASSETS 412.075 410.113 308.794 328.966
- share capital 69.163 69.163 13.000 64.500 - reserves 60.640 60.690 36.758 33.103 - net result 14.854 12.809 18.215 18.153
Capital and reserves attributable to Parent Company 144.657 142.662 67.973 115.756 Non-Controlling Interest 1.084 1.084 741 741 TOTAL SHAREHOLDERS' EQUITY 145.741 143.747 68.714 116.497
- non-current financial liabilities 76.208 76.208 74.706 74.706 - other non-current liabilities 166 166 209 209 - deferred tax liabilities 5.495 5.527 2.771 2.771 - provisions for risks and charges 2.968 2.968 4.394 4.394 - employees benefits liabilities 8.785 8.785 5.741 5.741
NON-CURRENT LIABILITIES 93.622 93.655 87.821 87.821
- current financial liabilities 50.192 50.192 59.863 30.863 - trade payables 103.395 103.395 75.841 77.199 - current tax and social security liabilities 6.201 6.201 4.874 4.903 - other current liabilities 12.923 12.923 11.680 11.682
CURRENT LIABILITIES 172.712 172.712 152.259 124.648
Liabilities held for sale - - - -
TOTAL LIABILITIES AND EQUITY 412.075 410.113 308.794 328.966
(*) GF Group S.p.A. now merged in Orsero S.p.A.
(**) 2016 Pro forma data take into account the effect of the business combination between GF Group S.p.A. and Glenalta Food S.p.A.. Data disclosed on April 12,2017.
DEFINITIONS & SYMBOLS
35
• EBITDA = Earnings Before Interests Tax Depreciations and Amortizations
• ADJUSTED EBITDA = Earning Before Interests Tax, Depreciation and Amortization excluding non-recurring items and figurative costs related to LT incentives
• EBIT = Earnings Before Interests Tax
• D&A = Depreciations and Amortizations
• PBT = Profit Before tax
• NFP = Net Financial Position, if positive is meant debt
• Bps = basis points
• MLT = Medium Long Term
• M&A = Merger and Acquisition
• I/S = Inter Segment
• BC = Business Combination
• SPAC = Special Purpose Acquisition Company
• BoD = Board of Directors
• F&V = Fruit & Vegetables
• Abt. = about
• H1 = first half (i.e. period 1/1/2017 – 30/6/2017)
• BAF = Bunker Adjustment Factor
• Plt. = Pallet
• M = million
• K = thousands
• € = EURO
• , (comma) = separator of decimal digits
• . (full stop) = separator of thousands
ORSERO SPAwww.orserogroup.it
Edoardo Dupanloup
Stock Exchange Information:
Trading Platform : AIM Italia/Mercato Alternativo del Capitale
NOMAD : Banca Akros S.p.A.
SPECIALIST: CFO SIM S.p.A.
Shares : ISIN - IT0005138703
Ticker Bloomberg “ORS.IM” / Ticker Thomson Reuters “ORSO.MI”