Embed Size (px)
Citation preview
ROADS AND MARITIME SERVICES NSW
M5 EAST FREEWAY
AIR QUALITY READINGS ABOVE GOAL
21 OCTOBER 2013
ASSESSMENT REPORT
2
CONTENTS
INTRODUCTION ............................................................................................... 3
INCIDENT 21 OCTOBER 2010 – PM10.............................................................. 3
ASSESSMENT VS 73/4 PROTOCOL................................................................. 4
APPENDIX 1 DETAILS OF WEBSITE REAL-TIME UNVALIDATED DATA 5
APPENDIX 2 NOTIFICATION OF READING ABOVE GOAL ...................... 9
APPENDIX 3 VALIDATED DATA .................................................................. 17
APPENDIX 4 SYDNEY WIDE OEH DATA – 24 HOUR AVERAGE PM10 DATA................................................................................................................. 18
APPENDIX 5 MEDIA INFORMATION ........................................................... 19
3
Introduction
Air quality readings above the goal were recorded on 21 October 2013 at all of the monitoring stations. These readings related to PM10 greater than the ambient 24-hr average
goal of 50 µg/m3.
Assessment of the incident has shown that the incident was the result of the recent Sydney wide bush fire event.
Incident 21 October 2010 – PM10
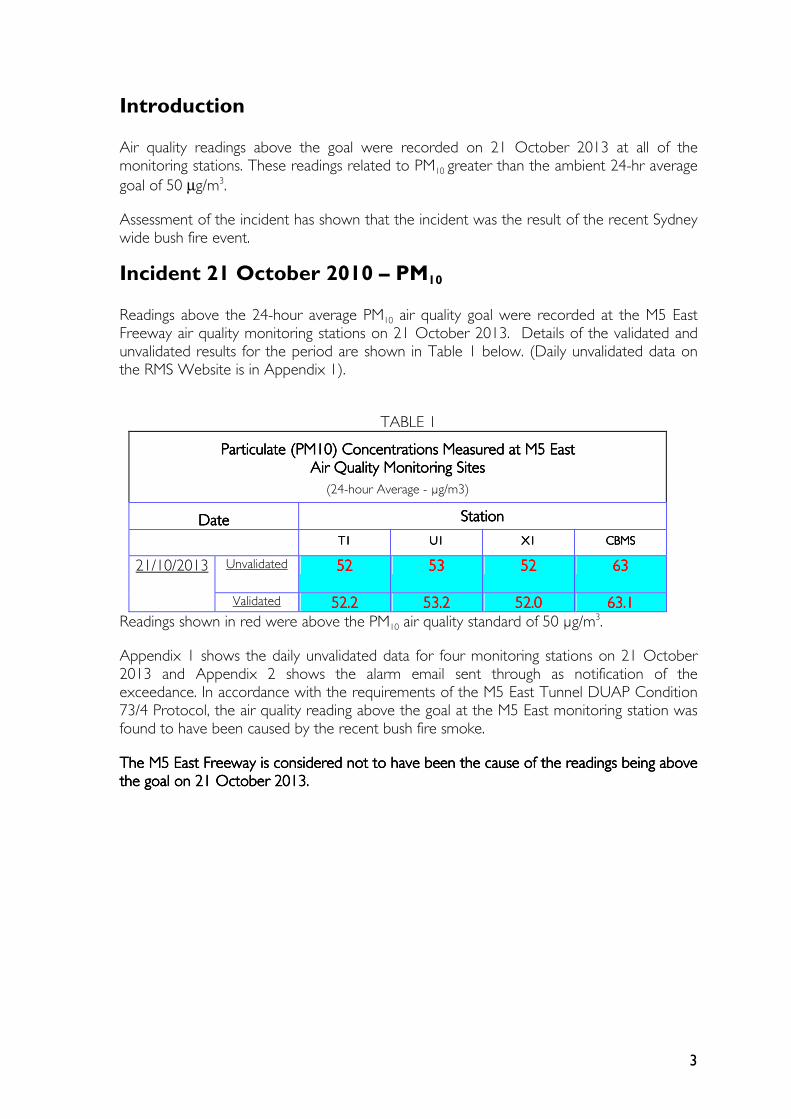
Readings above the 24-hour average PM10 air quality goal were recorded at the M5 East Freeway air quality monitoring stations on 21 October 2013. Details of the validated and unvalidated results for the period are shown in Table 1 below. (Daily unvalidated data on the RMS Website is in Appendix 1).
TABLE 1
Particulate Particulate Particulate Particulate ((((PM10PM10PM10PM10)))) Concentrations Measured at M5 East Concentrations Measured at M5 East Concentrations Measured at M5 East Concentrations Measured at M5 East Air Quality Monitoring SitesAir Quality Monitoring SitesAir Quality Monitoring SitesAir Quality Monitoring Sites
(24-hour Average - µg/m3)
DateDateDateDate StationStationStationStation
T1T1T1T1 U1U1U1U1 X1X1X1X1 CBMSCBMSCBMSCBMS
21/10/2013
Unvalidated 52525252 53535353 52525252 63636363
Validated 52.252.252.252.2 53.253.253.253.2 52.052.052.052.0 63.163.163.163.1 Readings shown in red were above the PM10 air quality standard of 50 µg/m
3.
Appendix 1 shows the daily unvalidated data for four monitoring stations on 21 October 2013 and Appendix 2 shows the alarm email sent through as notification of the exceedance. In accordance with the requirements of the M5 East Tunnel DUAP Condition 73/4 Protocol, the air quality reading above the goal at the M5 East monitoring station was found to have been caused by the recent bush fire smoke.
The M5 East Freeway is considered not to have been the cause of the readings being above The M5 East Freeway is considered not to have been the cause of the readings being above The M5 East Freeway is considered not to have been the cause of the readings being above The M5 East Freeway is considered not to have been the cause of the readings being above the goalthe goalthe goalthe goal on on on on 22221 1 1 1 OctoOctoOctoOctober 201ber 201ber 201ber 2013333. . . .
4
Assessment vs 73/4 protocol
The following actions have been carried out in accordance with the M5 East Freeway DUAP Condition 73/4 Protocol:
1. Planning NSW and EPA were notified by e-mail within one day of the monitoring indicating that a readings above the goal of the 24 hour PM10 air quality goal had occurred; (refer to Appendix 2)
2. Quality validation of the data was undertaken confirming that the TEOM 24 hour average readings were above the 50 µg/m3 ambient air quality goal for fine particulates (PM10) at ground level; (See Appendix 1)
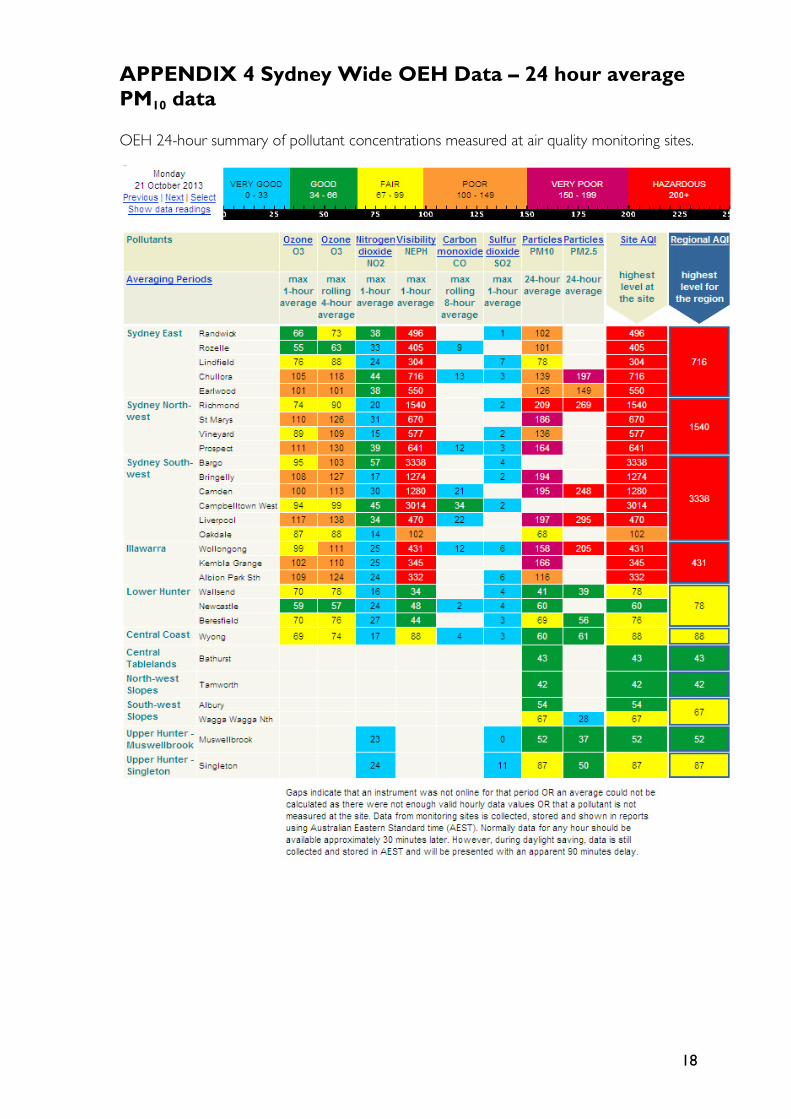
3. Information was obtained from The Office of Environment and Heritage (OEH) air quality monitoring sites in the Sydney Basin via the OEH website to determine whether the readings above the goal were caused by a Sydney wide event. The OEH monitored results and published data confirmed that a regional event on the day (bush fires) had an adverse impact on air quality (See Appendix 4). Media warnings also confirmed the conditions (see Appendix 5).
4. On obtaining confirmation that an extraordinary event had occurred, an assessment report was prepared and submitted to Planning NSW and EPA.
Appendices:
1. RMS website unvalidated data
2. Email notification of the reading above goal
3. Validated data
4. Sydney Wide OEH data – 24 hour PM10 data
5. Media Information
.
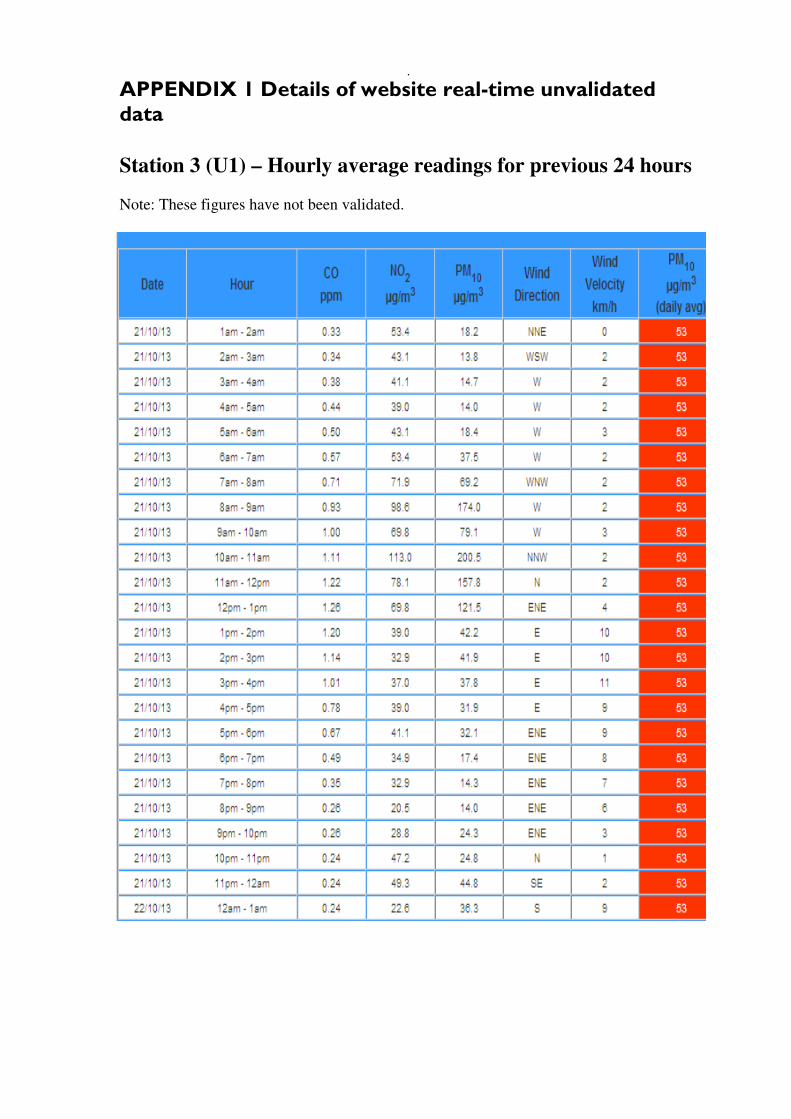
APPENDIX 1 Details of website real-time unvalidated data
Station 3 (U1) – Hourly average readings for previous 24 hours
Note: These figures have not been validated.
6
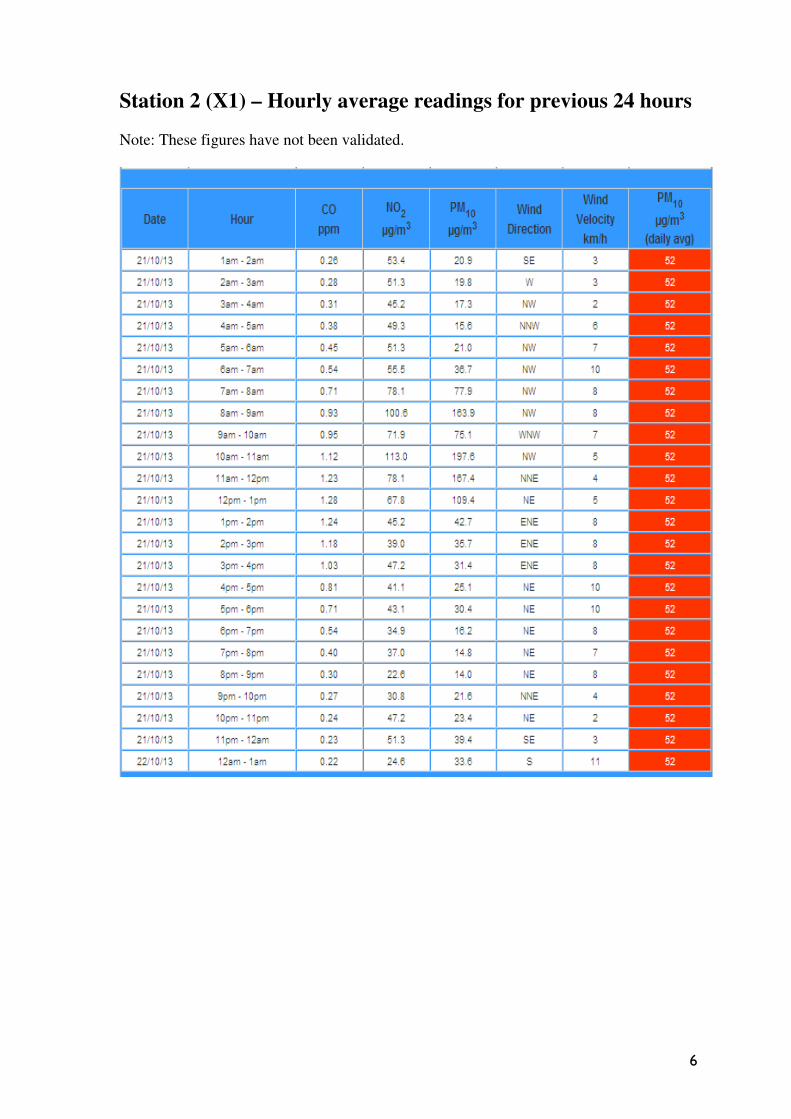
Station 2 (X1) – Hourly average readings for previous 24 hours
Note: These figures have not been validated.

7
Station 5 (CBMS) – Hourly average readings for previous 24
hours
Note: These figures have not been validated.
8
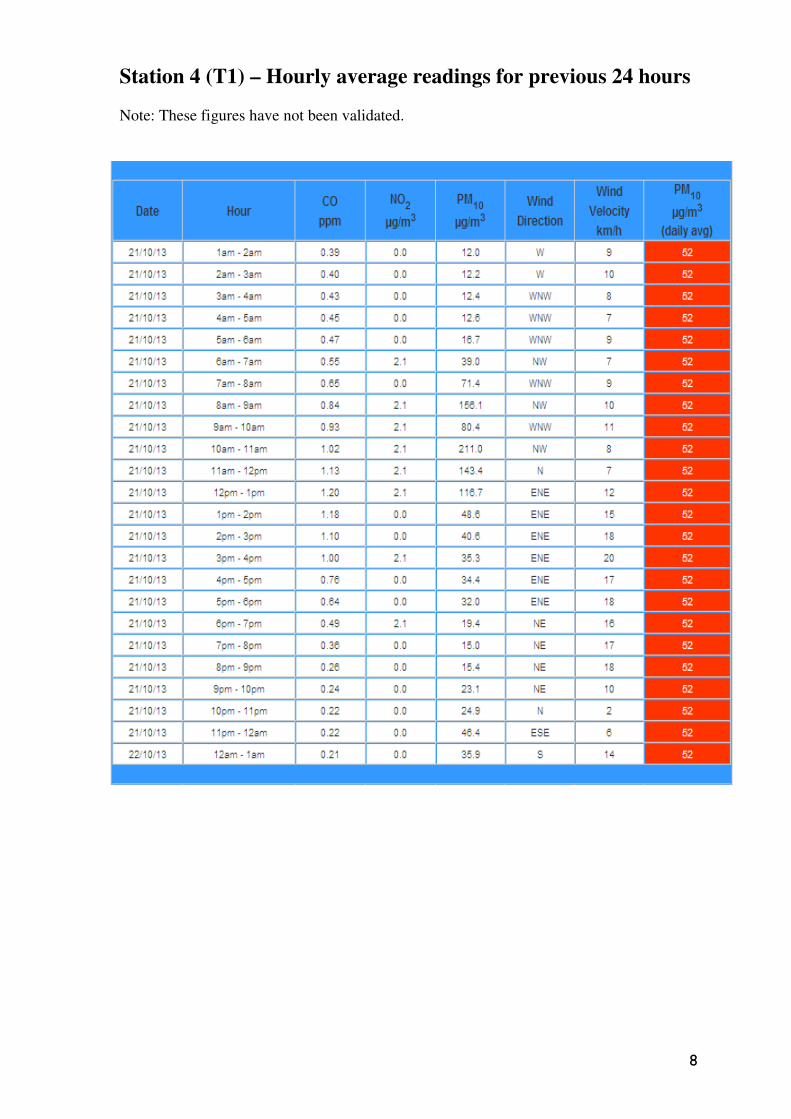
Station 4 (T1) – Hourly average readings for previous 24 hours
Note: These figures have not been validated.

9
APPENDIX 2 Notification of Reading above Goal
Title: Environmental Incident Report Date Published: 08/12/2011 Page 1 of 7 ID: 010158 Version: 1 Project Management System / D150 - Uncontrolled Document when Printed Leighton Contractors Pty. Limited ABN 98 000 893 667 www.leightoncontractors.com.au
Environmental Incident Report
Project : M5 East Project No: D150
Date of Incident : 21/10/2013 Time of Incident: 10:05 AM PM Incident No: E003
TYPE OF INCIDENT
More than one can be selected
Oil Fuel Spill Chemical Spill Fire / Explosion Fauna Injury
Unscheduled Shutdown Mismanagement of wastes Protected Vegetation Damage Excessive Dust
Uncontrolled air emission Excessive Noise Breach Of Licence Conditions Excessive Vibration
Damage to Cultural Heritage items / area
Water Release (Muddy, Contaminated)
Excessive Vegetation Clearance
Near Miss
Notify Leighton Management? Yes No
Notify Superintendent / Client? Yes No
Notify External Authorities? Yes No
TYPE OF IMPACT
More than one can be selected
General environmental and social effects (to be used where other categories do not apply)
Controlled and uncontrolled discharges to water
Contamination of land
Controlled and uncontrolled emissions to atmosphere
Noise, dust, vibration and odour
Solids and other wastes
Effects on the natural environment
Archaeological, Heritage or Cultural Issues
Use of land, water, fuels and energy, and other natural resources
Legal
Public / media
Total Cost ($) – fines, remedial action, lost time, legal costs, liabilities, etc
INDUSTRY
Building Mining Civil Process
Title: Environmental Incident Report Date Published: 08/12/2011 Page 2 of 7 ID: 010158 Version: 1 Project Management System / D150 - Uncontrolled Document when Printed Leighton Contractors Pty. Limited ABN 98 000 893 667 www.leightoncontractors.com.au
NUMBER OF PEOPLE AFFECTED BY THE INCIDENT
Leighton Employees: N/A General Public: N/A
Subcontractors: N/A Adjacent Property Owners / Tenants: N/A
Trespassers: N/A Others:
DETAILS OF INCIDENT
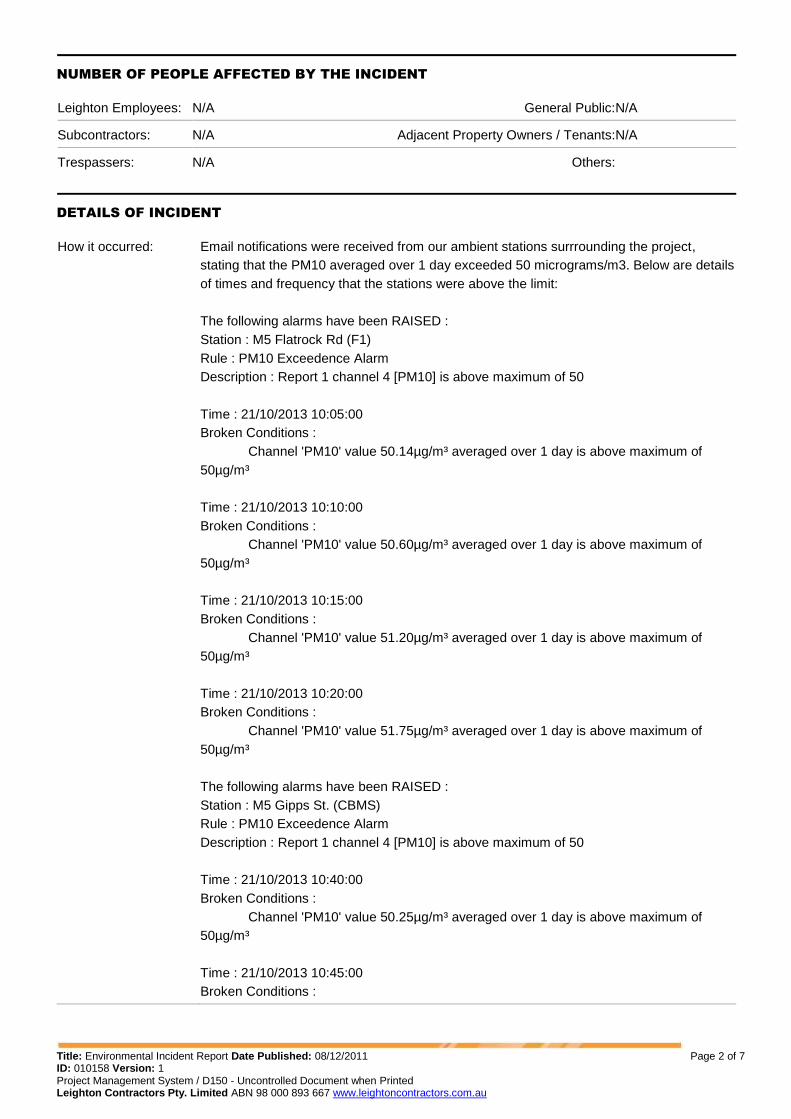
How it occurred:
Email notifications were received from our ambient stations surrrounding the project,
stating that the PM10 averaged over 1 day exceeded 50 micrograms/m3. Below are details
of times and frequency that the stations were above the limit:
The following alarms have been RAISED :
Station : M5 Flatrock Rd (F1)
Rule : PM10 Exceedence Alarm
Description : Report 1 channel 4 [PM10] is above maximum of 50
Time : 21/10/2013 10:05:00
Broken Conditions :
Channel 'PM10' value 50.14µg/m³ averaged over 1 day is above maximum of
50µg/m³
Time : 21/10/2013 10:10:00
Broken Conditions :
Channel 'PM10' value 50.60µg/m³ averaged over 1 day is above maximum of
50µg/m³
Time : 21/10/2013 10:15:00
Broken Conditions :
Channel 'PM10' value 51.20µg/m³ averaged over 1 day is above maximum of
50µg/m³
Time : 21/10/2013 10:20:00
Broken Conditions :
Channel 'PM10' value 51.75µg/m³ averaged over 1 day is above maximum of
50µg/m³
The following alarms have been RAISED :
Station : M5 Gipps St. (CBMS)
Rule : PM10 Exceedence Alarm
Description : Report 1 channel 4 [PM10] is above maximum of 50
Time : 21/10/2013 10:40:00
Broken Conditions :
Channel 'PM10' value 50.25µg/m³ averaged over 1 day is above maximum of
50µg/m³
Time : 21/10/2013 10:45:00
Broken Conditions :
Title: Environmental Incident Report Date Published: 08/12/2011 Page 3 of 7 ID: 010158 Version: 1 Project Management System / D150 - Uncontrolled Document when Printed Leighton Contractors Pty. Limited ABN 98 000 893 667 www.leightoncontractors.com.au
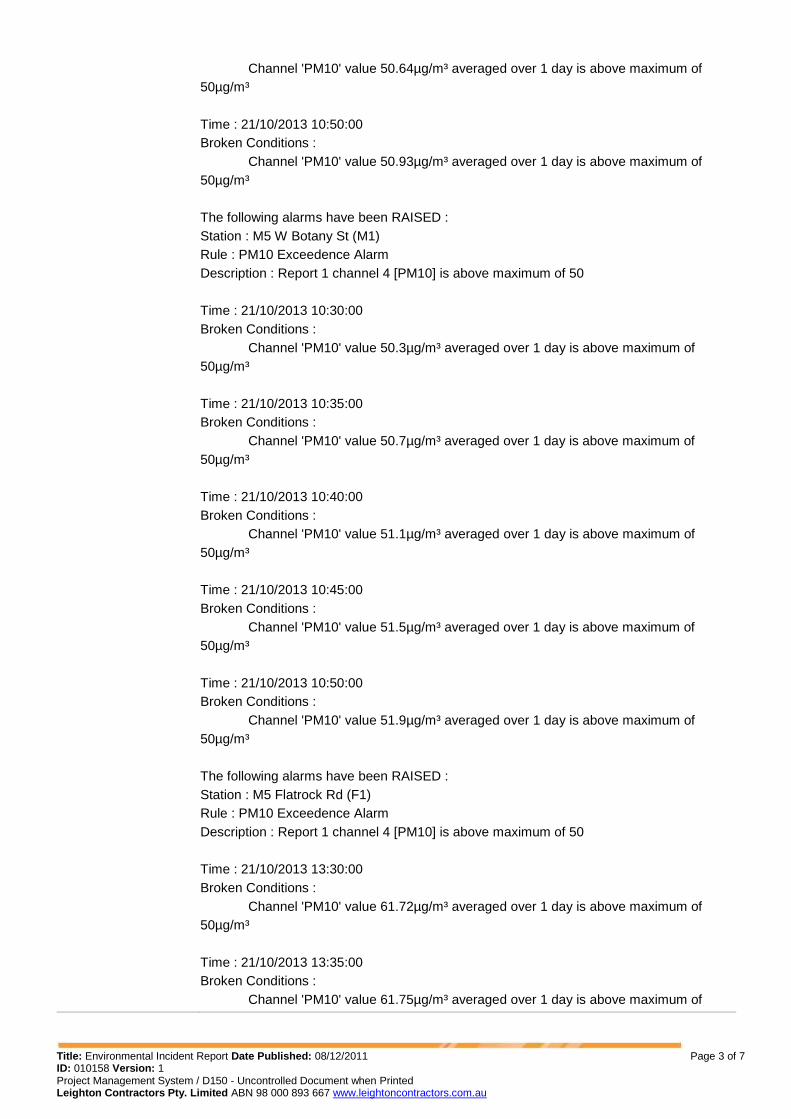
Channel 'PM10' value 50.64µg/m³ averaged over 1 day is above maximum of
50µg/m³
Time : 21/10/2013 10:50:00
Broken Conditions :
Channel 'PM10' value 50.93µg/m³ averaged over 1 day is above maximum of
50µg/m³
The following alarms have been RAISED :
Station : M5 W Botany St (M1)
Rule : PM10 Exceedence Alarm
Description : Report 1 channel 4 [PM10] is above maximum of 50
Time : 21/10/2013 10:30:00
Broken Conditions :
Channel 'PM10' value 50.3µg/m³ averaged over 1 day is above maximum of
50µg/m³
Time : 21/10/2013 10:35:00
Broken Conditions :
Channel 'PM10' value 50.7µg/m³ averaged over 1 day is above maximum of
50µg/m³
Time : 21/10/2013 10:40:00
Broken Conditions :
Channel 'PM10' value 51.1µg/m³ averaged over 1 day is above maximum of
50µg/m³
Time : 21/10/2013 10:45:00
Broken Conditions :
Channel 'PM10' value 51.5µg/m³ averaged over 1 day is above maximum of
50µg/m³
Time : 21/10/2013 10:50:00
Broken Conditions :
Channel 'PM10' value 51.9µg/m³ averaged over 1 day is above maximum of
50µg/m³
The following alarms have been RAISED :
Station : M5 Flatrock Rd (F1)
Rule : PM10 Exceedence Alarm
Description : Report 1 channel 4 [PM10] is above maximum of 50
Time : 21/10/2013 13:30:00
Broken Conditions :
Channel 'PM10' value 61.72µg/m³ averaged over 1 day is above maximum of
50µg/m³
Time : 21/10/2013 13:35:00
Broken Conditions :
Channel 'PM10' value 61.75µg/m³ averaged over 1 day is above maximum of
Title: Environmental Incident Report Date Published: 08/12/2011 Page 4 of 7 ID: 010158 Version: 1 Project Management System / D150 - Uncontrolled Document when Printed Leighton Contractors Pty. Limited ABN 98 000 893 667 www.leightoncontractors.com.au
50µg/m³
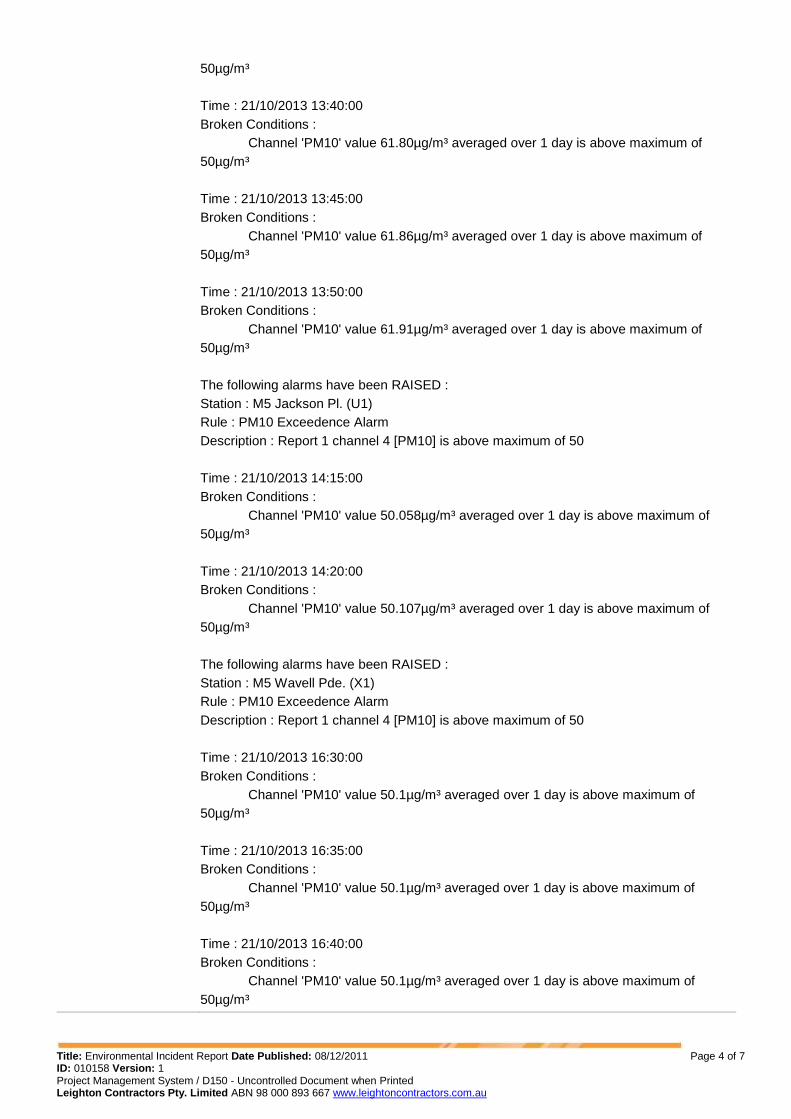
Time : 21/10/2013 13:40:00
Broken Conditions :
Channel 'PM10' value 61.80µg/m³ averaged over 1 day is above maximum of
50µg/m³
Time : 21/10/2013 13:45:00
Broken Conditions :
Channel 'PM10' value 61.86µg/m³ averaged over 1 day is above maximum of
50µg/m³
Time : 21/10/2013 13:50:00
Broken Conditions :
Channel 'PM10' value 61.91µg/m³ averaged over 1 day is above maximum of
50µg/m³
The following alarms have been RAISED :
Station : M5 Jackson Pl. (U1)
Rule : PM10 Exceedence Alarm
Description : Report 1 channel 4 [PM10] is above maximum of 50
Time : 21/10/2013 14:15:00
Broken Conditions :
Channel 'PM10' value 50.058µg/m³ averaged over 1 day is above maximum of
50µg/m³
Time : 21/10/2013 14:20:00
Broken Conditions :
Channel 'PM10' value 50.107µg/m³ averaged over 1 day is above maximum of
50µg/m³
The following alarms have been RAISED :
Station : M5 Wavell Pde. (X1)
Rule : PM10 Exceedence Alarm
Description : Report 1 channel 4 [PM10] is above maximum of 50
Time : 21/10/2013 16:30:00
Broken Conditions :
Channel 'PM10' value 50.1µg/m³ averaged over 1 day is above maximum of
50µg/m³
Time : 21/10/2013 16:35:00
Broken Conditions :
Channel 'PM10' value 50.1µg/m³ averaged over 1 day is above maximum of
50µg/m³
Time : 21/10/2013 16:40:00
Broken Conditions :
Channel 'PM10' value 50.1µg/m³ averaged over 1 day is above maximum of
50µg/m³
Title: Environmental Incident Report Date Published: 08/12/2011 Page 5 of 7 ID: 010158 Version: 1 Project Management System / D150 - Uncontrolled Document when Printed Leighton Contractors Pty. Limited ABN 98 000 893 667 www.leightoncontractors.com.au
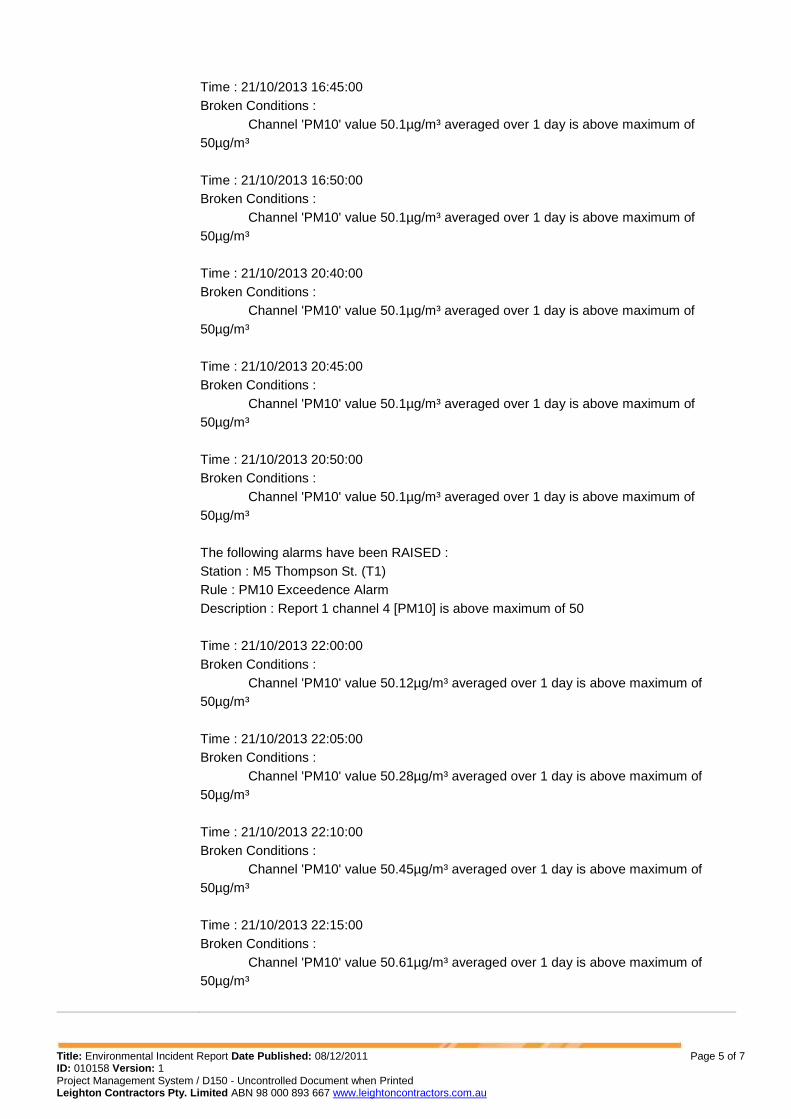
Time : 21/10/2013 16:45:00
Broken Conditions :
Channel 'PM10' value 50.1µg/m³ averaged over 1 day is above maximum of
50µg/m³
Time : 21/10/2013 16:50:00
Broken Conditions :
Channel 'PM10' value 50.1µg/m³ averaged over 1 day is above maximum of
50µg/m³
Time : 21/10/2013 20:40:00
Broken Conditions :
Channel 'PM10' value 50.1µg/m³ averaged over 1 day is above maximum of
50µg/m³
Time : 21/10/2013 20:45:00
Broken Conditions :
Channel 'PM10' value 50.1µg/m³ averaged over 1 day is above maximum of
50µg/m³
Time : 21/10/2013 20:50:00
Broken Conditions :
Channel 'PM10' value 50.1µg/m³ averaged over 1 day is above maximum of
50µg/m³
The following alarms have been RAISED :
Station : M5 Thompson St. (T1)
Rule : PM10 Exceedence Alarm
Description : Report 1 channel 4 [PM10] is above maximum of 50
Time : 21/10/2013 22:00:00
Broken Conditions :
Channel 'PM10' value 50.12µg/m³ averaged over 1 day is above maximum of
50µg/m³
Time : 21/10/2013 22:05:00
Broken Conditions :
Channel 'PM10' value 50.28µg/m³ averaged over 1 day is above maximum of
50µg/m³
Time : 21/10/2013 22:10:00
Broken Conditions :
Channel 'PM10' value 50.45µg/m³ averaged over 1 day is above maximum of
50µg/m³
Time : 21/10/2013 22:15:00
Broken Conditions :
Channel 'PM10' value 50.61µg/m³ averaged over 1 day is above maximum of
50µg/m³
Title: Environmental Incident Report Date Published: 08/12/2011 Page 6 of 7 ID: 010158 Version: 1 Project Management System / D150 - Uncontrolled Document when Printed Leighton Contractors Pty. Limited ABN 98 000 893 667 www.leightoncontractors.com.au
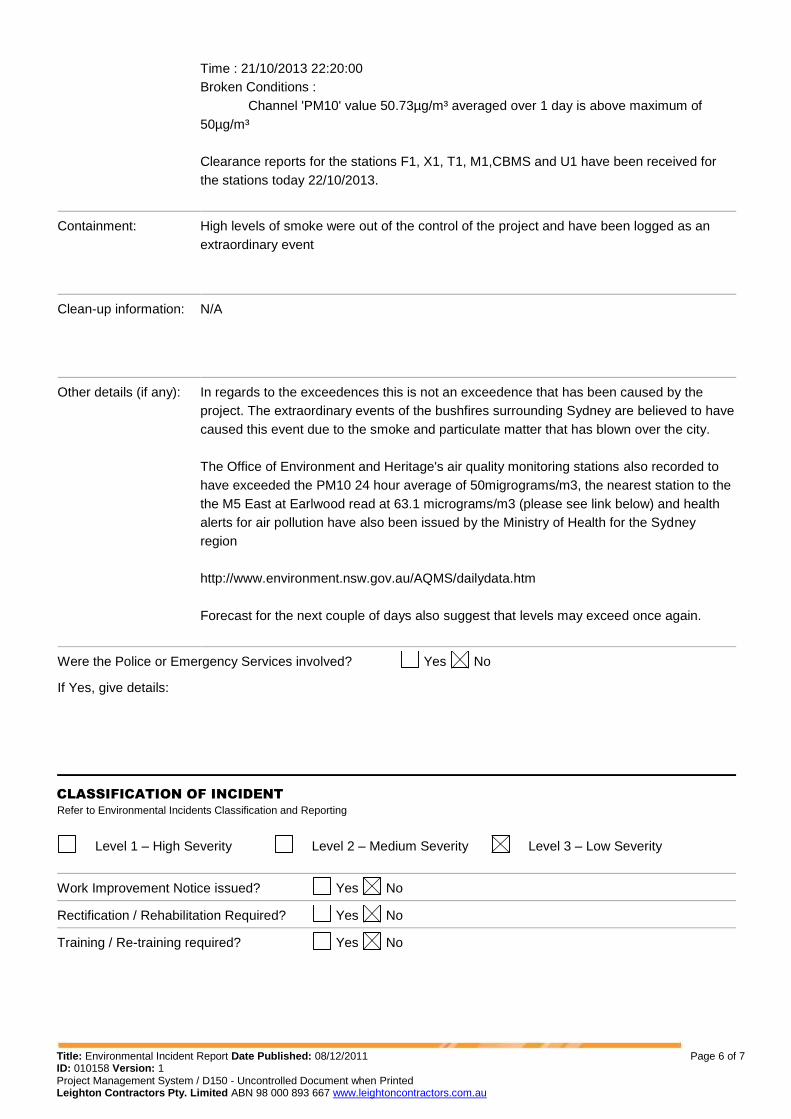
Time : 21/10/2013 22:20:00
Broken Conditions :
Channel 'PM10' value 50.73µg/m³ averaged over 1 day is above maximum of
50µg/m³
Clearance reports for the stations F1, X1, T1, M1,CBMS and U1 have been received for
the stations today 22/10/2013.
Containment:
High levels of smoke were out of the control of the project and have been logged as an
extraordinary event
Clean-up information:
N/A
Other details (if any):
In regards to the exceedences this is not an exceedence that has been caused by the
project. The extraordinary events of the bushfires surrounding Sydney are believed to have
caused this event due to the smoke and particulate matter that has blown over the city.
The Office of Environment and Heritage's air quality monitoring stations also recorded to
have exceeded the PM10 24 hour average of 50migrograms/m3, the nearest station to the
the M5 East at Earlwood read at 63.1 micrograms/m3 (please see link below) and health
alerts for air pollution have also been issued by the Ministry of Health for the Sydney
region
http://www.environment.nsw.gov.au/AQMS/dailydata.htm
Forecast for the next couple of days also suggest that levels may exceed once again.
Were the Police or Emergency Services involved? Yes No
If Yes, give details:
CLASSIFICATION OF INCIDENT
Refer to Environmental Incidents Classification and Reporting
Level 1 – High Severity Level 2 – Medium Severity Level 3 – Low Severity
Work Improvement Notice issued? Yes No
Rectification / Rehabilitation Required? Yes No
Training / Re-training required? Yes No
Title: Environmental Incident Report Date Published: 08/12/2011 Page 7 of 7 ID: 010158 Version: 1 Project Management System / D150 - Uncontrolled Document when Printed Leighton Contractors Pty. Limited ABN 98 000 893 667 www.leightoncontractors.com.au
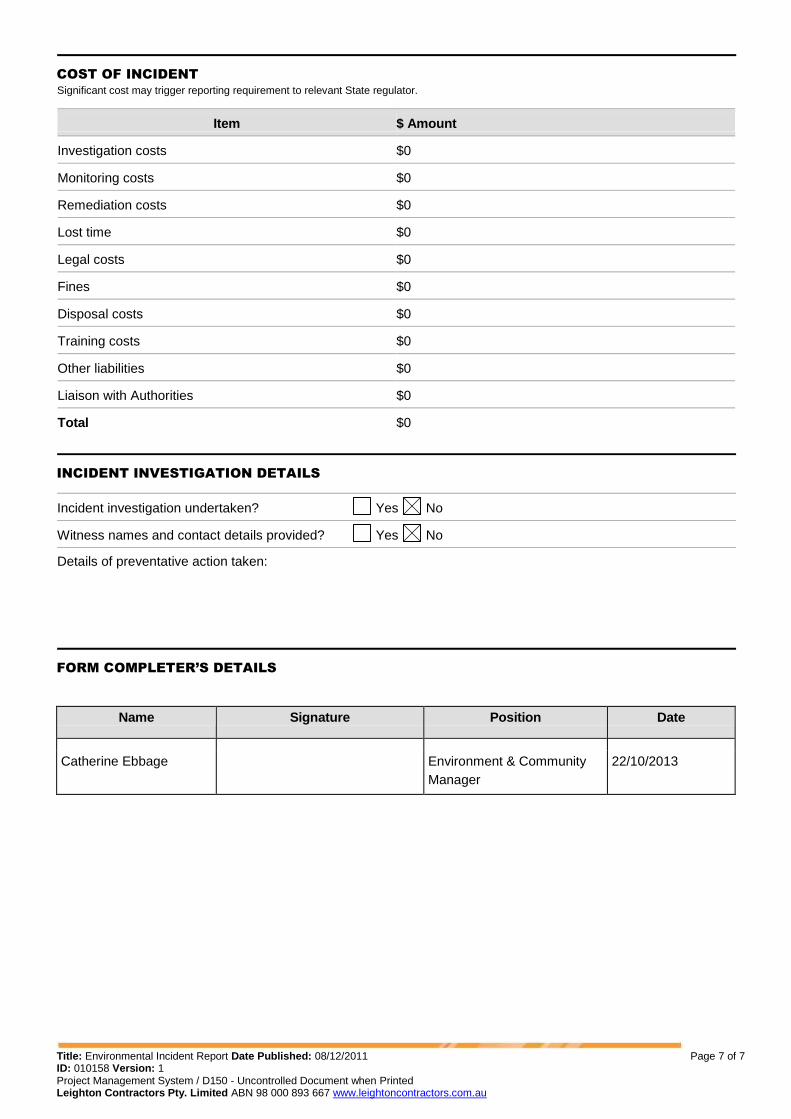
COST OF INCIDENT
Significant cost may trigger reporting requirement to relevant State regulator.
Item $ Amount
Investigation costs $0
Monitoring costs $0
Remediation costs $0
Lost time $0
Legal costs $0
Fines $0
Disposal costs $0
Training costs $0
Other liabilities $0
Liaison with Authorities $0
Total $0
INCIDENT INVESTIGATION DETAILS
Incident investigation undertaken? Yes No
Witness names and contact details provided? Yes No
Details of preventative action taken:
FORM COMPLETER’S DETAILS
Name Signature Position Date
Catherine Ebbage Environment & Community
Manager
22/10/2013
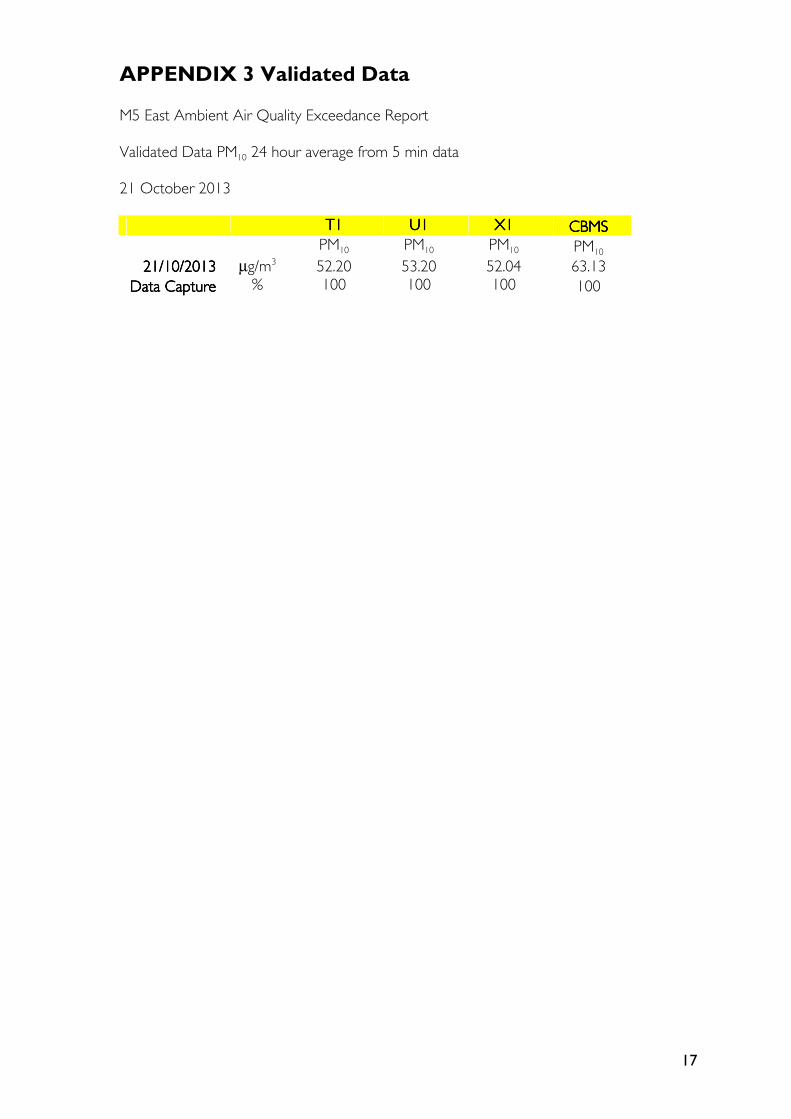
17
APPENDIX 3 Validated Data M5 East Ambient Air Quality Exceedance Report Validated Data PM10 24 hour average from 5 min data 21 October 2013
T1T1T1T1 U1U1U1U1 X1X1X1X1 CBMSCBMSCBMSCBMS
PM10 PM10 PM10 PM10
21/10/201321/10/201321/10/201321/10/2013 µg/m3 52.20 53.20 52.04 63.13
Data CaptureData CaptureData CaptureData Capture % 100 100 100 100
18
APPENDIX 4 Sydney Wide OEH Data – 24 hour average PM10 data
OEH 24-hour summary of pollutant concentrations measured at air quality monitoring sites.

19
APPENDIX 5 Media Information