Embed Size (px)
Citation preview
Daniel Hellebø KnutsenPeter Christian Hannibal Høeg
Roadmap for Manufacturing Cost Deployment
2 Roadmap for Manufacturing Cost Deployment
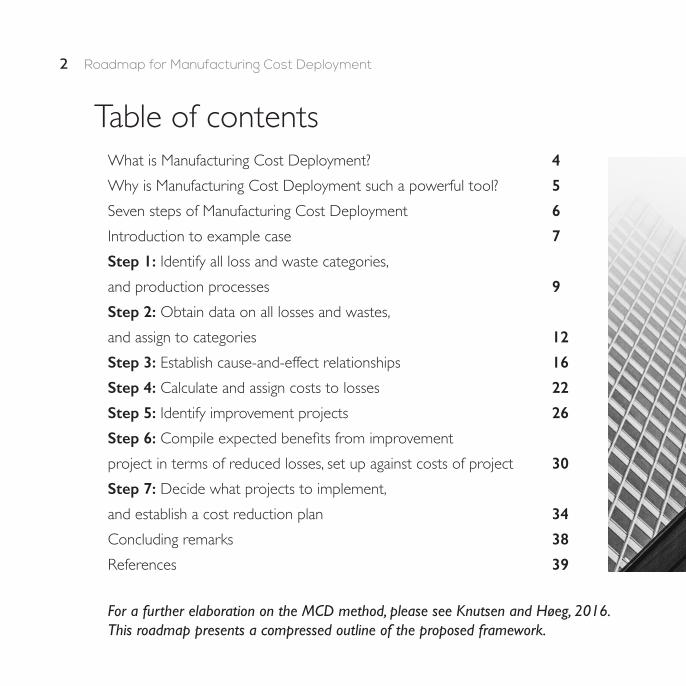
Table of contents
For a further elaboration on the MCD method, please see Knutsen and Høeg, 2016.This roadmap presents a compressed outline of the proposed framework.
What is Manufacturing Cost Deployment? 4Why is Manufacturing Cost Deployment such a powerful tool? 5Seven steps of Manufacturing Cost Deployment 6Introduction to example case 7Step 1: Identify all loss and waste categories, and production processes 9Step 2: Obtain data on all losses and wastes, and assign to categories 12
Step 3: Establish cause-and-effect relationships 16
Step 4: Calculate and assign costs to losses 22
Step 5: Identify improvement projects 26
Step 6: Compile expected benefits from improvement project in terms of reduced losses, set up against costs of project 30
Step 7: Decide what projects to implement, and establish a cost reduction plan 34
Concluding remarks 38
References 39
3Roadmap for Manufacturing Cost Deployment
Does your company need a decision support tool to select the improvement projects that generate the highest cost savings? Here is a compiled roadmap for how to apply the Manufacturing Cost Deployment method.
4 What is Manufacturing Cost Deployment?
MCD was first proposed by Yamashina and Kubo (2002). It is a systematic procedure for reducing manufacturing costs. It is a seven-step method to select what improvement projects to implement. By applying the method, manufacturing companies can build cost reduction programs, targeting root causes of losses in order to implement improvement projects that deal with the causal errors in their facilities. The methodology increases the legitimacy for implementing projects that yield high investment efficiencies. Systematically selecting projects that eliminates the root problems rather than the symptoms, can contribute to long-term reduction of production costs.
What is Manufacturing Cost Deployment?

5Why is Manufacturing Cost Deployment such a powerful tool?
The strength of MCD is to systematically assign impact of resultant losses to their causal losses. Based on thorough root cause analysis, the total impact of causal losses can be evaluated. Systematically assigning costs to loss factors defines the total cost of each causal loss, for a defined period. Quantitatively assessing improvement projects in terms of expected loss reduction and cost of implementation, allows investment efficiencies to be evaluated This way, managers at all levels have a new way to make their improvement project proposals valid business cases.
MCD can be used at all levels of the organization. For practicality, this roadmap is considering the typical department level of a manufacturing company.
Why is Manufacturing Cost Deployment such a powerful tool?

6 Roadmap for Manufacturing Cost Deployment
Identify loss and waste categories in all processes
Quantify wastes and losses
Establish cause-and-effect relationships
Assign costs to losses
Identify improvement projects
Identify implementation costs
Select and implement projects
Seven steps of Manufacturing Cost Deployment
7Introduction to example case
Introduction to example case
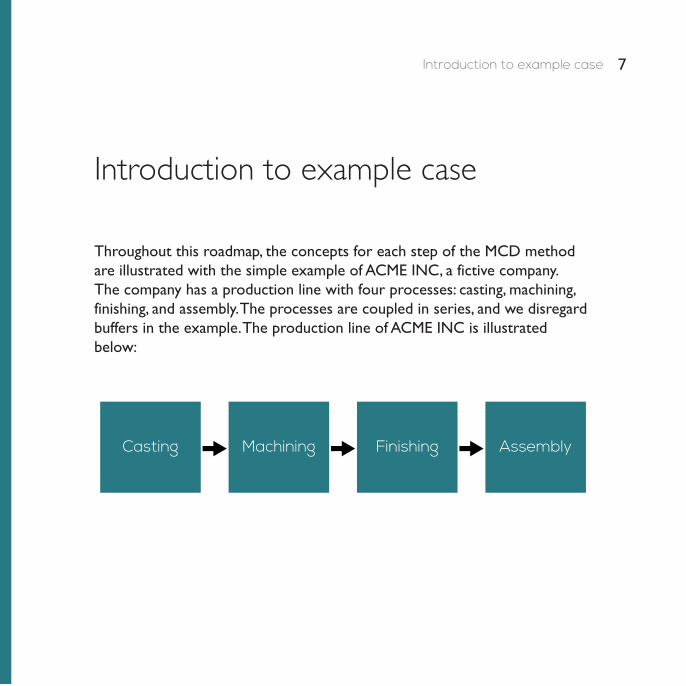
Throughout this roadmap, the concepts for each step of the MCD method are illustrated with the simple example of ACME INC, a fictive company. The company has a production line with four processes: casting, machining, finishing, and assembly. The processes are coupled in series, and we disregard buffers in the example. The production line of ACME INC is illustrated below:
Casting Machining Finishing Assembly
Roadmap for Manufacturing Cost Deployment
STEP 1.
Identify all loss and waste categories, and production
processes
8
9Step 1: Identify all loss and waste categories, and production processes
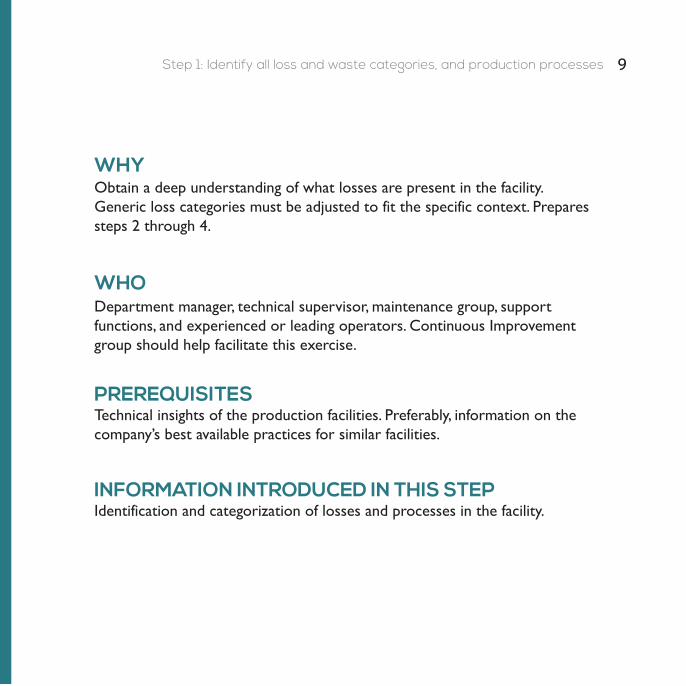
WHY
WHO
Obtain a deep understanding of what losses are present in the facility. Generic loss categories must be adjusted to fit the specific context. Prepares steps 2 through 4.
Department manager, technical supervisor, maintenance group, support functions, and experienced or leading operators. Continuous Improvement group should help facilitate this exercise.
Technical insights of the production facilities. Preferably, information on the company’s best available practices for similar facilities.
Identification and categorization of losses and processes in the facility.
PREREQUISITES
INFORMATION INTRODUCED IN THIS STEP
10 Step 1: Identify all loss and waste categories, and production processes
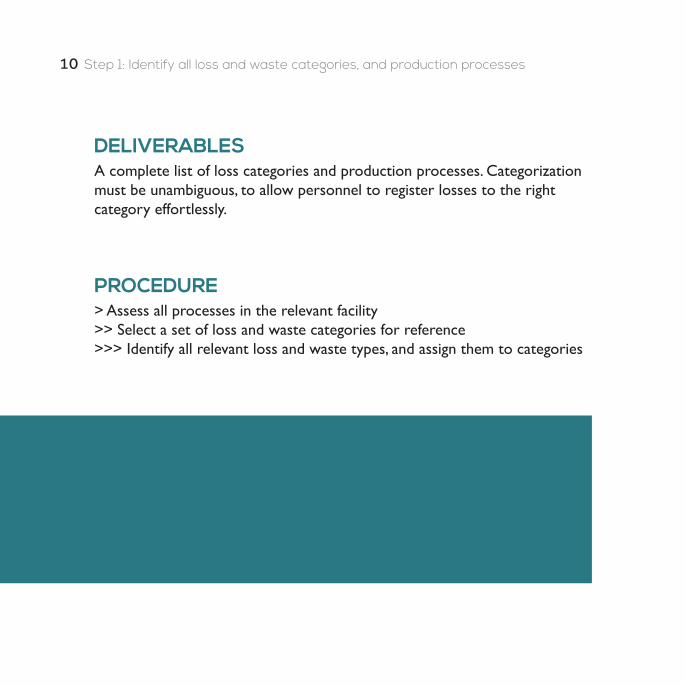
PROCEDURE
DELIVERABLES
> Assess all processes in the relevant facility>> Select a set of loss and waste categories for reference>>> Identify all relevant loss and waste types, and assign them to categories
A complete list of loss categories and production processes. Categorization must be unambiguous, to allow personnel to register losses to the right category effortlessly.
11Step 1: Identify all loss and waste categories, and production processes
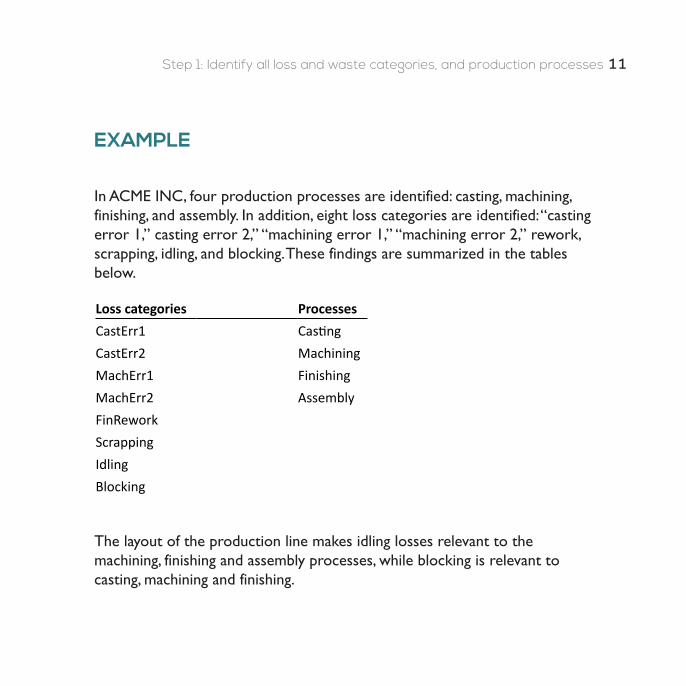
In ACME INC, four production processes are identified: casting, machining, finishing, and assembly. In addition, eight loss categories are identified: “casting error 1,” casting error 2,” “machining error 1,” “machining error 2,” rework, scrapping, idling, and blocking. These findings are summarized in the tables below.
The layout of the production line makes idling losses relevant to the machining, finishing and assembly processes, while blocking is relevant to casting, machining and finishing.
EXAMPLE
Loss categories ProcessesCastErr1 CastingCastErr2 MachiningMachErr1 FinishingMachErr2 AssemblyFinReworkScrappingIdlingBlocking
Roadmap for Manufacturing Cost Deployment
STEP 2.
Obtain data on all losses and wastes, and assign to categories
12
13Step 2: Obtain data on all losses and wastes, and assign to categories
WHY
WHO
PREREQUISITES
Provide a categorized and quantified database of all losses and wastes.
Personnel with knowledge of the systems used for registering loss data, as well as how to assign this data to the defined losses and wastes categories. As multiple information systems could be used for obtaining this data, this step might require involvement of multiple persons when compiling the data.
The list of loss categories and production processes, from Step 1. Standardized procedures, and unambiguous categories, for registering wastes and losses are essential for obtaining high-precision data.
Quantitative data on the losses and wastes, assigned to loss categories and production processes. Raw data is typically obtained from workers who use standardized procedures to register losses, errors and stoppages in production.
INFORMATION INTRODUCED IN THIS STEP
14 Step 2: Obtain data on all losses and wastes, and assign to categories
The A matrix, which shows the total magnitude of losses and wastes, for each category and production process, for a predefined period of time.
> Decide on methods and tools for obtaining and registering loss data, as well as the duration of the period of analysis>> Quantify and assign registered losses to categories in a spreadsheet >>> Extract total magnitudes of each loss in process, in order to generate the A Matrix
DELIVERABLES
PROCEDURE
15Step 2: Obtain data on all losses and wastes, and assign to categories
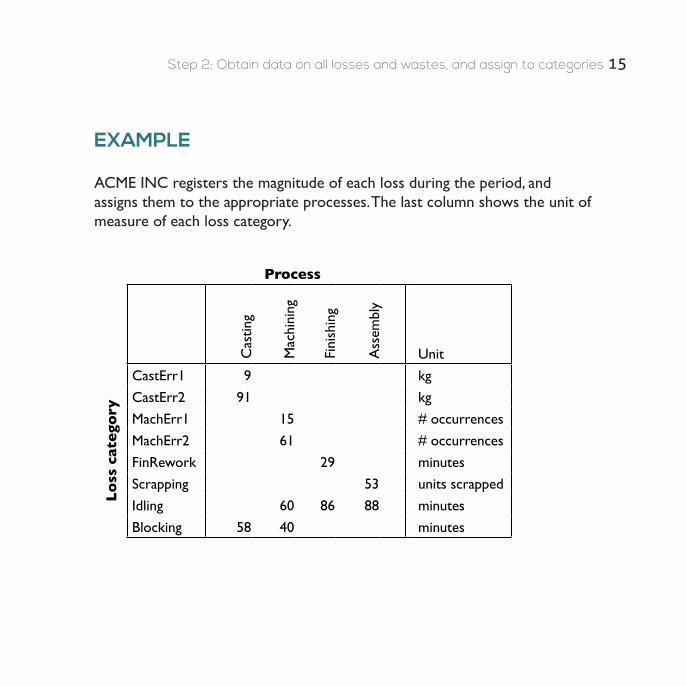
ACME INC registers the magnitude of each loss during the period, and assigns them to the appropriate processes. The last column shows the unit of measure of each loss category.
EXAMPLE
Process
Cas
ting
Mac
hini
ng
Fini
shin
g
Ass
embl
y Unit
Loss
cat
egor
y
CastErr1 9 kg
CastErr2 91 kg
MachErr1 15 # occurrences
MachErr2 61 # occurrences
FinRework 29 minutes
Scrapping 53 units scrapped
Idling 60 86 88 minutes
Blocking 58 40 minutes
Roadmap for Manufacturing Cost Deployment
STEP 3.
Establish cause-and-effect relationships
16
17Step 3: Establish cause-and-effect relationships
WHY
WHO
PREREQUISITES
Distinguish between causal and resultant losses. Assign resultant losses to causal losses, according to their interrelationships.
Department manager, technical supervisor, maintenance group, support functions, and experienced or leading operators. Continuous Improvement group should facilitate also this exercise.
The list of loss categories and production processes from step 1, as well as data gathered in step 2. Recognized tools and procedures for determining cause-and-effect relationships.
Quantification of cause-and-effect relationships among losses. The quantification should be a fractional distribution of resultant losses to causal losses.
INFORMATION INTRODUCED IN THIS STEP
18 Step 3: Establish cause-and-effect relationships
The B matrix, which shows the causal-resultant relationships among the losses, expressed as loss magnitudes.
> Qualitatively determine fractional causal relationships between losses*>> Generate a causal-resultant percentage matrix with these fractions as input (in %)>>> Generate the B matrix by multiplying the values in the percentage matrix with the magnitude of the corresponding resultant losses from the A matrix
* Apply quantitatively determined relational fractions, if obtainable
DELIVERABLES
PROCEDURE
In the tables corresponding to this step, we see both a causal-resultant percentage matrix, and the B matrix. The causal-resultant percentage matrix provides the assumptions made from examining the loss causality, while the B matrix is made from multiplying the factors from the causal-resultant percentage matrix with the magnitudes of the resultant losses, which is found in the A matrix.
EXAMPLE
19Step 3: Establish cause-and-effect relationships
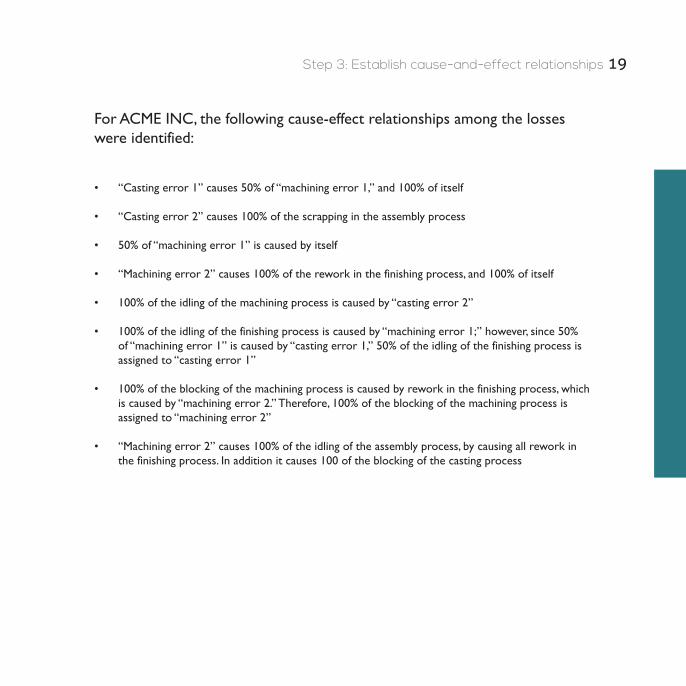
For ACME INC, the following cause-effect relationships among the losses were identified:
• “Casting error 1” causes 50% of “machining error 1,” and 100% of itself
• “Casting error 2” causes 100% of the scrapping in the assembly process
• 50% of “machining error 1” is caused by itself
• “Machining error 2” causes 100% of the rework in the finishing process, and 100% of itself
• 100% of the idling of the machining process is caused by “casting error 2”
• 100% of the idling of the finishing process is caused by “machining error 1;” however, since 50% of “machining error 1” is caused by “casting error 1,” 50% of the idling of the finishing process is assigned to “casting error 1”
• 100% of the blocking of the machining process is caused by rework in the finishing process, which is caused by “machining error 2.” Therefore, 100% of the blocking of the machining process is assigned to “machining error 2”
• “Machining error 2” causes 100% of the idling of the assembly process, by causing all rework in the finishing process. In addition it causes 100 of the blocking of the casting process
20 Step 3: Establish cause-and-effect relationships
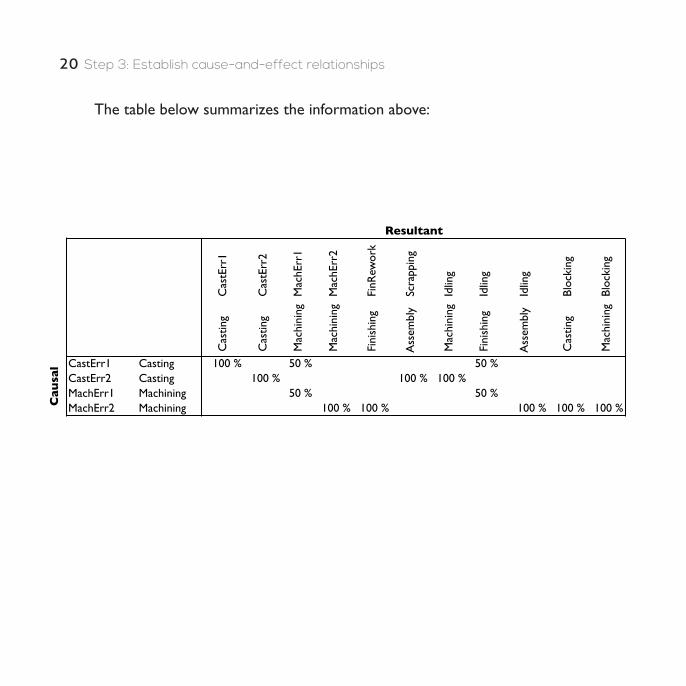
The table below summarizes the information above:
Cas
tErr
1
Cas
tErr
2
Mac
hErr
1
Mac
hErr
2
FinR
ewor
k
Scra
ppin
g
Idlin
g
Idlin
g
Idlin
g
Bloc
king
Bloc
king
Cas
ting
Cas
ting
Mac
hini
ng
Mac
hini
ng
Fin
ishi
ng
Ass
embl
y
Mac
hini
ng
Fin
ishi
ng
Ass
embl
y
Cas
ting
Mac
hini
ng
CastErr1 Casting 100 % 50 % 50 %CastErr2 Casting 100 % 100 % 100 %MachErr1 Machining 50 % 50 %MachErr2 Machining 100 % 100 % 100 % 100 % 100 %
Resultant
Cau
sal
21Step 3: Establish cause-and-effect relationships
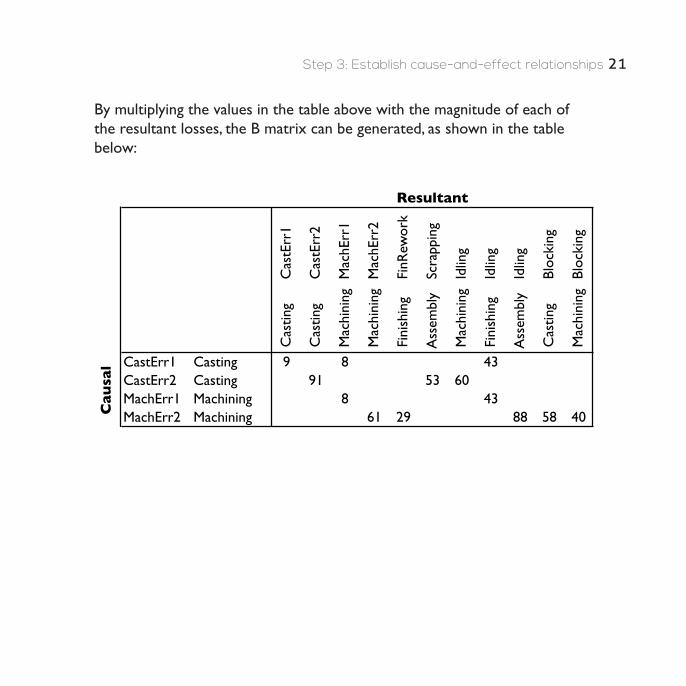
By multiplying the values in the table above with the magnitude of each of the resultant losses, the B matrix can be generated, as shown in the table below:
Cas
tErr
1
Cas
tErr
2
Mac
hErr
1
Mac
hErr
2
FinR
ewor
k
Scra
ppin
g
Idlin
g
Idlin
g
Idlin
g
Bloc
king
Bloc
king
Cas
ting
Cas
ting
Mac
hini
ng
Mac
hini
ng
Fin
ishi
ng
Ass
embl
y
Mac
hini
ng
Fin
ishi
ng
Ass
embl
y
Cas
ting
Mac
hini
ng
CastErr1 Casting 9 8 43CastErr2 Casting 91 53 60MachErr1 Machining 8 43MachErr2 Machining 61 29 88 58 40
Resultant
Cau
sal
Roadmap for Manufacturing Cost Deployment
STEP 4.
Calculate and assign costs to losses
22
23Step 4: Calculate and assign costs to losses
WHY
WHO
PREREQUISITES
Express all losses in monetary terms, in order visualize the actual costs incurred by losses. The cost of resultant losses are assigned to causal losses, according to the relationships identified from step 3.
Personnel with insight in budgeting and accounting procedures should conduct this task in consultation with technical supervisor and the responsible manager.
The list of loss categories and production processes from step 1. Thorough knowledge about budgeting and accounting procedures, as well as financial information, is required.
Cost rates for losses. INFORMATION INTRODUCED IN THIS STEP
The C matrix, which presents the total cost assigned to each causal loss. DELIVERABLES
24 Step 4: Calculate and assign costs to losses
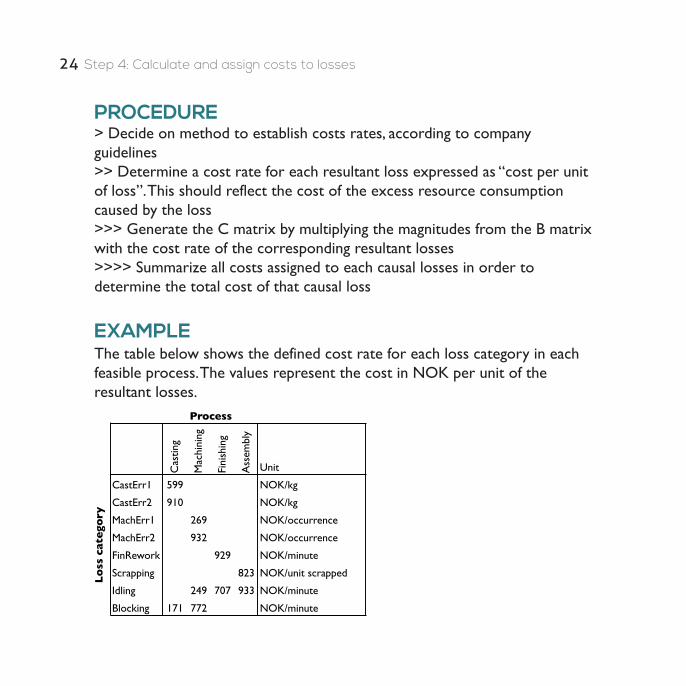
> Decide on method to establish costs rates, according to company guidelines>> Determine a cost rate for each resultant loss expressed as “cost per unit of loss”. This should reflect the cost of the excess resource consumption caused by the loss >>> Generate the C matrix by multiplying the magnitudes from the B matrix with the cost rate of the corresponding resultant losses>>>> Summarize all costs assigned to each causal losses in order to determine the total cost of that causal loss
PROCEDURE
The table below shows the defined cost rate for each loss category in each feasible process. The values represent the cost in NOK per unit of the resultant losses.
EXAMPLE
Cas
ting
Mac
hini
ng
Fini
shin
g
Ass
embl
y
Unit
CastErr1 599 NOK/kg
CastErr2 910 NOK/kg
MachErr1 269 NOK/occurrence
MachErr2 932 NOK/occurrence
FinRework 929 NOK/minute
Scrapping 823 NOK/unit scrapped
Idling 249 707 933 NOK/minute
Blocking 171 772 NOK/minute
Process
Loss
cat
egor
y
25Step 4: Calculate and assign costs to losses
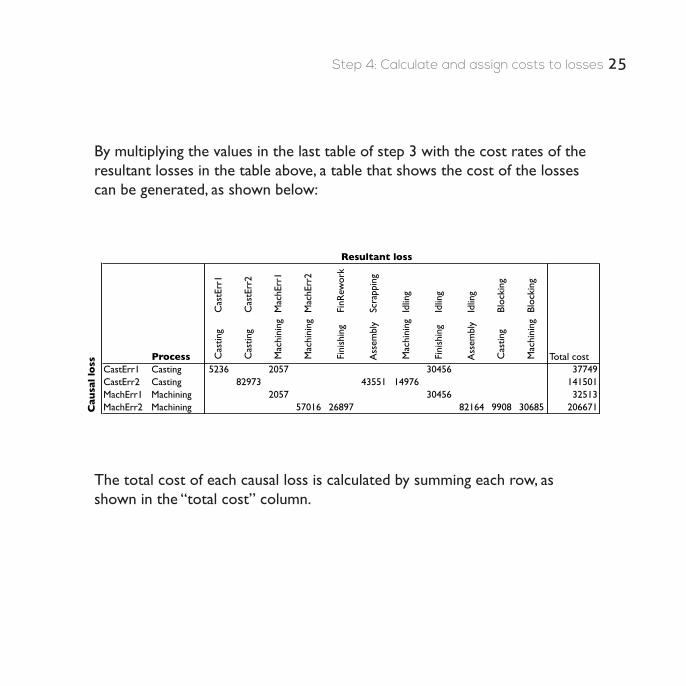
By multiplying the values in the last table of step 3 with the cost rates of the resultant losses in the table above, a table that shows the cost of the losses can be generated, as shown below:
The total cost of each causal loss is calculated by summing each row, as shown in the “total cost” column.
Cas
tErr
1
Cas
tErr
2
Mac
hErr
1
Mac
hErr
2
FinR
ewor
k
Scra
ppin
g
Idlin
g
Idlin
g
Idlin
g
Bloc
king
Bloc
king
Process Cas
ting
Cas
ting
Mac
hini
ng
Mac
hini
ng
Fin
ishi
ng
Ass
embl
y
Mac
hini
ng
Fin
ishi
ng
Ass
embl
y
Cas
ting
Mac
hini
ng
Total costCastErr1 Casting 5236 2057 30456 37749CastErr2 Casting 82973 43551 14976 141501MachErr1 Machining 2057 30456 32513MachErr2 Machining 57016 26897 82164 9908 30685 206671
Resultant loss
Cau
sal l
oss
Roadmap for Manufacturing Cost Deployment
STEP 5.
Identify improvement projects
26
27Step 5: Identify improvement projects
WHY
WHO
PREREQUISITES
In order to reduce losses, projects should target causal losses occurring in the processes. Project proposals are to include a quantitative assessment of the fractional proportion of a loss expected to be reduced from conducting a project.
This step should be conducted as group activities, including experienced operators and production management. Department manager, technical supervisor and supportive functions should participate in the preparation of project proposals.
The list of occurring losses, as well as causal-resultant relationships, obtained through steps 1-3 are relevant input to this step. However, the most important is the C matrix from step 4, in order to target the causal losses generating the largest total costs.
Proposed improvement projects to target causal losses. INFORMATION INTRODUCED IN THIS STEP
The D matrix, which shows the expected cost savings for each proposed project, combining data from losses and associated costs, and the fractional loss reductions from each project.
DELIVERABLES
28 Step 5: Identify improvement projects
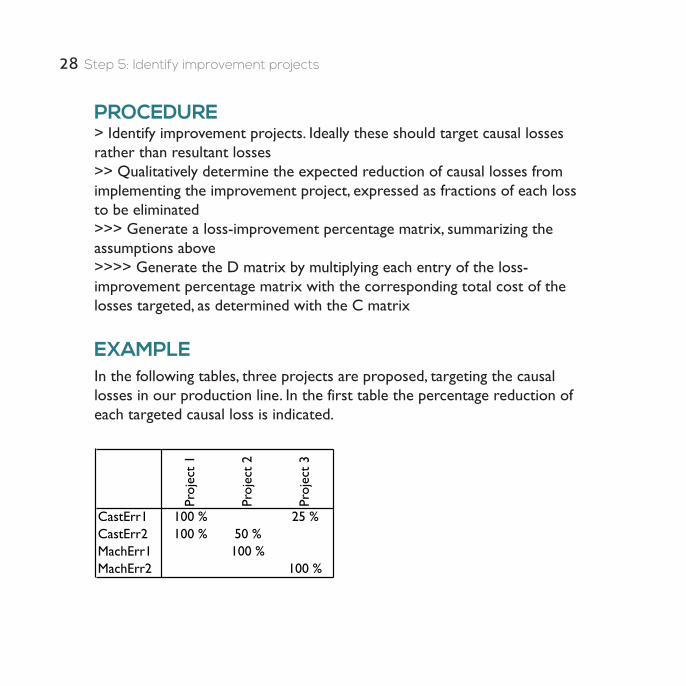
> Identify improvement projects. Ideally these should target causal losses rather than resultant losses>> Qualitatively determine the expected reduction of causal losses from implementing the improvement project, expressed as fractions of each loss to be eliminated>>> Generate a loss-improvement percentage matrix, summarizing the assumptions above>>>> Generate the D matrix by multiplying each entry of the loss-improvement percentage matrix with the corresponding total cost of the losses targeted, as determined with the C matrix
PROCEDURE
In the following tables, three projects are proposed, targeting the causal losses in our production line. In the first table the percentage reduction of each targeted causal loss is indicated.
EXAMPLE
Proj
ect
1
Proj
ect
2
Proj
ect
3
CastErr1 100 % 25 %CastErr2 100 % 50 %MachErr1 100 %MachErr2 100 %
29Step 5: Identify improvement projects
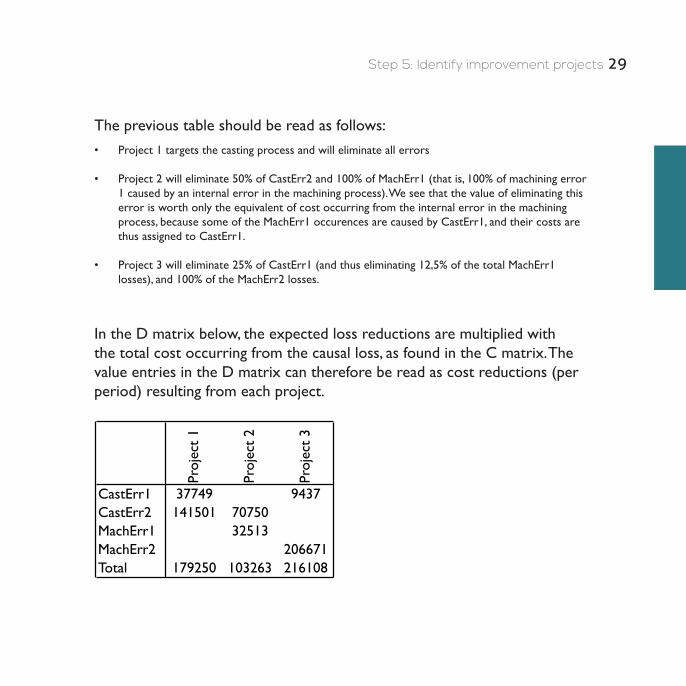
The previous table should be read as follows:
In the D matrix below, the expected loss reductions are multiplied with the total cost occurring from the causal loss, as found in the C matrix. The value entries in the D matrix can therefore be read as cost reductions (per period) resulting from each project.
• Project 1 targets the casting process and will eliminate all errors
• Project 2 will eliminate 50% of CastErr2 and 100% of MachErr1 (that is, 100% of machining error 1 caused by an internal error in the machining process). We see that the value of eliminating this error is worth only the equivalent of cost occurring from the internal error in the machining process, because some of the MachErr1 occurences are caused by CastErr1, and their costs are thus assigned to CastErr1.
• Project 3 will eliminate 25% of CastErr1 (and thus eliminating 12,5% of the total MachErr1 losses), and 100% of the MachErr2 losses.
Proj
ect
1
Proj
ect
2
Proj
ect
3
CastErr1 37749 9437CastErr2 141501 70750MachErr1 32513MachErr2 206671Total 179250 103263 216108
Roadmap for Manufacturing Cost Deployment
STEP 6.
Compile expected benefits from improvement project in terms of
reduced losses, set up against costs of project
30
31Step 6: Compile expected benefits from improvement project in terms of reduced losses, set up against costs of project
WHY
WHO
PREREQUISITES
In order to evaluate the cost/benefit of a project, and thus the project investment efficiency, it is necessary to compare implementation costs with expected benefits from the project.
Facility management in collaboration with personnel from departments responsible for procurement and improvement.
The list of potential improvement projects along with associated loss reductions, as obtained in step 5. Thus, the C and D matrices are the main inputs to do the compilation.
Cost of implementing the suggested improvement projects from step 5. INFORMATION INTRODUCED IN THIS STEP
32 Step 6: Compile expected benefits from improvement project in terms of reduced losses, set up against costs of project
The E matrix, which presents the investment efficiency associated with each project. This can be represented by the desired measure of investment efficiency, e.g. cost/benefit, ROI, Payback time, IRR etc.
> Obtain best estimates for project implementation costs>> Determine what measures to apply for evaluating the expected economic results from the projects>>> Determine investment efficiencies by aligning expected cost reductions and costs of project improvement, in accordance with selected measures
DELIVERABLES
PROCEDURE
33Step 6: Compile expected benefits from improvement project in terms of reduced losses, set up against costs of project
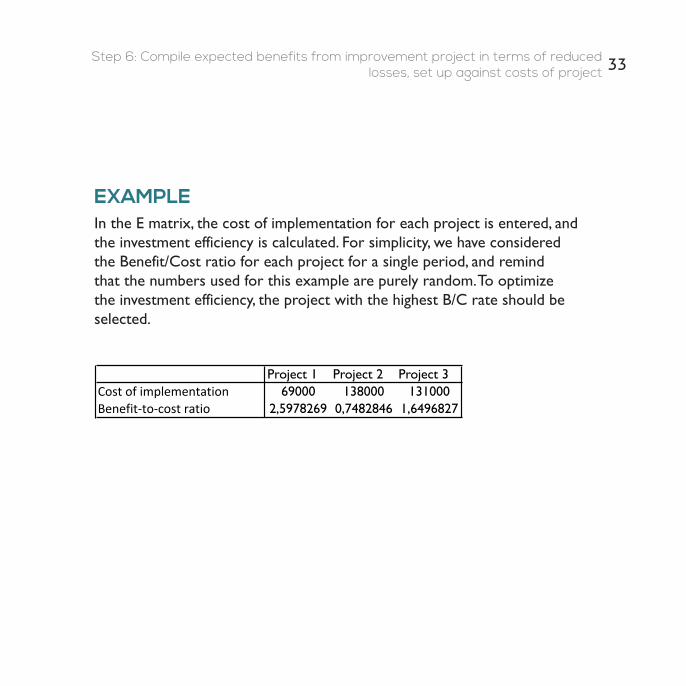
In the E matrix, the cost of implementation for each project is entered, and the investment efficiency is calculated. For simplicity, we have considered the Benefit/Cost ratio for each project for a single period, and remind that the numbers used for this example are purely random. To optimize the investment efficiency, the project with the highest B/C rate should be selected.
EXAMPLE
Project 1 Project 2 Project 3Costofimplementation 69000 138000 131000Benefit-to-costratio 2,5978269 0,7482846 1,6496827
Roadmap for Manufacturing Cost Deployment
STEP 7.
Decide what projects to implement, and establish a cost reduction plan
34
35Step 7: Decide what projects to implement, and establish a cost reduction plan
WHY
WHO
PREREQUISITES
Before projects are initiated, it is necessary to decide which of the proposed projects to implement at this point in time.
This step should be carried out as a group activity, including production management and accounting personnel.
The list of potential improvement projects along with associated loss reductions and costs of implementation, as obtained in step 5. Also, the E matrix from step 6 is an important input to this decision process.
Selection of projects to undertake, and planned scheduling, based on a qualitative decision process.
INFORMATION INTRODUCED IN THIS STEP
36 Step 7: Decide what projects to implement, and establish a cost reduction plan
A plan for implementing the selected projects from step 6, which contains expected cost reductions for the period.
> Select projects based on investment efficiencies, in accordance with other metrics set by the company >> Set a plan for implementation and responsibilities, as well as follow-up procedures
DELIVERABLES
PROCEDURE
37Step 7: Decide what projects to implement, and establish a cost reduction plan
For our example, to optimize our cost reduction program, we would select projects from the highest return rate and descending as long as it stays above 1, depending on the funds available for improvement projects.
EXAMPLE

38 Concluding remarks
Concluding remarksThis roadmap was developed as part of a master’s thesis at the Norwegian University of Science and Technology, Department of Industrial Economics and Technology Management, in collaboration with Norsk Hydro. The authors have applied a design science research methodology to refine the original framework. The roadmap is a deliverable of their thesis.
To contact the authors, please send e-mail to
Daniel H. Knutsen: [email protected] Chr. H. Høeg: [email protected]
39
ReferencesKnutsen, D. & Høeg, P. (2016). Developing a roadmap to Manufacturing Cost Deployment, Master’s thesis, NTNU
Yamashina, H., & Kubo, T. (2002). Manufacturing cost deployment. International Journal of Production Research, 40(16), 4077-4091
Printed in Trondheim, june 2016.CopyCat

2016


![Business Application Roadmap Manufacturing Company[1]](https://img.pdfslide.us/doc/110x75/5585ad17d8b42ae3228b4fe1/business-application-roadmap-manufacturing-company1-5585e292309c9.jpg)