Embed Size (px)
Citation preview
FINAL EVALUATION REPORT
ROAD SIDE SAFETY
SELAMAT PROJECT
HEALTH & NUTTIRION THEME-OTHER HEALTH AND NUTRITION
By
Henri Sitorus, PhD
Supriyono, MA
Yohanna, S.Sos.
(External Consultant)
Submitted to:
Submitted: APRIL 2018
Approved: May 2018
i
Preface
This report covers the Final Evaluation of the project “Road Side Safety/Sosialisasi dan Edukasi
Keselamatan Berlalu Lintas (SELAMAT) project” of the Save the Children Indonesia.
The evaluation team would like to express its gratitude to many people and stakeholder agencies.
We are very thankful to all professional staff of STC Bandung, particularly the SELAMAT Project
staff. Special thanks also to for the information provided during this evaluation from the
government official such as Office of Education, Office of Transportation, Schools management,
teacher, school children and their parents. In addition, the evaluation team would like to thank civil
society representative such as PMI, Camot and Badung Disiplin.
Their inputs have been beneficial to the evaluation team and helped in smoothly carrying out the
evaluation process.
Evaluation Team
ii
Contents
A. Background ................................................................................................................................ 1
B. Project Summary...................................................................................................................... 2
C. Objectives of Evaluation .......................................................................................................... 7
D. Evaluation Framework and Methodology ............................................................................. 8
D.1. Evaluation Framework ................................................................................................... 8
D.2. Evaluation Methodology................................................................................................. 9
D.3. Data Analysis Approach and Research Ethics ........................................................... 11
D.4. Profile of Respondents .................................................................................................. 12
D.5. Limitation of The Study ............................................................................................... 15
E. Evaluation Findings ............................................................................................................... 16
E.1. Relevance........................................................................................................................ 16
E.2. Effectiveness ................................................................................................................... 22
E.3. Project Impact ............................................................................................................... 38
E.4. Project Sustainability .................................................................................................... 40
E.5. Replicability and Scale .................................................................................................. 42
F. Conclusion and Recommendation......................................................................................... 43
F.1. Conclusion ...................................................................................................................... 43
F.3. Lesson Learned .............................................................................................................. 43
F.4. Recommendations.......................................................................................................... 44
References .................................................................................................................................... 46
iii
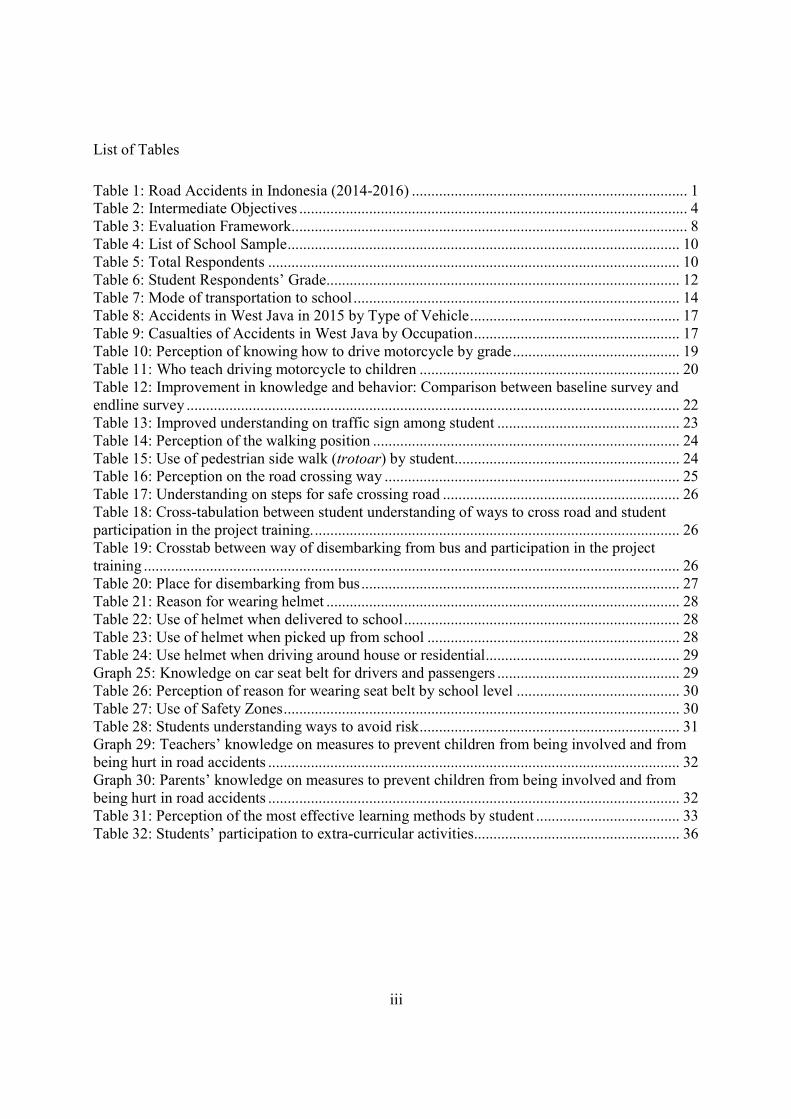
List of Tables
Table 1: Road Accidents in Indonesia (2014-2016) ....................................................................... 1
Table 2: Intermediate Objectives .................................................................................................... 4
Table 3: Evaluation Framework...................................................................................................... 8
Table 4: List of School Sample ..................................................................................................... 10
Table 5: Total Respondents .......................................................................................................... 10
Table 6: Student Respondents’ Grade........................................................................................... 12
Table 7: Mode of transportation to school .................................................................................... 14
Table 8: Accidents in West Java in 2015 by Type of Vehicle ...................................................... 17
Table 9: Casualties of Accidents in West Java by Occupation ..................................................... 17
Table 10: Perception of knowing how to drive motorcycle by grade ........................................... 19
Table 11: Who teach driving motorcycle to children ................................................................... 20
Table 12: Improvement in knowledge and behavior: Comparison between baseline survey and
endline survey ............................................................................................................................... 22
Table 13: Improved understanding on traffic sign among student ............................................... 23
Table 14: Perception of the walking position ............................................................................... 24
Table 15: Use of pedestrian side walk (trotoar) by student.......................................................... 24
Table 16: Perception on the road crossing way ............................................................................ 25
Table 17: Understanding on steps for safe crossing road ............................................................. 26
Table 18: Cross-tabulation between student understanding of ways to cross road and student
participation in the project training. .............................................................................................. 26
Table 19: Crosstab between way of disembarking from bus and participation in the project
training .......................................................................................................................................... 26
Table 20: Place for disembarking from bus .................................................................................. 27
Table 21: Reason for wearing helmet ........................................................................................... 28
Table 22: Use of helmet when delivered to school ....................................................................... 28
Table 23: Use of helmet when picked up from school ................................................................. 28
Table 24: Use helmet when driving around house or residential .................................................. 29
Graph 25: Knowledge on car seat belt for drivers and passengers ............................................... 29
Table 26: Perception of reason for wearing seat belt by school level .......................................... 30
Table 27: Use of Safety Zones ...................................................................................................... 30
Table 28: Students understanding ways to avoid risk ................................................................... 31
Graph 29: Teachers’ knowledge on measures to prevent children from being involved and from
being hurt in road accidents .......................................................................................................... 32
Graph 30: Parents’ knowledge on measures to prevent children from being involved and from
being hurt in road accidents .......................................................................................................... 32
Table 31: Perception of the most effective learning methods by student ..................................... 33
Table 32: Students’ participation to extra-curricular activities..................................................... 36
iv
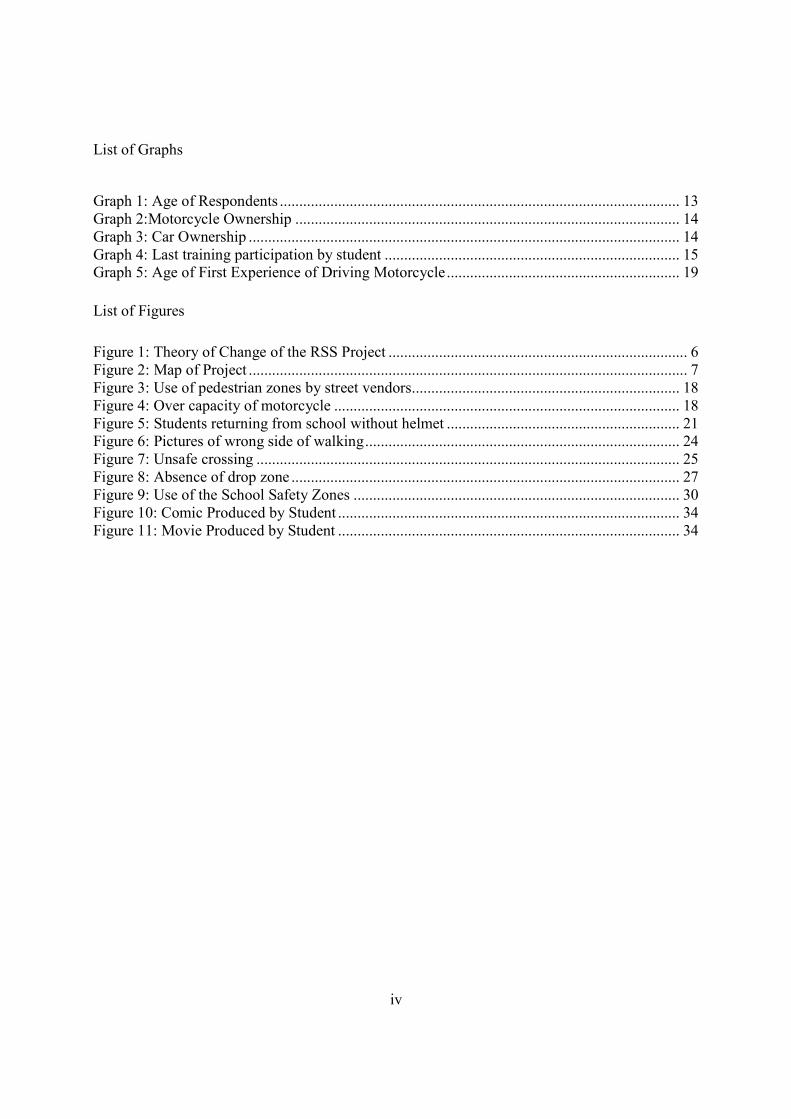
List of Graphs
Graph 1: Age of Respondents ....................................................................................................... 13
Graph 2:Motorcycle Ownership ................................................................................................... 14
Graph 3: Car Ownership ............................................................................................................... 14
Graph 4: Last training participation by student ............................................................................ 15
Graph 5: Age of First Experience of Driving Motorcycle ............................................................ 19
List of Figures
Figure 1: Theory of Change of the RSS Project ............................................................................. 6
Figure 2: Map of Project ................................................................................................................. 7
Figure 3: Use of pedestrian zones by street vendors ..................................................................... 18
Figure 4: Over capacity of motorcycle ......................................................................................... 18
Figure 5: Students returning from school without helmet ............................................................ 21
Figure 6: Pictures of wrong side of walking ................................................................................. 24
Figure 7: Unsafe crossing ............................................................................................................. 25
Figure 8: Absence of drop zone .................................................................................................... 27
Figure 9: Use of the School Safety Zones .................................................................................... 30
Figure 10: Comic Produced by Student ........................................................................................ 34
Figure 11: Movie Produced by Student ........................................................................................ 34

v
Abbreviation
AJI : Aliansi Jurnalis Independen/Independent Journalist Association
ASEAN : Association of Southeast Asian Nations
BOS : Bantuan Operasional Sekolah/School Operational Funds
Camot : Cegah Anak Mengendarai Motor
DEO : District Education Office
DLLAJ : Dinas Lalu Lintas Angkutan Jalan/City Land Transportation Agency
DTMO : District Transportation Ministry Office
DTPO : District Traffic Police Office
IDR : Indonesian Rupiah
IEC : International Education Center
IO : Intermediate Objective
KPK : Koalisi Pejalan Kaki/Pedestrian Coalition
MSC : Most Significant Change
OSIS : Organisasi Siswa Intra Sekolah/School Students Organization
Paskibra : Pasukan Pengibar Bendera/Flag Hoisting Troop
PKS : Patroli Keamanan Sekolah/School Patrol
PMI : Palang Merah Indonesia/Indonesian Red Cross
PMR : Palang Merah Remaja/Youth Red Cross
Pocil : Polisi Cilik/Little Police
PPKN : Pendidikan Pancasila dan Kewarnageraan/ Pancasila (Five
Priciples) and Citizenship Education
PUSJATAN : Pusat Penelitian dan Pengembangan Jalan dan Jembatan/
Institute of Road Engineering – Ministry of Public Works
RSA : Road Safety Association
RSS : Road Side Safety
SD : Sekolah Dasar/Primary School
SELAMAT : Sosialisasi dan Edukasi Keselamatan Berlalu Lintas
SMP : Sekolah Menengah Pertama/Junior High School
SPSS : Statistical Package for the Social Sciences
SRoI : Social Return on Investment
STATA : Statistica and Data
TOT : Training of Trainers
UNCRC : United Nations Conventions on the Rights of Children
WHO : World Health Organization
vi
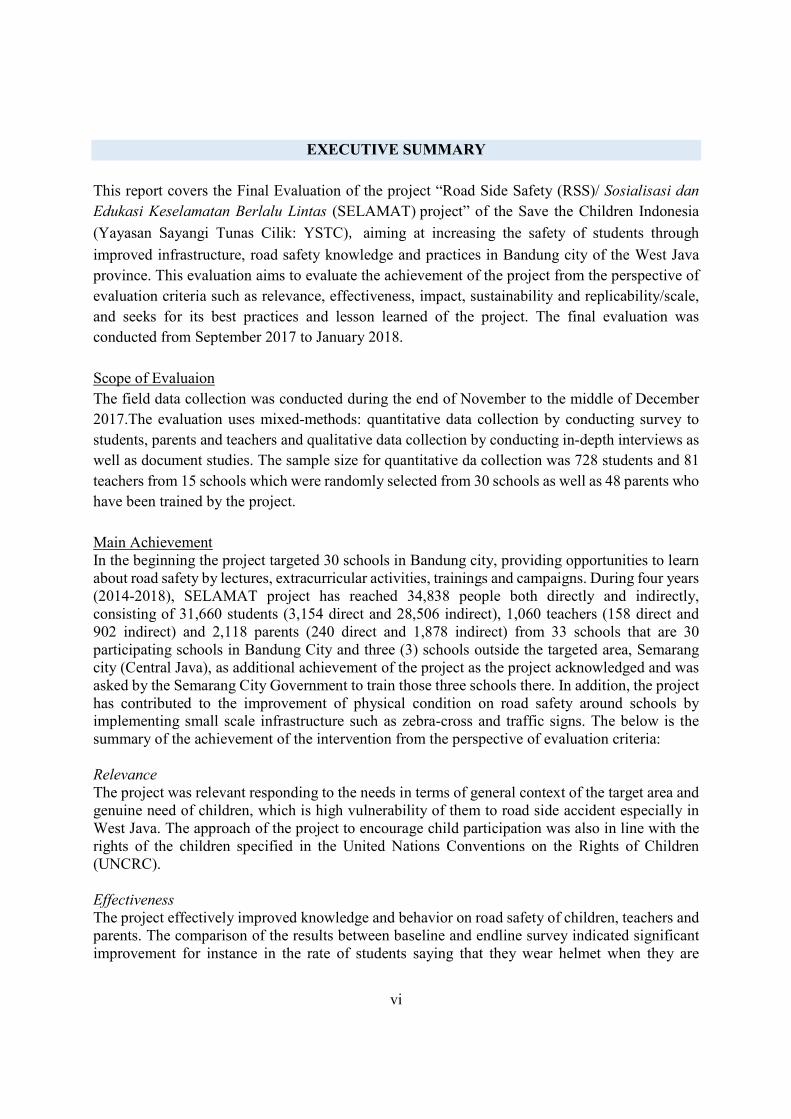
EXECUTIVE SUMMARY
This report covers the Final Evaluation of the project “Road Side Safety (RSS)/ Sosialisasi dan
Edukasi Keselamatan Berlalu Lintas (SELAMAT) project” of the Save the Children Indonesia
(Yayasan Sayangi Tunas Cilik: YSTC), aiming at increasing the safety of students through
improved infrastructure, road safety knowledge and practices in Bandung city of the West Java
province. This evaluation aims to evaluate the achievement of the project from the perspective of
evaluation criteria such as relevance, effectiveness, impact, sustainability and replicability/scale,
and seeks for its best practices and lesson learned of the project. The final evaluation was
conducted from September 2017 to January 2018.
Scope of Evaluaion
The field data collection was conducted during the end of November to the middle of December
2017.The evaluation uses mixed-methods: quantitative data collection by conducting survey to
students, parents and teachers and qualitative data collection by conducting in-depth interviews as
well as document studies. The sample size for quantitative da collection was 728 students and 81
teachers from 15 schools which were randomly selected from 30 schools as well as 48 parents who
have been trained by the project.
Main Achievement
In the beginning the project targeted 30 schools in Bandung city, providing opportunities to learn
about road safety by lectures, extracurricular activities, trainings and campaigns. During four years
(2014-2018), SELAMAT project has reached 34,838 people both directly and indirectly,
consisting of 31,660 students (3,154 direct and 28,506 indirect), 1,060 teachers (158 direct and
902 indirect) and 2,118 parents (240 direct and 1,878 indirect) from 33 schools that are 30
participating schools in Bandung City and three (3) schools outside the targeted area, Semarang
city (Central Java), as additional achievement of the project as the project acknowledged and was
asked by the Semarang City Government to train those three schools there. In addition, the project
has contributed to the improvement of physical condition on road safety around schools by
implementing small scale infrastructure such as zebra-cross and traffic signs. The below is the
summary of the achievement of the intervention from the perspective of evaluation criteria:
Relevance
The project was relevant responding to the needs in terms of general context of the target area and
genuine need of children, which is high vulnerability of them to road side accident especially in
West Java. The approach of the project to encourage child participation was also in line with the
rights of the children specified in the United Nations Conventions on the Rights of Children
(UNCRC).
Effectiveness
The project effectively improved knowledge and behavior on road safety of children, teachers and
parents. The comparison of the results between baseline and endline survey indicated significant
improvement for instance in the rate of students saying that they wear helmet when they are
vii
dropped at or picked up from school by motorcycle, the rate of teachers and parents who can
answer measures to prevent children from being involved and being hurt in accidents. It should be
noted that there are children saying that they do not use crossing facilities for safety because there
is no such infrastructure or it is not available. In terms of approach, the evaluation found the
effectiveness of the method of the project delivery such as peer-education method to maximize
child participation and reach more children effectively.
Impact
The evaluation identified that the project has influenced policies of stakeholders at various level,
starting from Office of Transportation of Bandung city to civil society organizations. Although it
is not evidence based, inputs by schools indicates that significant decrease in the number of
accidents is recognized since the schools started participating to the project, which is the ultimate
goal of the project.
Sustainability
The project ensured the sustainability of the outcomes of the project by influencing schools in the
way that they introduced policies on promoting road safety for children and continuation of
activities to raise awareness on road safety. Majority of the schools continue road safety education
by adopting it into their curriculum or utilizing extra-curricular activities or other occasions, and
made school policies on road safety, for instance to check the helmet use of children.
Replicability and Scale
The project has received high reputation from other cities which requested technical assistance
including sharing experiences and lessons learned. Although it is not easy to replicate the project
or to apply the same approach in other contexts, the project as a successful example showcased the
importance and the effectiveness of road safety project so that it can be replicated in other cities in
the future.
Main Challenges and Lessons Learned
The project found, in its implementation, that there is a need to encourage parents of children and
society to change their mindset and behavior, which could be done through working together with
civil society organizations. In addition, the challenge which the project did not target but is critical
is to how to strengthen the regulation and enforcement of laws related to road safety. This is not
something that can not be improved by the side of children, which applies to the lack of road safety
facilities. It should be noted that the project in the area of road safety was new to YSTC and thus
the expertise was limited in the beginning of the project. Kowledge and experiences shall be well
managed and shared within the organization.
Recommendations
The evaluation recommends: to try to integrate the program of road safety within the formal
education curriculum; to work at community level to change wrong habits and tradition on road
safety; to adovocate local government for more commitment for resource allocation for safer
environment for children; and build capacity of local institutions and involve them effectively.
1
A. Background
Road safety is a vital public concern that affect all population every day but young people are
generally regarded as a high-risk road user group (Harman and Murphy, 2008). Globally, road
traffic injuries claim more than 1.2 million lives each year and have a huge impact on health and
development. They are the leading cause of death among young people aged between 15 and 29
years, and cost governments approximately 3% of GDP, but up to 5% in low- and middle-income
countries (WHO, 2016). Absence of road safety has become silent epidemic in Indonesia due to
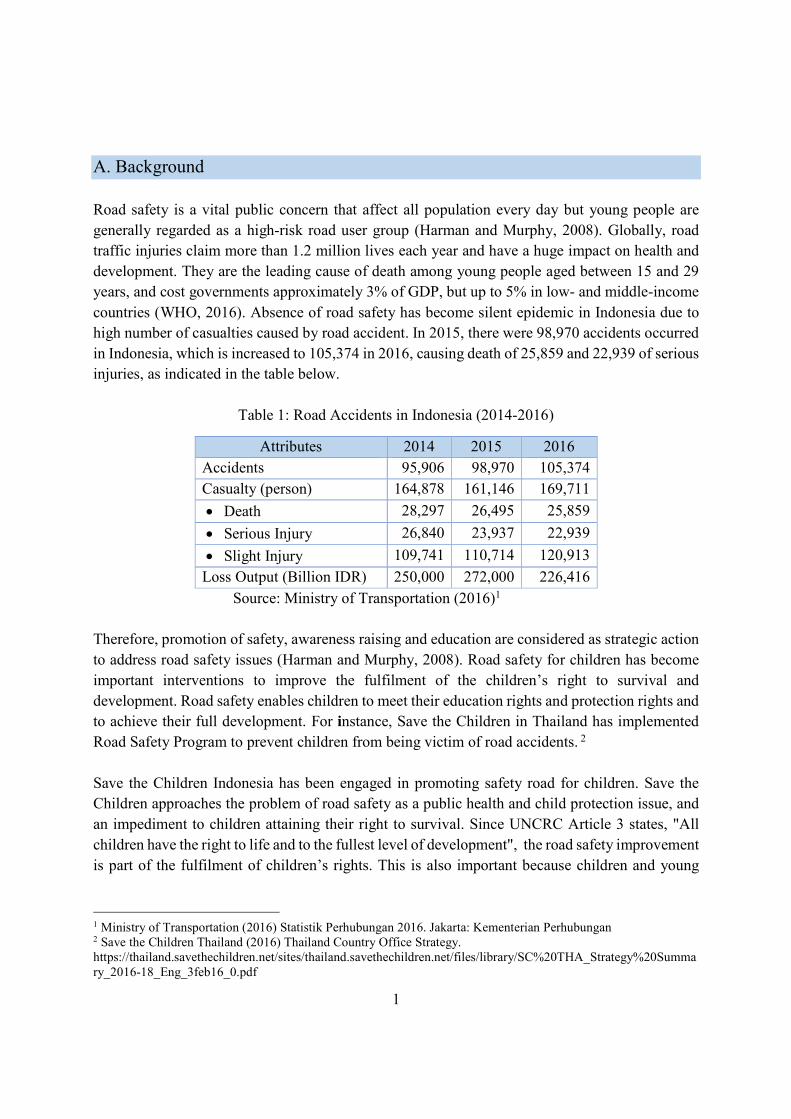
high number of casualties caused by road accident. In 2015, there were 98,970 accidents occurred
in Indonesia, which is increased to 105,374 in 2016, causing death of 25,859 and 22,939 of serious
injuries, as indicated in the table below.
Table 1: Road Accidents in Indonesia (2014-2016)
Attributes 2014 2015 2016
Accidents 95,906 98,970 105,374
Casualty (person) 164,878 161,146 169,711
Death 28,297 26,495 25,859
Serious Injury 26,840 23,937 22,939
Slight Injury 109,741 110,714 120,913
Loss Output (Billion IDR) 250,000 272,000 226,416
Source: Ministry of Transportation (2016)1
Therefore, promotion of safety, awareness raising and education are considered as strategic action
to address road safety issues (Harman and Murphy, 2008). Road safety for children has become
important interventions to improve the fulfilment of the children’s right to survival and
development. Road safety enables children to meet their education rights and protection rights and
to achieve their full development. For instance, Save the Children in Thailand has implemented
Road Safety Program to prevent children from being victim of road accidents. 2
Save the Children Indonesia has been engaged in promoting safety road for children. Save the
Children approaches the problem of road safety as a public health and child protection issue, and
an impediment to children attaining their right to survival. Since UNCRC Article 3 states, "All
children have the right to life and to the fullest level of development", the road safety improvement
is part of the fulfilment of children’s rights. This is also important because children and young
1 Ministry of Transportation (2016) Statistik Perhubungan 2016. Jakarta: Kementerian Perhubungan 2 Save the Children Thailand (2016) Thailand Country Office Strategy.
https://thailand.savethechildren.net/sites/thailand.savethechildren.net/files/library/SC%20THA_Strategy%20Summa
ry_2016-18_Eng_3feb16_0.pdf
2
people are most vulnerable to road accidents and road accidents become of the leading causes of
death among children in Indonesia.3
Starting from April 2014, Save the Children Indonesia started a program to improve road safety
and decrease traffic accidents and fatalities among children and youth in Bandung city, West Java
province, as Road Side Safety/Sosialisasi dan Edukasi Keselamatan Berlalu Lintas (SELAMAT).
The project was financially supported by Sompo Insurance and implemented in partnership with
Schools, Office of Education of Bandung City and collaboration with civil society organizations.
The project aims to increase the safety of students through improved infrastructure, road safety
knowledge, and practices in Bandung city.
To achieve its goal, the project has set four intermediate objectives as follows:
1. Increased knowledge of school-based road safety
2. Improved physical road safety infrastructure near schools
3. Improved knowledge and practices among teachers and students
4. Increased public and local government awareness of road safety
The project implemented activities under each intermediate objective above: comprehensive road
safety studies; facilitate road safety infrastructure near school; facilitate trainings for student,
teacher and school’s staff and student’s parent; and advocacy and campaign to increase public
awareness.
B. Project Summary
The ultimate goal of the road side safety project is to reduce the number of road traffic accident
involving children and youth in the area of 30 target schools of Bandung city, West Java Province
and 3 additional schools in Semarang City, Central Java. The project provided trainings to 32,416
students (2,164 direct and 32,416 indirect), 144 teachers and 2,118 parents (240 direct and 1,878
indirect) aiming at increasing knowledge on road safety and contribute to behavioral change with
the expectation to reduce the number of traffic accidents. In addition to the trainings, the project
also supported public awareness raising on road safety and improvement of road safety facilities
and infrastructures around schools.
Project Goal:
The project aims to increase the safety of students through improved infrastructure, road safety
knowledge, and practices in Bandung city of the West Java province. The following is the list of
activities under each Intermediate Objective (IO) and summary of the outputs.
3 http://www.who.int/roadsafety/week/2015/events/Indonesia/en/
3
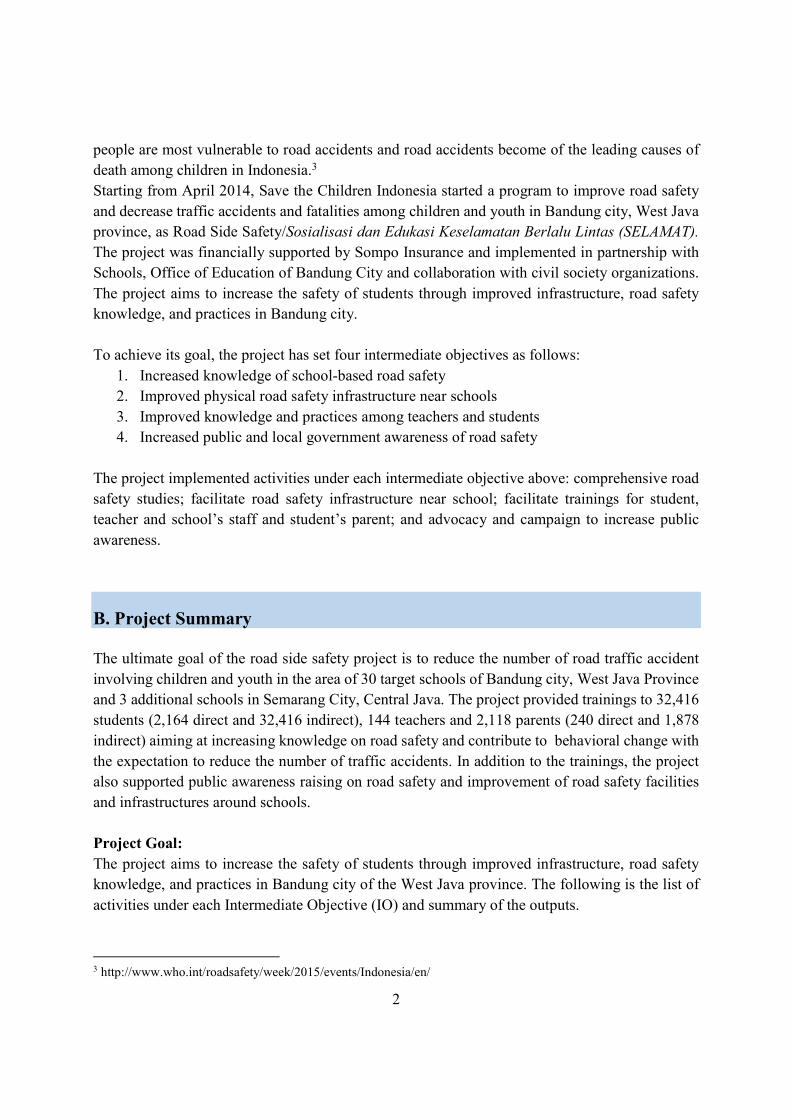
IO#1: Increased knowledge of school-based road safety
Activities under this IO include the following:
1.1. To conduct research to get information about school-based RS situation in Bandung
1.2. To disseminate research findings to relevant stakeholders
The project has conducted comprehensive studies including initial assessment, baseline survey and
final evaluation including endline survey. The result and findings were shared and disseminated
through meetings with local government and stakeholders including Office of Education service
and Office of Transportation service. Relationship with them for effective coordination and
cooperation were established through such meetings, and the results of survey were used as a
resource to plan the details of the activities.
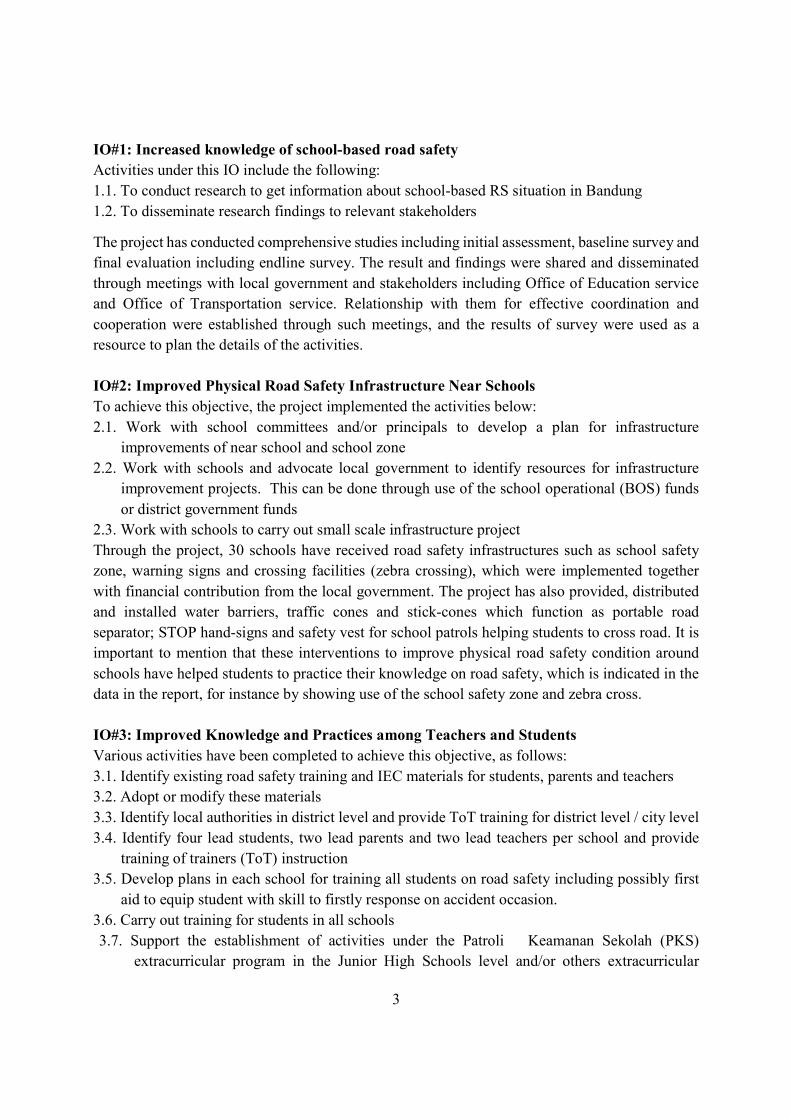
IO#2: Improved Physical Road Safety Infrastructure Near Schools
To achieve this objective, the project implemented the activities below:
2.1. Work with school committees and/or principals to develop a plan for infrastructure
improvements of near school and school zone
2.2. Work with schools and advocate local government to identify resources for infrastructure
improvement projects. This can be done through use of the school operational (BOS) funds
or district government funds
2.3. Work with schools to carry out small scale infrastructure project
Through the project, 30 schools have received road safety infrastructures such as school safety
zone, warning signs and crossing facilities (zebra crossing), which were implemented together
with financial contribution from the local government. The project has also provided, distributed
and installed water barriers, traffic cones and stick-cones which function as portable road
separator; STOP hand-signs and safety vest for school patrols helping students to cross road. It is
important to mention that these interventions to improve physical road safety condition around
schools have helped students to practice their knowledge on road safety, which is indicated in the
data in the report, for instance by showing use of the school safety zone and zebra cross.
IO#3: Improved Knowledge and Practices among Teachers and Students
Various activities have been completed to achieve this objective, as follows:
3.1. Identify existing road safety training and IEC materials for students, parents and teachers
3.2. Adopt or modify these materials
3.3. Identify local authorities in district level and provide ToT training for district level / city level
3.4. Identify four lead students, two lead parents and two lead teachers per school and provide
training of trainers (ToT) instruction
3.5. Develop plans in each school for training all students on road safety including possibly first
aid to equip student with skill to firstly response on accident occasion.
3.6. Carry out training for students in all schools
3.7. Support the establishment of activities under the Patroli Keamanan Sekolah (PKS)
extracurricular program in the Junior High Schools level and/or others extracurricular
4
program in both elementary and junior high schools related with road safety that supported
by the police that teaches students about traffic regulations and practices.
3.8. Identify additional student, parents or teacher-led measures that can be taken to promote
road safety near the school
3.9. Carry out identified measures to further promote roadside safety
3.10. Carry out training for parents
The project delivered trainings to 144 teachers and school officials, 240 parents and more than
34,580 students including 300 peer-educator. Contents of trainings included: (1) Road safety
issues; (2) School Mapping; (3) Road Safety Education Strategies; (4) Action Plan Development.
Trainings for student’s materials cover the following: (1) Awareness Raising; (2) Traffic Survey;
(3) Traffic Sign Introduction.
IO#4: Increased Public and Local Government Awareness of Road Safety
The project can be categorized as advocacy to increase public and local government awareness on
road safety, though the following activities:
4.1. Identify general gaps in knowledge and practices among the population of the areas near
schools
4.2. Work with local authorities, students, parents and community members to design a
comprehensive public awareness campaign on road safety
4.3. Implement the campaign.
4.4. Develop and support a working group on road safety at the district level. This group can
include students, parents, educators, government officials, the private sector, and others.
4.5. Meet regularly with the local government to advocate for improved policies and resource
allocation for roadside safety, particularly linked to schools
The project has conducted various campaigns to raise awareness of local government and publics
on road safety, including events on the occasion of Chidren Day and World Day of Remembarance
for Traffic Victims, and spreaded messages on road safety through local radio programmes, which
reached to public widely.
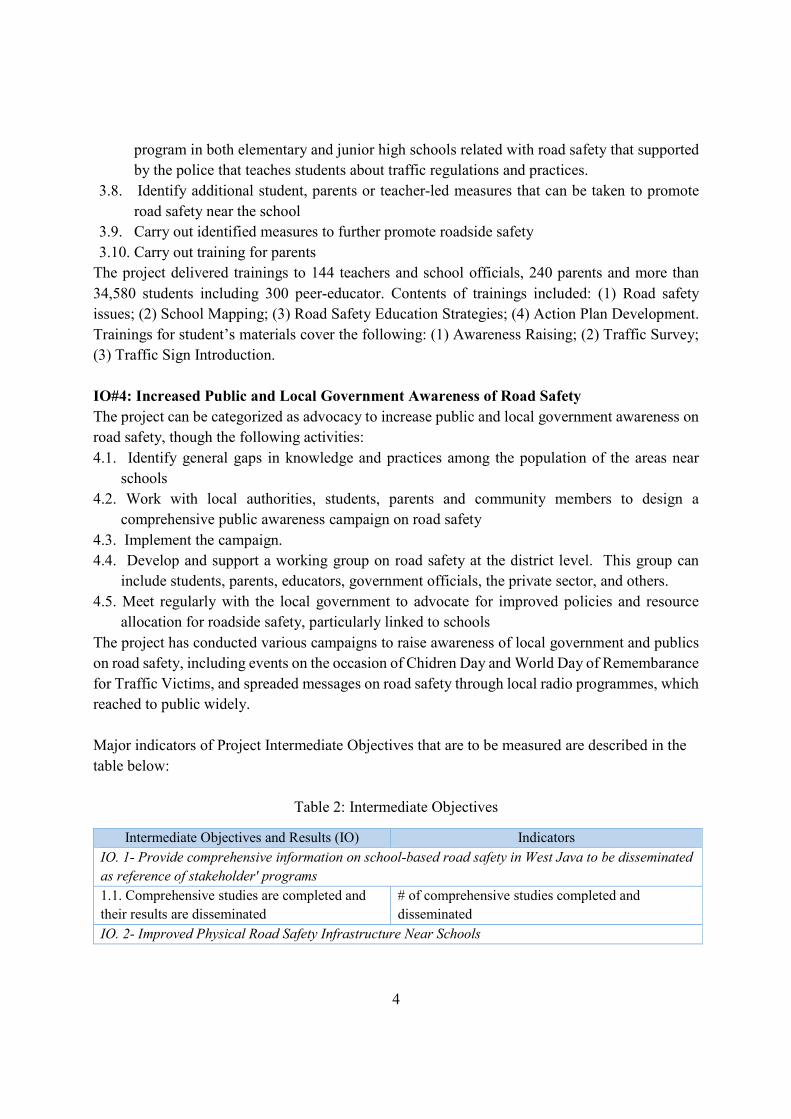
Major indicators of Project Intermediate Objectives that are to be measured are described in the
table below:
Table 2: Intermediate Objectives
Intermediate Objectives and Results (IO) Indicators
IO. 1- Provide comprehensive information on school-based road safety in West Java to be disseminated
as reference of stakeholder' programs
1.1. Comprehensive studies are completed and
their results are disseminated
# of comprehensive studies completed and
disseminated
IO. 2- Improved Physical Road Safety Infrastructure Near Schools
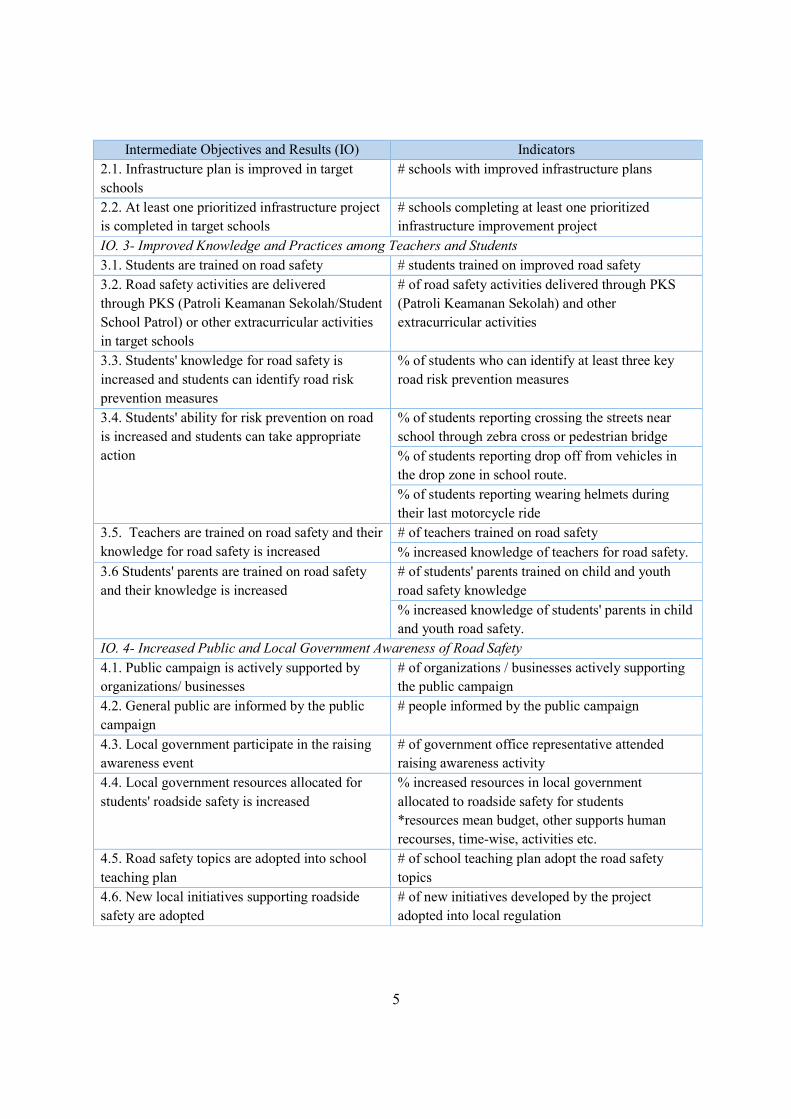
5
Intermediate Objectives and Results (IO) Indicators
2.1. Infrastructure plan is improved in target
schools
# schools with improved infrastructure plans
2.2. At least one prioritized infrastructure project
is completed in target schools
# schools completing at least one prioritized
infrastructure improvement project
IO. 3- Improved Knowledge and Practices among Teachers and Students
3.1. Students are trained on road safety # students trained on improved road safety
3.2. Road safety activities are delivered
through PKS (Patroli Keamanan Sekolah/Student
School Patrol) or other extracurricular activities
in target schools
# of road safety activities delivered through PKS
(Patroli Keamanan Sekolah) and other
extracurricular activities
3.3. Students' knowledge for road safety is
increased and students can identify road risk
prevention measures
% of students who can identify at least three key
road risk prevention measures
3.4. Students' ability for risk prevention on road
is increased and students can take appropriate
action
% of students reporting crossing the streets near
school through zebra cross or pedestrian bridge
% of students reporting drop off from vehicles in
the drop zone in school route.
% of students reporting wearing helmets during
their last motorcycle ride
3.5. Teachers are trained on road safety and their
knowledge for road safety is increased
# of teachers trained on road safety
% increased knowledge of teachers for road safety.
3.6 Students' parents are trained on road safety
and their knowledge is increased
# of students' parents trained on child and youth
road safety knowledge
% increased knowledge of students' parents in child
and youth road safety.
IO. 4- Increased Public and Local Government Awareness of Road Safety
4.1. Public campaign is actively supported by
organizations/ businesses
# of organizations / businesses actively supporting
the public campaign
4.2. General public are informed by the public
campaign
# people informed by the public campaign
4.3. Local government participate in the raising
awareness event
# of government office representative attended
raising awareness activity
4.4. Local government resources allocated for
students' roadside safety is increased
% increased resources in local government
allocated to roadside safety for students
*resources mean budget, other supports human
recourses, time-wise, activities etc.
4.5. Road safety topics are adopted into school
teaching plan
# of school teaching plan adopt the road safety
topics
4.6. New local initiatives supporting roadside
safety are adopted
# of new initiatives developed by the project
adopted into local regulation
6
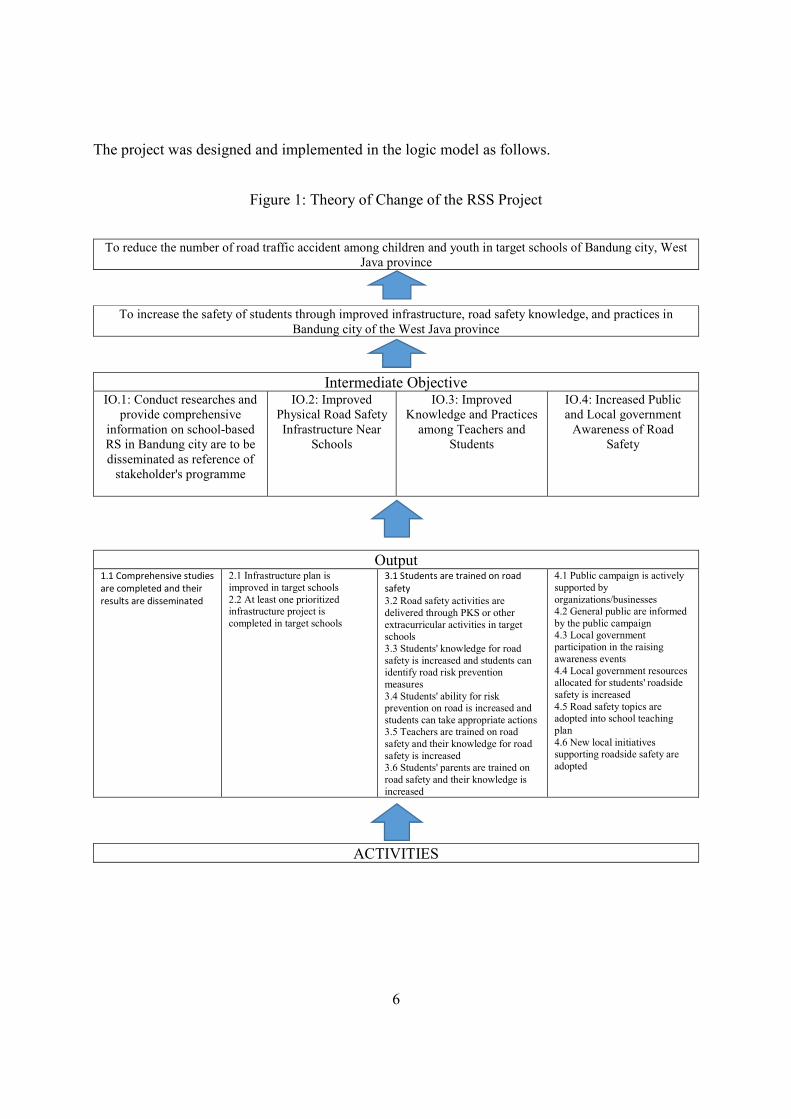
The project was designed and implemented in the logic model as follows.
Figure 1: Theory of Change of the RSS Project
To reduce the number of road traffic accident among children and youth in target schools of Bandung city, West
Java province
To increase the safety of students through improved infrastructure, road safety knowledge, and practices in
Bandung city of the West Java province
Intermediate Objective IO.1: Conduct researches and
provide comprehensive
information on school-based
RS in Bandung city are to be
disseminated as reference of
stakeholder's programme
IO.2: Improved
Physical Road Safety
Infrastructure Near
Schools
IO.3: Improved
Knowledge and Practices
among Teachers and
Students
IO.4: Increased Public
and Local government
Awareness of Road
Safety
Output 1.1 Comprehensive studies
are completed and their
results are disseminated
2.1 Infrastructure plan is
improved in target schools
2.2 At least one prioritized infrastructure project is
completed in target schools
3.1 Students are trained on road
safety
3.2 Road safety activities are
delivered through PKS or other
extracurricular activities in target schools
3.3 Students' knowledge for road
safety is increased and students can identify road risk prevention
measures
3.4 Students' ability for risk prevention on road is increased and
students can take appropriate actions 3.5 Teachers are trained on road
safety and their knowledge for road
safety is increased 3.6 Students' parents are trained on
road safety and their knowledge is
increased
4.1 Public campaign is actively
supported by
organizations/businesses 4.2 General public are informed
by the public campaign 4.3 Local government participation in the raising
awareness events
4.4 Local government resources allocated for students' roadside
safety is increased
4.5 Road safety topics are adopted into school teaching
plan
4.6 New local initiatives supporting roadside safety are
adopted
ACTIVITIES

7
Figure 2: Map of Project
SD SMP
C. Objectives of Evaluation
The evaluation aims to:
1. Identify whether the Strategic Objective and Intermediate Objective indicators have been
achieved and the key elements contributing to this achievement or lack of achievement.
2. Identify and analyze changes on targeted school’s road side safety practices contributed by
the project.
8
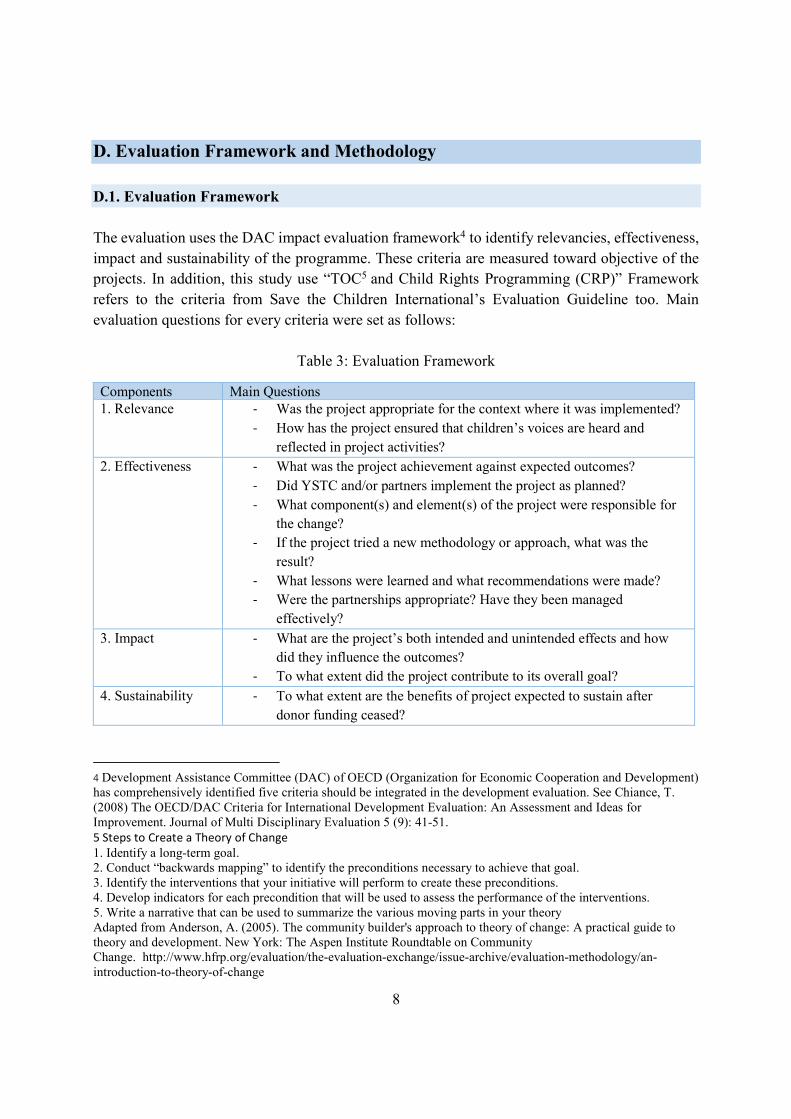
D. Evaluation Framework and Methodology
D.1. Evaluation Framework
The evaluation uses the DAC impact evaluation framework4 to identify relevancies, effectiveness,
impact and sustainability of the programme. These criteria are measured toward objective of the
projects. In addition, this study use “TOC5 and Child Rights Programming (CRP)” Framework
refers to the criteria from Save the Children International’s Evaluation Guideline too. Main
evaluation questions for every criteria were set as follows:
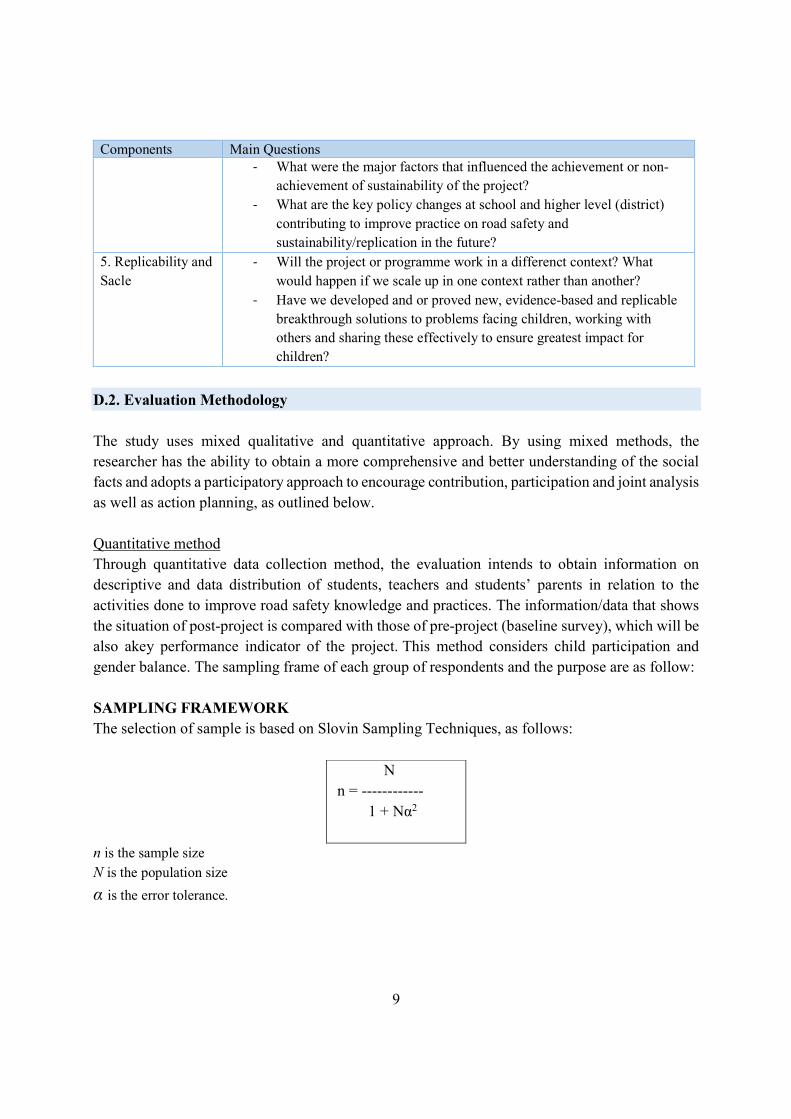
Table 3: Evaluation Framework
Components Main Questions
1. Relevance - Was the project appropriate for the context where it was implemented?
- How has the project ensured that children’s voices are heard and
reflected in project activities?
2. Effectiveness - What was the project achievement against expected outcomes?
- Did YSTC and/or partners implement the project as planned?
- What component(s) and element(s) of the project were responsible for
the change?
- If the project tried a new methodology or approach, what was the
result?
- What lessons were learned and what recommendations were made?
- Were the partnerships appropriate? Have they been managed
effectively?
3. Impact - What are the project’s both intended and unintended effects and how
did they influence the outcomes?
- To what extent did the project contribute to its overall goal?
4. Sustainability - To what extent are the benefits of project expected to sustain after
donor funding ceased?
4 Development Assistance Committee (DAC) of OECD (Organization for Economic Cooperation and Development)
has comprehensively identified five criteria should be integrated in the development evaluation. See Chiance, T.
(2008) The OECD/DAC Criteria for International Development Evaluation: An Assessment and Ideas for
Improvement. Journal of Multi Disciplinary Evaluation 5 (9): 41-51.
5 Steps to Create a Theory of Change
1. Identify a long-term goal.
2. Conduct “backwards mapping” to identify the preconditions necessary to achieve that goal.
3. Identify the interventions that your initiative will perform to create these preconditions.
4. Develop indicators for each precondition that will be used to assess the performance of the interventions.
5. Write a narrative that can be used to summarize the various moving parts in your theory
Adapted from Anderson, A. (2005). The community builder's approach to theory of change: A practical guide to
theory and development. New York: The Aspen Institute Roundtable on Community
Change. http://www.hfrp.org/evaluation/the-evaluation-exchange/issue-archive/evaluation-methodology/an-
introduction-to-theory-of-change
9
Components Main Questions
- What were the major factors that influenced the achievement or non-
achievement of sustainability of the project?
- What are the key policy changes at school and higher level (district)
contributing to improve practice on road safety and
sustainability/replication in the future?
5. Replicability and
Sacle
- Will the project or programme work in a differenct context? What
would happen if we scale up in one context rather than another?
- Have we developed and or proved new, evidence-based and replicable
breakthrough solutions to problems facing children, working with
others and sharing these effectively to ensure greatest impact for
children?
D.2. Evaluation Methodology
The study uses mixed qualitative and quantitative approach. By using mixed methods, the
researcher has the ability to obtain a more comprehensive and better understanding of the social
facts and adopts a participatory approach to encourage contribution, participation and joint analysis
as well as action planning, as outlined below.
Quantitative method
Through quantitative data collection method, the evaluation intends to obtain information on
descriptive and data distribution of students, teachers and students’ parents in relation to the
activities done to improve road safety knowledge and practices. The information/data that shows
the situation of post-project is compared with those of pre-project (baseline survey), which will be
also akey performance indicator of the project. This method considers child participation and
gender balance. The sampling frame of each group of respondents and the purpose are as follow:
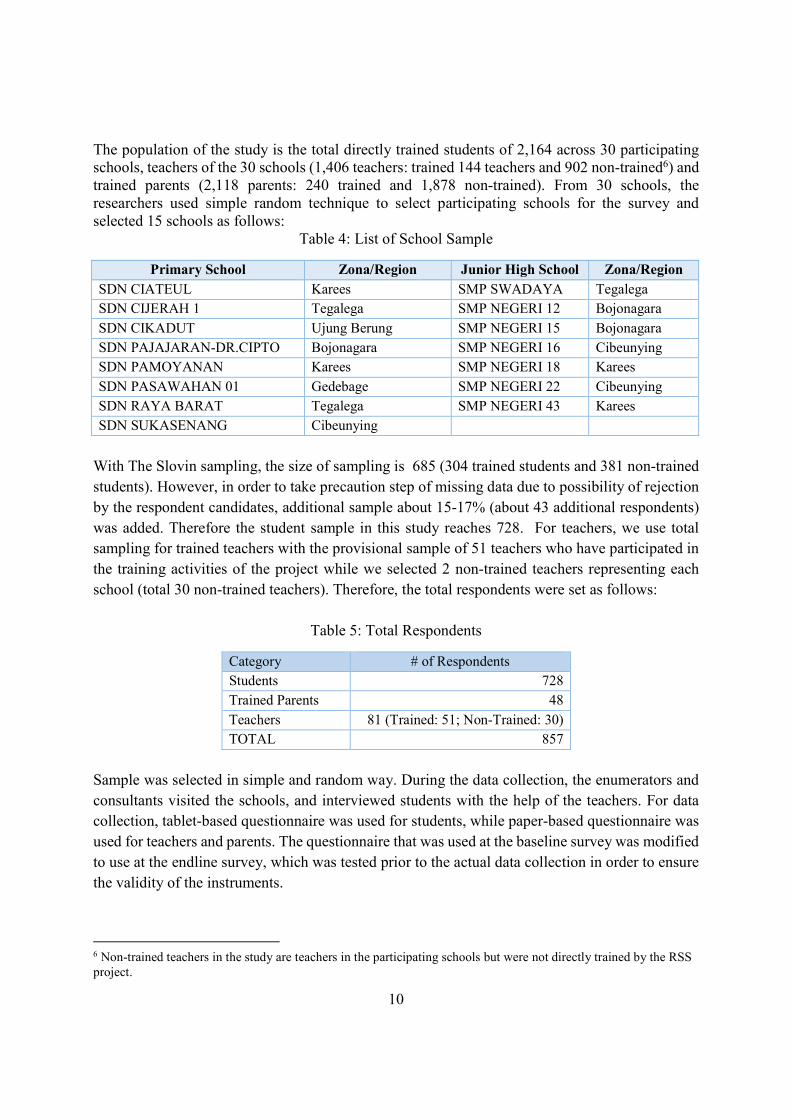
SAMPLING FRAMEWORK
The selection of sample is based on Slovin Sampling Techniques, as follows:
N
n = ------------
1 + Nα2
n is the sample size
N is the population size
α is the error tolerance.
10
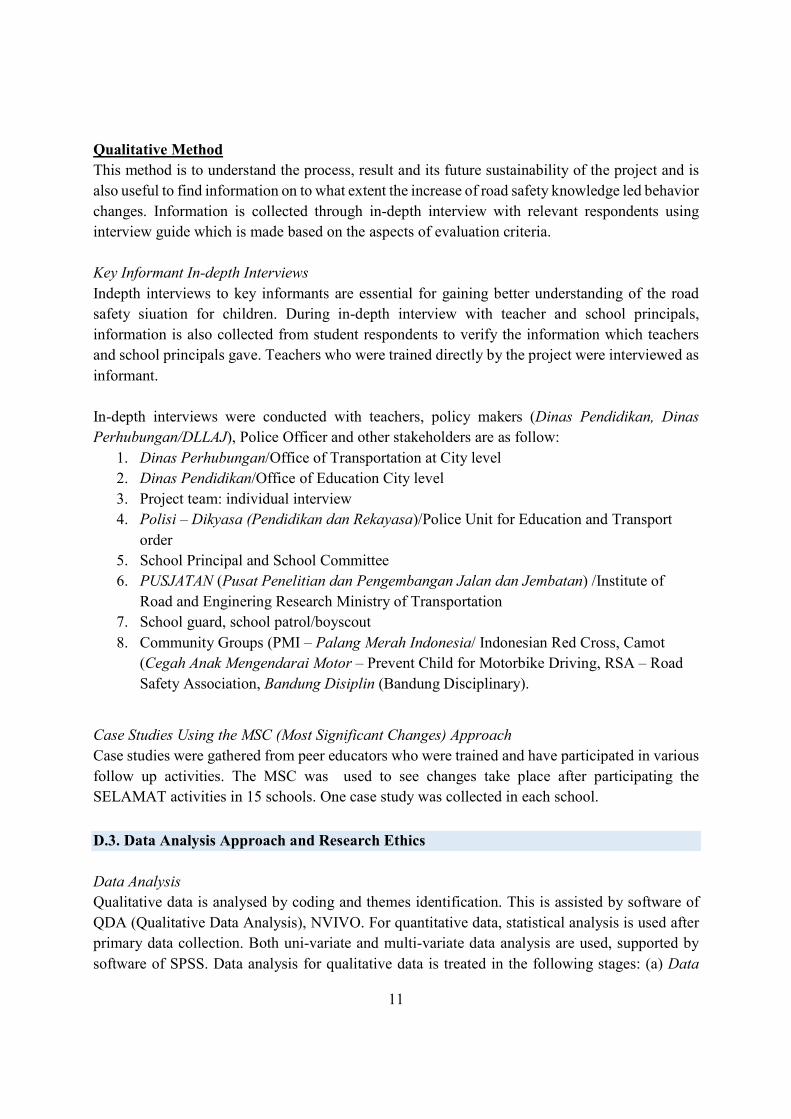
The population of the study is the total directly trained students of 2,164 across 30 participating
schools, teachers of the 30 schools (1,406 teachers: trained 144 teachers and 902 non-trained6) and
trained parents (2,118 parents: 240 trained and 1,878 non-trained). From 30 schools, the
researchers used simple random technique to select participating schools for the survey and
selected 15 schools as follows:
Table 4: List of School Sample
Primary School Zona/Region Junior High School Zona/Region
SDN CIATEUL Karees SMP SWADAYA Tegalega
SDN CIJERAH 1 Tegalega SMP NEGERI 12 Bojonagara
SDN CIKADUT Ujung Berung SMP NEGERI 15 Bojonagara
SDN PAJAJARAN-DR.CIPTO Bojonagara SMP NEGERI 16 Cibeunying
SDN PAMOYANAN Karees SMP NEGERI 18 Karees
SDN PASAWAHAN 01 Gedebage SMP NEGERI 22 Cibeunying
SDN RAYA BARAT Tegalega SMP NEGERI 43 Karees
SDN SUKASENANG Cibeunying
With The Slovin sampling, the size of sampling is 685 (304 trained students and 381 non-trained
students). However, in order to take precaution step of missing data due to possibility of rejection
by the respondent candidates, additional sample about 15-17% (about 43 additional respondents)
was added. Therefore the student sample in this study reaches 728. For teachers, we use total
sampling for trained teachers with the provisional sample of 51 teachers who have participated in
the training activities of the project while we selected 2 non-trained teachers representing each
school (total 30 non-trained teachers). Therefore, the total respondents were set as follows:
Table 5: Total Respondents
Category # of Respondents
Students 728
Trained Parents 48
Teachers 81 (Trained: 51; Non-Trained: 30)
TOTAL 857
Sample was selected in simple and random way. During the data collection, the enumerators and
consultants visited the schools, and interviewed students with the help of the teachers. For data
collection, tablet-based questionnaire was used for students, while paper-based questionnaire was
used for teachers and parents. The questionnaire that was used at the baseline survey was modified
to use at the endline survey, which was tested prior to the actual data collection in order to ensure
the validity of the instruments.
6 Non-trained teachers in the study are teachers in the participating schools but were not directly trained by the RSS
project.
11
Qualitative Method
This method is to understand the process, result and its future sustainability of the project and is
also useful to find information on to what extent the increase of road safety knowledge led behavior
changes. Information is collected through in-depth interview with relevant respondents using
interview guide which is made based on the aspects of evaluation criteria.
Key Informant In-depth Interviews
Indepth interviews to key informants are essential for gaining better understanding of the road
safety siuation for children. During in-depth interview with teacher and school principals,
information is also collected from student respondents to verify the information which teachers
and school principals gave. Teachers who were trained directly by the project were interviewed as
informant.
In-depth interviews were conducted with teachers, policy makers (Dinas Pendidikan, Dinas
Perhubungan/DLLAJ), Police Officer and other stakeholders are as follow:
1. Dinas Perhubungan/Office of Transportation at City level
2. Dinas Pendidikan/Office of Education City level
3. Project team: individual interview
4. Polisi – Dikyasa (Pendidikan dan Rekayasa)/Police Unit for Education and Transport
order
5. School Principal and School Committee
6. PUSJATAN (Pusat Penelitian dan Pengembangan Jalan dan Jembatan) /Institute of
Road and Enginering Research Ministry of Transportation
7. School guard, school patrol/boyscout
8. Community Groups (PMI – Palang Merah Indonesia/ Indonesian Red Cross, Camot
(Cegah Anak Mengendarai Motor – Prevent Child for Motorbike Driving, RSA – Road
Safety Association, Bandung Disiplin (Bandung Disciplinary).
Case Studies Using the MSC (Most Significant Changes) Approach
Case studies were gathered from peer educators who were trained and have participated in various
follow up activities. The MSC was used to see changes take place after participating the
SELAMAT activities in 15 schools. One case study was collected in each school.
D.3. Data Analysis Approach and Research Ethics
Data Analysis
Qualitative data is analysed by coding and themes identification. This is assisted by software of
QDA (Qualitative Data Analysis), NVIVO. For quantitative data, statistical analysis is used after
primary data collection. Both uni-variate and multi-variate data analysis are used, supported by
software of SPSS. Data analysis for qualitative data is treated in the following stages: (a) Data
12
Reduction, in which data is summarized, coded and categorized in order to identify important
aspects of research questions, including careful reading of gathered data, identification of major
themes and categorization of the data; (b) Data Organization, in which data is assembled around
certain themes and is developed into narratives; and (c) Interpretation, which interprets data to
make decisions and conclusions relevant to the research questions, which involves identification
of patterns, regularities and trends. Data analysis also followed the evaluation framework to ensure
internal validity of the study. The use of the evaluation framework also means to guide the study
to assess what is supposed to be measured.7
Research Ethics
The study ensured that informed consent is obtained and that confidentiality of respondents is
protected. It also priotized child protection principles, as summarized below:
Informed Consent
The consultant as well as the enumerators explained the purpose of the survey and sought the
respondent’s agreement to be interviewed. The research respects that respondents have right to
decline to participate or to elect at any time to discontinue the survey (interview). In the interview,
oral consent is sought from the key informants prior to the interviews.
Confidentiality
The study keeps confidentiality of the students in the survey. For the security of the data, the
consultant stored data, particularly any data with name-identifiers, in secure place where there is
no chance that other people could access the information. The data is used solely for the final
evaluation purpose.
Child Protection Principles
Prior to the survey, the enumerators were trained by team of YSTC Bandung on children rights
and child protection principles. The consultant also joined the session.
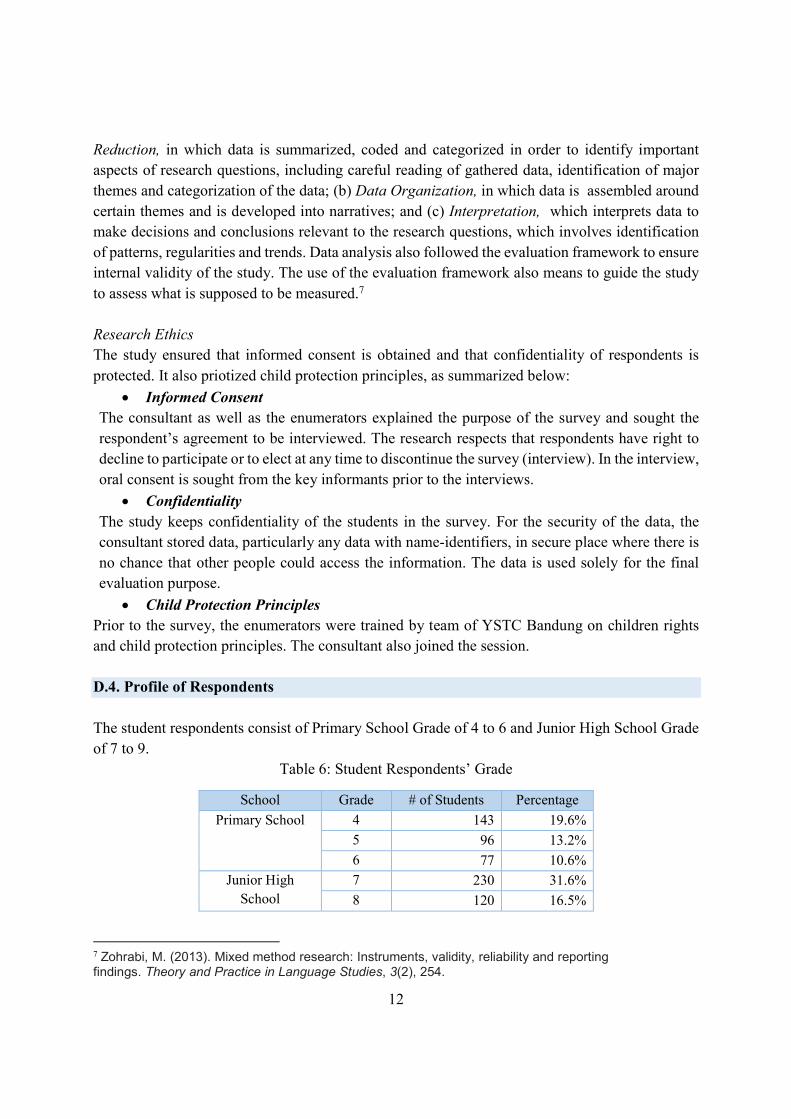
D.4. Profile of Respondents
The student respondents consist of Primary School Grade of 4 to 6 and Junior High School Grade
of 7 to 9.
Table 6: Student Respondents’ Grade
School Grade # of Students Percentage
Primary School 4 143 19.6%
5 96 13.2%
6 77 10.6%
Junior High
School
7 230 31.6%
8 120 16.5%
7 Zohrabi, M. (2013). Mixed method research: Instruments, validity, reliability and reporting findings. Theory and Practice in Language Studies, 3(2), 254.
13
9 62 8.5%
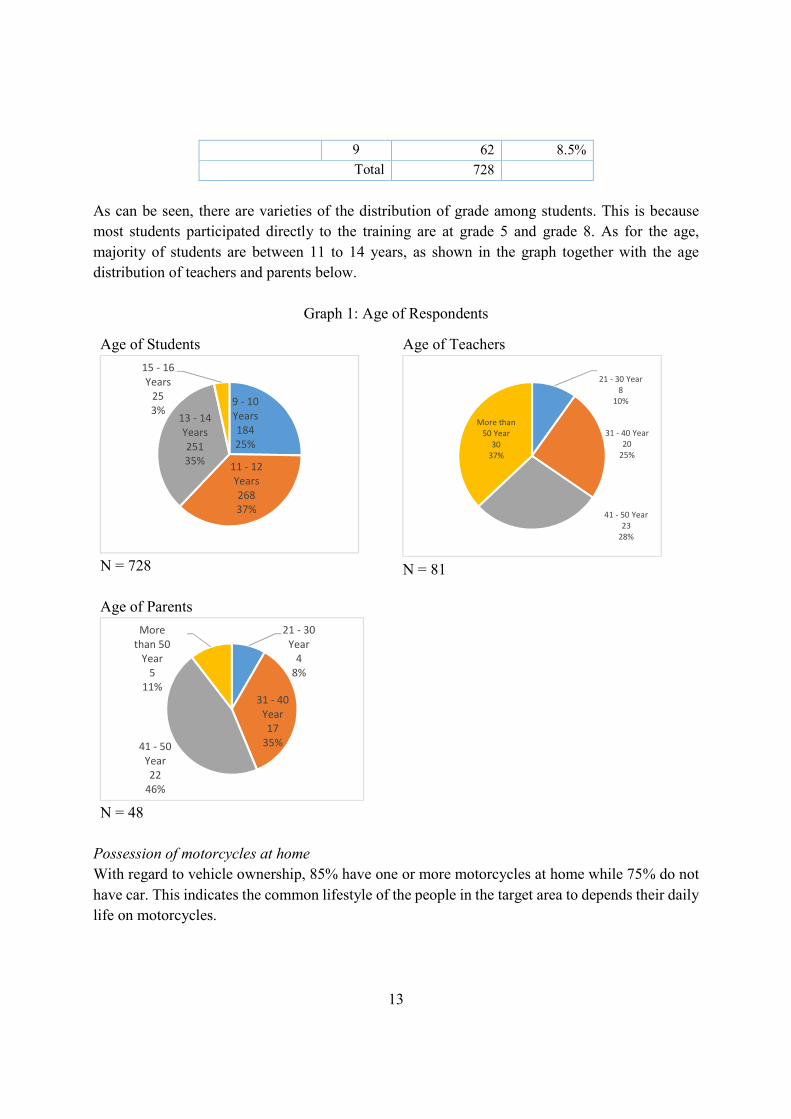
Total 728
As can be seen, there are varieties of the distribution of grade among students. This is because
most students participated directly to the training are at grade 5 and grade 8. As for the age,
majority of students are between 11 to 14 years, as shown in the graph together with the age
distribution of teachers and parents below.
Graph 1: Age of Respondents
Age of Students Age of Teachers
N = 728
Age of Parents
N = 48
N = 81
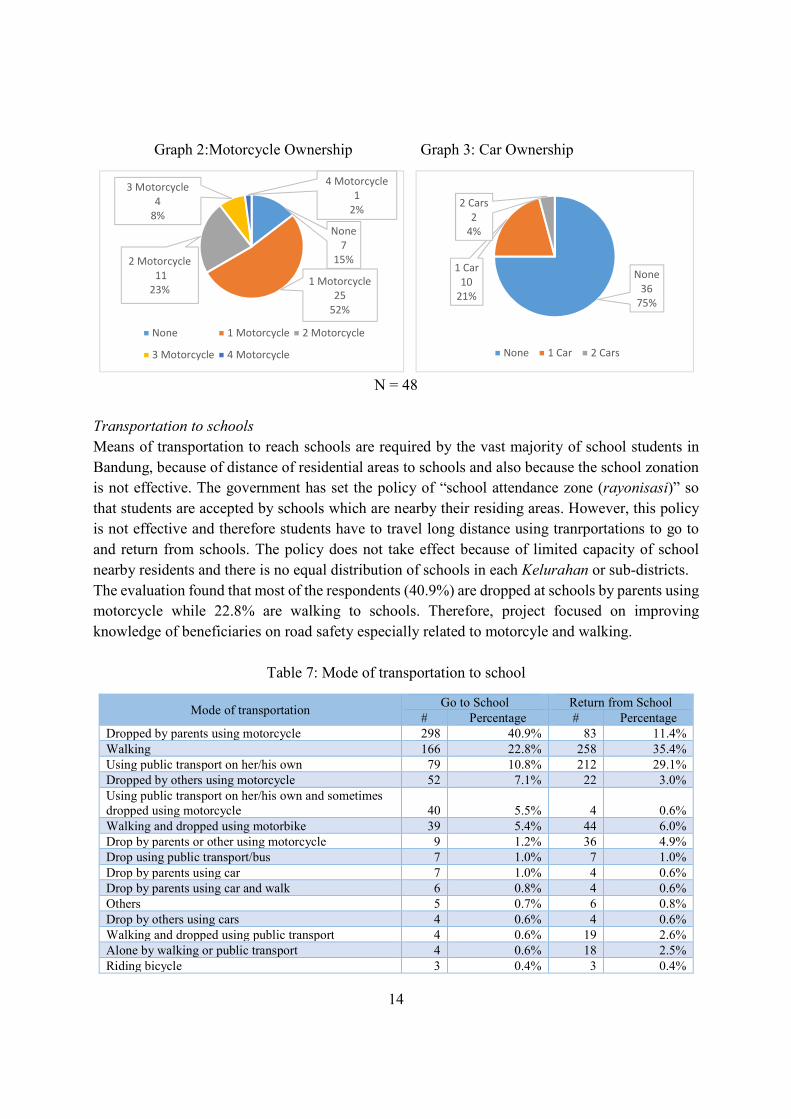
Possession of motorcycles at home
With regard to vehicle ownership, 85% have one or more motorcycles at home while 75% do not
have car. This indicates the common lifestyle of the people in the target area to depends their daily
life on motorcycles.
9 - 10
Years
184
25%
11 - 12
Years
268
37%
13 - 14
Years
251
35%
15 - 16
Years
25
3%
21 - 30
Year
4
8%
31 - 40
Year
17
35%41 - 50
Year
22
46%
More
than 50
Year
5
11%
21 - 30 Year
8
10%
31 - 40 Year
20
25%
41 - 50 Year
23
28%
More than
50 Year
30
37%
14
Graph 2:Motorcycle Ownership Graph 3: Car Ownership
N = 48
Transportation to schools
Means of transportation to reach schools are required by the vast majority of school students in
Bandung, because of distance of residential areas to schools and also because the school zonation
is not effective. The government has set the policy of “school attendance zone (rayonisasi)” so
that students are accepted by schools which are nearby their residing areas. However, this policy
is not effective and therefore students have to travel long distance using tranrportations to go to
and return from schools. The policy does not take effect because of limited capacity of school
nearby residents and there is no equal distribution of schools in each Kelurahan or sub-districts.
The evaluation found that most of the respondents (40.9%) are dropped at schools by parents using
motorcycle while 22.8% are walking to schools. Therefore, project focused on improving
knowledge of beneficiaries on road safety especially related to motorcyle and walking.
Table 7: Mode of transportation to school
Mode of transportation Go to School Return from School
# Percentage # Percentage
Dropped by parents using motorcycle 298 40.9% 83 11.4%
Walking 166 22.8% 258 35.4%
Using public transport on her/his own 79 10.8% 212 29.1%
Dropped by others using motorcycle 52 7.1% 22 3.0%
Using public transport on her/his own and sometimes
dropped using motorcycle 40 5.5% 4 0.6%
Walking and dropped using motorbike 39 5.4% 44 6.0%
Drop by parents or other using motorcycle 9 1.2% 36 4.9%
Drop using public transport/bus 7 1.0% 7 1.0%
Drop by parents using car 7 1.0% 4 0.6%
Drop by parents using car and walk 6 0.8% 4 0.6%
Others 5 0.7% 6 0.8%
Drop by others using cars 4 0.6% 4 0.6%
Walking and dropped using public transport 4 0.6% 19 2.6%
Alone by walking or public transport 4 0.6% 18 2.5%
Riding bicycle 3 0.4% 3 0.4%
None
7
15%
1 Motorcycle
25
52%
2 Motorcycle
11
23%
3 Motorcycle
4
8%
4 Motorcycle
1
2%
None 1 Motorcycle 2 Motorcycle
3 Motorcycle 4 Motorcycle
None
36
75%
1 Car
10
21%
2 Cars
2
4%
None 1 Car 2 Cars
15
Drop by parents or other using car 2 0.3% 2 0.3%
Riding bicycle and dropped by parents using
motorcycle 1 0.1% 1 0.1%
Drop by parents by using cars and motorcycle 1 0.1% 1 0.1%
Walking and riding bicycle 1 0.1% 0 0%
Total 728 728
* ”Others” means on-line motorcycle taxi (known as GOJEK), regular Ojek (motorcycle taxi) and going/returning
with friends
Similarly, walking is the most common mode for children when returning from school, followed
by public transportation which reach 29.1%. Being picked up by parents using motorcycle (11.4%)
follows.
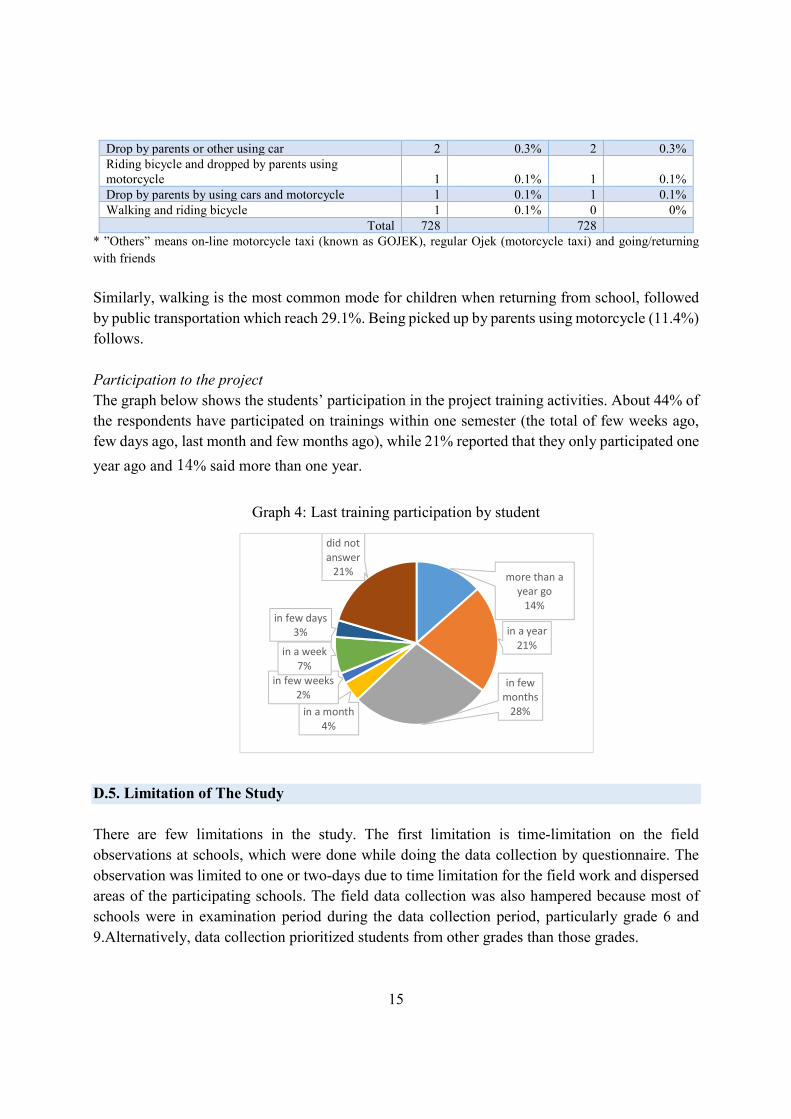
Participation to the project
The graph below shows the students’ participation in the project training activities. About 44% of
the respondents have participated on trainings within one semester (the total of few weeks ago,
few days ago, last month and few months ago), while 21% reported that they only participated one
year ago and 14% said more than one year.
Graph 4: Last training participation by student
D.5. Limitation of The Study
There are few limitations in the study. The first limitation is time-limitation on the field
observations at schools, which were done while doing the data collection by questionnaire. The
observation was limited to one or two-days due to time limitation for the field work and dispersed
areas of the participating schools. The field data collection was also hampered because most of
schools were in examination period during the data collection period, particularly grade 6 and
9.Alternatively, data collection prioritized students from other grades than those grades.
more than a
year go
14%
in a year
21%
in few
months
28%in a month
4%
in few weeks
2%
in a week
7%
in few days
3%
did not
answer
21%
16
In addition, the team did not include the speed component of vehicle or road users in front of
school in the focus, neither Police or Dishub/Office of Transportation officers presence in schools
enforcing the speed limit for vehicles passing in front of schools. Hence, the interview with Police
Officer during the field work has provided only narrative information related to police
responsibility.
Furthermore, there was no secondary data available on actual accidents taking place in the areas
of the participating schools. Therefore, the evaluation used different narrative information or
unofficial records such as key informant interviews on the trend of road safety or record by schools.
E. Evaluation Findings
The findings and conclusion presented in this report are results of the analysis of primary data,
data obtained from field visits and information gathered from the survey and in-depth interviews
with relevant stakeholders and from document studies. The findings are organized in the section
of “relevance”, “effectiveness”, “impacts”, “sustainability” and “replicability and scale”. The
report also highlights notable good practices observed during the evaluation.
E.1. Relevance
E.11. Relevancy of Target: Responding to the General Context in West Java
Road safety in big cities in Indonesia remains challenging. This is because of high urban population
growth, significant increase of motorized vehicle, slow growth of road or unbalance comparison
between road capacity and vehicle growth. Indonesia has 451 motor vehicles per 1,000 inhabitants
and 235 motor vehicles per kilometer of road (ASEAN, 2016). The country has 47 passenger cars
per 1,000 inhabitants. However, this rate is not specifically reflecting urban situation since the rate
covers both rural and urban situation. In addition, in urban areas, lots of road parts are used for
parking and street vendors and motorcycles. On the other hand, discipline of road users is very low
indicated by lack of safety measures (such as use of helmet, seatt belt) and the trend of children
driving motorcycles is increasing. Furthermore, there is lack of policy and enforcement on speed
limit. As a result, road users and particularly children are often in vulnerability to accidents,
fatalities and injuries (Wihanesta and Samadhi, 2016).8 This is worsened by the condition that
often road in Indonesia is shared between vehicles and pedestrian, unsafe driving practices and
possible driver distraction including mobile phone uses.
Traffic fatalities and injuries cost Indonesia by 3 % of its Gross Domestic Product (GDP) (ASEAN,
2016). Road accidents are prevalence in urban areas in Indonesia, including in West Java. The
8 Wihanesta, R. and Samadhi, N. (2016) Cities neglect traffic safety. The Jakarta Post, 22 November 2016.
17
study notes that the project is strongly relevant to the local development agenda in Indonesia,
particularly in West Java.
Table 8: Accidents in West Java in 2015 by Type of Vehicle
Type of vehicle Number of Accidents Percentage
Motorbike 9,635 68.8%
Cars 2007 14.3%
Truck 1981 14.2%
Bus 363 2.6%
Others 19 0.1%
Total 14,005 Source: BPS (2016) Jawa Barat Dalam Angka
E.1-2. Relevancy of Target: Responding to the Genuine Need and Protecting the Vulnerable
Children
In 2015, there are significant number of youth who became victims of road accidents, as identified
by the table below in the number of “University Students” and “Students”.
Table 9: Casualties of Accidents in West Java by Occupation
No. Occupation of the victims Number of Victims Percentage
1 PNS/Public Servant 226 2.2%
2 Private Employee 5,463 52.2%
3 University Student 420 4.0%
4 Students 1,953 18.7%
5 Driver 266 2.5%
6 Army 37 0.3%
7 Police 174 1.7%
8 Others 1,925 18.4%
Total 10,464
Source: BPS (2016) Jawa Barat Dalam Angka
Children are very vulnerable to road accidents, due to lack of road facilities, growing number of
vehicles despite of limited road supply, breach of the pedestrian zones and lack of public
transportation facilities. Indeed, there has been few school buses provided by the government,
however, the number is still very limited.
18
Figure 3: Use of pedestrian zones by street vendors
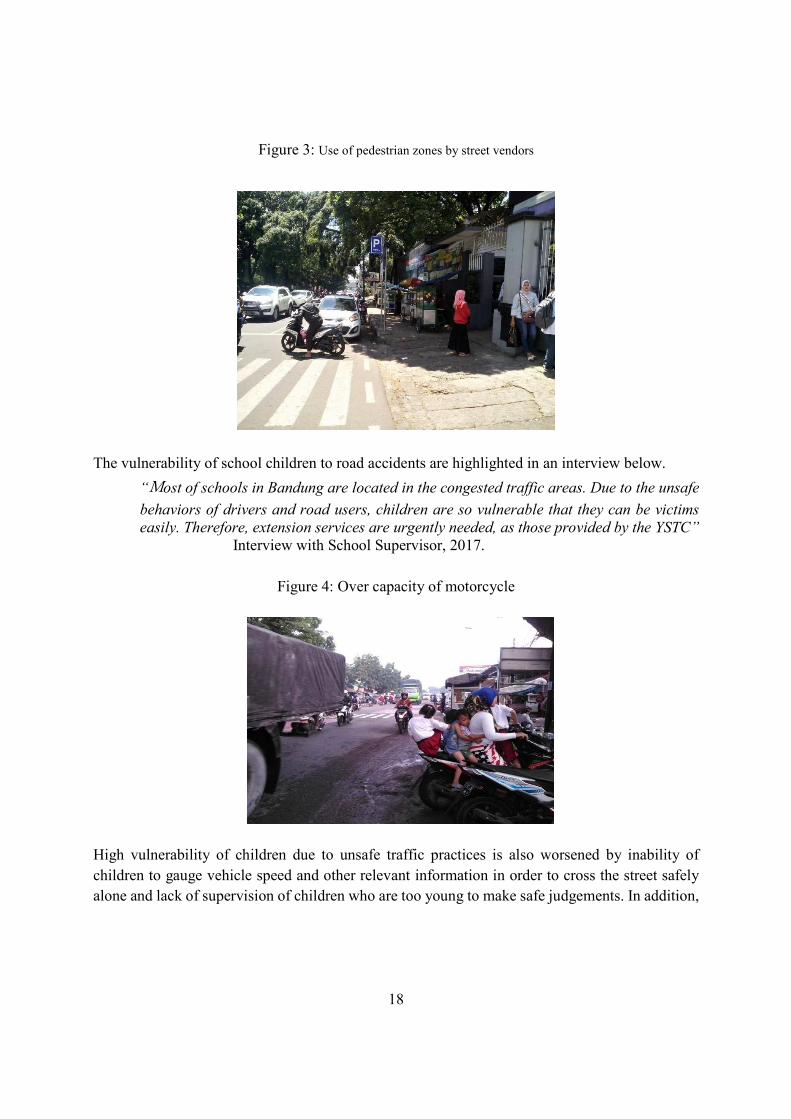
The vulnerability of school children to road accidents are highlighted in an interview below.
“Most of schools in Bandung are located in the congested traffic areas. Due to the unsafe
behaviors of drivers and road users, children are so vulnerable that they can be victims
easily. Therefore, extension services are urgently needed, as those provided by the YSTC”
Interview with School Supervisor, 2017.
Figure 4: Over capacity of motorcycle
High vulnerability of children due to unsafe traffic practices is also worsened by inability of
children to gauge vehicle speed and other relevant information in order to cross the street safely
alone and lack of supervision of children who are too young to make safe judgements. In addition,
19
road environments with high traffic volume and inadequate attention to pedestrian safety have
been found to exacerbate pedestrian collisions (WHO, 2013)9.
From these facts, it can be said that children in urban areas in Indonesia are quite vulnerable to
road accidents, hence, the project is relevant to the geneuine needs of children supporting them to
fulfill the rights of children to safety, protection and education.
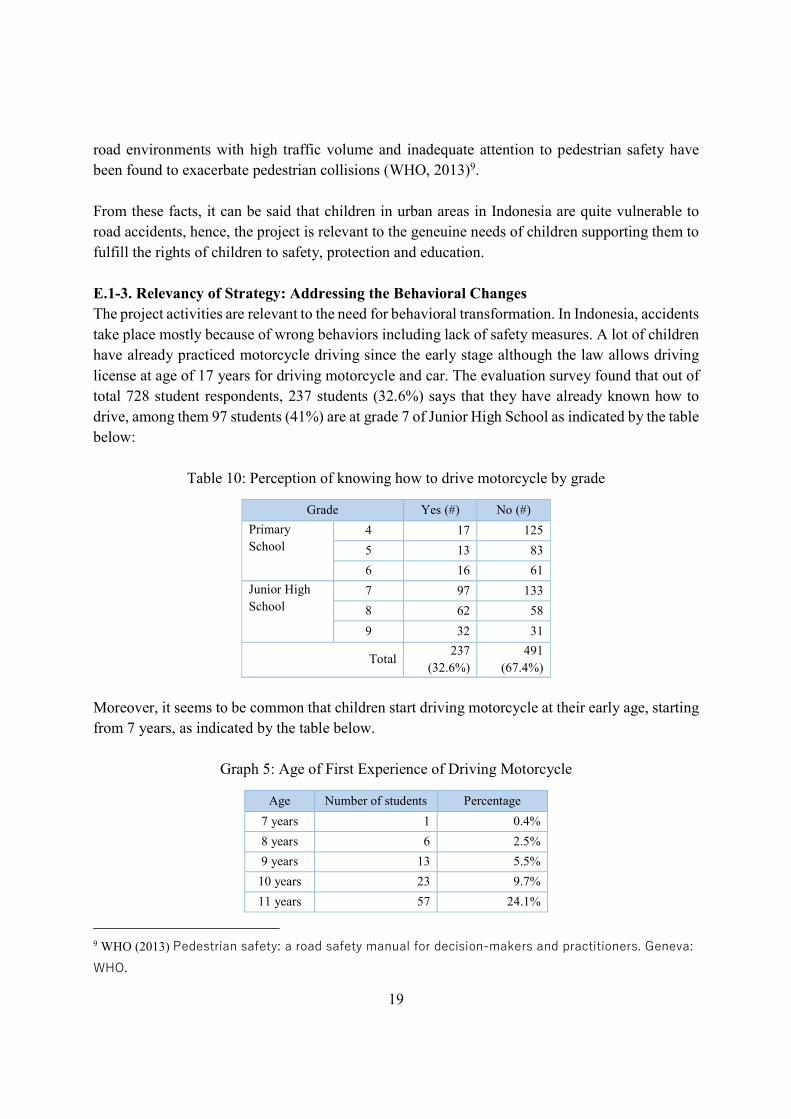
E.1-3. Relevancy of Strategy: Addressing the Behavioral Changes
The project activities are relevant to the need for behavioral transformation. In Indonesia, accidents
take place mostly because of wrong behaviors including lack of safety measures. A lot of children
have already practiced motorcycle driving since the early stage although the law allows driving
license at age of 17 years for driving motorcycle and car. The evaluation survey found that out of
total 728 student respondents, 237 students (32.6%) says that they have already known how to
drive, among them 97 students (41%) are at grade 7 of Junior High School as indicated by the table
below:
Table 10: Perception of knowing how to drive motorcycle by grade
Grade Yes (#) No (#)
Primary
School
4 17 125
5 13 83
6 16 61
Junior High
School
7 97 133
8 62 58
9 32 31
Total 237
(32.6%)
491
(67.4%)
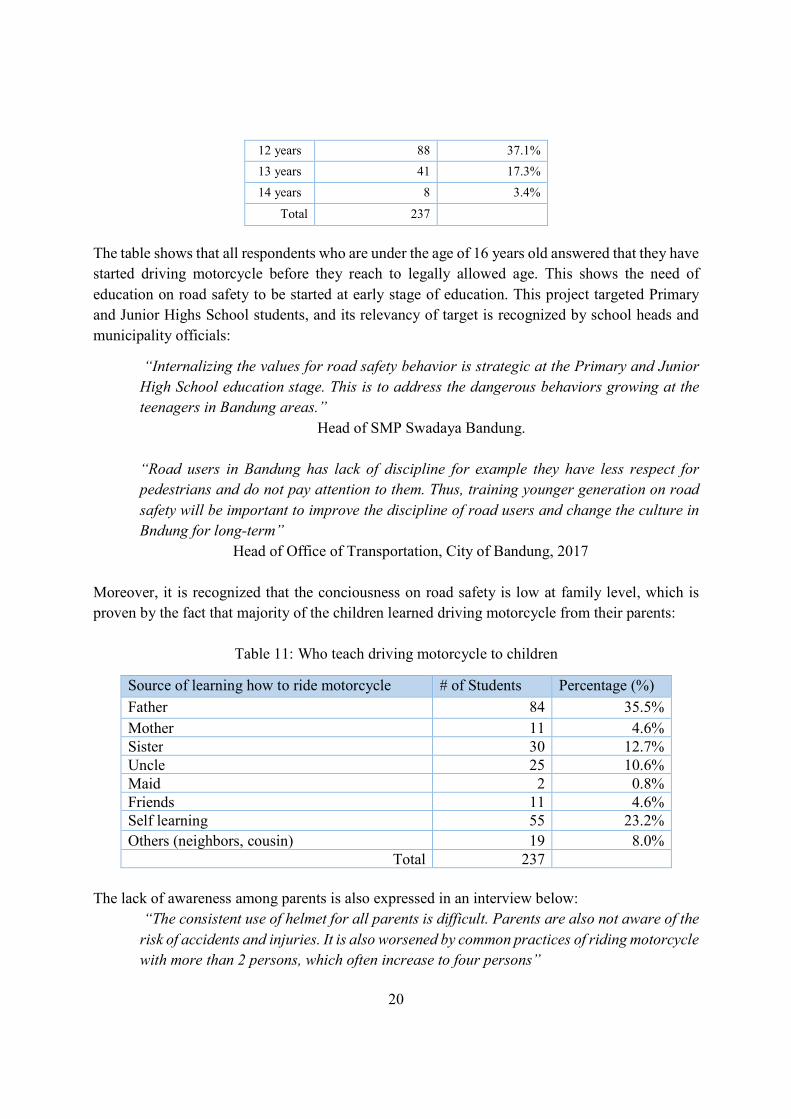
Moreover, it seems to be common that children start driving motorcycle at their early age, starting
from 7 years, as indicated by the table below.
Graph 5: Age of First Experience of Driving Motorcycle
Age Number of students Percentage
7 years 1 0.4%
8 years 6 2.5%
9 years 13 5.5%
10 years 23 9.7%
11 years 57 24.1%
9 WHO (2013) Pedestrian safety: a road safety manual for decision-makers and practitioners. Geneva: WHO.
20
12 years 88 37.1%
13 years 41 17.3%
14 years 8 3.4%
Total 237
The table shows that all respondents who are under the age of 16 years old answered that they have
started driving motorcycle before they reach to legally allowed age. This shows the need of
education on road safety to be started at early stage of education. This project targeted Primary
and Junior Highs School students, and its relevancy of target is recognized by school heads and
municipality officials:
“Internalizing the values for road safety behavior is strategic at the Primary and Junior
High School education stage. This is to address the dangerous behaviors growing at the
teenagers in Bandung areas.”
Head of SMP Swadaya Bandung.
“Road users in Bandung has lack of discipline for example they have less respect for
pedestrians and do not pay attention to them. Thus, training younger generation on road
safety will be important to improve the discipline of road users and change the culture in
Bndung for long-term”
Head of Office of Transportation, City of Bandung, 2017
Moreover, it is recognized that the conciousness on road safety is low at family level, which is
proven by the fact that majority of the children learned driving motorcycle from their parents:
Table 11: Who teach driving motorcycle to children
Source of learning how to ride motorcycle # of Students Percentage (%)
Father 84 35.5%
Mother 11 4.6%
Sister 30 12.7%
Uncle 25 10.6%
Maid 2 0.8%
Friends 11 4.6%
Self learning 55 23.2%
Others (neighbors, cousin) 19 8.0%
Total 237
The lack of awareness among parents is also expressed in an interview below:
“The consistent use of helmet for all parents is difficult. Parents are also not aware of the
risk of accidents and injuries. It is also worsened by common practices of riding motorcycle
with more than 2 persons, which often increase to four persons”
21
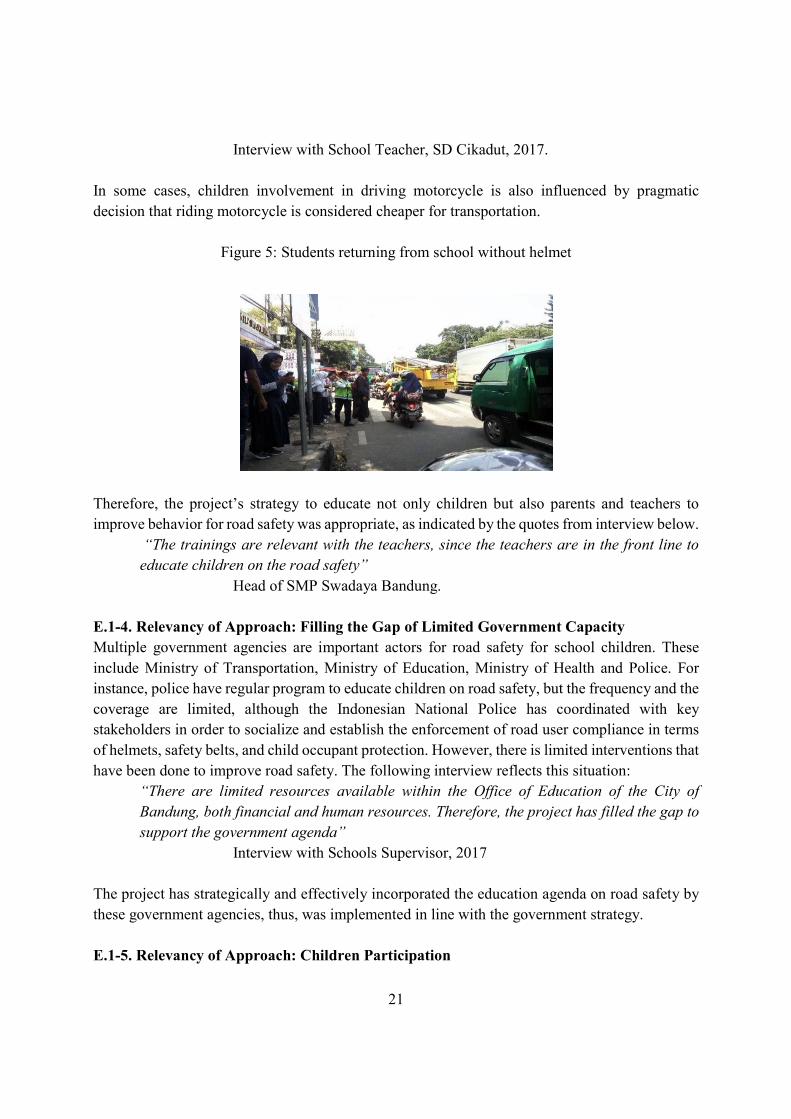
Interview with School Teacher, SD Cikadut, 2017.
In some cases, children involvement in driving motorcycle is also influenced by pragmatic
decision that riding motorcycle is considered cheaper for transportation.
Figure 5: Students returning from school without helmet
Therefore, the project’s strategy to educate not only children but also parents and teachers to
improve behavior for road safety was appropriate, as indicated by the quotes from interview below.
“The trainings are relevant with the teachers, since the teachers are in the front line to
educate children on the road safety”
Head of SMP Swadaya Bandung.
E.1-4. Relevancy of Approach: Filling the Gap of Limited Government Capacity
Multiple government agencies are important actors for road safety for school children. These
include Ministry of Transportation, Ministry of Education, Ministry of Health and Police. For
instance, police have regular program to educate children on road safety, but the frequency and the
coverage are limited, although the Indonesian National Police has coordinated with key
stakeholders in order to socialize and establish the enforcement of road user compliance in terms
of helmets, safety belts, and child occupant protection. However, there is limited interventions that
have been done to improve road safety. The following interview reflects this situation:
“There are limited resources available within the Office of Education of the City of
Bandung, both financial and human resources. Therefore, the project has filled the gap to
support the government agenda”
Interview with Schools Supervisor, 2017
The project has strategically and effectively incorporated the education agenda on road safety by
these government agencies, thus, was implemented in line with the government strategy.
E.1-5. Relevancy of Approach: Children Participation
22
Child participation is one of the core principles in the Convention on the Rights of the Child (CRC),
which implies room and space for children to take part in the process of education. Save the
Children approaches the problem of road safety as a public health and child protection issue, and
an impediment to children attaining their right to survival. When we refer to the CRC Article 3
that states “All children have the right to life and to the fullest level of development”, it is evident
that road safety is an important issue in Indonesia. At the same time, YSTC’s strategic plan from
2016 to 2018 emphasizes the importance of tackling with the situation where traffic accidents are
number one killer of adolescents. Therefore, the project was planned and implemented in response
to Sve the Children’s priority.
E.2. Effectiveness
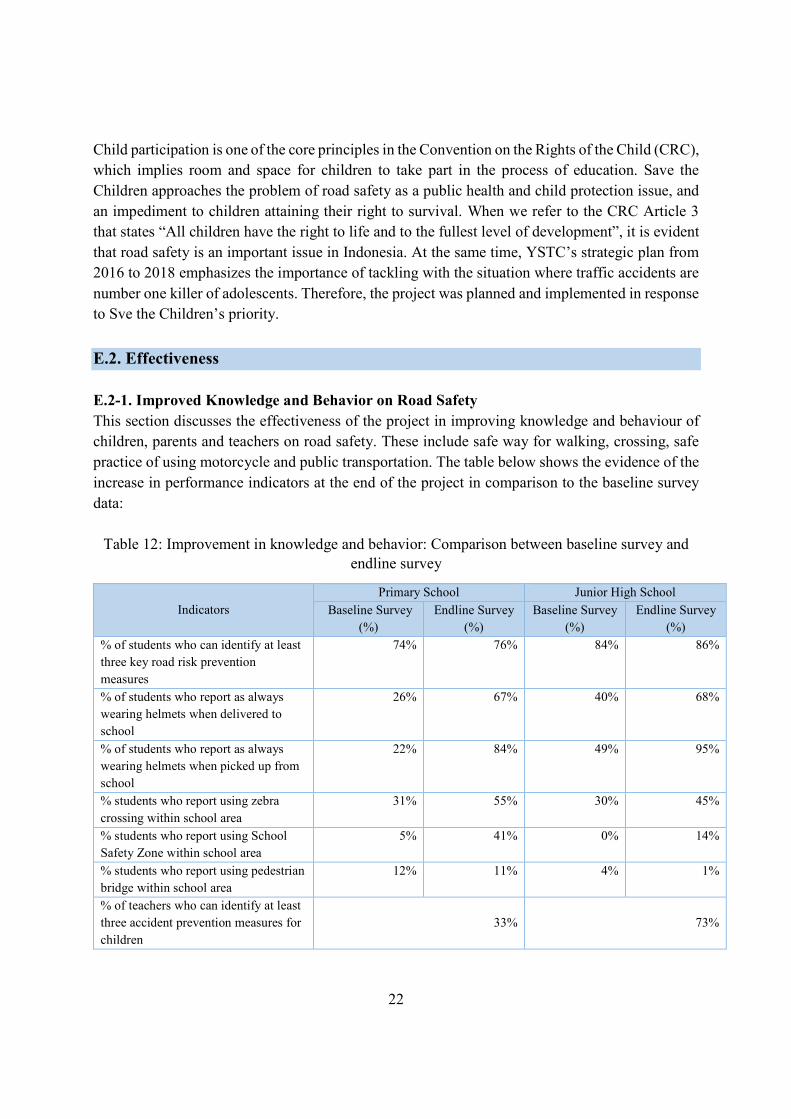
E.2-1. Improved Knowledge and Behavior on Road Safety
This section discusses the effectiveness of the project in improving knowledge and behaviour of
children, parents and teachers on road safety. These include safe way for walking, crossing, safe
practice of using motorcycle and public transportation. The table below shows the evidence of the
increase in performance indicators at the end of the project in comparison to the baseline survey
data:
Table 12: Improvement in knowledge and behavior: Comparison between baseline survey and
endline survey
Indicators
Primary School Junior High School
Baseline Survey
(%)
Endline Survey
(%)
Baseline Survey
(%)
Endline Survey
(%)
% of students who can identify at least
three key road risk prevention
measures
74% 76% 84% 86%
% of students who report as always
wearing helmets when delivered to
school
26% 67% 40% 68%
% of students who report as always
wearing helmets when picked up from
school
22%
84% 49% 95%
% students who report using zebra
crossing within school area
31% 55% 30% 45%
% students who report using School
Safety Zone within school area
5% 41% 0% 14%
% students who report using pedestrian
bridge within school area
12% 11% 4% 1%
% of teachers who can identify at least
three accident prevention measures for
children
33% 73%
23
Indicators
Primary School Junior High School
Baseline Survey
(%)
Endline Survey
(%)
Baseline Survey
(%)
Endline Survey
(%)
% of teachers who can identify at least
three severity reduction measures for
their children
0% 79%
% of parents who can identify at least
three accident prevention measures for
children
27% 86%
% of parents who can identify at least
three severity reduction measures for
their children
2% 98%
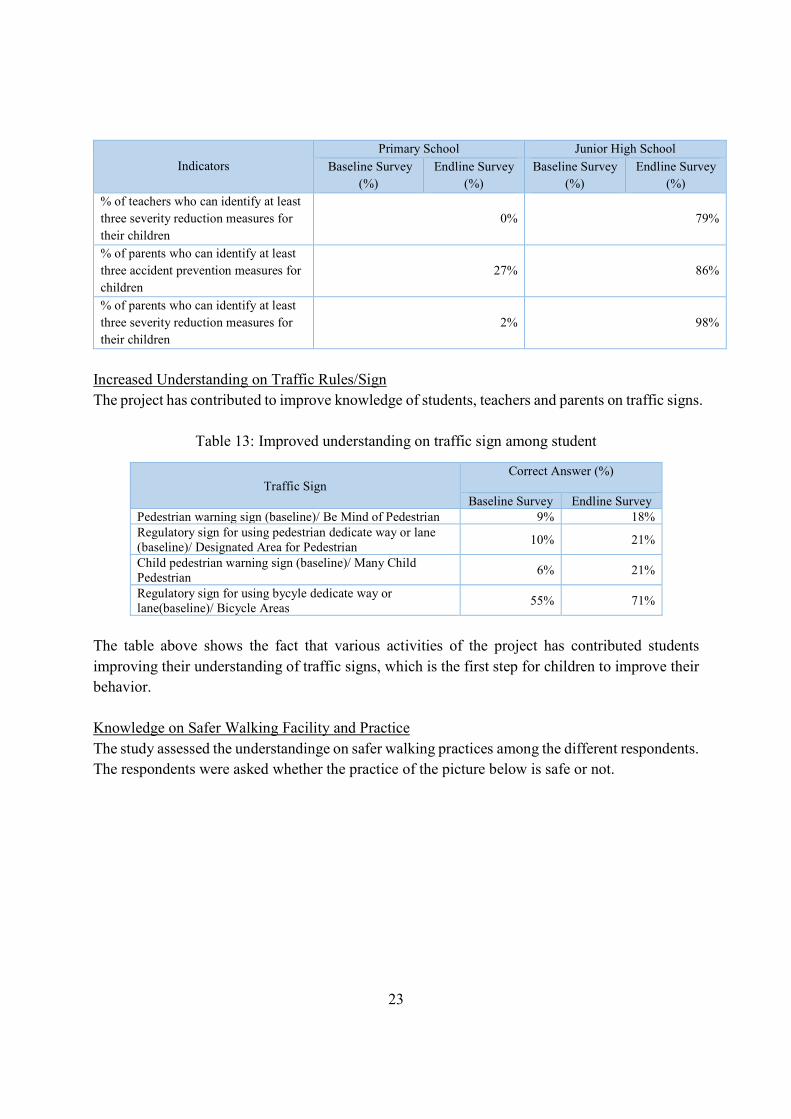
Increased Understanding on Traffic Rules/Sign
The project has contributed to improve knowledge of students, teachers and parents on traffic signs.
Table 13: Improved understanding on traffic sign among student
Traffic Sign
Correct Answer (%)
Baseline Survey Endline Survey
Pedestrian warning sign (baseline)/ Be Mind of Pedestrian 9% 18%
Regulatory sign for using pedestrian dedicate way or lane
(baseline)/ Designated Area for Pedestrian 10% 21%
Child pedestrian warning sign (baseline)/ Many Child
Pedestrian 6% 21%
Regulatory sign for using bycyle dedicate way or
lane(baseline)/ Bicycle Areas 55% 71%
The table above shows the fact that various activities of the project has contributed students
improving their understanding of traffic signs, which is the first step for children to improve their
behavior.
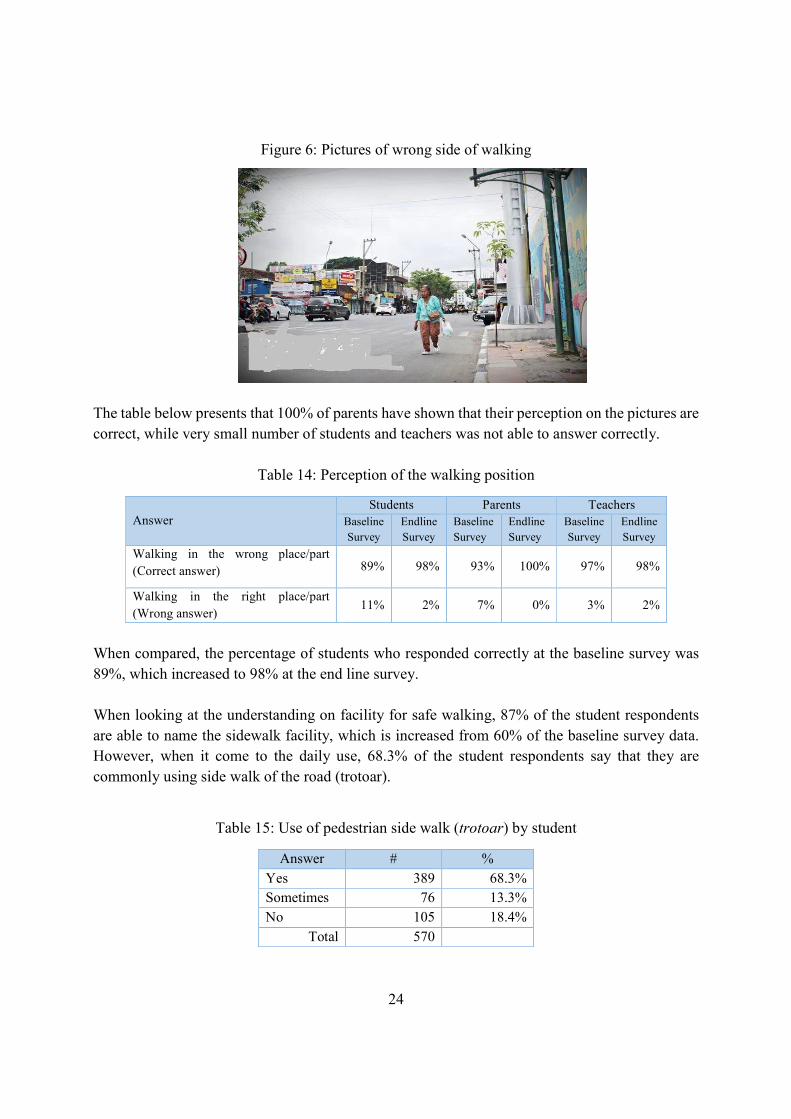
Knowledge on Safer Walking Facility and Practice
The study assessed the understandinge on safer walking practices among the different respondents.
The respondents were asked whether the practice of the picture below is safe or not.
24
Figure 6: Pictures of wrong side of walking
The table below presents that 100% of parents have shown that their perception on the pictures are
correct, while very small number of students and teachers was not able to answer correctly.
Table 14: Perception of the walking position
Answer
Students Parents Teachers
Baseline
Survey
Endline
Survey
Baseline
Survey
Endline
Survey
Baseline
Survey
Endline
Survey
Walking in the wrong place/part
(Correct answer) 89% 98% 93% 100% 97% 98%
Walking in the right place/part
(Wrong answer) 11% 2% 7% 0% 3% 2%
When compared, the percentage of students who responded correctly at the baseline survey was
89%, which increased to 98% at the end line survey.
When looking at the understanding on facility for safe walking, 87% of the student respondents
are able to name the sidewalk facility, which is increased from 60% of the baseline survey data.
However, when it come to the daily use, 68.3% of the student respondents say that they are
commonly using side walk of the road (trotoar).
Table 15: Use of pedestrian side walk (trotoar) by student
Answer # %
Yes 389 68.3%
Sometimes 76 13.3%
No 105 18.4%
Total 570

25
This is because there are some challenges even though the sidewalk is in place, particularly because
they are occupied by other activities including street vendors. Out of 181 students who says that
they do not use or sometimes use sidewalk, 78 mentioned that there is no side walk available, while
43 said that the side walk facility is in place but occupied by street vendors. Other reasons claimed
are: the facility is in poor condition or it is too narrow to walk. The project was not able to address
well enough to make sidewalks around schools available or friendly to students.
Knowledge on Crossing Facility
In assessing the knowledge on crossing facility, the study used the picture below and asked about
the perception of the respondents over the practice.
Figure 7: Unsafe crossing
The responses of the respondents are presented in the table below.
Table 16: Perception on the road crossing way
Answer Students Parents Teachers
# % # % # %
Crossing in the wrong place/part
(Correct answer) 714 98% 48 100% 79 98%
Crossing in the right place/part
(Wrong answer) 14 2% 0 0% 2 2%
Total 728 48 81
98% of the students are able to judge correctly that the students in the picture are crossing the road
in wrong place, which is increased from 89% at baseline survey. While all parents have right
understanding, about 2% of the teachers do not have good understanding on the crossing place.
For understanding on the zebra cross function, the percentage of students who were able to name
the zebra cross has increased to 99% from 71% at the baseline survey. Furthermore, when looking
26
at the use of zebra cross by students, the percentage of students who answered that they use zebra
cross increased among primary school students and junior high school students from 31% to 55%
and from 30% to 45% respectively. It can be said that this is attributed to the project contribution
that has implemented zebra cross in front of schools.
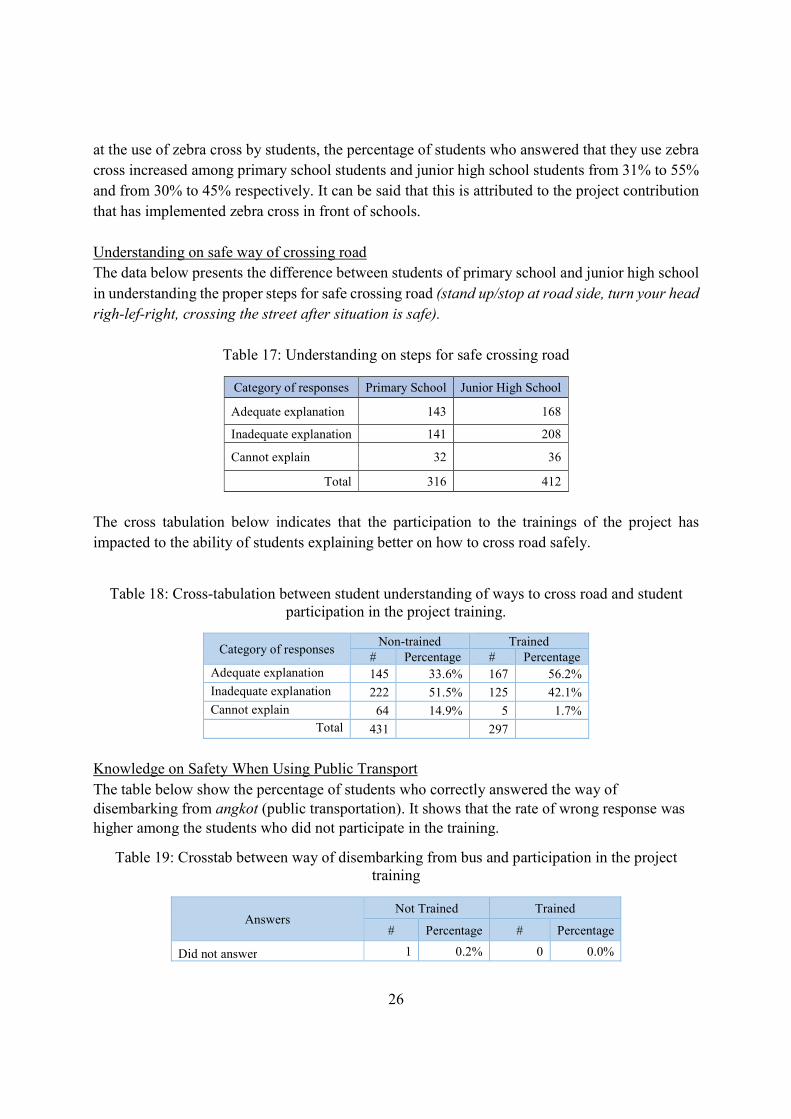
Understanding on safe way of crossing road
The data below presents the difference between students of primary school and junior high school
in understanding the proper steps for safe crossing road (stand up/stop at road side, turn your head
righ-lef-right, crossing the street after situation is safe).
Table 17: Understanding on steps for safe crossing road
Category of responses Primary School Junior High School
Adequate explanation 143 168
Inadequate explanation 141 208
Cannot explain 32 36
Total 316 412
The cross tabulation below indicates that the participation to the trainings of the project has
impacted to the ability of students explaining better on how to cross road safely.
Table 18: Cross-tabulation between student understanding of ways to cross road and student
participation in the project training.
Category of responses Non-trained Trained
# Percentage # Percentage
Adequate explanation 145 33.6% 167 56.2%
Inadequate explanation 222 51.5% 125 42.1%
Cannot explain 64 14.9% 5 1.7%
Total 431 297
Knowledge on Safety When Using Public Transport
The table below show the percentage of students who correctly answered the way of
disembarking from angkot (public transportation). It shows that the rate of wrong response was
higher among the students who did not participate in the training.
Table 19: Crosstab between way of disembarking from bus and participation in the project
training
Answers Not Trained Trained
# Percentage # Percentage
Did not answer 1 0.2% 0 0.0%

27
Right Leg First (Wrong Answer) 164 38.2% 93 31.2%
Left Leg First (Correct Answer) 265 61.6% 205 68.8%
Total 430 298
In terms of disembarking spot, there is no strict regulation that stipulates disembarking of the
passengers in designated places. Similarly, there is very limited facility for bus stops. Therefore,
because the majority of the buses in Bandung drop passengers at any point on road and students
disembark from the bus at any place. However, the percentage of the students who says that they
disembark bus at bus stops increased to 54% at endline survey from 36% at baseline survey among
primary school students, while it rose dramatically from 48% to 77% among junior high school
students, as indicated in the table below.
Table 20: Place for disembarking from bus
Answers Primary School Junior High School
# Percentage # Percentage
At any place 23 7% 10 2%
Bus Stop 170 54% 318 77%
Terminal 21 7% 17 4%
Trotoar 44 14% 28 7%
Others 58 18% 39 10%
Total 316 412
Figure 8: Absence of drop zone
Knowledge on Safety Using Motorcycle
Accidents can take place due to unsafe practices of riding motorcycle. Helmet is crucial to prevent
injuries on head and neck that are the main cause of death, severe injury and disability among users
of motorcycles when there is accident, therefore the law obliges riders of motorcycles to wear
helmets. The ownership and use of motorcycles is relatively high in Bandung.
28
From the survey, it was obvious that most of students are aware that drivers of motorcycle need to
wear helmet, even before the start of the project, as the baseline survey shows that 99% of student
respondents answered correctly. Similarly, students have good understanding in the needs of the
passengers/pillion to wear helmet.
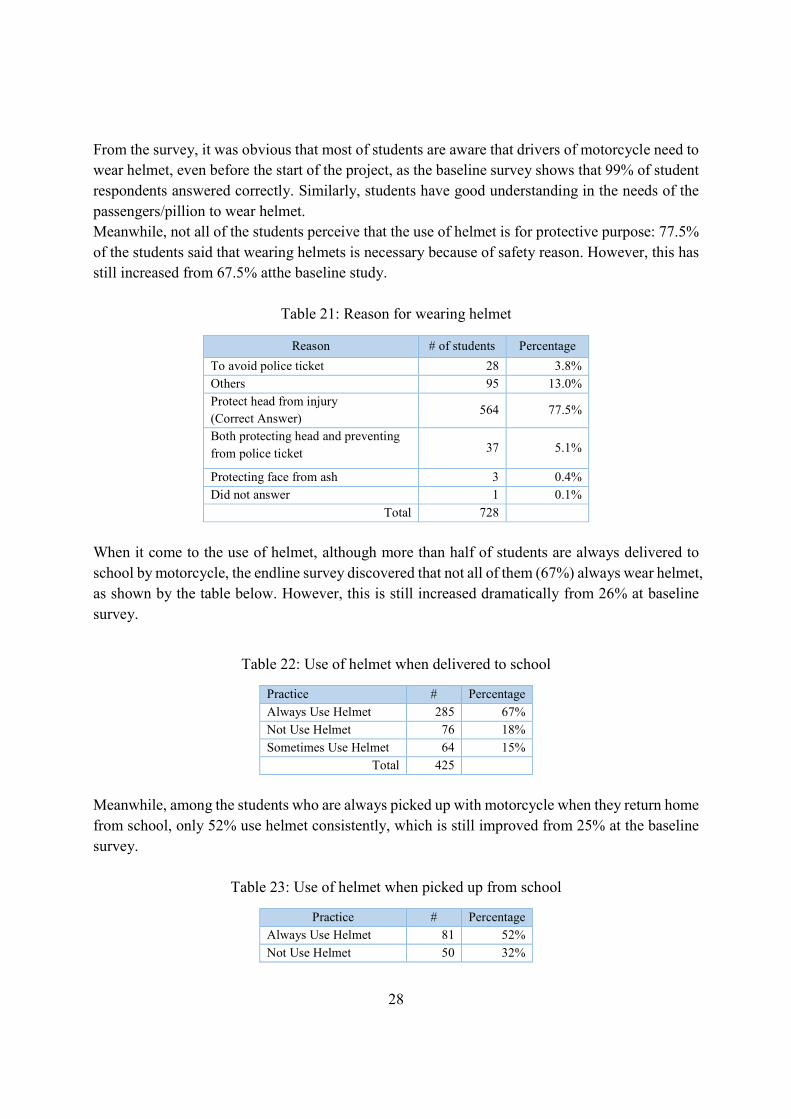
Meanwhile, not all of the students perceive that the use of helmet is for protective purpose: 77.5%
of the students said that wearing helmets is necessary because of safety reason. However, this has
still increased from 67.5% atthe baseline study.
Table 21: Reason for wearing helmet
Reason # of students Percentage
To avoid police ticket 28 3.8%
Others 95 13.0%
Protect head from injury
(Correct Answer) 564 77.5%
Both protecting head and preventing
from police ticket 37 5.1%
Protecting face from ash 3 0.4%
Did not answer 1 0.1%
Total 728
When it come to the use of helmet, although more than half of students are always delivered to
school by motorcycle, the endline survey discovered that not all of them (67%) always wear helmet,
as shown by the table below. However, this is still increased dramatically from 26% at baseline
survey.
Table 22: Use of helmet when delivered to school
Practice # Percentage
Always Use Helmet 285 67%
Not Use Helmet 76 18%
Sometimes Use Helmet 64 15%
Total 425
Meanwhile, among the students who are always picked up with motorcycle when they return home
from school, only 52% use helmet consistently, which is still improved from 25% at the baseline
survey.
Table 23: Use of helmet when picked up from school
Practice # Percentage
Always Use Helmet 81 52%
Not Use Helmet 50 32%
29
Sometimes Use Helmet 25 16%
Total 156
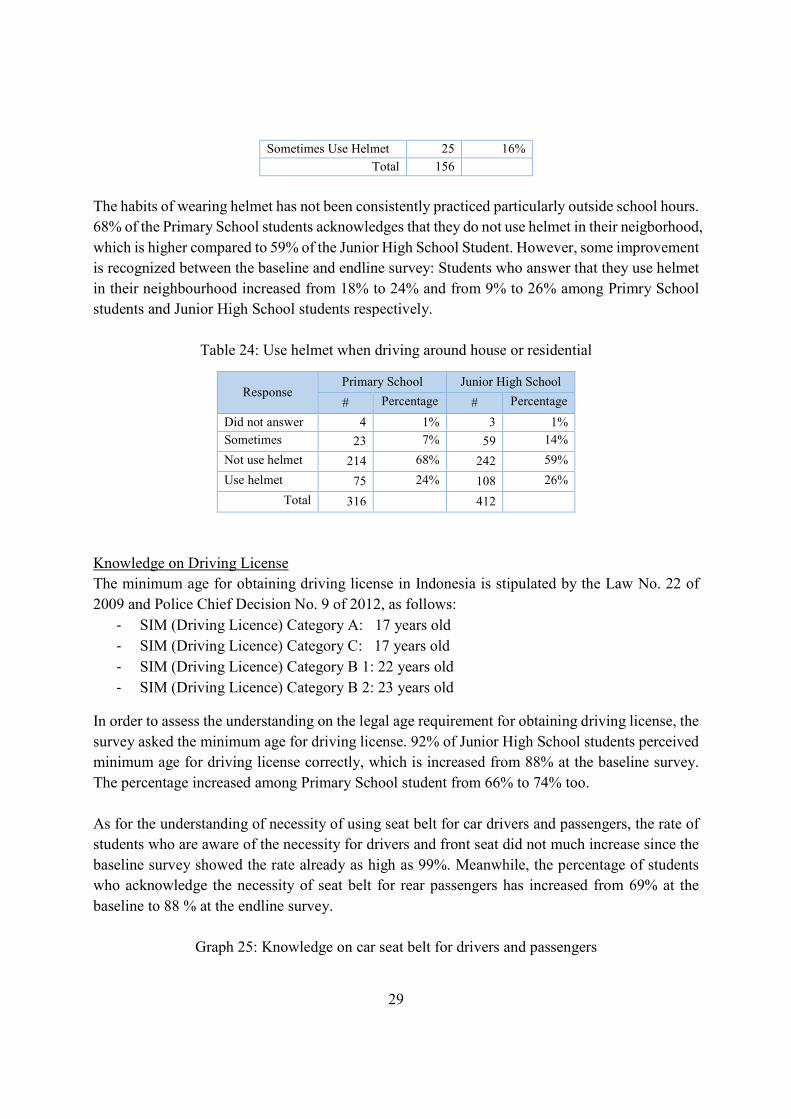
The habits of wearing helmet has not been consistently practiced particularly outside school hours.
68% of the Primary School students acknowledges that they do not use helmet in their neigborhood,
which is higher compared to 59% of the Junior High School Student. However, some improvement
is recognized between the baseline and endline survey: Students who answer that they use helmet
in their neighbourhood increased from 18% to 24% and from 9% to 26% among Primry School
students and Junior High School students respectively.
Table 24: Use helmet when driving around house or residential
Response Primary School Junior High School
# Percentage # Percentage
Did not answer 4 1% 3 1%
Sometimes 23 7% 59 14%
Not use helmet 214 68% 242 59%
Use helmet 75 24% 108 26%
Total 316 412
Knowledge on Driving License
The minimum age for obtaining driving license in Indonesia is stipulated by the Law No. 22 of
2009 and Police Chief Decision No. 9 of 2012, as follows:
- SIM (Driving Licence) Category A: 17 years old
- SIM (Driving Licence) Category C: 17 years old
- SIM (Driving Licence) Category B 1: 22 years old
- SIM (Driving Licence) Category B 2: 23 years old
In order to assess the understanding on the legal age requirement for obtaining driving license, the
survey asked the minimum age for driving license. 92% of Junior High School students perceived
minimum age for driving license correctly, which is increased from 88% at the baseline survey.
The percentage increased among Primary School student from 66% to 74% too.
As for the understanding of necessity of using seat belt for car drivers and passengers, the rate of
students who are aware of the necessity for drivers and front seat did not much increase since the
baseline survey showed the rate already as high as 99%. Meanwhile, the percentage of students
who acknowledge the necessity of seat belt for rear passengers has increased from 69% at the
baseline to 88 % at the endline survey.
Graph 25: Knowledge on car seat belt for drivers and passengers
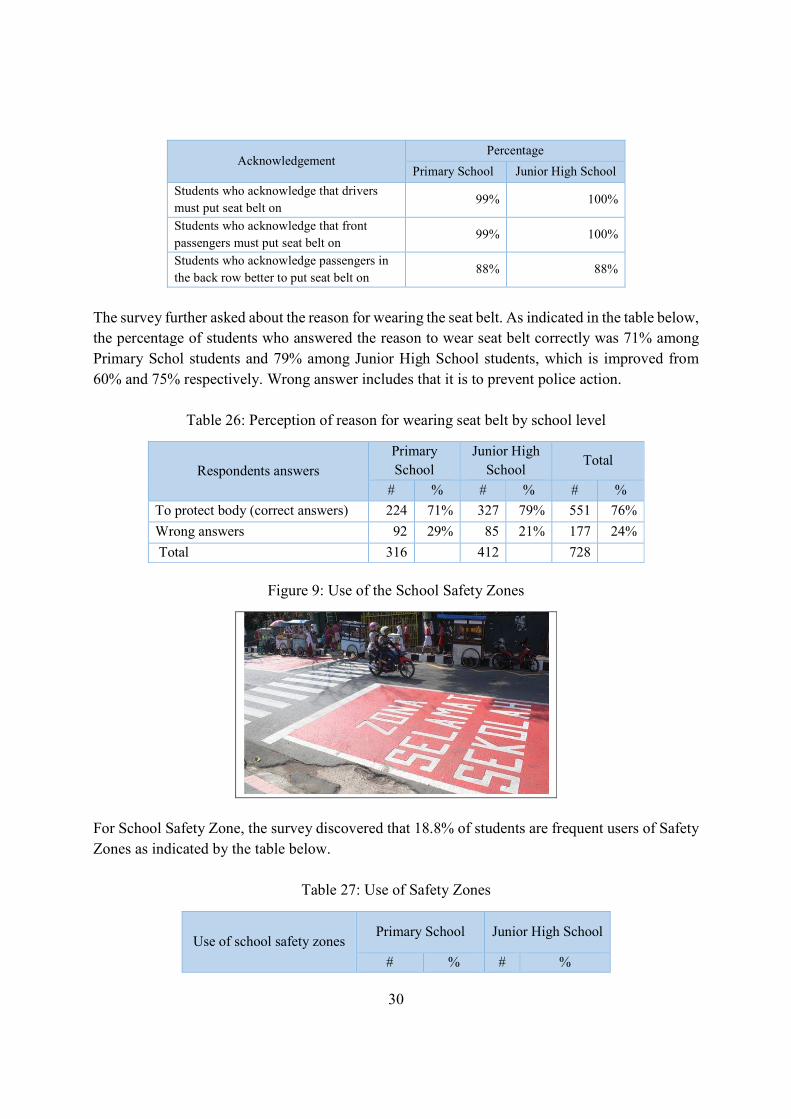
30
Acknowledgement Percentage
Primary School Junior High School
Students who acknowledge that drivers
must put seat belt on 99% 100%
Students who acknowledge that front
passengers must put seat belt on 99% 100%
Students who acknowledge passengers in
the back row better to put seat belt on 88% 88%
The survey further asked about the reason for wearing the seat belt. As indicated in the table below,
the percentage of students who answered the reason to wear seat belt correctly was 71% among
Primary Schol students and 79% among Junior High School students, which is improved from
60% and 75% respectively. Wrong answer includes that it is to prevent police action.
Table 26: Perception of reason for wearing seat belt by school level
Respondents answers
Primary
School
Junior High
School Total
# % # % # %
To protect body (correct answers) 224 71% 327 79% 551 76%
Wrong answers 92 29% 85 21% 177 24%
Total 316 412 728
Figure 9: Use of the School Safety Zones
For School Safety Zone, the survey discovered that 18.8% of students are frequent users of Safety
Zones as indicated by the table below.
Table 27: Use of Safety Zones
Use of school safety zones Primary School Junior High School
# % # %
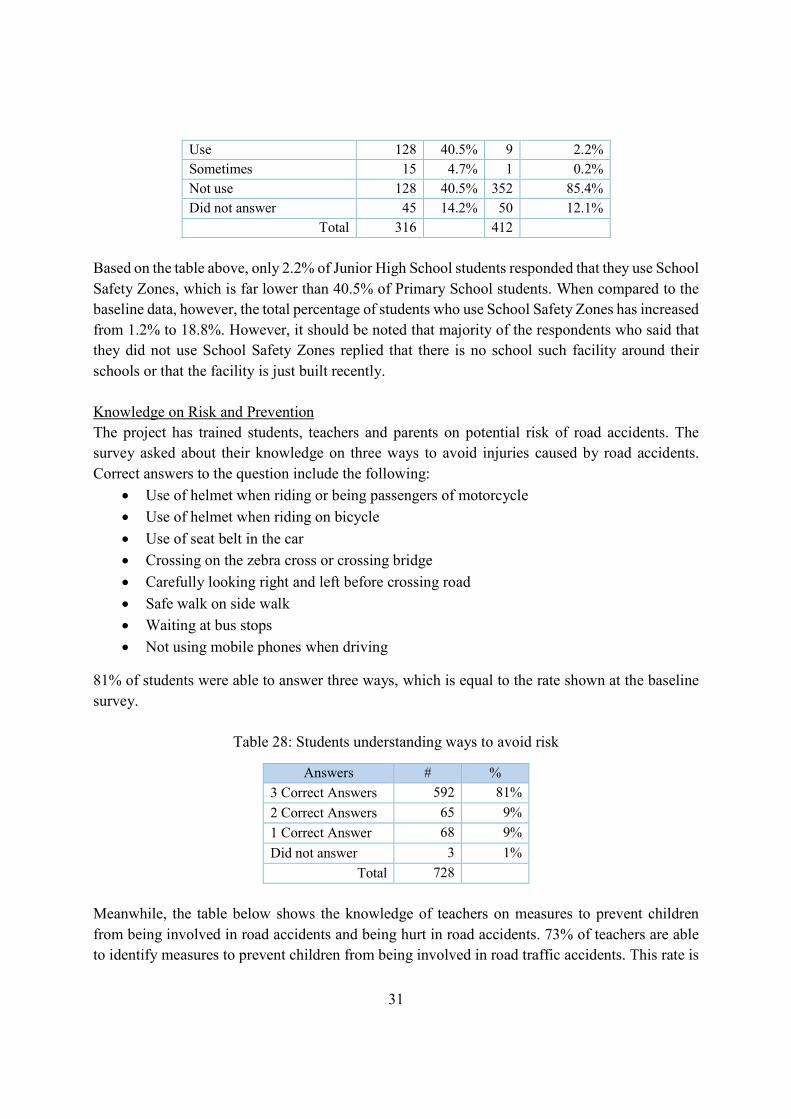
31
Use 128 40.5% 9 2.2%
Sometimes 15 4.7% 1 0.2%
Not use 128 40.5% 352 85.4%
Did not answer 45 14.2% 50 12.1%
Total 316 412
Based on the table above, only 2.2% of Junior High School students responded that they use School
Safety Zones, which is far lower than 40.5% of Primary School students. When compared to the
baseline data, however, the total percentage of students who use School Safety Zones has increased
from 1.2% to 18.8%. However, it should be noted that majority of the respondents who said that
they did not use School Safety Zones replied that there is no school such facility around their
schools or that the facility is just built recently.
Knowledge on Risk and Prevention
The project has trained students, teachers and parents on potential risk of road accidents. The
survey asked about their knowledge on three ways to avoid injuries caused by road accidents.
Correct answers to the question include the following:
Use of helmet when riding or being passengers of motorcycle
Use of helmet when riding on bicycle
Use of seat belt in the car
Crossing on the zebra cross or crossing bridge
Carefully looking right and left before crossing road
Safe walk on side walk
Waiting at bus stops
Not using mobile phones when driving
81% of students were able to answer three ways, which is equal to the rate shown at the baseline
survey.
Table 28: Students understanding ways to avoid risk
Answers # %
3 Correct Answers 592 81%
2 Correct Answers 65 9%
1 Correct Answer 68 9%
Did not answer 3 1%
Total 728
Meanwhile, the table below shows the knowledge of teachers on measures to prevent children
from being involved in road accidents and being hurt in road accidents. 73% of teachers are able
to identify measures to prevent children from being involved in road traffic accidents. This rate is
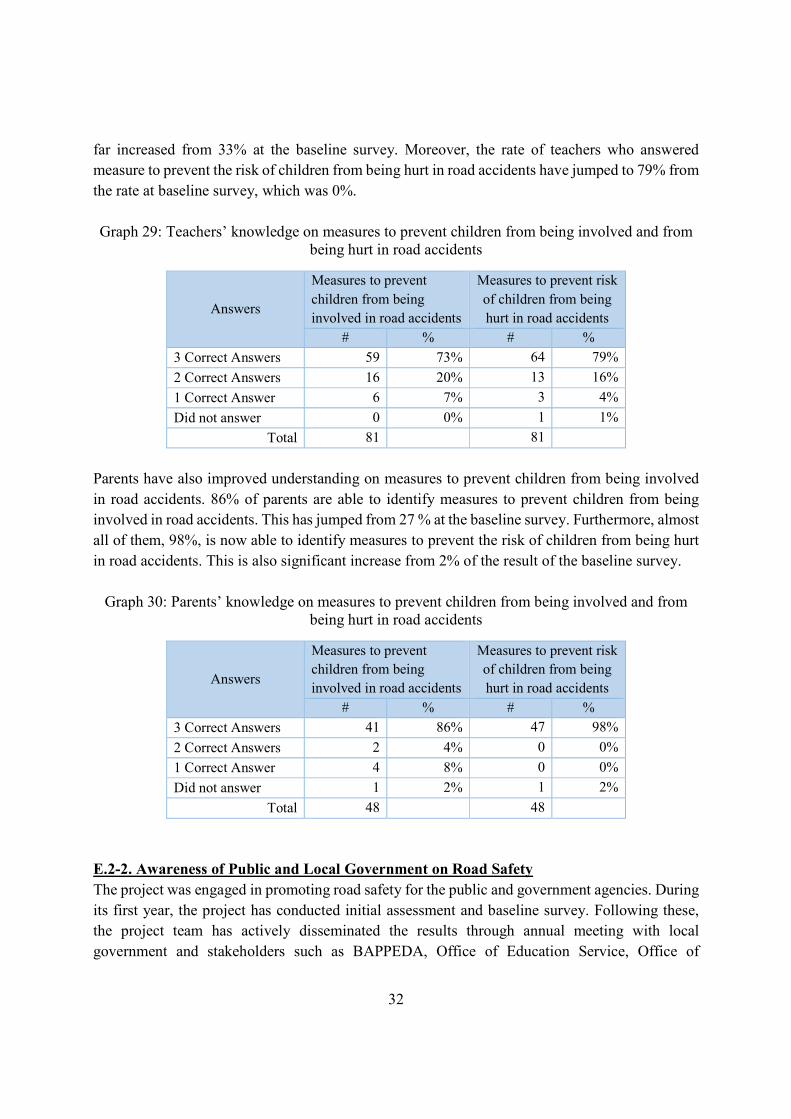
32
far increased from 33% at the baseline survey. Moreover, the rate of teachers who answered
measure to prevent the risk of children from being hurt in road accidents have jumped to 79% from
the rate at baseline survey, which was 0%.
Graph 29: Teachers’ knowledge on measures to prevent children from being involved and from
being hurt in road accidents
Answers
Measures to prevent
children from being
involved in road accidents
Measures to prevent risk
of children from being
hurt in road accidents
# % # %
3 Correct Answers 59 73% 64 79%
2 Correct Answers 16 20% 13 16%
1 Correct Answer 6 7% 3 4%
Did not answer 0 0% 1 1%
Total 81 81
Parents have also improved understanding on measures to prevent children from being involved
in road accidents. 86% of parents are able to identify measures to prevent children from being
involved in road accidents. This has jumped from 27 % at the baseline survey. Furthermore, almost
all of them, 98%, is now able to identify measures to prevent the risk of children from being hurt
in road accidents. This is also significant increase from 2% of the result of the baseline survey.
Graph 30: Parents’ knowledge on measures to prevent children from being involved and from
being hurt in road accidents
Answers
Measures to prevent
children from being
involved in road accidents
Measures to prevent risk
of children from being
hurt in road accidents
# % # %
3 Correct Answers 41 86% 47 98%
2 Correct Answers 2 4% 0 0%
1 Correct Answer 4 8% 0 0%
Did not answer 1 2% 1 2%
Total 48 48
E.2-2. Awareness of Public and Local Government on Road Safety
The project was engaged in promoting road safety for the public and government agencies. During
its first year, the project has conducted initial assessment and baseline survey. Following these,
the project team has actively disseminated the results through annual meeting with local
government and stakeholders such as BAPPEDA, Office of Education Service, Office of

33
Transportation Service. The exchange of information and learning in those meetings increasd the
related stakeholders’ motivation and engagement.
The project also worked to raise awareness on road safety widely in the public by conducting
campaigns, which are recognised by many as one of the most important ways of persuading road
users to adopt safe behaviours. Various activities joined and organized by the project reached
491,961 persons including the estimated listers of radio programs:
Road safety campaigns on the occasion of Global Road Safety Week
Road safety campaign on Children Day
Road safety campaign on the occasion of the World Day of Remembrance for Traffic
Victims
Introducing the project and promoting road safety on local radio programs
Become resources persons in civil society organization events such as Red Cross
Become resources persons in promotion of road safety in government agencies event
The role of the project in increasing political will is indicated by the following interview:
“The RSS project has participated effectively in various events for awareness raising
organized by the PUSJATAN. Though it is not the main focus of PUSJATAN, but our office
also supported trainings on reducing accidents by users’ behaviour changes. In such event,
the project staff share their expertise”
Interview with Safety Division of PUSJATAN (Centre of Road and Bridges), 2017
E.2-2. Project Approach and Partnership Strategy
Effectivenss of Introducing New Learning Materials
The project was implemented effectively in the delivery of the trainings for students, teachers and
parents at 30 schools utilizing various means to deliver the message on road safety, thus reached
quite a few numbers of students and others. . Students emphasized the effectiveness of the use of
simulation, audio visual and stories, which are considered to be strategic, as shown in the table
below. The project is well designed to fully utilize these method, thus, was implemented
effectively.
Table 31: Perception of the most effective learning methods by student
Learning Media # of student %
Hand Out 35 4.8%
Stories 83 11.4%
Audiovisual 88 12.1%
Simulation 408 56.1%
Others 14 1.9%
Did not answer 100 13.7%
Total 728

34
At SMP22 Junior High School, students produced the story through comic called “STOP TIME”
in 2016. The pictures in the comic were drawn by students to increase awareness for safety in road
crossing. Such learning material is not only effective to reach more children but also is one of the
ways to give opportunity to children to take an initiative in activities.
Figure 10: Comic Produced by Student
Students also created a movie called “Penyesalan: or regret” movie. The story is based on a true
story of an accident of a student. The movie raise the need to be extra careful before crossing
road. It is produced by students and made available at youtube10.
Figure 11: Movie Produced by Student
Effectiveness of Peer-Education Method – modeling the road safety behavior
The project promoted peer-education approach as means to multiply the impact of the project. Peer
education is strategic to promote positive behavior among the children and young people since the
peers can give significant influence to each other in their age. Peer educators are recruited from
10 (https://www.youtube.com/watch?v=V_)
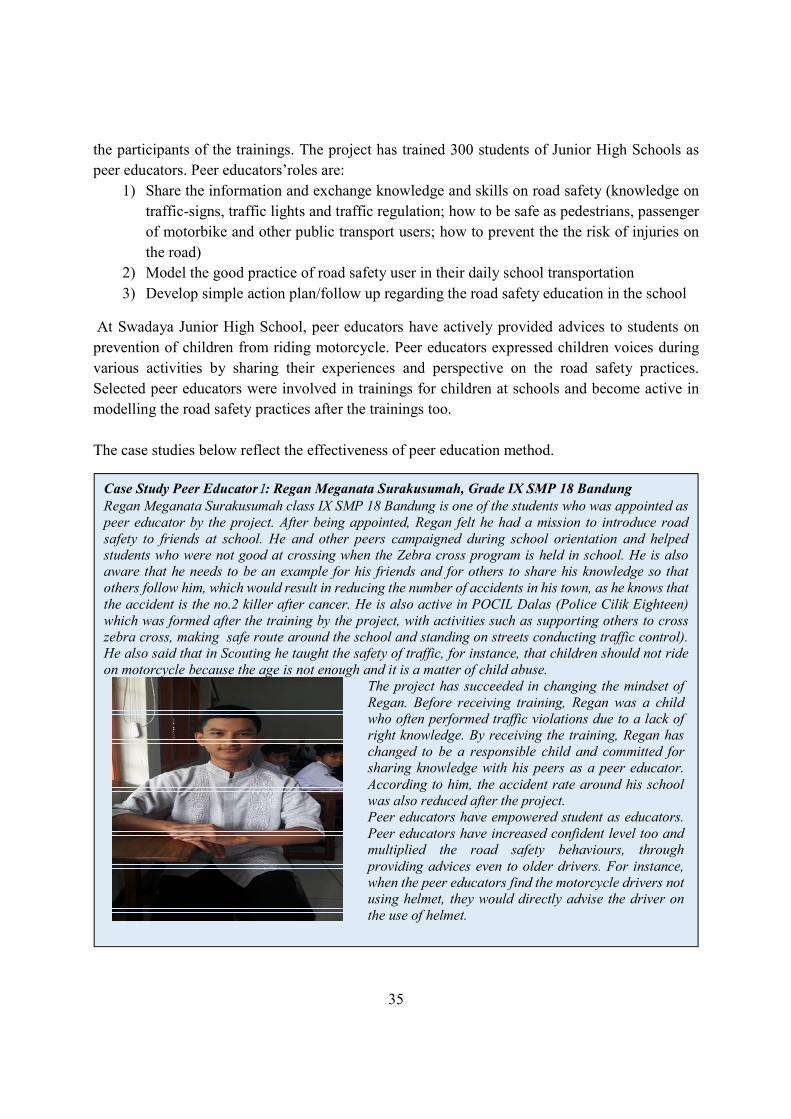
35
the participants of the trainings. The project has trained 300 students of Junior High Schools as
peer educators. Peer educators’roles are:
1) Share the information and exchange knowledge and skills on road safety (knowledge on
traffic-signs, traffic lights and traffic regulation; how to be safe as pedestrians, passenger
of motorbike and other public transport users; how to prevent the the risk of injuries on
the road)
2) Model the good practice of road safety user in their daily school transportation
3) Develop simple action plan/follow up regarding the road safety education in the school
At Swadaya Junior High School, peer educators have actively provided advices to students on
prevention of children from riding motorcycle. Peer educators expressed children voices during
various activities by sharing their experiences and perspective on the road safety practices.
Selected peer educators were involved in trainings for children at schools and become active in
modelling the road safety practices after the trainings too.
The case studies below reflect the effectiveness of peer education method.
Case Study Peer Educator1: Regan Meganata Surakusumah, Grade IX SMP 18 Bandung
Regan Meganata Surakusumah class IX SMP 18 Bandung is one of the students who was appointed as
peer educator by the project. After being appointed, Regan felt he had a mission to introduce road
safety to friends at school. He and other peers campaigned during school orientation and helped
students who were not good at crossing when the Zebra cross program is held in school. He is also
aware that he needs to be an example for his friends and for others to share his knowledge so that
others follow him, which would result in reducing the number of accidents in his town, as he knows that
the accident is the no.2 killer after cancer. He is also active in POCIL Dalas (Police Cilik Eighteen)
which was formed after the training by the project, with activities such as supporting others to cross
zebra cross, making safe route around the school and standing on streets conducting traffic control).
He also said that in Scouting he taught the safety of traffic, for instance, that children should not ride
on motorcycle because the age is not enough and it is a matter of child abuse.
The project has succeeded in changing the mindset of
Regan. Before receiving training, Regan was a child
who often performed traffic violations due to a lack of
right knowledge. By receiving the training, Regan has
changed to be a responsible child and committed for
sharing knowledge with his peers as a peer educator.
According to him, the accident rate around his school
was also reduced after the project.
Peer educators have empowered student as educators.
Peer educators have increased confident level too and
multiplied the road safety behaviours, through
providing advices even to older drivers. For instance,
when the peer educators find the motorcycle drivers not
using helmet, they would directly advise the driver on
the use of helmet.
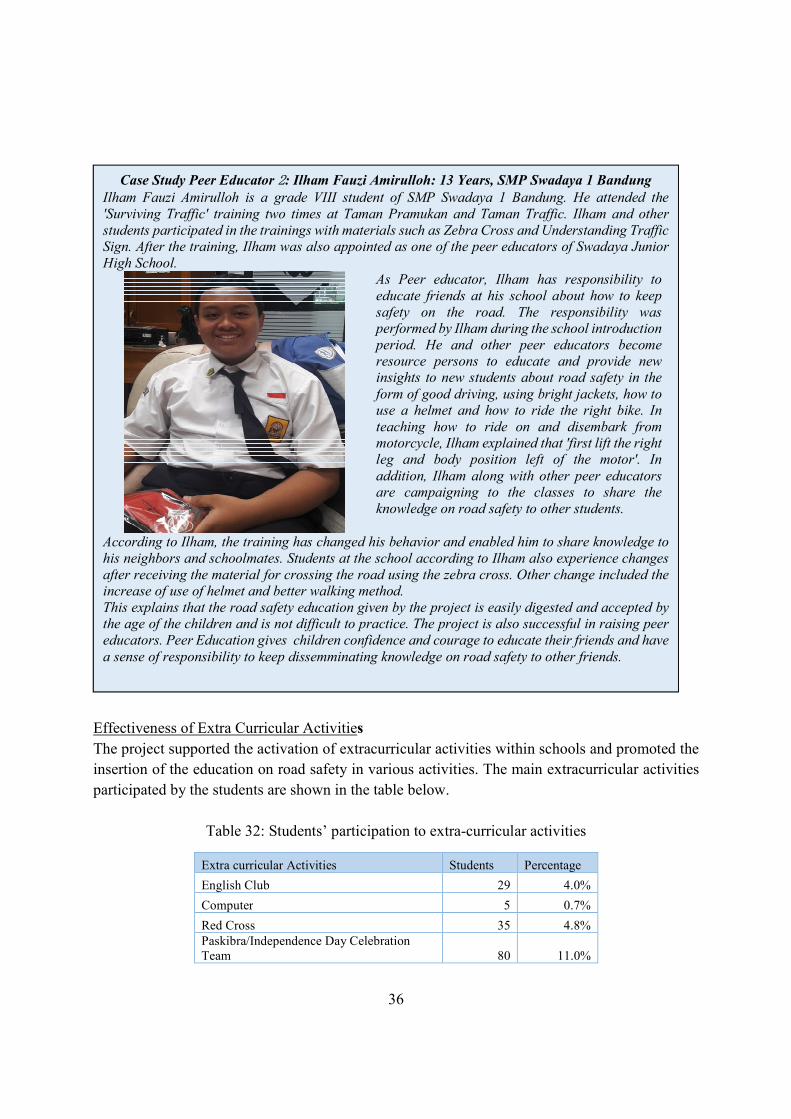
36
Effectiveness of Extra Curricular Activities
The project supported the activation of extracurricular activities within schools and promoted the
insertion of the education on road safety in various activities. The main extracurricular activities
participated by the students are shown in the table below.
Table 32: Students’ participation to extra-curricular activities
Extra curricular Activities Students Percentage
English Club 29 4.0%
Computer 5 0.7%
Red Cross 35 4.8%
Paskibra/Independence Day Celebration
Team 80 11.0%
Case Study Peer Educator 2: Ilham Fauzi Amirulloh: 13 Years, SMP Swadaya 1 Bandung
Ilham Fauzi Amirulloh is a grade VIII student of SMP Swadaya 1 Bandung. He attended the
'Surviving Traffic' training two times at Taman Pramukan and Taman Traffic. Ilham and other
students participated in the trainings with materials such as Zebra Cross and Understanding Traffic
Sign. After the training, Ilham was also appointed as one of the peer educators of Swadaya Junior
High School.
As Peer educator, Ilham has responsibility to
educate friends at his school about how to keep
safety on the road. The responsibility was
performed by Ilham during the school introduction
period. He and other peer educators become
resource persons to educate and provide new
insights to new students about road safety in the
form of good driving, using bright jackets, how to
use a helmet and how to ride the right bike. In
teaching how to ride on and disembark from
motorcycle, Ilham explained that 'first lift the right
leg and body position left of the motor'. In
addition, Ilham along with other peer educators
are campaigning to the classes to share the
knowledge on road safety to other students.
According to Ilham, the training has changed his behavior and enabled him to share knowledge to
his neighbors and schoolmates. Students at the school according to Ilham also experience changes
after receiving the material for crossing the road using the zebra cross. Other change included the
increase of use of helmet and better walking method.
This explains that the road safety education given by the project is easily digested and accepted by
the age of the children and is not difficult to practice. The project is also successful in raising peer
educators. Peer Education gives children confidence and courage to educate their friends and have
a sense of responsibility to keep dissemminating knowledge on road safety to other friends.
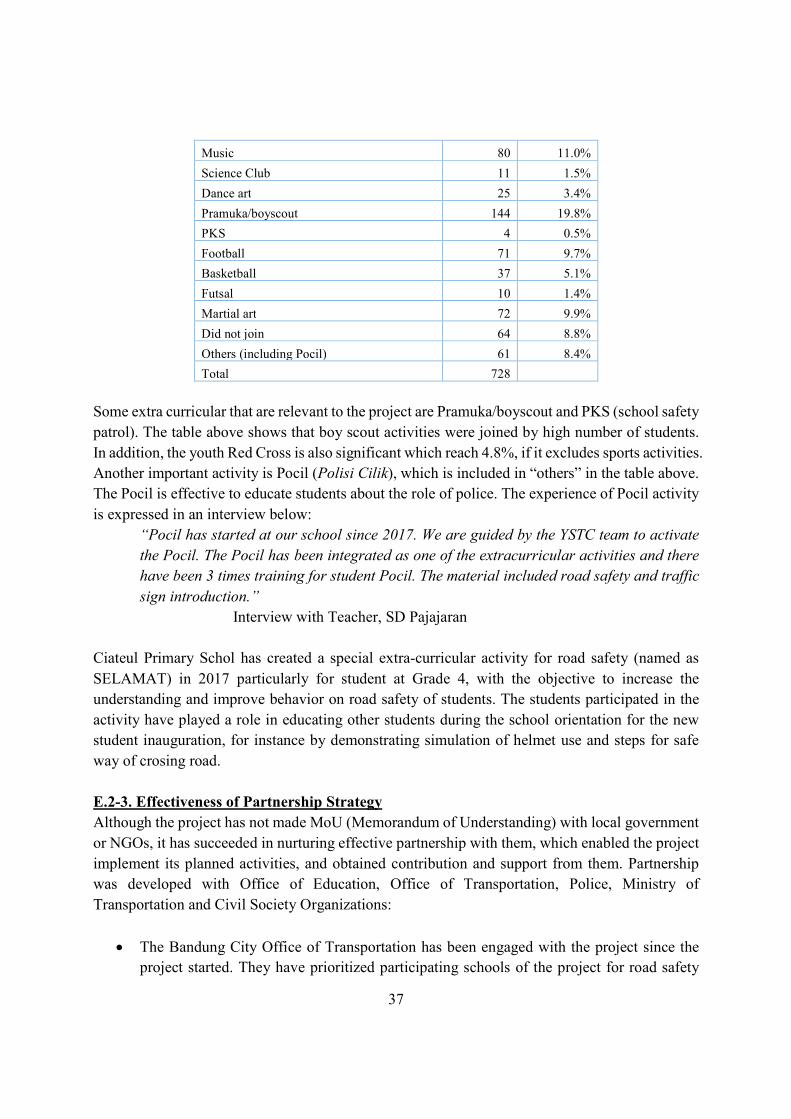
37
Music 80 11.0%
Science Club 11 1.5%
Dance art 25 3.4%
Pramuka/boyscout 144 19.8%
PKS 4 0.5%
Football 71 9.7%
Basketball 37 5.1%
Futsal 10 1.4%
Martial art 72 9.9%
Did not join 64 8.8%
Others (including Pocil) 61 8.4%
Total 728
Some extra curricular that are relevant to the project are Pramuka/boyscout and PKS (school safety
patrol). The table above shows that boy scout activities were joined by high number of students.
In addition, the youth Red Cross is also significant which reach 4.8%, if it excludes sports activities.
Another important activity is Pocil (Polisi Cilik), which is included in “others” in the table above.
The Pocil is effective to educate students about the role of police. The experience of Pocil activity
is expressed in an interview below:
“Pocil has started at our school since 2017. We are guided by the YSTC team to activate
the Pocil. The Pocil has been integrated as one of the extracurricular activities and there
have been 3 times training for student Pocil. The material included road safety and traffic
sign introduction.”
Interview with Teacher, SD Pajajaran
Ciateul Primary Schol has created a special extra-curricular activity for road safety (named as
SELAMAT) in 2017 particularly for student at Grade 4, with the objective to increase the
understanding and improve behavior on road safety of students. The students participated in the
activity have played a role in educating other students during the school orientation for the new
student inauguration, for instance by demonstrating simulation of helmet use and steps for safe
way of crosing road.
E.2-3. Effectiveness of Partnership Strategy
Although the project has not made MoU (Memorandum of Understanding) with local government
or NGOs, it has succeeded in nurturing effective partnership with them, which enabled the project
implement its planned activities, and obtained contribution and support from them. Partnership
was developed with Office of Education, Office of Transportation, Police, Ministry of
Transportation and Civil Society Organizations:
The Bandung City Office of Transportation has been engaged with the project since the
project started. They have prioritized participating schools of the project for road safety
38
infrastructure development program. The head of the office has appointed the office key
staffs as resource person for the project activity and makes sure that they monitor the road
safety infrastructure development for the participating schools. Moreover, the project has
been involved in their pilot program of road safety for children in Bandung City.
Other relevant government institution both local and national level such as the Institute of
Road Engineering – Ministry of Public Works, the Ministry of Transportation have
recognized and acknowledged the project team to be keynote speakers to share knowledge
and experience of the project on their seminars on road safety for children. The project has
even permitted to conduct road safety training in the meeting room of the Institute of Road
Engineering – Ministry of Public Works office.
Pusjatan supported the project through provision of their resources, particularly staff
expertise and meeting rooms for project activities.
Non-government stakeholders have supported activities of the project and collaborated to
conduct joint trainings on road safety in Bandung. The civil society movement for
promoting road safety practices has been strengthened by the project. This is supported by
their participation in various activities or forum organized by YSTC or the project,
including as resource person or facilitators. Similarly, when civil society organizations
conducted trainings or meetings, often they invited project staff as resources person. These
included Red Cross/Palang Merah Indonesia, CAMOT (Prevention of children to ride
motorbike), Budaya Disiplin Bandung, Road Safety Association-Bandung, Bike to School,
Dharma Wanita (Women Association) of Bandung, Koalisi Pejalan Kaki (KPK/Pedestrian
Coalition), Pramuka (Scout), Jaringan Aksi Keselamatan di Jalan (JARAK AMAN/Road
safety network), Bandung Masagi (Program of Office of Education of road safety),
Children Festival for Voices and Aliansi Jurnalis Independen (AJI). However, most of the
NGOs (except for Red Cross), do not have secure resources particularly financial resources
to leverage and expand the road safety activities.
E.3. Project Impact
This section illustrates the project’s both intended and unintended effects and influence
andexplores the extent of the project contribution to its overall goal, which includes impacts the
extent of the project contribution to its overall goal, which includes impacts to actors surrounding
direct beneficiaries such as students, teachers and parents.
E.3-1. Impact at overall goal level
All heads of the schools interviewed reported that there has been decrease in the number of
accidents involving their students, teachers and parents during the project period. The study was
not able to find secondary data or evidence-based data available, however, each school have kept
documenting self-record on log-sheet, which showed decrease in numbers of accidents. The
record submitted by schools shows a significant decrease in the number of accidents from 185 in

39
2015 to 103 in 2016 and to 59 in 2017. Supporting information was also captured inthe
interviews with key stakeholders as follows:
“As school committee member, I have observed that there is changes in behavior when
crossing the road, and the use of helmet among the students of SD Ciateul. Previously,
accidents were higher in the areas, but there is no accident in the last semester.”
Interview with School Committee, SD Ciateul, 2017
“Prior to the project, the number of accidents was high in various schools in our areas. In
my observation, the number of accidents has decreased after the project started. This is
influenced by the fact that more students now use helmet during the motorcycle
transportation and cross road safely. Also, the schools have designated teachers to help
the children crossing the road in morning and after the school time.”
Interview with Head of School, SDN Pesawahan, 2017
“Prior to 2016, accident took place frequently in the SD Cikadut. This is because of wrong
behavior of drivers, lack of habit to wear helmet, and limited infrastructures. The accidents
decreased since there has been zebra cross, drop zone and increased knowledge of students
on road crossing.”
Interview with Teacher, SD Cikadut, 2017.
This is also backed by better knowledge and behavior of students, parents and teachers on road
safety, as described in the previous section of the report. Although it is not evidenced-based, it is
considered that the decrease of accidents is attributed to the project’s contribution by providing
them with comprehensive support for road safety including infrastructures, education and
opportunity to raise awareness.
E.3-2. Impact to Stakeholders
Potential impacts made on stakeholders identified are as follows:
Increased political will to address road safety:
Office of Transportation of Bandung prioritized road safety as part of their activities, which
made them support the project by such as appointing designated staff for road safety issues.
“The program of Save the Children has encouraged us to be consistently provide
better services to improve road safety in Bandung City. The program has
supported the government in terms of the road safety”
Head of Office of Transportation, 2017.
This is also evidenced by the participation of the government officials to the training
activities organized by the project as resource person. In addition, the Office of
Transportation has committed to allocate financial resources for building school safety
facilities such as Safety School Zones.
40
Recognition of the project in other areas in the country:
The project has achieved high recognition and reputation from government institutions of
other districts. The District Development Office of Semarang City of Central Java has
trusted the project team to give technical assistant on their Bus-Rapid-Transit sensitization
(program to promote using school bus for students’ safety). The government of Solo City
in Central Java has also invited the project team to share the experiences of the project
because they wanted to adopt and replicate the project into their development program.
Participation of stakeholders to public campaign and awareness-raising events:
Community organizations and citizen forums who share the concern with road safety issues
have participated in the public campaign and awareness raising events conducted by the
project. At least there are 13 local organizations, and one national organization that have
participated all over the project’s campaign and events. At local level, there are Red Cross
Indonesia, CAMOT, Budaya Disiplin Bandung, Road Safety Association Bandung, Bike
to School, Tim Penggerak Usaha Kesehatan Sekolah, Dharma Wanita Kota Bandung,
Koalisi Pejalan Kaki (Pedestrian Coalition), Pramuka (Boyscout), Yayasan Taman Lalu
Lintas (Traffic Park Foundation), Bandung Masagi (Bandung City MoE program), Festival
Anak Bicara, Aliansi Jurnalis Indonesia (Indonesia Independent Journalist) Bandung,
while at national level, there is JARAK AMAN (Jaringan Aksi Keselamatan di Jalan).
E.3-3. Impact to the Community
The project has contributed to change the road safety manner of the community, as indicated by
an interview below:
“Prior to the YSTC activities, vehicles used to run with high speeds. With the barriers and
the sign for reducing speed are installed around the school, drivers started to tend to
reduce their speeds and drive more carefully”.
Interview with School Committee, SDN Pajajaran.
“The RSS has contributed to increase awareness of community to improve road safety
manner in Bandung. This includes knowledge building of various actors. The staff of the
project often participated to the PMI activities to share their expertise in road safety
improvement”
Interview with Senior Leader of PMI Bandung, 2017.
E.4. Project Sustainability
This section highlights the findings on the sustainability of the project after the close of the project.
It looks at what influence the project brought to schools by highlighting how they could maintain
the motivation and impact made by the project.
E.4-1. Continuation of Trainings and Replication of Training by Teachers and Schools

41
The project has trained teachers to be able to train or educate others on road safety. The skills and
knowledge of teachers will be sustained within school system. This includes the ability of teachers
to adopt the topics of road safety in the existing curriculum such as civic education, language
education and social sciences learning. According to the information gathered from schools, there
are 27 schools that have adopted the topics of road safety into these curriculums. In addition,
extra-curricular learnings which integrates the road safety learning and awareness raising will be
continuously implemented by the participating schools.
Similarly, the participating schools have made the school safety activity as one of their priorities,
which is supported by trained teachers. They convey key messages on road safety including
practice of helmet use at speech during Monday Flag Ceremony. Teacher also use opportunities
of the end of semesters, when students deliver messages on road safety to both the students and
their parents. Such initiatives will support the road safety education to be continued within schools.
The schools participated to the project have been equipped with capacity to replicate trainings on
road safety at their schools. Some schools have already started replication of trainings, as indicated
by an interview below:
“Our school has conducted road safety trainings by ourselves. With the resources provided
by the school, every Thursday road safety training is organized. The topic includes use of
helmet, safety on public transport, knowledge on safe crossing and traffic signs.”
Interview with Teacher, SD Raya Barat, 2017.
However, there is no budget allocated for continuation of activities at school level after the
completion of the project, and most of the schools did not have phasing out strategy. The evaluation
notes that there is no MoU between YSTC or the project and the municipality Government of
Bandung. Such MoU could have been good asset for enhancing sustainability particularly on the
budget support to continue trainings and activities at schools by Ministry of Education.
E.4-2. Introduced School Policy on Road Safety
There are some schools which have introduced policies on road safety after joining the project.
This will ensure sustainable effect to keep awareness on road safety even after the project ended.
School Policy “Say No to Children Driving”
Schools participated to the project have adopted the policy for prohibition of students to drive
motorcycle. Many schools have advocated this during briefing session, teaching session and
extracurricular activities. The interview below reflects the policy:
“Schools participated to the project have been committed to ban students in driving
motorcycle, at least when they travel to the school.”
Interview with Office of Education, 2017
School Policy for Helmet Use
42
Schools participated to the project have adopted the policy for use of helmet for those who are
delivered to school by motorcycle. At some schools, teachers check helmets randomly. Many
schools have advocated this during the briefing session, teaching session and extracurricular
activities.
School Facility Improvement
One of the outputs of the project that contributes to the sustainability is the improvement of road
safety facilities around schools. The schools have become more committed to road safety issues
and attempted to increase the availability of facilities as much as they could. One example is the
School Health Room which has been made available by most of the schools.
School Policy for School Gate
Another initiative taken by schools is to have school guards and security persons who provide
assistance to school children who cross street in front of schools. In addition, some schools
introduced the practice of school gate to open the gate only when children use, which was not
applied previously, as indicated by the following interview:
“After the project, our school has applied ‘close gate policy’ – the gate is closed during
the learning time. This has reduced possibility for children to be outside of the school
during the schooling time.”
Interview with School Committee, SD Pajajaran.
E.5. Replicability and Scale
As written above, the project has been recognized and obtained high reputation in other areas of
the country. For instance, Semarang City of Central Java has requested the project team to provide
technical assistance to their program for safe transportation for students. Due to the difference of
the context (e.g. difference in public transportation services), it is not easy to simply replicate the
project or to apply the same approach in other cities, however, sharing approach and strategy of
the project helped Semarang City to develop their own program. The government of Solo City in
Central Java has also invited the project team to learn the experiences of the project.
Another potential of replicability is recognized in the commitment of local NGOs and associations
to conduct road safety education and utilize the materials produced by the project including
education materials and audio-visual campaign.

43
F. Conclusion and Recommendation
F.1. Conclusion
Based on the findings made through the evaluation process, the 4 years project has made notable
achivements in terms of criteria for evaluation: relevance, effectiveness, impact, sustainability,
replicability and scale. The key achievements of the project were, as follows:
- The project has appropriately and effectively addressed the genuine needs of children
which is high vulnerability of them to road accident especially in West Java. The scope
and the approach of the project was also in line with the rights of the children specified in
CRC and Save the Children’s mission.
- The project improved knowledge and understanding on road safety of children, teachers
and parents. While it is found that right knowledge does not always link to direct
behavioural change, this would eventually lead to a decrease of number of accidents
involving children. Although it is not evidenced, there were witnesses and comments by
heads of schools participating to the project that there has been decrease in the number of
accidents around their schools during the project.
- The project emphasized and ensured child participation in the implementation and utilized
the capacity of children. Especially the introduction of peer-education method boosted the
outputs of the project, and various way of learning materials produced by children with
their initiatives made the project’s effect spread widely and effectively.
- The project tried to ensure the sustainability of the outcomes of the project by influencing
schools in the way that they introduce policies on promoting road safety for children and
continuation of activities to raise awareness on road safety.
- The project has made linkage between and encouraged local stakeholders including local
government to be engaged in addressing road safety issues, which also contributes to
sustain the project’s outputs.
- The project, since there has not been project for road safety before, has become a
successful sample project showcasing effective and replicable approaches when Save the
Children or other organizations plan to program projects with similar scopes in the future.
To sum up, the project has brought impacts to both individuals (students, teachers and parents) and
the society including stakeholders such as schools, civil society organizations and local
government, which is essential to promote road safety for children in long terms.
F.3. Lesson Learned
With the achievement above, however, there are areas identified as challenges that could have
been addressed or improved further:
Road safety for children is not a matter only limited to children, therefore there is high need
to change the mindset and the behavior of parents and society who are responsible in the
safety of children and in giving impacts to children by their behavior. Changing tradition
and attitudes requires longer-time and broader interventions. The support and participation
of civil society organizations that have agenda related to road safety could make the project
44
implementation more effective. It is also recommended to formulate a forum among civil
society organizations working on road safety.
The issue of road safety is new to YSTC, therefore there is limited expertise in the
organization to backstop the project implementation. Knowledge and experiences are to be
well managedand shared within the organization for the future opportunity.
A lack of local regulation on road safety or weak law enforcement on traffic manner, due
to the absence of designated technical government office responsible as lead agency for
coordination of different stakeholders of road safety in the province level, may impede
children’s effort to protect themselves from accidents. It should be considered how a
project can address such issues in the future.
Road safety infrastructure around schools is vital to protect children. However, the Office
of Transportation has limited budget to provide road safety infrastructure. In addition, there
is no budget commitment by the Office of Education to co-finance project activities, or to
designate particular human resources within the structure to be responsible for the issue of
road safety. Therefore, it is highly recommended to advocate local government for more
commitment on road safety issue including budget allocation.
It is desirable, in case new school-based road safety project is implemented in Indonesia in the
future, to consider and try to address the points raised above in order to maximize the outcomes of
the project.
F.4. Recommendations
The evaluation recommends the followings:
There is a need to integrate the program of road safety within the Ministry of Education. This
is to ensure the resources commitment of the Office of Education at the province and district
level.
Since road safety is strongly related to habits and tradition of societies, education on road
safety need longer-term intervention, and actors such as community leaders, bus drivers and
other non-school actors are to be included as strategic partners.
It is necessary to advocate local government on more committment for resource allocation
(both human resources and financial resources) for road safety facilities and law enforcement.
In addition, advocacy to local government to establish and functionate Road Traffic and
Transport Forum (RTTF) will be also strategic. Similarly, the project can build more strategic
and long-term cooperation with Ministry of Transport to mainstream RUKN (national safety
plan) among local offices at sub national governments.
Road safety education can be promoted by being integrated into School Safety program within
the development of agenda of Ministry of Education, in order to ensure the sustainability more
effectively. It could be linked to Comprehensive School Safety Framework that promotes and
ensures safety for children at and around schools.

45
Capacity building of institutions is to be considered strategically. This include schools, Office
of Education and NGOs that are engaged in promotion of road safety. Schools can be
supported by strategic plan to systematize action plan and other activities by available
resources including priority program of Office of Education.The evaluation also recommends
NGOs and associations to expand its strategy for the sustainability of the activities promoting
road safety. Moreover, it is also recommended to strategically strengthen or facilitate a forum
or alliances among civil society organizations working on road safety, not only ad-hoc basis,
but to have organizational entity.
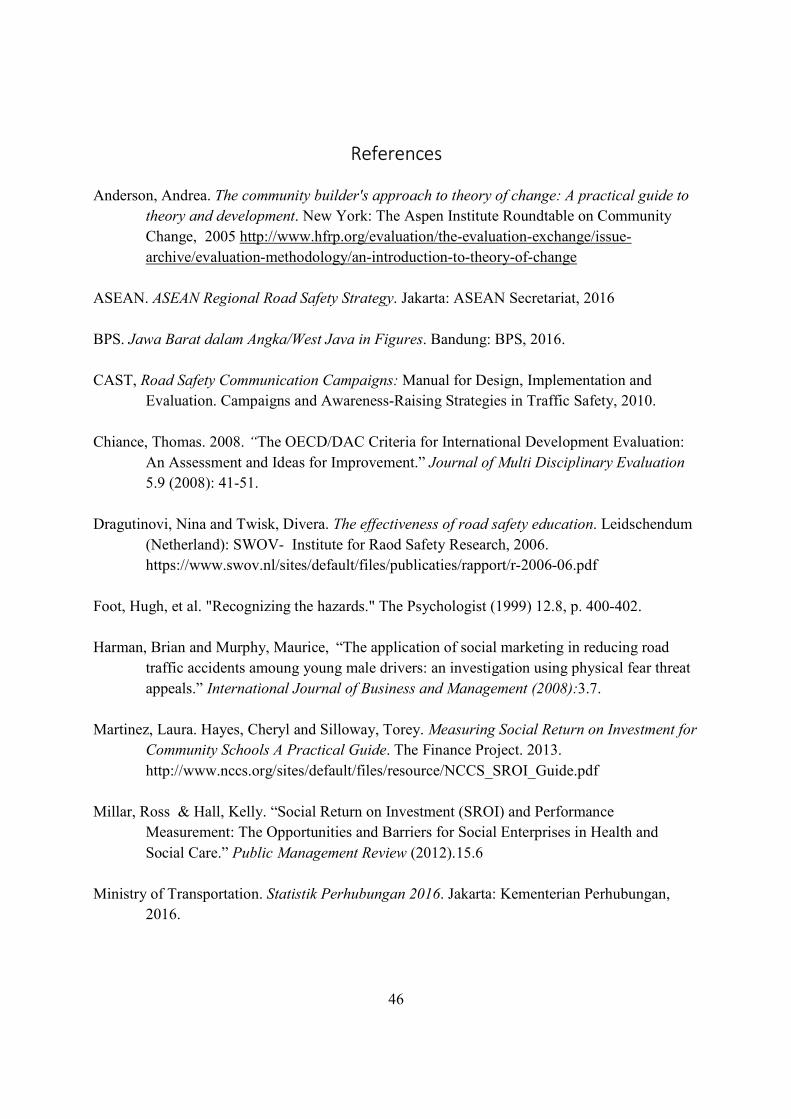
46
References
Anderson, Andrea. The community builder's approach to theory of change: A practical guide to
theory and development. New York: The Aspen Institute Roundtable on Community
Change, 2005 http://www.hfrp.org/evaluation/the-evaluation-exchange/issue-
archive/evaluation-methodology/an-introduction-to-theory-of-change
ASEAN. ASEAN Regional Road Safety Strategy. Jakarta: ASEAN Secretariat, 2016
BPS. Jawa Barat dalam Angka/West Java in Figures. Bandung: BPS, 2016.
CAST, Road Safety Communication Campaigns: Manual for Design, Implementation and
Evaluation. Campaigns and Awareness-Raising Strategies in Traffic Safety, 2010.
Chiance, Thomas. 2008. “The OECD/DAC Criteria for International Development Evaluation:
An Assessment and Ideas for Improvement.” Journal of Multi Disciplinary Evaluation
5.9 (2008): 41-51.
Dragutinovi, Nina and Twisk, Divera. The effectiveness of road safety education. Leidschendum
(Netherland): SWOV- Institute for Raod Safety Research, 2006.
https://www.swov.nl/sites/default/files/publicaties/rapport/r-2006-06.pdf
Foot, Hugh, et al. "Recognizing the hazards." The Psychologist (1999) 12.8, p. 400-402.
Harman, Brian and Murphy, Maurice, “The application of social marketing in reducing road
traffic accidents amoung young male drivers: an investigation using physical fear threat
appeals.” International Journal of Business and Management (2008):3.7.
Martinez, Laura. Hayes, Cheryl and Silloway, Torey. Measuring Social Return on Investment for
Community Schools A Practical Guide. The Finance Project. 2013.
http://www.nccs.org/sites/default/files/resource/NCCS_SROI_Guide.pdf
Millar, Ross & Hall, Kelly. “Social Return on Investment (SROI) and Performance
Measurement: The Opportunities and Barriers for Social Enterprises in Health and
Social Care.” Public Management Review (2012).15.6
Ministry of Transportation. Statistik Perhubungan 2016. Jakarta: Kementerian Perhubungan,
2016.

47
WHO. Pedestrian safety: a road safety manual for decision-makers and practitioners. Geneva:
WHO, 2013
Wihanesta, Retno and Samadhi, Nirarta. “Cities neglect traffic safety”. The Jakarta Post, 22
November 2016.
Zohrabi, M. (2013). Mixed method research: Instruments, validity, reliability and reporting
findings. Theory and Practice in Language Studies, 3(2), 254.

48
Annex 1: Terms of References
Final Evaluation
Road Side Safety
Project (Selamat)
Background
Save the Children (SC) is a leading, private child-focused non-governmental alliance of 30
member organizations that works in 120 countries throughout the world. Save the Children has
worked in Indonesia since 1976 to promote health and nutrition, education, child protection,
livelihoods, and emergency preparedness and response.
Save the Children in Indonesia is changing for the better. We've begun to build a national
organisation that aims to be a strong, local, and self-sustaining voice for children in Indonesia
namely Yayasan Sayangi Tunas Cilik (YSTC). To this end, YSTC has been designated as a
“Prospect Member of Save the Children” which focuses on strengthening and localizing our voice
for children in strategic middle income countries. Currently Save the Children’s programs in
Indonesia is implement by YSTC. We work in twelve provinces, have staff of approximately 300
local professionals, and programming in Child Protection, Education, Health and Nutrition,
Disaster Risk Reduction, and Humanitarian Response.
Start from April 2014, YSTC have been implementing a program to reduce the number of
road traffic fatalities and injuries among children and youth in the West Java province through
Road Side Safety/Sosialisasi dan Edukasi Keselamatan Berlalu Lintas (SELAMAT) project, with
the goal of this project is to increase the safety of students through improve road safety
infrastructure and knowledge and practices in the Metropolitan Bandung area of the West Java
province. This project will end in March 2018.
In order to achieve its goal, there are 4 intermediate objectives that have to be achieved by
this project. They are as follow:
1. Increased knowledge of school based road safety
2. Improved physical road safety infrastructure near schools
3. Improved knowledge and practices among teachers and students
4. Increased public and local government awareness of road safety
Under each intermediate objective above, there are several objective’s indicators as the project
reference to implement.
The project has been partnering with 30 basic schools in Bandung City; 15 elementary
schools and 15 junior high schools as the participating schools. For integrative purpose with the
government works, the project also collaborates with District Education Office (DEO) since
education is under their authority, while with District Traffic Police Office (DTPO) and District
Transportation Ministry Office (DTMO) for road safety infrastructure and road safety knowledge.
Aside from this, the project has also been partnering with some road safety community forum and
related civil society organization particularly in project’s campaign activity.
Four main activities that implemented by this project are: comprehensive road safety
studies; facilitate road safety infrastructure near school; facilitate trainings for student, teacher and
school’s staff, student’s parent; and advocacy and campaign to increase public awareness.
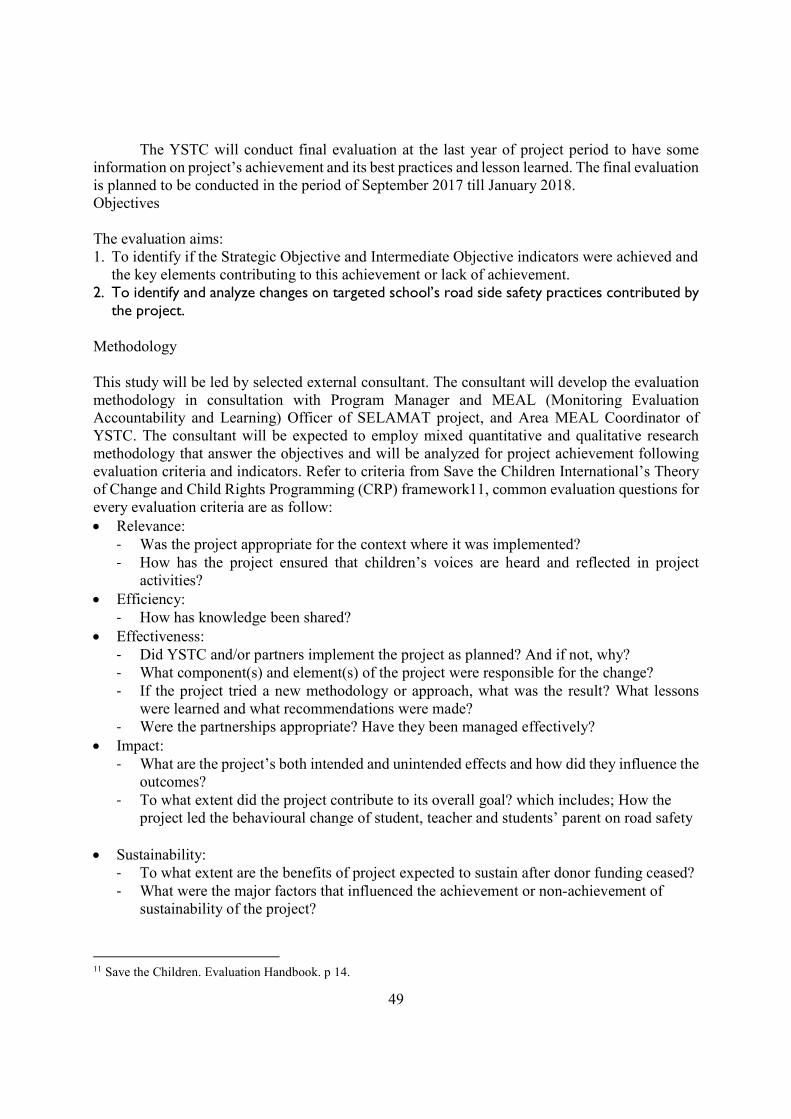
49
The YSTC will conduct final evaluation at the last year of project period to have some
information on project’s achievement and its best practices and lesson learned. The final evaluation
is planned to be conducted in the period of September 2017 till January 2018.
Objectives
The evaluation aims:
1. To identify if the Strategic Objective and Intermediate Objective indicators were achieved and
the key elements contributing to this achievement or lack of achievement.
2. To identify and analyze changes on targeted school’s road side safety practices contributed by the project.
Methodology
This study will be led by selected external consultant. The consultant will develop the evaluation
methodology in consultation with Program Manager and MEAL (Monitoring Evaluation
Accountability and Learning) Officer of SELAMAT project, and Area MEAL Coordinator of
YSTC. The consultant will be expected to employ mixed quantitative and qualitative research
methodology that answer the objectives and will be analyzed for project achievement following
evaluation criteria and indicators. Refer to criteria from Save the Children International’s Theory
of Change and Child Rights Programming (CRP) framework11, common evaluation questions for
every evaluation criteria are as follow:
Relevance:
- Was the project appropriate for the context where it was implemented?
- How has the project ensured that children’s voices are heard and reflected in project
activities?
Efficiency:
- How has knowledge been shared?
Effectiveness:
- Did YSTC and/or partners implement the project as planned? And if not, why?
- What component(s) and element(s) of the project were responsible for the change?
- If the project tried a new methodology or approach, what was the result? What lessons
were learned and what recommendations were made?
- Were the partnerships appropriate? Have they been managed effectively?
Impact:
- What are the project’s both intended and unintended effects and how did they influence the
outcomes?
- To what extent did the project contribute to its overall goal? which includes; How the
project led the behavioural change of student, teacher and students’ parent on road safety
Sustainability:
- To what extent are the benefits of project expected to sustain after donor funding ceased?
- What were the major factors that influenced the achievement or non-achievement of
sustainability of the project?
11 Save the Children. Evaluation Handbook. p 14.
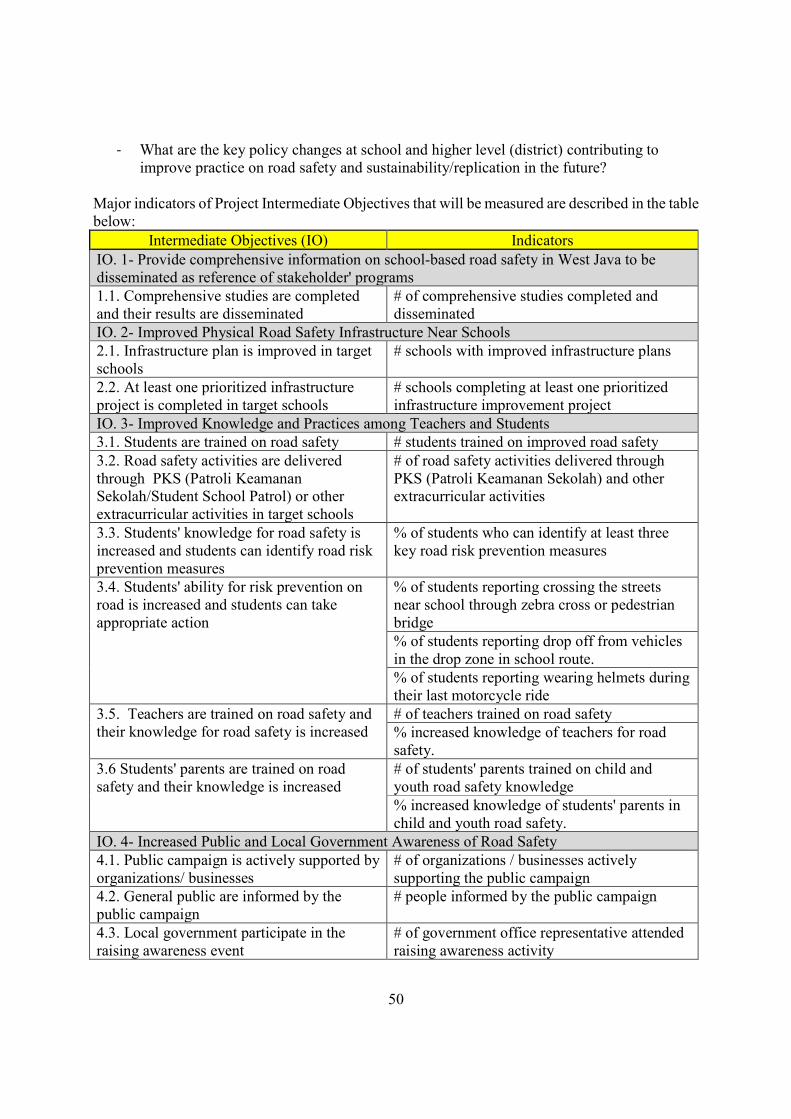
50
- What are the key policy changes at school and higher level (district) contributing to
improve practice on road safety and sustainability/replication in the future?
Major indicators of Project Intermediate Objectives that will be measured are described in the table
below:
Intermediate Objectives (IO) Indicators
IO. 1- Provide comprehensive information on school-based road safety in West Java to be
disseminated as reference of stakeholder' programs
1.1. Comprehensive studies are completed
and their results are disseminated
# of comprehensive studies completed and
disseminated
IO. 2- Improved Physical Road Safety Infrastructure Near Schools
2.1. Infrastructure plan is improved in target
schools
# schools with improved infrastructure plans
2.2. At least one prioritized infrastructure
project is completed in target schools
# schools completing at least one prioritized
infrastructure improvement project
IO. 3- Improved Knowledge and Practices among Teachers and Students
3.1. Students are trained on road safety # students trained on improved road safety
3.2. Road safety activities are delivered
through PKS (Patroli Keamanan
Sekolah/Student School Patrol) or other
extracurricular activities in target schools
# of road safety activities delivered through
PKS (Patroli Keamanan Sekolah) and other
extracurricular activities
3.3. Students' knowledge for road safety is
increased and students can identify road risk
prevention measures
% of students who can identify at least three
key road risk prevention measures
3.4. Students' ability for risk prevention on
road is increased and students can take
appropriate action
% of students reporting crossing the streets
near school through zebra cross or pedestrian
bridge
% of students reporting drop off from vehicles
in the drop zone in school route.
% of students reporting wearing helmets during
their last motorcycle ride
3.5. Teachers are trained on road safety and
their knowledge for road safety is increased
# of teachers trained on road safety
% increased knowledge of teachers for road
safety.
3.6 Students' parents are trained on road
safety and their knowledge is increased
# of students' parents trained on child and
youth road safety knowledge
% increased knowledge of students' parents in
child and youth road safety.
IO. 4- Increased Public and Local Government Awareness of Road Safety
4.1. Public campaign is actively supported by
organizations/ businesses
# of organizations / businesses actively
supporting the public campaign
4.2. General public are informed by the
public campaign
# people informed by the public campaign
4.3. Local government participate in the
raising awareness event
# of government office representative attended
raising awareness activity
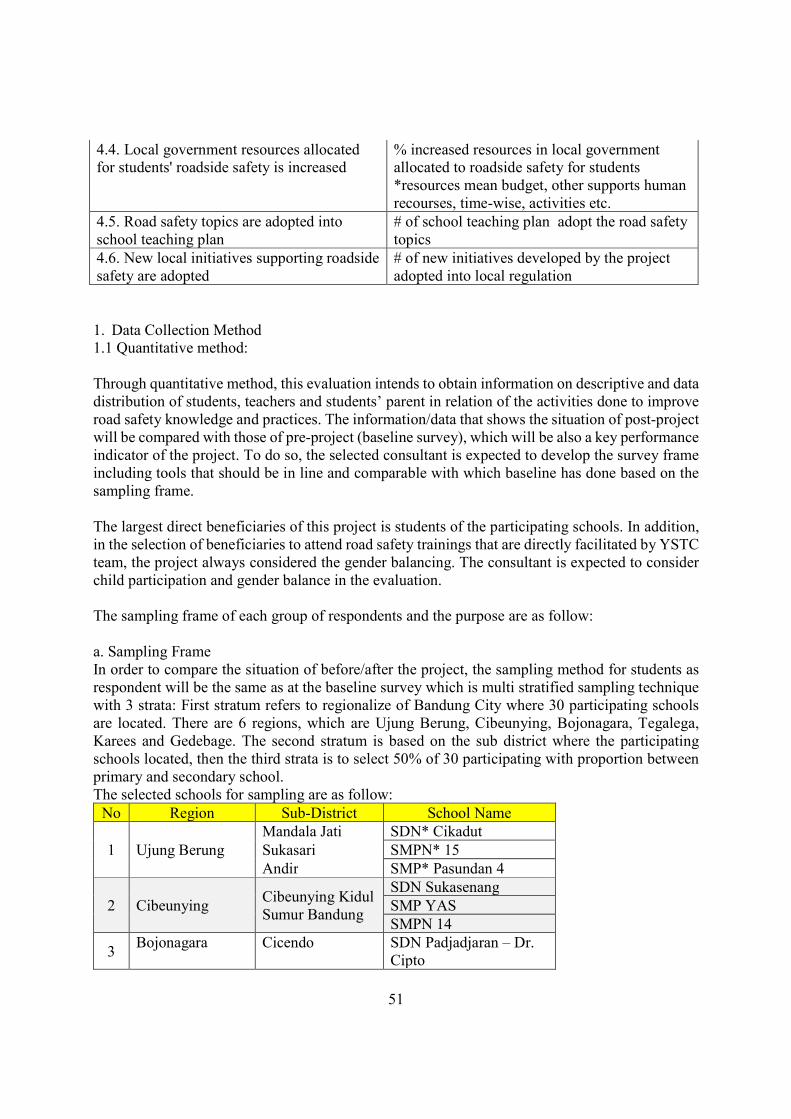
51
4.4. Local government resources allocated
for students' roadside safety is increased
% increased resources in local government
allocated to roadside safety for students
*resources mean budget, other supports human
recourses, time-wise, activities etc.
4.5. Road safety topics are adopted into
school teaching plan
# of school teaching plan adopt the road safety
topics
4.6. New local initiatives supporting roadside
safety are adopted
# of new initiatives developed by the project
adopted into local regulation
1. Data Collection Method
1.1 Quantitative method:
Through quantitative method, this evaluation intends to obtain information on descriptive and data
distribution of students, teachers and students’ parent in relation of the activities done to improve
road safety knowledge and practices. The information/data that shows the situation of post-project
will be compared with those of pre-project (baseline survey), which will be also a key performance
indicator of the project. To do so, the selected consultant is expected to develop the survey frame
including tools that should be in line and comparable with which baseline has done based on the
sampling frame.
The largest direct beneficiaries of this project is students of the participating schools. In addition,
in the selection of beneficiaries to attend road safety trainings that are directly facilitated by YSTC
team, the project always considered the gender balancing. The consultant is expected to consider
child participation and gender balance in the evaluation.
The sampling frame of each group of respondents and the purpose are as follow:
a. Sampling Frame
In order to compare the situation of before/after the project, the sampling method for students as
respondent will be the same as at the baseline survey which is multi stratified sampling technique
with 3 strata: First stratum refers to regionalize of Bandung City where 30 participating schools
are located. There are 6 regions, which are Ujung Berung, Cibeunying, Bojonagara, Tegalega,
Karees and Gedebage. The second stratum is based on the sub district where the participating
schools located, then the third strata is to select 50% of 30 participating with proportion between
primary and secondary school.
The selected schools for sampling are as follow:
No Region Sub-District School Name
1 Ujung Berung
Mandala Jati SDN* Cikadut
Sukasari SMPN* 15
Andir SMP* Pasundan 4
2 Cibeunying Cibeunying Kidul
Sumur Bandung
SDN Sukasenang
SMP YAS
SMPN 14
3 Bojonagara Cicendo SDN Padjadjaran – Dr.
Cipto
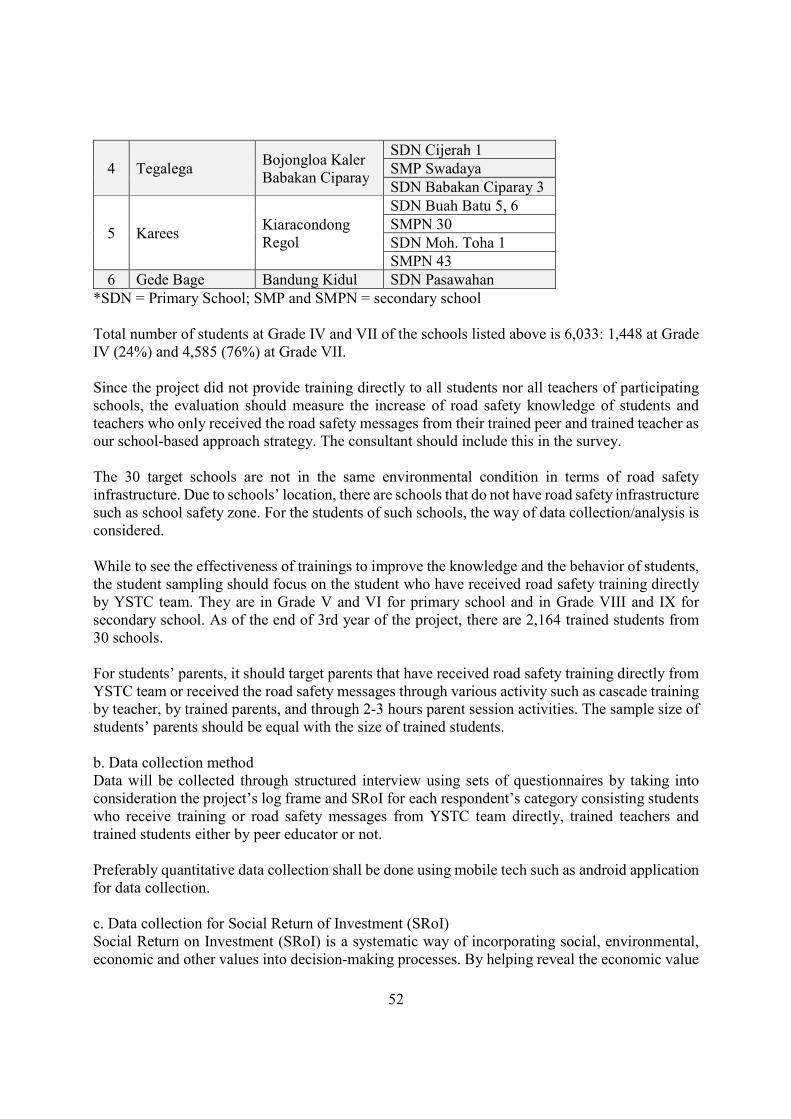
52
4 Tegalega Bojongloa Kaler
Babakan Ciparay
SDN Cijerah 1
SMP Swadaya
SDN Babakan Ciparay 3
5 Karees Kiaracondong
Regol
SDN Buah Batu 5, 6
SMPN 30
SDN Moh. Toha 1
SMPN 43
6 Gede Bage Bandung Kidul SDN Pasawahan
*SDN = Primary School; SMP and SMPN = secondary school
Total number of students at Grade IV and VII of the schools listed above is 6,033: 1,448 at Grade
IV (24%) and 4,585 (76%) at Grade VII.
Since the project did not provide training directly to all students nor all teachers of participating
schools, the evaluation should measure the increase of road safety knowledge of students and
teachers who only received the road safety messages from their trained peer and trained teacher as
our school-based approach strategy. The consultant should include this in the survey.
The 30 target schools are not in the same environmental condition in terms of road safety
infrastructure. Due to schools’ location, there are schools that do not have road safety infrastructure
such as school safety zone. For the students of such schools, the way of data collection/analysis is
considered.
While to see the effectiveness of trainings to improve the knowledge and the behavior of students,
the student sampling should focus on the student who have received road safety training directly
by YSTC team. They are in Grade V and VI for primary school and in Grade VIII and IX for
secondary school. As of the end of 3rd year of the project, there are 2,164 trained students from
30 schools.
For students’ parents, it should target parents that have received road safety training directly from
YSTC team or received the road safety messages through various activity such as cascade training
by teacher, by trained parents, and through 2-3 hours parent session activities. The sample size of
students’ parents should be equal with the size of trained students.
b. Data collection method
Data will be collected through structured interview using sets of questionnaires by taking into
consideration the project’s log frame and SRoI for each respondent’s category consisting students
who receive training or road safety messages from YSTC team directly, trained teachers and
trained students either by peer educator or not.
Preferably quantitative data collection shall be done using mobile tech such as android application
for data collection.
c. Data collection for Social Return of Investment (SRoI)
Social Return on Investment (SRoI) is a systematic way of incorporating social, environmental,
economic and other values into decision-making processes. By helping reveal the economic value
53
of social and environmental outcomes, it creates a holistic perspective on whether a development
project or social business or enterprise is beneficial and profitable.12
The evaluation process includes collecting the data/information that support SRoI analysis. As for
this purpose, the consultant will collect data for SRoI along with other data needed for evaluation.
However, specifically data for SRoI will be analyzed by Sompo's consultant (Sompo's expertise)
directly, as this is an additional data asked by Sompo. (Please see Annex 1 for detail data
required.)
1.2 Qualitative Method
The qualitative method will be employed to understand the process, result and its future
sustainability of the project from the perspective of stakeholder and beneficiaries that are not
measured by numerically. This method is also useful to seek information on to what extent the
increase of road safety knowledge led student’s behavior changes.
The target measured by qualitative method are: officers of DEO, DTMO and Police Traffic Office,
as well as teachers, school principals and parents of students. The officer of DEO, DTMO, and
Police Traffic Office were interviewed in baseline data study. In the absence of them, then will be
replaced with the officers that actively involved in project activity.
a. Data collection method
Data will be collected through in-depth interview with relevant respondents using interview guide.
The consultant will be responsible for developing relevant interview guide by taking into
consideration all aspects of evaluation criteria. Respondents of in-depth interview are teachers,
school principals, officer of DTMO, DEO and Traffic Police.
Individual in-depth interviews
During in-depth interview with teacher and school principals, consultant will be expected to cross-
check the information collected from student group respondent by asking the same question if the
data collected simultaneously in questionnaires.
Teachers who have been trained directly by YSTC will be interviewed as informant. There are 51
trained teachers from these 15 selected schools.
Focus Group Discussion
Focus Group Discussion will be applied using interview guideline for group respondent of
student’s parents who received road safety training directly from YSTC team and attended 2-3
hours “parent session” facilitated by YSTC training or trained teacher and trained parent.
12 http://www.betterevaluation.org
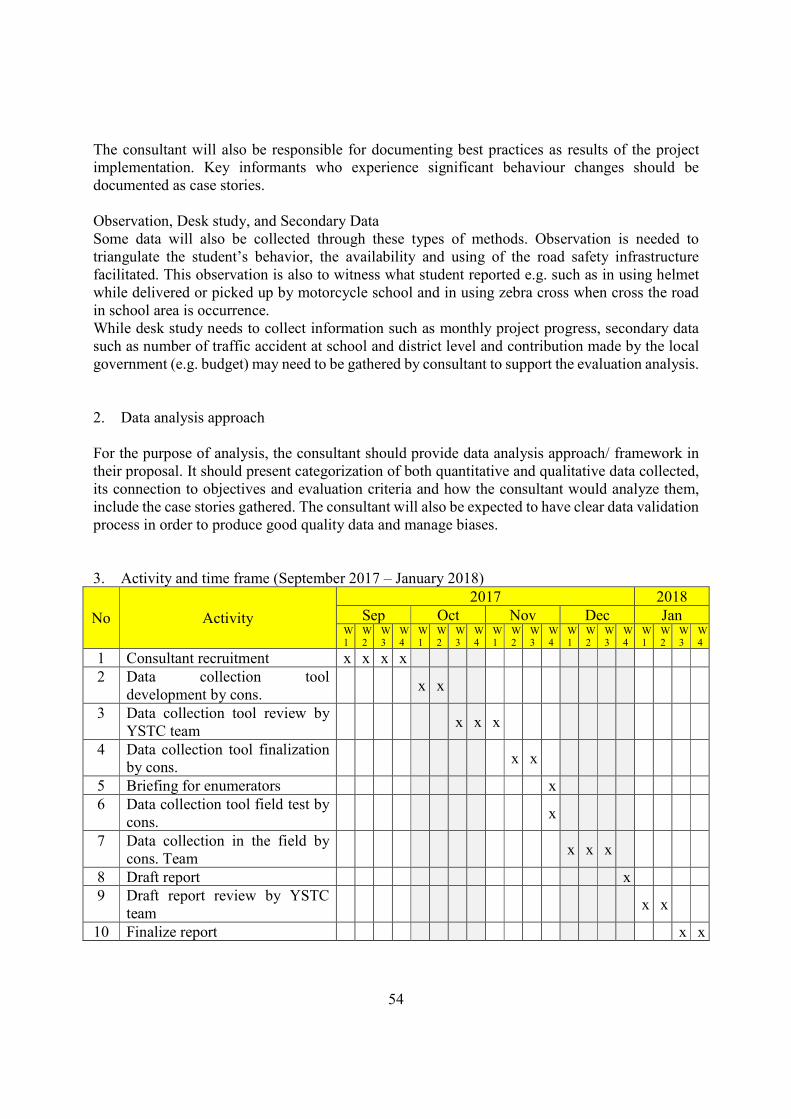
54
The consultant will also be responsible for documenting best practices as results of the project
implementation. Key informants who experience significant behaviour changes should be
documented as case stories.
Observation, Desk study, and Secondary Data
Some data will also be collected through these types of methods. Observation is needed to
triangulate the student’s behavior, the availability and using of the road safety infrastructure
facilitated. This observation is also to witness what student reported e.g. such as in using helmet
while delivered or picked up by motorcycle school and in using zebra cross when cross the road
in school area is occurrence.
While desk study needs to collect information such as monthly project progress, secondary data
such as number of traffic accident at school and district level and contribution made by the local
government (e.g. budget) may need to be gathered by consultant to support the evaluation analysis.
2. Data analysis approach
For the purpose of analysis, the consultant should provide data analysis approach/ framework in
their proposal. It should present categorization of both quantitative and qualitative data collected,
its connection to objectives and evaluation criteria and how the consultant would analyze them,
include the case stories gathered. The consultant will also be expected to have clear data validation
process in order to produce good quality data and manage biases.
3. Activity and time frame (September 2017 – January 2018)
No Activity
2017 2018
Sep Oct Nov Dec Jan W
1
W
2
W
3
W
4
W
1
W
2
W
3
W
4
W
1
W
2
W
3
W
4
W
1
W
2
W
3
W
4
W
1
W
2
W
3
W
4
1 Consultant recruitment x x x x
2 Data collection tool
development by cons. x x
3 Data collection tool review by
YSTC team x x x
4 Data collection tool finalization
by cons. x x
5 Briefing for enumerators x
6 Data collection tool field test by
cons. x
7 Data collection in the field by
cons. Team x x x
8 Draft report x
9 Draft report review by YSTC
team x x
10 Finalize report x x
55
4. Output And Deliverables
The following specific outputs are expected:
(i) A final evaluation proposal should be produced by no later than 4th week of September 2017
(ii) A final evaluation tools should be submitted by no later than 4th week of November 2017
(iii) A draft evaluation report is submitted by no later than 4th week of December 2017
(iv) A Final evaluation report including and recommendations to the RSS project of YSTC for
future use of unrestricted funds and/or alternative solutions to achieve the same objectives
produced by 4th week of January 2018. The evaluation report is an exclusive property of the
Save the Children should not be released without prior authorization. The final report will
be available through Save the Children and will also be circulated to the country programs
(v) Data sets (SPSS, Excel, or other format to be consulted with RSS MEAL Officer) – for all
collected data (quantitative and qualitative). Qualitative data should be transcribed for future
use by YSTC Country programs. The data sets should be in an appropriate format and will
be submitted together with the final evaluation report on 4th week of January 2018
(vi) PowerPoint presentation, summarizing the key findings from the evaluation submitted
together with the final evaluation report on 4th week of January 2018
5. Budget
Budget code: 36104-3600038-39201084-374837
The selected consultant should submit to YSTC forecast of the budget including their
consultancy fees. Android tablet for data collecting will be covered by YSTC. All costs should
be expressed in IDR.
Payment
Payment is paid 40% upon sign the contract; 30% upon satisfactory draft of report; and 30% upon
acceptance and satisfactory of all deliverables. All of cost that caused by the implementation of
this activities such as transportation and hotel will be covered by the consultant.
6. Terms and Conditions of Solicitation
Period of Validity
The proposal shall be valid for a period of 50 days, starting from the submission date.
Notice of Non-Binding Solicitation
Save the Children reserves the right to reject any and all bids received in response to this
solicitation, and is in no way bound to accept any proposal. Additionally, we reserve the right to
negotiate the substance of the finalists’ proposals, as well as the option of accepting partial
56
components of a proposal if appropriate. Quantities provided are estimates only at this time and
will be subject to change.
Confidentiality
All information provided as part of this solicitation is considered confidential. In the event that
any information is inappropriately released, Save the Children will seek appropriate remedies as
allowed. Proposals, discussions, and all information received in response to this solicitation will
be held as strictly confidential, except where noted otherwise.
Notification
Prior to the expiration of the validity of the proposal, Save the Children shall notify in writing the
successful company that submitted the highest-scoring proposal and will invite them for contract
negotiations. Save the Children reserves the right to invite the second ranking company for parallel
negotiations.
Right to Final Negotiations
Save The Children reserves the option to negotiate final costs and final scope of work, as well as
reserves the option to limit or include third parties at Save the Children’s sole and full discretion
in such negotiations. Upon failure to reach agreement on the contents of the contract as stipulated
in this document, Save the Children has the right to terminate the negotiations and invite the next
best-rated company for negotiations.
Communication
All communication regarding this solicitation shall be directed to appropriate parties at Save the
Children. Contacting third parties involved in the project, the review panel, or any other party may
be considered a conflict of interest, and could result in proposal disqualification.
Acceptance
Award of a proposal does not imply acceptance of its terms and conditions. Save the Children
reserves the option to negotiate on the final terms and conditions
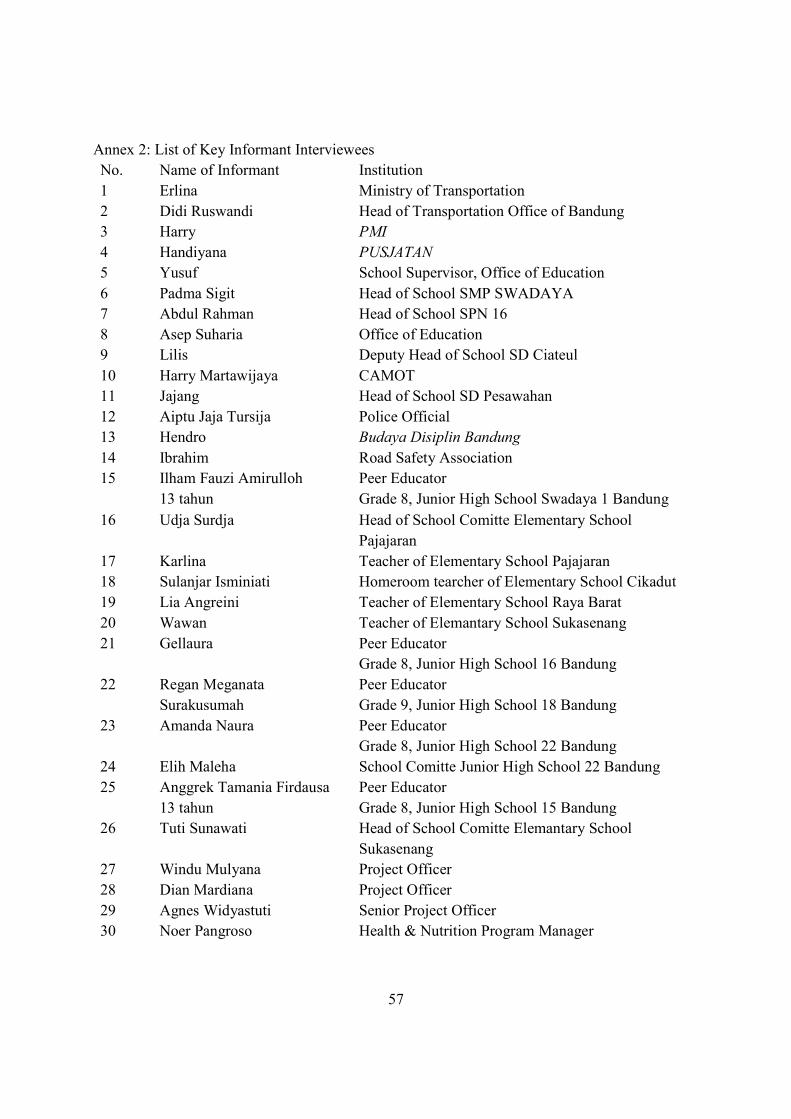
57
Annex 2: List of Key Informant Interviewees
No. Name of Informant Institution
1 Erlina Ministry of Transportation
2 Didi Ruswandi Head of Transportation Office of Bandung
3 Harry PMI
4 Handiyana PUSJATAN
5 Yusuf School Supervisor, Office of Education
6 Padma Sigit Head of School SMP SWADAYA
7 Abdul Rahman Head of School SPN 16
8 Asep Suharia Office of Education
9 Lilis Deputy Head of School SD Ciateul
10 Harry Martawijaya CAMOT
11 Jajang Head of School SD Pesawahan
12 Aiptu Jaja Tursija Police Official
13 Hendro Budaya Disiplin Bandung
14 Ibrahim Road Safety Association
15 Ilham Fauzi Amirulloh
13 tahun
Peer Educator
Grade 8, Junior High School Swadaya 1 Bandung
16 Udja Surdja
Head of School Comitte Elementary School
Pajajaran
17 Karlina Teacher of Elementary School Pajajaran
18 Sulanjar Isminiati Homeroom tearcher of Elementary School Cikadut
19 Lia Angreini Teacher of Elementary School Raya Barat
20 Wawan Teacher of Elemantary School Sukasenang
21 Gellaura Peer Educator
Grade 8, Junior High School 16 Bandung
22 Regan Meganata
Surakusumah
Peer Educator
Grade 9, Junior High School 18 Bandung
23 Amanda Naura
Peer Educator
Grade 8, Junior High School 22 Bandung
24 Elih Maleha School Comitte Junior High School 22 Bandung
25 Anggrek Tamania Firdausa
13 tahun
Peer Educator
Grade 8, Junior High School 15 Bandung
26 Tuti Sunawati
Head of School Comitte Elemantary School
Sukasenang
27 Windu Mulyana Project Officer
28 Dian Mardiana Project Officer
29 Agnes Widyastuti Senior Project Officer
30 Noer Pangroso Health & Nutrition Program Manager