Embed Size (px)
Citation preview

Full Terms & Conditions of access and use can be found athttp://www.tandfonline.com/action/journalInformation?journalCode=uaem20
Download by: [Central Inland Fisheries Research Inst ] Date: 17 May 2017, At: 22:28
Aquatic Ecosystem Health & Management
ISSN: 1463-4988 (Print) 1539-4077 (Online) Journal homepage: http://www.tandfonline.com/loi/uaem20
Status of the River Krishna: Water quality andriverine environment in relation to fisheries
A. K. Das, R. K. Manna, D. S. K. Rao, B. C. Jha, M. Naskar & A. P. Sharma
To cite this article: A. K. Das, R. K. Manna, D. S. K. Rao, B. C. Jha, M. Naskar & A. P. Sharma(2017) Status of the River Krishna: Water quality and riverine environment in relation to fisheries,Aquatic Ecosystem Health & Management, 20:1-2, 160-174
To link to this article: http://dx.doi.org/10.1080/14634988.2017.1296312
Accepted author version posted online: 21Mar 2017.Published online: 21 Mar 2017.
Submit your article to this journal
Article views: 14
View related articles
View Crossmark data

Status of the River Krishna: Water quality and riverine
environment in relation to fisheries
A. K. Das,* R. K. Manna, D. S. K. Rao, B. C. Jha, M. Naskar,
and A. P. SharmaCentral Inland Fisheries Research Institute Barrackpore, Kolkata 700 120, India
*Corresponding author: [email protected]
The River Krishna, the second largest peninsular river of India, was investigated during pre-monsoon,monsoon, and post-monsoon seasons to improve the understanding of its ecology through analysis ofphysical and chemical parameters of water and sediment. Important tributaries of the river were alsostudied simultaneously to understand their influence on the main stream of the River Krishna. Inaddition to 25 sampling sites along the main stream of the River Krishna, sampling was also done in 13important tributaries at sites upstream of the confluence point. Dams, barrages and anicuts have visibleimpacts on all of the observed physical and chemical properties of water and soil. Statistical analysisrevealed that water parameters have a strong association with sediment parameters. However, the studywas unable to find any relation between primary production and water quality parameters. Fish speciesdistribution was strongly influenced by temperature and water depth, as well as specific conductivity, asobserved through Canonical Correspondence Analysis.
Keywords: Water-sediment-fish relationship, MANOVA, canonical correlation analysis
Introduction
The River Krishna is the second largest penin-sular river of India after the River Godavari andhas a drainage area of 268,786 km2, of which25.8% falls in the state of Maharashtra, 42.4% inKarnataka and 31.8% in Andhra Pradesh(Figure 1). Originating from the MahabaleswarHills (1337 m asl) of the Western Ghats in Maha-rashtra, it traverses 1,400 km from west to eastthrough the three states before emptying into theBay of Bengal. Important tributaries of the RiverKrishna are Wenna, Urmodi, Tarli, Koyna,Ghataprabha, Malaprabha, Bhima, Tungabhadraand Musi. During recent decades, the flow of theRiver Krishna and most of its tributaries has been
entirely modified by regulated water releases froma number of dams, barrages, anicuts, constructedon the main channel as well as on tributaries, tomeet the ever-increasing demand for water. Totalstorage capacity from various irrigation projectson the Krishna basins was 29,860 MCM (CentralPollution Control Board, 1989), with 90% ofstored water from large irrigation projects beingused entirely for agricultural purposes. Addition-ally, a number of irrigation projects commissionedafter 1980 further reduced the river flow, convert-ing streams into a combination of stagnant pools.The major dams on the main river are Dhom,Almatti, Naryanpur, Srisailam and Nagarjunasa-gar, along with a number of anicuts and barrages.The flow of the River Krishna is first obstructed by
160
Aquatic Ecosystem Health & Management, 20(1–2):160–174, 2017. Copyright � 2017 AEHMS. ISSN: 1463-4988 print / 1539-4077 online
DOI: 10.1080/14634988.2017.1296312

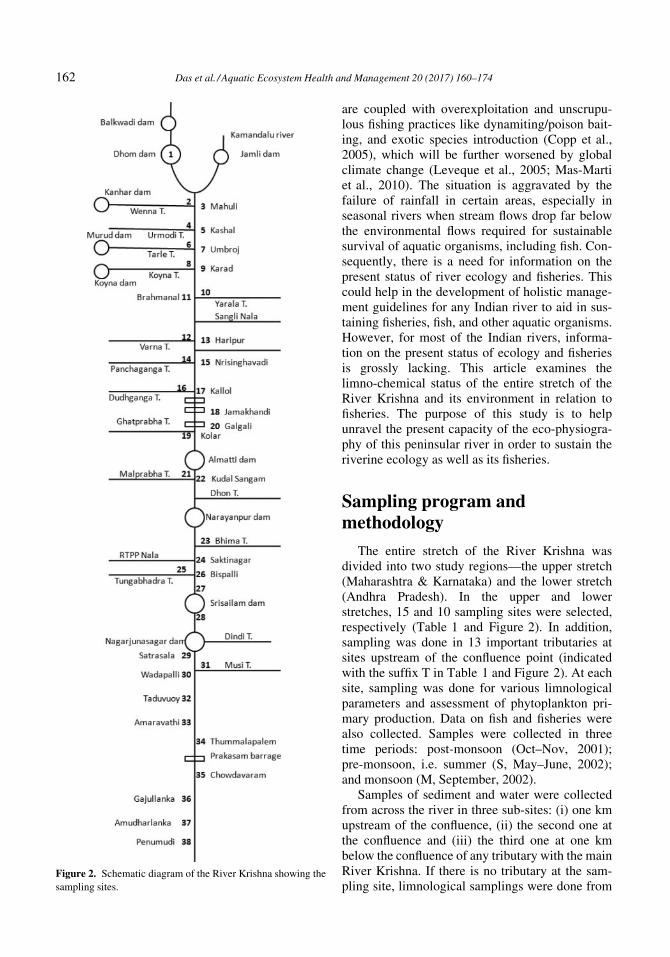
the Balkwadi dam, followed by the Dhom dam,where the Kamandalu River joins with the Krishna(Figure 2). Upstream of the Kamandalu River,water flow is also checked by the Jamli dam.Downstream of the Dhom dam and up to Wai,there is very sparse water flow over a rocky andgravely riverbed during post- and pre-monsoonseasons, but the flow improves slightly during themonsoon season. Downstream of Wai, the river-bed is sandy, sandy-loam, or sandy-clay-loam.The Krishna River from Wai to Kurnool is joinedby more than 15 tributaries. These tributaries playa significant role in bringing silty-clay particlesinto the main river, producing large changes in thenature and properties of riverbed sediments. Themaximum annual run-off from the Krishna R.basin is high at 1,066,349 MCM, while the mini-mum is only 9.0 MCM, with a mean discharge of67,305 MCM. Thus, with a total catchment of268,786 km2 and a mean rainfall of 1510 mm, therun-off per unit of catchment is about 0.250 MCMkm¡2. Over 80% of the annual flow occurs in thethree monsoon months and, coupled with theuneven distribution of rainfall (6000 mm annuallyin the Western Ghats, 500 mm in the Western
Peneplains, 1500 mm in the Eastern Ghats, and1000 mm in the Coastal Plains), water flows canbe drastically reduced in places, e.g. 1 MCM inthe main Krishna channel at Kunchi and, at Nagar-junasagar, which normally has the highest flowduring the monsoon (31,784 MCM), dropping to amere 285 MCM during summer (CPCB, 1989;Rao, 1979).
Most Indian rivers flow through tropical andsub-tropical regions with a high potential for fresh-water fish diversity (Oberdorff et al., 1995). How-ever, a severe decline in capture fisheries of Indianrivers has been observed during the past few deca-des because of intense human intervention result-ing in habitat loss and degradation. As aconsequence, many indigenous as well as endemicfish species have become highly endangered. Themain causes behind the decline of riverine fishdiversity are: habitat destruction (Cuizhang et al.,2003), heavy siltation, water abstraction/diversionfor industries, irrigation (Szollosi-Nagy, 2004),faulty river embankment strategies for flood con-trol, anthropogenic loads, pollution (Lima-Junioret al., 2006), and construction of weirs and bar-rages obstructing migration of fish. These stresses
Figure 1. Map of the River Krishna basin (based on Molle et al., 2010).
Das et al. /Aquatic Ecosystem Health and Management 20 (2017) 160–174 161
are coupled with overexploitation and unscrupu-lous fishing practices like dynamiting/poison bait-ing, and exotic species introduction (Copp et al.,2005), which will be further worsened by globalclimate change (Leveque et al., 2005; Mas-Martiet al., 2010). The situation is aggravated by thefailure of rainfall in certain areas, especially inseasonal rivers when stream flows drop far belowthe environmental flows required for sustainablesurvival of aquatic organisms, including fish. Con-sequently, there is a need for information on thepresent status of river ecology and fisheries. Thiscould help in the development of holistic manage-ment guidelines for any Indian river to aid in sus-taining fisheries, fish, and other aquatic organisms.However, for most of the Indian rivers, informa-tion on the present status of ecology and fisheriesis grossly lacking. This article examines thelimno-chemical status of the entire stretch of theRiver Krishna and its environment in relation tofisheries. The purpose of this study is to helpunravel the present capacity of the eco-physiogra-phy of this peninsular river in order to sustain theriverine ecology as well as its fisheries.
Sampling program andmethodology
The entire stretch of the River Krishna wasdivided into two study regions—the upper stretch(Maharashtra & Karnataka) and the lower stretch(Andhra Pradesh). In the upper and lowerstretches, 15 and 10 sampling sites were selected,respectively (Table 1 and Figure 2). In addition,sampling was done in 13 important tributaries atsites upstream of the confluence point (indicatedwith the suffix T in Table 1 and Figure 2). At eachsite, sampling was done for various limnologicalparameters and assessment of phytoplankton pri-mary production. Data on fish and fisheries werealso collected. Samples were collected in threetime periods: post-monsoon (Oct–Nov, 2001);pre-monsoon, i.e. summer (S, May–June, 2002);and monsoon (M, September, 2002).
Samples of sediment and water were collectedfrom across the river in three sub-sites: (i) one kmupstream of the confluence, (ii) the second one atthe confluence and (iii) the third one at one kmbelow the confluence of any tributary with the mainRiver Krishna. If there is no tributary at the sam-pling site, limnological samplings were done from
Figure 2. Schematic diagram of the River Krishna showing the
sampling sites.
162 Das et al. /Aquatic Ecosystem Health and Management 20 (2017) 160–174

only one location in the river. All samples were col-lected at 9:00 am. Sediment samples were ran-domly collected from between five and sixlocations across the river from each sub–sector.Except for nutrient parameters, other physico-chemical features of the water were determined in
situ immediately after collection. Water sampleswere fixed with preservatives and analyzed in thelaboratory. Chemical analyses of water were per-formed following APHA (1992) Standard Method-sSoil analysis was undertaken using standardmethods described by Tandon (1993). Primary pro-duction was estimated up to one meter depth usingthe dark and light bottle technique (Vollenweider,1969) utilising an incubation period of 4 hrs (10:00to 14:00). Data related to fish and fisheries werecollected in situ, and from local markets, landingcenters, and the respective State Fishery Offices, aswell as respective Fishermen Cooperative Societiesalong the riverine course. Experimental fishing wasalso done, as required and when feasible, along theentire course of the River Krishna by project per-sonnel and the local fisher folk. Sampling was car-ried out both by day (06:00 to 10:00) and at night(18:00 to 21:00) at three sub sites of 10–50 mlength each, at almost all the sites during the studyperiod. The types of gear used to collect fishincluded cast nets, gill nets, drag nets (all with vary-ing mesh sizes), and other local improvised gear(Manna et al., 2011). Each type of gear was used atleast 10–12 times in all the sites across the river.Fish Species Richness (FSR) was determined bycounting the number of fish species encountered atleast five times at each sampling site. Representa-tive specimens (n D 10) of all fish species werefixed in 10% formaldehyde and transferred to thelaboratory for identification. Identification was per-formed following Jayaram (1981, 1999), and Tal-war and Jhingran (1991). The relative abundance(percentage of catch) of fish species by weight andby numbers across different sites was determined.
Multivariate analysis was carried out to charac-terize the environment, species community struc-ture, and their interaction. Multivariate Analysis ofVariance (MANOVA) was used to test statisticalsignificance of the seasonal variation of sedimentand water quality. The relationship between waterand sediment quality variables was examined usingCanonical Correlation Analysis (CCA). Con-strained Correspondence Analysis was performedto explore species–environment relationships.
Physical features of the RiverKrishna and its tributaries
The catchment of Mahabaleswar is coveredwith evergreen forest comprising forest-origin red
Table 1. Sampling sites in the River Krishna and its tributaries
(shown with suffix T.).
Sl.No.
Sl. No.(Tributary) Sampling stations Abbreviation
1. Dhom dam DH1. 1. Wenna T. WP2. Mahuli MH3. 2. Urmodi T. UM4. Kashal KS5. 3. Tarle T. TL6. Umbroj UJ7. 4. Koyna T. KT8. Karad KD9. 5. Yerala T. YL
10. Brahmanal BN11. 6. Varna T. VN12. Haripur HP13. 7. Pancha Ganga T. PG14. N. Vadi NV15. 8. Dud Ganga T. DG16. Kallol KL17. Jamakhandi JK18. 9. Ghatprabha T. GP19. Galgali GL20. 10. Malaprabha T. MP21. Kudalasangam KS22. 11. Bhima T. BT23. Shaktinagar SN24. 12. Tungabhadra T. TB25. Bispalli BP26. Srisailam up SU27. Srisailam Down/
LingalaghattuSD
28. Satrasala SS29. Wadapalli WP30. 13. Musi T. MT31. Taduvouy TV32. Amaravathy AV33. Thummalapalayam TP34. Choudavaram CV35. Gajullanka GL36. Amudharlanka AL37. Penumudi PM
Das et al. /Aquatic Ecosystem Health and Management 20 (2017) 160–174 163

soil. Below Wai, the river is slow, descendingdown to plains, and the width is extended wher-ever a tributary joins the Krishna. Maximumdepths were noticed at barrages and anicuts likeBrahmanal, Jamakhandi, Galgali, Kudal sangam,and Bispalli, as well as in some zones of theKrishna delta. The river is the widest downstreamof Vijayawada, at between 500 and 3,000 m, ascompared to upstream at 50 to 500 m, except atKudalsangam, where it was more than 9,000 mwide, being swollen by the Narayanpur reservoir.Most of the tributaries were narrow, having mini-mum depth particularly at confluence points. How-ever, many of the tributaries at and below theirorigin are quite deep as they pass through gorgessuch as Wenna, Urmodi, Tarle, Koyna, PanchaGanga, Ghataprabha, Malaprabha and even Tung-abhadra. The water flow in tributaries isobstructed/hindered by dams/anicuts/barrages.However, even with the low volume of waterbeing diverted into the main river, the tributariesof Krishna exert visible impacts on the sedimentand water chemistry of the main river (Manna andDas, 2004). These impacts were more pronouncedduring monsoon (Table 1). Spatiotemporal varia-tion of physical features of the river like waterdepth, flow, temperature, and transparency aredescribed below.
Depth
Depth variation in the River Krishna showed theimpact of water flow regulation by dams, barragesand anicuts. The very high water depth at DH andSU were due to water retention by the Dhom andSrisailam dams, respectively (Figure 3a). Satrasala(SS) is a gorgy deep pool located between two hil-locks (Manna et al., 2003). The higher water depthat Thummalapalem (TP) is due to water regulationby the Prakasam barrage at Vijayawada.
Flow
The impacts of human intervention were wellpronounced in the flow regime of the entire stretchof the River Krishna. Release of water fromupstream dams or local tributaries mostly con-trolled the flow pattern of the river (Figure 3b).The higher flow at Wadapalli (WP) in the lowerstretch of the river was due to the curve and slopeof the Krishna.
Water temperature
Surface water temperature increased sinusoi-dally, keeping parity with air temperature. Accord-ingly, higher water temperatures (�C) wereobserved in summer (27.0–35.2; av. 30.13), fol-lowed by monsoon (26.5–34.0; av. 29.24) andpost-monsoon (24.8–32.8; av. 27.8) in the entireriver course (Figure 3c). Higher temperaturesoccurred in the riverine sheet flow compared todeeper waters (lotic waters of downstream reser-voirs, anicuts, barrages), even in the same season.Unlike other Indian rivers, the River Krishnabasin, especially in Maharashtra and Andhra Pra-desh, is predominantly covered with black soilhaving high heat retentive capacity, which isreflected in the higher water temperatures. In gen-eral, water temperature was slightly lower than airtemperature, except at Thummalapalem (TP)where the water temperature was higher due to hotwater discharge from a nearby thermal powerstation.
Transparency
Water transparency was observed to be influ-enced by local factors. Significantly higher watertransparency, especially in the lower stretch of theRiver Krishna, may be attributed to higher regu-lated water flow from Nagarjunasagar reservoir, aswell as hindered water flow at Prakasam barrage atVijayawada. This has helped in the growth ofdense aquatic macrophytes, especially the rootedsubmerged varieties, along the shoreline of theriver (Manna et al., 2010). Those shoreline macro-phytes have a definite role in the higher transpar-ency regime, as they prevent soil erosion as wellas trap suspended silt through their leaves. Highertransparency below the Prakasam barrage (CV toPM) is due to controlled water release from thebarrage as well as the sandy bottom of this stretchof the river (Figure 3d).
Sediment characteristics of the RiverKrishna
Sediment analysis was not performed at onlyfour of the total 38 sampling stations. At SrisailamDown (SD), the river bottom is rocky and full ofboulders and pebbles, and hence no sampling forsediment was performed. Below the Prakasam
164 Das et al. /Aquatic Ecosystem Health and Management 20 (2017) 160–174

barrage at Vijayawada, the riverbed is full of sandand water is flowing through a very narrow chan-nel in the wide river bed. Due to this, no samplingwas performed for bottom sediment at Chowda-varam (CV), Gajullanka (GL), and Amudharlanka(AL). Results of selected sediment parameters ofthe remaining 34 sampling stations on the mainchannel of Krishna and its tributaries are givenbelow.
Sediment pH
Soils in the Krishna basin are red, black, later-ite, alluvium, etc. Soil pH was moderately alkalinein the range of 7.30–8.52 (av. 7.68), 6.97–8.34(av. 7.56), and 7.46–8.40 (av. 7.84) in pre-monsoon, monsoon, and post-monsoon seasonsrespectively, and increased gradually fromupstream to downstream (Figure 4a). Higher soil
pH was recorded in the Musi tributary. Lower pHat a few stations can be linked to higher organicmatter accumulation, either due to deep pools(Manna et al., 2003) or local anthropogenic input.Higher pH was observed to be associated withhigher CaCO3 content of the sediment (r D 0.58,p < 0.001).
Sediment specific conductance
Moderate values of specific conductance(mScm¡1) were also noticed in the entire rivercourse, with higher values pre-monsoon (0.15–1.96; av. 0.68) as compared to monsoon (0.142–3.77; av. 0.58) and post-monsoon (0.12–3.39; av.0.58) (Figure 4b). Higher organic accumulation atthe bottom was generally associated with higherspecific conductance (r D 0.64, p < 0.001).
Figure 3. Spatiotemporal variation of water depth, flow, temperature and transparency in the River Krishna.
Das et al. /Aquatic Ecosystem Health and Management 20 (2017) 160–174 165
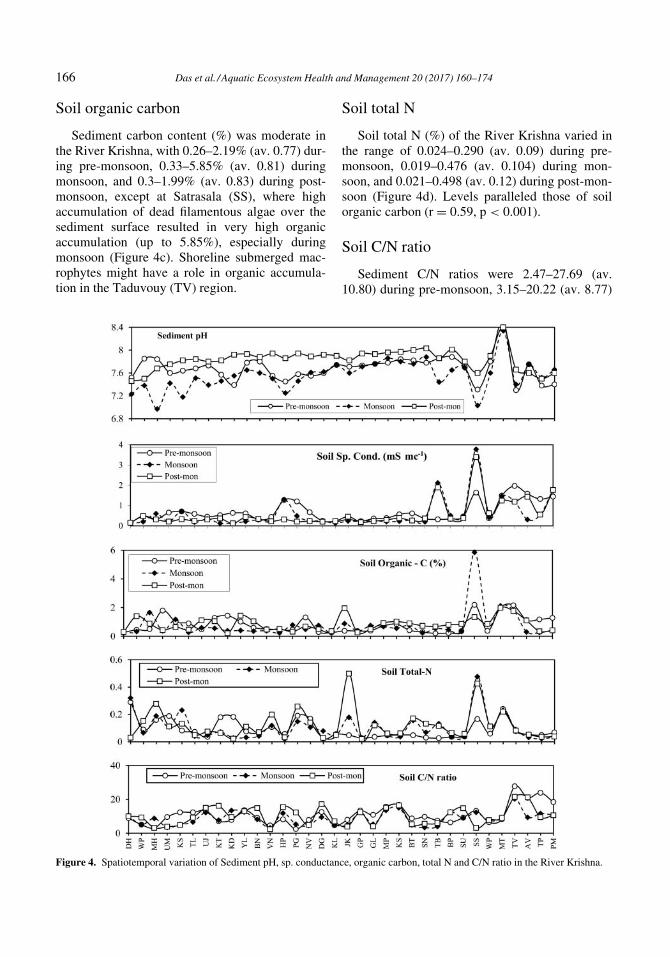
Soil organic carbon
Sediment carbon content (%) was moderate inthe River Krishna, with 0.26–2.19% (av. 0.77) dur-ing pre-monsoon, 0.33–5.85% (av. 0.81) duringmonsoon, and 0.3–1.99% (av. 0.83) during post-monsoon, except at Satrasala (SS), where highaccumulation of dead filamentous algae over thesediment surface resulted in very high organicaccumulation (up to 5.85%), especially duringmonsoon (Figure 4c). Shoreline submerged mac-rophytes might have a role in organic accumula-tion in the Taduvouy (TV) region.
Soil total N
Soil total N (%) of the River Krishna varied inthe range of 0.024–0.290 (av. 0.09) during pre-monsoon, 0.019–0.476 (av. 0.104) during mon-soon, and 0.021–0.498 (av. 0.12) during post-mon-soon (Figure 4d). Levels paralleled those of soilorganic carbon (r D 0.59, p < 0.001).
Soil C/N ratio
Sediment C/N ratios were 2.47–27.69 (av.10.80) during pre-monsoon, 3.15–20.22 (av. 8.77)
Figure 4. Spatiotemporal variation of Sediment pH, sp. conductance, organic carbon, total N and C/N ratio in the River Krishna.
166 Das et al. /Aquatic Ecosystem Health and Management 20 (2017) 160–174
during monsoon, and 2.36– 21.46 (av. 10.19) dur-ing post-monsoon (Figure 4e).
Soil available nitrogen
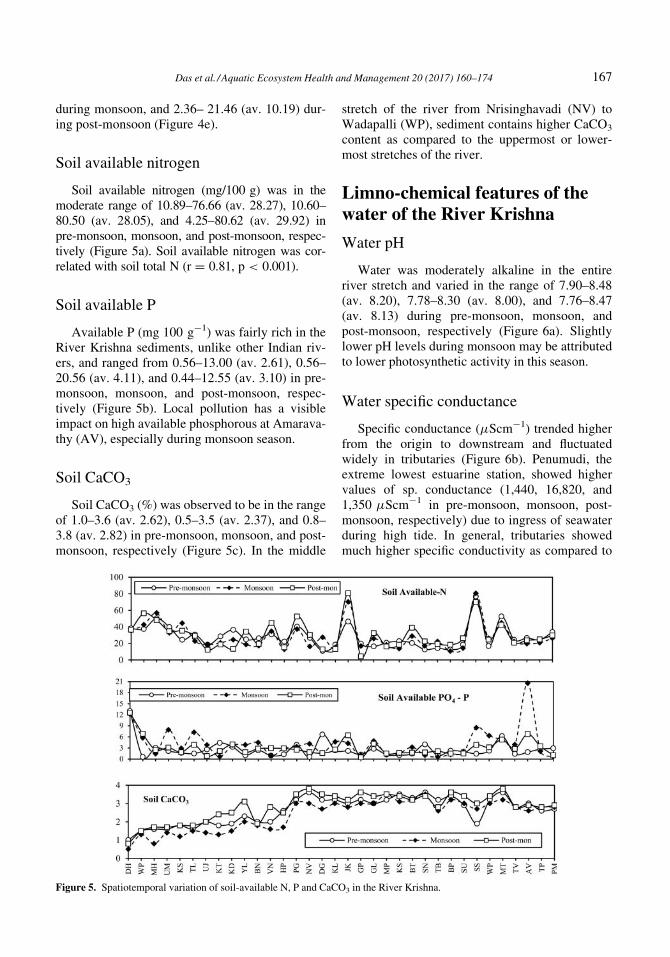
Soil available nitrogen (mg/100 g) was in themoderate range of 10.89–76.66 (av. 28.27), 10.60–80.50 (av. 28.05), and 4.25–80.62 (av. 29.92) inpre-monsoon, monsoon, and post-monsoon, respec-tively (Figure 5a). Soil available nitrogen was cor-related with soil total N (r D 0.81, p < 0.001).
Soil available P
Available P (mg 100 g¡1) was fairly rich in theRiver Krishna sediments, unlike other Indian riv-ers, and ranged from 0.56–13.00 (av. 2.61), 0.56–20.56 (av. 4.11), and 0.44–12.55 (av. 3.10) in pre-monsoon, monsoon, and post-monsoon, respec-tively (Figure 5b). Local pollution has a visibleimpact on high available phosphorous at Amarava-thy (AV), especially during monsoon season.
Soil CaCO3
Soil CaCO3 (%) was observed to be in the rangeof 1.0–3.6 (av. 2.62), 0.5–3.5 (av. 2.37), and 0.8–3.8 (av. 2.82) in pre-monsoon, monsoon, and post-monsoon, respectively (Figure 5c). In the middle
stretch of the river from Nrisinghavadi (NV) toWadapalli (WP), sediment contains higher CaCO3
content as compared to the uppermost or lower-most stretches of the river.
Limno-chemical features of thewater of the River Krishna
Water pH
Water was moderately alkaline in the entireriver stretch and varied in the range of 7.90–8.48(av. 8.20), 7.78–8.30 (av. 8.00), and 7.76–8.47(av. 8.13) during pre-monsoon, monsoon, andpost-monsoon, respectively (Figure 6a). Slightlylower pH levels during monsoon may be attributedto lower photosynthetic activity in this season.
Water specific conductance
Specific conductance (mScm¡1) trended higherfrom the origin to downstream and fluctuatedwidely in tributaries (Figure 6b). Penumudi, theextreme lowest estuarine station, showed highervalues of sp. conductance (1,440, 16,820, and1,350 mScm¡1 in pre-monsoon, monsoon, post-monsoon, respectively) due to ingress of seawaterduring high tide. In general, tributaries showedmuch higher specific conductivity as compared to
Figure 5. Spatiotemporal variation of soil-available N, P and CaCO3 in the River Krishna.
Das et al. /Aquatic Ecosystem Health and Management 20 (2017) 160–174 167

the main stream of the river, indicating nutrientloading by tributaries.
Dissolved oxygen (DO)
Amongst dissolved gases, DO was fairly rich inKrishna water at most of the sampling sites. DO(mg l¡1) varied in the range of 3.6–10.0 (av. 7.15),
4.8–10.6 (av. 6.91), and 5.2–12.4 (av. 8.11) in pre-monsoon, monsoon, and post-monsoon, respectively(Figure 6c). The lowest DO (3.6 mg l¡1) wasrecorded at Srisailam Down (SD) due to the releaseof bottom water from the dam. Higher DO duringpost-monsoon may be due to relatively lower watertemperatures, as well as higher photosyntheticactivity in relatively less disturbed waters.
Figure 6. Spatiotemporal variation of important water parameters (pH, conductivity, dissolved oxygen, total alkalinity, total hard-
ness and chloride) of the River Krishna.
168 Das et al. /Aquatic Ecosystem Health and Management 20 (2017) 160–174
Free CO2, carbonate, bicarbonate andtotal alkalinity
Free CO2 (mg l¡1) remained absent down-stream from Taduvouy (TV) onwards in all theseasons, probably due to rapid consumption bydense shoreline aquatic vegetation; in the mid-stretch, it was 1.0–3.0 year round, and Haripur(HP) showed the highest value of free CO2 (5 mgl¡1) during pre-monsoon due to local pollution.Carbonates measured nil to 36 mg l¡1 in the entireriver. Bicarbonate content (mg l¡1) fluctuated inthe range 54–232 (av. 129.3), 42–256 (av. 116.1),and 48–420 (av. 180.2) during pre-monsoon, mon-soon, and post-monsoon, respectively. Accord-ingly, total alkalinity ranged between 54–260 (av.140.5), 42–256 (av. 125.9), and 48–428 (av.189.4) during pre-monsoon, monsoon, and post-monsoon, respectively (Figure 6d). Very high totalalkalinity (428 mg l¡1) at Amaravathy (AV) dur-ing post-monsoon was due to severe local pollu-tion as a result of such as activities as washing ofclothes in the river.
Total hardness, calcium and magnesium
Total hardness (mg l¡1) ranged between 52 and288 (av. 137.7) in pre-monsoon, and 44–460 (av.187.0) in monsoon, 45–344 (av. 192.6) in post-monsoon, except for a high value of 2000 mg l¡1
at Penumudi (PM) in monsoon due to ingress ofseawater (Figure 6e). Calcium (mg l¡1) was fairlyrich in the Krishna, unlike other Indian peninsularrivers, and registered low values in pre-monsoon(9.62–46.22; av. 25.6) as compared to monsoon(9.61–91.38; av. 41.8) and post-monsoon (12.03–57.72; av. 39.7). Magnesium (mg l¡1) also wasmoderately rich and ranged from 2.90 to 56.26 inthe entire river stretch during the study period.Penumudi (PM) recorded significantly higher Caand Mg contents (625.25 mg l¡1 and 106.62 mgl¡1) in monsoon due to mixing of seawater.
Chloride
Local pollution was well pronounced in theKrishna due to influx from its tributaries, as indi-cated by higher chloride content in tributaries likeYerala (YL), Ghataprabha (GP), Malaprabha(MP), Bhima (BT), Tungabhadra (TB) and Musi(MT), as compared to chloride content in nearby
stations on the main river (Manna and Das, 2004)(Figure 6f). At times, local anthropogenic pollu-tion of the main stream also played a role in thehigher chloride content. Penumudi (PM) registeredthe highest values of chloride in all three seasons,mainly due to the impact of estuarine tidal influ-ence. Also, high local pollution at Brahmanal(BN) during monsoon was indicated by high chlo-ride content (312.4 mg l¡1).
Nutrient status of the water of theRiver Krishna
Nitrate-N
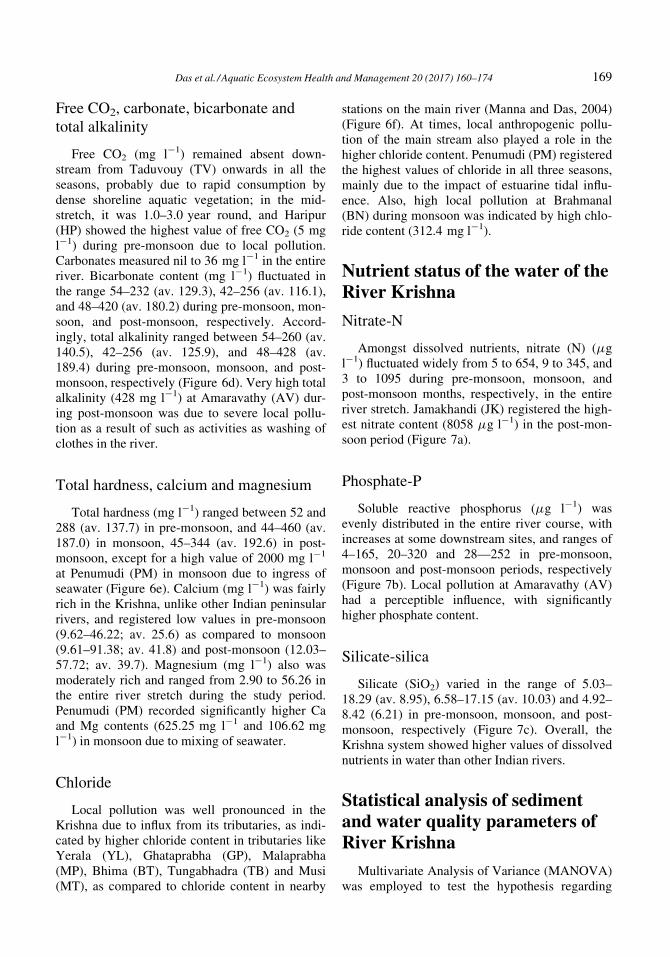
Amongst dissolved nutrients, nitrate (N) (mgl¡1) fluctuated widely from 5 to 654, 9 to 345, and3 to 1095 during pre-monsoon, monsoon, andpost-monsoon months, respectively, in the entireriver stretch. Jamakhandi (JK) registered the high-est nitrate content (8058 mg l¡1) in the post-mon-soon period (Figure 7a).
Phosphate-P
Soluble reactive phosphorus (mg l¡1) wasevenly distributed in the entire river course, withincreases at some downstream sites, and ranges of4–165, 20–320 and 28—252 in pre-monsoon,monsoon and post-monsoon periods, respectively(Figure 7b). Local pollution at Amaravathy (AV)had a perceptible influence, with significantlyhigher phosphate content.
Silicate-silica
Silicate (SiO2) varied in the range of 5.03–18.29 (av. 8.95), 6.58–17.15 (av. 10.03) and 4.92–8.42 (6.21) in pre-monsoon, monsoon, and post-monsoon, respectively (Figure 7c). Overall, theKrishna system showed higher values of dissolvednutrients in water than other Indian rivers.
Statistical analysis of sedimentand water quality parameters ofRiver Krishna
Multivariate Analysis of Variance (MANOVA)was employed to test the hypothesis regarding
Das et al. /Aquatic Ecosystem Health and Management 20 (2017) 160–174 169
seasonal variation of water and sediment qualityparameters. For both water and sediment parame-ters, four test statistics—Wilks’ Lambda, Pillai’sTrace, Hotelling–Lawley Trace and Roy’s Great-est Root—were found to be statistically significant(p-value < 0.001) for sediment quality parameters.Seasonal variation of individual parameters wereanalysed under one-way ANOVA. It indicated thatexcepting specific conductivity of water qualityand available P of sediment quality, all otherparameters were significantly different during dif-ferent seasons. The boxplot showed that tempera-ture and transparency significantly differ fromsummer months to those in the monsoon and post-monsoon seasons. Similarly, DO and TA are sig-nificantly higher in the post-monsoon season thanduring monsoon and summer. Apart from avail-able P, all other parameters of sediment qualitydiffer significantly between the post-monsoon sea-son and the other two seasons.
Association between water qualityand sediment quality parameters
Canonical Correlation Analysis was carried outfor characterizing the association between water
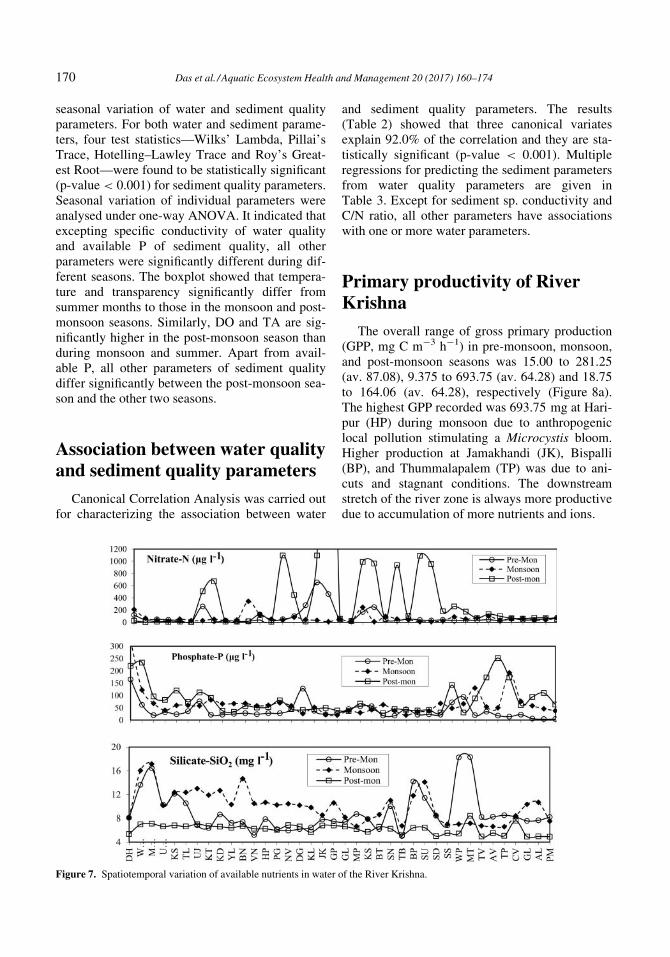
and sediment quality parameters. The results(Table 2) showed that three canonical variatesexplain 92.0% of the correlation and they are sta-tistically significant (p-value < 0.001). Multipleregressions for predicting the sediment parametersfrom water quality parameters are given inTable 3. Except for sediment sp. conductivity andC/N ratio, all other parameters have associationswith one or more water parameters.
Primary productivity of RiverKrishna
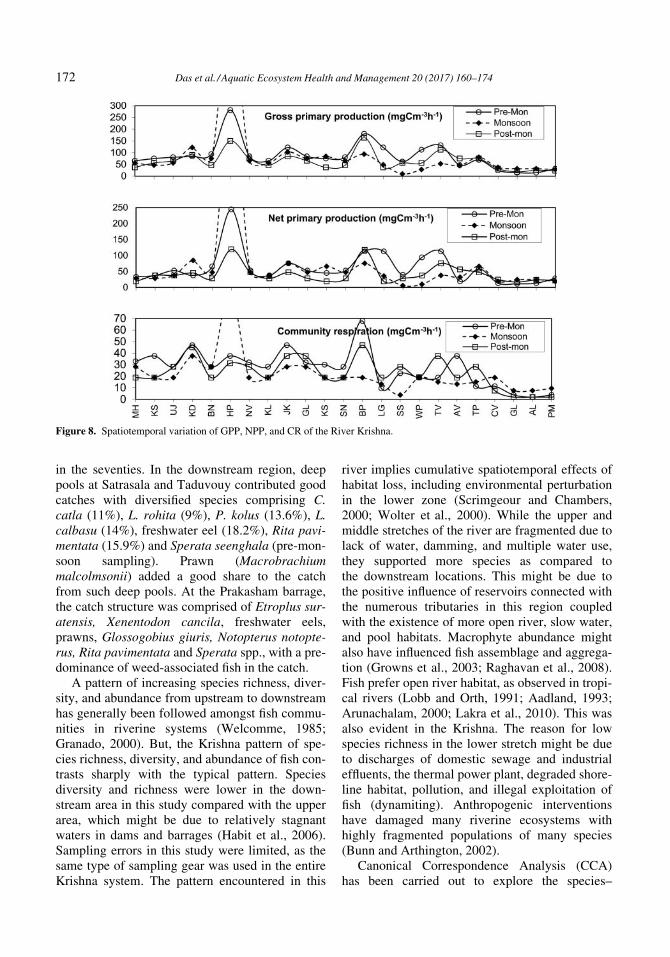
The overall range of gross primary production(GPP, mg C m¡3 h¡1) in pre-monsoon, monsoon,and post-monsoon seasons was 15.00 to 281.25(av. 87.08), 9.375 to 693.75 (av. 64.28) and 18.75to 164.06 (av. 64.28), respectively (Figure 8a).The highest GPP recorded was 693.75 mg at Hari-pur (HP) during monsoon due to anthropogeniclocal pollution stimulating a Microcystis bloom.Higher production at Jamakhandi (JK), Bispalli(BP), and Thummalapalem (TP) was due to ani-cuts and stagnant conditions. The downstreamstretch of the river zone is always more productivedue to accumulation of more nutrients and ions.
Figure 7. Spatiotemporal variation of available nutrients in water of the River Krishna.
170 Das et al. /Aquatic Ecosystem Health and Management 20 (2017) 160–174
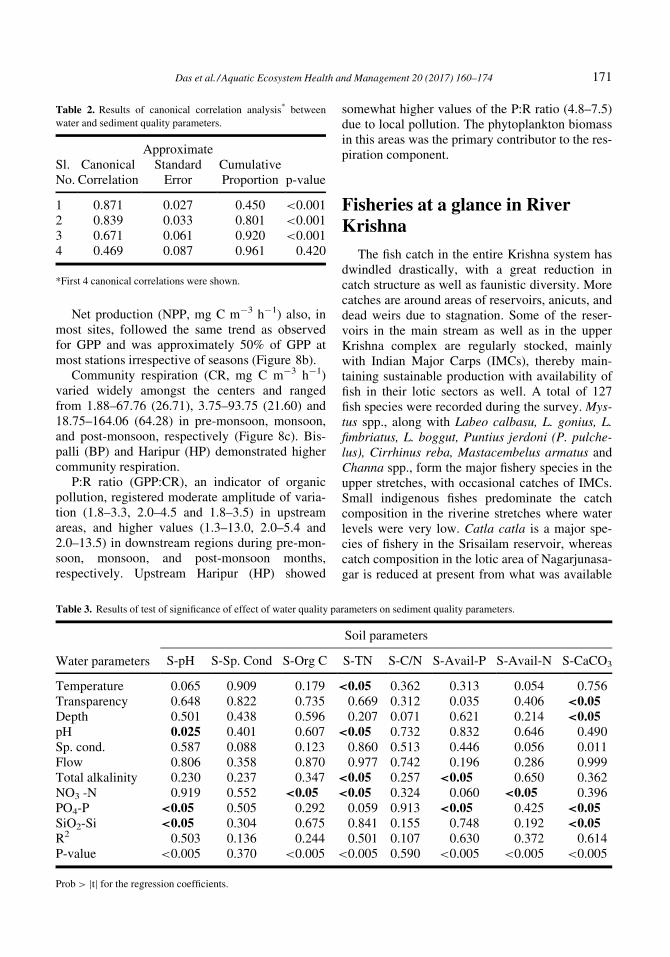
Net production (NPP, mg C m¡3 h¡1) also, inmost sites, followed the same trend as observedfor GPP and was approximately 50% of GPP atmost stations irrespective of seasons (Figure 8b).
Community respiration (CR, mg C m¡3 h¡1)varied widely amongst the centers and rangedfrom 1.88–67.76 (26.71), 3.75–93.75 (21.60) and18.75–164.06 (64.28) in pre-monsoon, monsoon,and post-monsoon, respectively (Figure 8c). Bis-palli (BP) and Haripur (HP) demonstrated highercommunity respiration.
P:R ratio (GPP:CR), an indicator of organicpollution, registered moderate amplitude of varia-tion (1.8–3.3, 2.0–4.5 and 1.8–3.5) in upstreamareas, and higher values (1.3–13.0, 2.0–5.4 and2.0–13.5) in downstream regions during pre-mon-soon, monsoon, and post-monsoon months,respectively. Upstream Haripur (HP) showed
somewhat higher values of the P:R ratio (4.8–7.5)due to local pollution. The phytoplankton biomassin this areas was the primary contributor to the res-piration component.
Fisheries at a glance in RiverKrishna
The fish catch in the entire Krishna system hasdwindled drastically, with a great reduction incatch structure as well as faunistic diversity. Morecatches are around areas of reservoirs, anicuts, anddead weirs due to stagnation. Some of the reser-voirs in the main stream as well as in the upperKrishna complex are regularly stocked, mainlywith Indian Major Carps (IMCs), thereby main-taining sustainable production with availability offish in their lotic sectors as well. A total of 127fish species were recorded during the survey. Mys-tus spp., along with Labeo calbasu, L. gonius, L.fimbriatus, L. boggut, Puntius jerdoni (P. pulche-lus), Cirrhinus reba, Mastacembelus armatus andChanna spp., form the major fishery species in theupper stretches, with occasional catches of IMCs.Small indigenous fishes predominate the catchcomposition in the riverine stretches where waterlevels were very low. Catla catla is a major spe-cies of fishery in the Srisailam reservoir, whereascatch composition in the lotic area of Nagarjunasa-gar is reduced at present from what was available
Table 2. Results of canonical correlation analysis* between
water and sediment quality parameters.
Sl.No.
CanonicalCorrelation
ApproximateStandardError
CumulativeProportion p-value
1 0.871 0.027 0.450 <0.0012 0.839 0.033 0.801 <0.0013 0.671 0.061 0.920 <0.0014 0.469 0.087 0.961 0.420
*First 4 canonical correlations were shown.
Table 3. Results of test of significance of effect of water quality parameters on sediment quality parameters.
Water parameters
Soil parameters
S-pH S-Sp. Cond S-Org C S-TN S-C/N S-Avail-P S-Avail-N S-CaCO3
Temperature 0.065 0.909 0.179 <0.05 0.362 0.313 0.054 0.756Transparency 0.648 0.822 0.735 0.669 0.312 0.035 0.406 <0.05Depth 0.501 0.438 0.596 0.207 0.071 0.621 0.214 <0.05pH 0.025 0.401 0.607 <0.05 0.732 0.832 0.646 0.490Sp. cond. 0.587 0.088 0.123 0.860 0.513 0.446 0.056 0.011Flow 0.806 0.358 0.870 0.977 0.742 0.196 0.286 0.999Total alkalinity 0.230 0.237 0.347 <0.05 0.257 <0.05 0.650 0.362NO3 -N 0.919 0.552 <0.05 <0.05 0.324 0.060 <0.05 0.396PO4-P <0.05 0.505 0.292 0.059 0.913 <0.05 0.425 <0.05SiO2-Si <0.05 0.304 0.675 0.841 0.155 0.748 0.192 <0.05R2 0.503 0.136 0.244 0.501 0.107 0.630 0.372 0.614P-value <0.005 0.370 <0.005 <0.005 0.590 <0.005 <0.005 <0.005
Prob > jtj for the regression coefficients.
Das et al. /Aquatic Ecosystem Health and Management 20 (2017) 160–174 171
in the seventies. In the downstream region, deeppools at Satrasala and Taduvouy contributed goodcatches with diversified species comprising C.catla (11%), L. rohita (9%), P. kolus (13.6%), L.calbasu (14%), freshwater eel (18.2%), Rita pavi-mentata (15.9%) and Sperata seenghala (pre-mon-soon sampling). Prawn (Macrobrachiummalcolmsonii) added a good share to the catchfrom such deep pools. At the Prakasham barrage,the catch structure was comprised of Etroplus sur-atensis, Xenentodon cancila, freshwater eels,prawns, Glossogobius giuris, Notopterus notopte-rus, Rita pavimentata and Sperata spp., with a pre-dominance of weed-associated fish in the catch.
A pattern of increasing species richness, diver-sity, and abundance from upstream to downstreamhas generally been followed amongst fish commu-nities in riverine systems (Welcomme, 1985;Granado, 2000). But, the Krishna pattern of spe-cies richness, diversity, and abundance of fish con-trasts sharply with the typical pattern. Speciesdiversity and richness were lower in the down-stream area in this study compared with the upperarea, which might be due to relatively stagnantwaters in dams and barrages (Habit et al., 2006).Sampling errors in this study were limited, as thesame type of sampling gear was used in the entireKrishna system. The pattern encountered in this
river implies cumulative spatiotemporal effects ofhabitat loss, including environmental perturbationin the lower zone (Scrimgeour and Chambers,2000; Wolter et al., 2000). While the upper andmiddle stretches of the river are fragmented due tolack of water, damming, and multiple water use,they supported more species as compared tothe downstream locations. This might be due tothe positive influence of reservoirs connected withthe numerous tributaries in this region coupledwith the existence of more open river, slow water,and pool habitats. Macrophyte abundance mightalso have influenced fish assemblage and aggrega-tion (Growns et al., 2003; Raghavan et al., 2008).Fish prefer open river habitat, as observed in tropi-cal rivers (Lobb and Orth, 1991; Aadland, 1993;Arunachalam, 2000; Lakra et al., 2010). This wasalso evident in the Krishna. The reason for lowspecies richness in the lower stretch might be dueto discharges of domestic sewage and industrialeffluents, the thermal power plant, degraded shore-line habitat, pollution, and illegal exploitation offish (dynamiting). Anthropogenic interventionshave damaged many riverine ecosystems withhighly fragmented populations of many species(Bunn and Arthington, 2002).
Canonical Correspondence Analysis (CCA)has been carried out to explore the species–
Figure 8. Spatiotemporal variation of GPP, NPP, and CR of the River Krishna.
172 Das et al. /Aquatic Ecosystem Health and Management 20 (2017) 160–174

environment relationship. Nine water qualityparameters, namely water temperature, transpar-ency, water depth, pH, sp. conductivity, total alka-linity, PO4-P, NO3-N, and SiO3
2¡-SiO2 wereincluded to carry out CCA. There was no multi-colinearity among the parameters, as the varianceinflation factor for each of the parameters wasbelow 3. The 56 axes of CCA explained 70.9% ofspecies variation and 9 axes explained 29.1% ofspecies variability due to environmental variables.It was found that water temperature, depth, and sp.conductivity are the statistically significant param-eters for explaining species community structurein the study area. The biplots for site and environ-ment, as well as species and environment, areshown in Figure 9. Conductivity and temperatureare relatively higher at Penumudi (PM) than othersites. This might be due to tidal saline water influ-ence from time to time.
Conclusions
In general, most of the species were structuredaround the center of the biplot, indicating their dis-tribution and abundance are indifferent from theavailable range of water quality (Figure 9). Thenegative quadrant of CCA1 has a relatively highergradient of temperature and depth. It could be con-cluded that species assemblages are relativelymore affected by temperature and depth than byother water quality parameters. There are specieslike Butis butis, Chanos chanos, Caranx ignobilis,
Drepane punctata, Garra filamentosus, Tenualosailisha, Hilsa kelee, Leiognathus equuals, Lutjanusargentimaculatus, Lutjanus quinquelineatus, Lut-janus johnii, Liza parsia, Mugil cephalus, Platyce-phalus indicus, Pampus argenteus, Rhabdosargussarba, Rastelliger kanagurta, Sillago sihama,Sphyraena obtusata, Scomber microlepidotus, Tri-chiurus savala and Velamugil cunnesius, whoseassemblage are structured towards high conductiv-ity and water temperature as compared to otherspecies. Penumudi (PM) formed a separate group,with estuarine and marine fishes which migratedup to this sampling station.
ReferencesAadland, L. P., 1993. Stream habitat types: their fish assemb-
lages and relationship to flow. North Am. J. Fish Manage.
13, 790–806.
APHA, 1992. Standards methods for water and waste water
analysis. Amer Public Health Assn., New York.
Arunachalam, M., 2000. Assemblage structure of stream
fishes in the Western Ghats (India). Hydrobiologia 430
(1-3), 1–31.
Bunn, S. E., Arthington, A. H., 2002. Basic principles and eco-
logical consequences of altered flow regimes for aquatic
biodiversity. Environ. Manage. 30(4), 492–507.
Copp, G. H., Bianci Bogutskaya, N. G., Eros, T., Falka, I.,
Ferreira, M. T., Fox, M. G., Freyhof, J., Gozlan, R. E.,
Grabowska, J., Kovac, V., Moreno- Amich, R., Naseka, A.
M., Wiesner, C., 2005. To be, or not to be, a non-native
freshwater fish? Appl. Ichthyol. 21, 242–262.
CPCB, 1989. Basin sub-basin inventory of water pollution: The
Krishna basin. Central Pollution Control Board, Delhi.
ADSORBS/21/89-90.
Figure 9. Biplot of CCA analysis for species and water quality parameters. Left panel indicates site-specific environmental gradi-
ent and right panel indicates species-specific environmental gradient.
Das et al. /Aquatic Ecosystem Health and Management 20 (2017) 160–174 173

Cuizhang, F., Jihua, W., Jiakuan, C., Qianhong, W.,
Guangchun, L., 2003. Freshwater fish biodiversity in the
Yangtze river basin of China: patterns, threats and conser-
vation. Biodivers. Conserv. 12, 1649–1685.
Granado, C., 2000. Ecologia de communidades el paradigma de
los pecces de agua dulce. (Ecology of communities and par-
adigm of freshwater fish. In Spanish). Universidad de Sev-
illa Secretariado de Publicaciones, Sevilla.
Growns, I., Gehrke, P. C., Astles, K. L., Pollard, D. A., 2003. A
comparison of fish assemblage associated with different
riparian vegetation types in the Hawksbury-Epan River sys-
tem. Fish. Manag. Ecol. 10, 209–220.
Habit, E., Belk, M. C., Tuckfield, R. C., Parra, O., 2006.
Response of the fish community to human-induced changes
in the Biobio River in Chile. Freshw. Biol. 51, 1–11.
Jayaram, K. C., 1981. Fresh water fishes of India—hand book.
Zoological Survey of India, Calcutta.
Jayaram, K. C., 1999. The freshwater fishes of the Indian region.
Narendra Publ. House, New Delhi.
Lakra, W. S., Sarkar, U. K., Kumar, R. S., Pandey, A., Dubey,
V. K., 2010. Fish biodiversity, habitat ecology and their
conservation and management issues of a tropical River in
Ganga basin, India. Environmentalist 30(4), 306–319.
Leveque, C., Balian, E. V., Martens, K., 2005. An assessment
of animal species diversity in continental waters. Hydrobio-
logia 542, 32–67.
Lima-Junior, S. E., Cardone, I. B., Goitein, R., 2006. Fish
assemblage structure and aquatic pollution in a Brazilian
stream: some limitations of diversity indices and models for
environmental impact studies. Ecol. Freshw. Fish. 15(3),
284–290.
Lobb, M. D., Orth, D. J., 1991. Habitat use by an assemblage of
fish in a large warm water stream. Trans. Am. Fish. Soc.
120, 65–78.
Manna, R. K., Das, A. K., 2004. Impact of the river Moosi on
River Krishna. I. Limno-chemistry. Pollution Research 23
(1), 117–124.
Manna, R. K., Krishna Rao, D. S., Das, A. K., Singh, D. N.,
2003. Deep pools in lower Krishna - ecological hotspots to be
conserved. Journal of Nature conservators 15(2), 285–293.
Manna, R. K., Mitra, Krishna, Krishna Rao, D. S., Das, A. K.,
Karthikeyan, M., Singh, D. N., 2010. Macrophyte-associ-
ated fishes and macroinvertebrates in lower stretch of River
Krishna with a note on physico-chemical environment of
water and sediment. In: G.K. Vinci, S.K. Manna, V.R.
Suresh, K. Mitra, N.P. Shrivastava, K.K. Vass, A.P.
Sharma, (Eds.), The Eighth Indian Fisheries Forum Pro-
ceedings, pp. 54–69. IFSI, Barrackpore Publication,
Barrackpore.
Manna, R. K., Das, A. K., Krishna Rao, D. S., Karthikeyan, M.
& Singh, D. N., 2011. Fishing crafts and gear in River
Krishna. Indian Journal of Traditional Knowledge 10(3),
491–497.
Mas-Marti, E., Garcia-Berthou, E., Sabater, S., Tomanova,
S., Monoz, I., 2010. Comparing fish assemblages and
trophic ecology of permanent and intermittent
researches in a Mediterranean stream. Hydrobiologia
657, 167–180.
Molle, F., Wester, P., Hirsch, P., 2010. River basin closer: Pro-
cesses, implication, and responses. Agriculture water man-
agement 97(4), 569–577.
Oberdorff, T., Gu�egan, J. -F., Hugueny, B., 1995. Global scalepatterns of fish species richness in rivers. Ecography 18(4),
345–352.
Raghavan, R., Prasad, G., Anvar-Ali, P. H., Pereira, B., 2008.
Exotic fish species in a global biodiversity hot spot: obser-
vations from River Chalakudy, part of Western Ghats, Ker-
ala, India. Biol. Inv. 10, 37–40.
Rao, K. L., 1979. India’s water wealth – its assessment, uses
and projections. Orient Longman, Delhi.
Scrimgeour, G., Chambers, P., 2000. Cumulative effects of pulp
mill and municipal effluents on the epilithic biomass and
nutrient limitation in a large northern river ecosystem. Can.
J. Fish. Aquat. Sci. 57, 1342–1354.
Szollosi-Nagy, A., 2004. In: Proceedings of the United Nations
seminar, 2004 November 25–26, Delft, Netherlands.
Talwar, P. K., Jhingran, A., 1991. Inland fishes of India and
adjacent countries, 2 volumes. Oxford and IBH Publishing
Co. Pvt. Ltd., New Delhi.
Tandon, H. L. S., 1993. Methods of Analysis of Soils, Plants,
Water and Fertilizers. Fertilizer Development and Consul-
tation Organization, New Delhi, India.
Vollenweider, R. A., 1969. A Manual of Method for Measuring
Primary Production in Aquatic Environments. IBP Hand-
book No.12. Blackwell Scientific Publications, Oxford and
Edinburgh.
Welcomme, R. L., 1985. River fisheries. FAO Fisheries Techni-
cal Paper 262.
Wolter, C., Minow, J., Vilcinskas, A., Grosch, U., 2000. Long-
term effects of human influence on fish community struc-
ture and fisheries in Berlin water: an urban water system.
Fish. Manag. Ecol. 7, 97–104.
174 Das et al. /Aquatic Ecosystem Health and Management 20 (2017) 160–174