Embed Size (px)
Citation preview

RIVERINE HEALTH AND IMPACT ONFISHERIES IN INDIA
'Wli~ICAR
Central Inland Fisheries Research Institute(Indian Council of Agricultural Research)
Barrackpore, KolkataIndia ...700 120

Edited by
Citation
ISSN.097 -616X.
©2007
Publishe by
Printed a
Dr. K.K.VassDirector, CIFRI.
Das, M. K., Samanta, S. & Saha, P. K. 2007. RiverineHealth and Impact on Fisheries in India. Policy PaperNo. 01, Central Inland Fisheries Research Institute,
Barrackpore, Kolkata. 120.
The Director, CIFRI, Barrackpore
Florence Offset Process Pvt. Ltd.6A, S.N. Banerjee RoadKolkata 700013

Policy Paper No. 01
byManas Kr. Das
S. Samantaand
P. K. Saha
RI ERINE HEALTH AND IMPACT ONFISHERIES IN INDIA
¥I{flI'JI'l.!JICAR
Central Inland Fisheries Research InstituteBarrackpore. Kolkata-120

er Systems and Fishery potential2. En ironmental concerns and conservation3. So rces of Riverine Degradation4. De iled Case Studies (Ganga River System)
.1 General features
.2 Water and nutrient quality
.3 Pesticide residue status in water, sediment and fish
.4 Heavy metals in water, sediment and fish5. C mparative Contamination of Inland Waters
.1 Metal contamination
.2 Pesticide contamination6. Im act of Stressed Environment
.1 Hydraulics
.1.1 Salinity
.1.2 Siltation
.1.3 Recruitment
.2 Dams and Fish passes
.3 Contamination
.3.1 Water quality
.3.2 Toxicants
.3.3 Biomagnification7. Ex sting Policy support
.1 Policy Framework
.2 Legal Framework
.3 Institutional Framework
.4 Are the interests of fisheries coveredin the above policies
8. Re ommendation9. Re erences
11399
101012151515191919202021222223242525303031
3334

Of
1. Ri er Systems and Fishery potential
Th re are 14 major rivers in India (Ganga, Brahmaputra, Brahmani, Cauvery,Goda 'ari, Indus, Krishna, Mahanadi, Mahi, Narmada, Periyar, Sabarmati,Subar iarekha, Tapti) covering 83% of the drainage basin and account for 85%of the surface flow. Brahmaputra, Ganga, Indus and Godavari basin covermore lhen 50% of the country's surface flow. Apart from this there are 44mediu 11 and 55 minor rivers which mostly originate from the coastal mountains.Only out of 14 major rivers are perennial. These are Brahmaputra, Ganga,Maha adi and Brahmani. The Cauvery, Mahi, Sabarmati and Periyar passesthrough low rainfall areas. The major rivers with a catchment area of morethan 1 ) M.ha each are the Indus (32.1 M.ha), Godavari (31.3 M.ha), Krishna(25.9 .ha) and the Mahanadi (14.2 M.ha). The total catchment area of mediumrivers s about 25 M.ha and Subarnarekha with a 1.9 M.ha catchment area, isthe Iarzest river amongst the medium rivers in the country.( IINC,2004)
Th diverse river system in India harbour one of the richest fish geneticresour res in the world. The gangetic system alone harbours around 265 speciesof fisH. The Brahmaputra system126 species and the peninsular rivers arereportd to bear around 76 fish species. Rivers exhibit a complex mix ofartisanal, subsistence and traditional fisheries with a highly dispersed andunorg: nized marketing system making collection of regular data on fish yielddifficu t. Based on the data on fish yield collected by CIFRI the average fishprodu tion from these riverine resources in India is only 300g/km.
Th catch statistics over the years indicate some disturbing trends in theriverin 3 sector; the biologically and economically desirable species the Indianmajor arps is being replaced by low value miscellaneous fish species, thetotal a erage fish landing in the Ganga River system declined from 85.21tones luring 1959 to 62.48 tones during 2004 Similarly the fish spawnavailability ofIMC has also declined drastically. (Jhingran 1991; Fish StatisticsFAO 1958-76; Handbook of Fisheries Statistics, Govt. of India 1981-2000,Das, 2 07)
2. Env ronmental concerns and conservation
Rap d urbanization, industrialization, and intensification of agriculture haveall affe cted the rivers in different ways in India. Most Indian rivers, at present,are hi hly regulated (Agrawal and Chak 1991).Hundreds of multi-purpose

reservoirs for water supply, irrigation, hydropower and fisheries have beenonstructed, as well as numerous barrages for water diversion. Manyoodplains have been cut out from rivers by embankments and the remaining
r pari an lands are under intensive agriculture and grazing pressure. Humans ettlements, deforestation, mining and other activities have degraded the riverc tchments and increased sediment loads of all rivers. Also, during the pastf ,w decades, rivers have received increasingly large discharges of industriale fluents, fertilizers and pesticides from agricultural practices and domestic
astes (CPCB 1996). All this affected riverine biota. Fish species compositionhhs changed and many species have nearly disappeared. It is pertinent to
ention that out of the 30 world river basins marked as global level prioritiesf r the protection of aquatic biodiversity by Groombridge and Jenkins (1998),nine are from India. These basins include Cauvery, Ganges-Brahmaputra,G davari, Indus, Krishna, Mahanadi, Narmada, Pennar and Tapi.
Conservation and restoration of rivers have become vital for the overalls stainable development of the country. However, until recently, this" onservation" has been limited to "cleaning" of rivers by treatment ofw11stewater, occassional symbolic removal of garbage and enforcing thetr .atrnent of industrial effluents (Gopal and Chauhan 2003). For theconservation and restoration of river Ganga the Central Ganga Authorityre iesignated as the National River Conservation Directorate (NRCD) wases ablished in 1985. NRCD coordinates the implementation of the Schemesun er the Ganga and other Action Plans. The main objective of the GangaA tion Plan was to improve the river water quality to the 'Bathing Class'.A cording to the CPCB survey report, the total municipal sewage generatedin he identified 25 towns in 1985 was of the order of 1340 million litres perda (mId). Out of this, works corresponding to 873 mld were taken up underth first phase of GAP The Action Plan primarily addressed to the interceptionan I diversion for treatment of the targeted municipal sewage of 873 mId.Sc emes for the abatement of pollution from grossly polluting industries hasbe n monitored and controlled under the existing Environmental Laws. Withthe completion of 256 schemes, the water quality of Ganga has shownim rovement over the pre-GAP period quality in terms of both the bio-chemicalox gen demand (BOD) and dissolved oxygen, the two important parametersto assess the river water quality. To arrest river pollution in Yamuna, certain

measu 'es of cleanin river have been taken by the Ministry of Environmentand F rests of the Government of India in 12 towns of Haryana, 8 towns ofUttar Pradesh, and Delhi under Yamuna Action Plan which is beingimple: rented since 1993 by NRCD. Under Gomti river Action Plan pollutionabater ent works are being taken up along the Gomti river in Lucknow,
,
Sultan our and Jaunpur in Uttar Pradesh. About 269 mld of sewage is targetedto be i tercepted, diverted and treated under this action plan.
,
So ar, these efforts have indicated localised improvements. Overall, therehas be 'n limited appreciation of the nature of rivers as ecosystems whoseecological integrity depends upon their physical, chemical, biologicalcharacteristics and interactions with their catchment. The evaluation of theconditit n of rivers and lakes relative to their original or desired state is essentialto cons rvation and rehabilitation. With the outlook for fisheries shifting fromincreas ing yield to increasing profitability the approach for fisheriesdevelo ment is to ensure sustainability and reduce environmental impacts.(Ayya pan et al, 2007). Thus knowledge of the relative state of any water-body is essential in negotiations with other users of the resource.
3. Sou ces of Riverine Degradation
Don estic waste Domestic and municipal effluents are estimated to constitute75% 0 'India's wastewater by volume (Ministry of Environment & Forest,1992). "'[he enormity of sewage pollution is reflected in the river Ganga inwhich aore than 70% of the total pollutionalload is contributed by the sewage(Chaud .rury, 1985). Municipal sewage is very often accompanied by tradewaste synthetic detergents, heavy metals and (MBAS) from small scaleindustri s sprawling around thickly urban areas.
The CP, B systematically collects data on industrial waste water and domesticwaste ater generation from big cities.
----~-----------~-----------------
Total (299)
Non-M ajor basin Noncoastal (37)
Coastal (29)
Tapi (8)
Subarnarckha (2)
Sabarmati (7)
Pen na r (6)
Narmada (4)
M ahi (3)
Basin-wise wastewater generation in class I cities
M ah anadi (9)
Krishna (27)
Indus (IS)
Godavari (25)
Ganga (103)
Cauvery(I6)
Brahmaputra (7)
Brahmani (I)
4037.2 I !i 11938.216270.
~391
, ! ;
i I
52ioi ..• I
i=i!;89.1858.0S
4329.8
1019
~'218.3S274.85 I
1S =WTC~'210 mPWC280
~~11
[]]VWC2532.4 tSlVWD
614.9
121243.760.7
S122.243.36
8116121.8140.6
-8618
~:32 1.86412.88
li,· 'T>'93.8S3
~36~:.62
8S.' r1.~4,67.76
l;~818'9435 I. t
764.02
~/96.1
~.• 71.48
701.9
S191.92178.88
B1317.3
o 2000 4000 6000 8000 10000 12000 14000 16000 18000
MLD
Fig. 1Source: CPCB (2000)

000 r------5764.02----------------------------------------------------1
soo .~-----~III-------------------------------~I
000 1-- - --.-.---.-....------.--.--.---.---..-- ._.__0. " •. --.---.----- ••••• -.--~-.--- ..•.. --.-
500 1------------- ------------- ------------------------------------------------it==== mDomcstic (mid) I:::+_______ ,,'nOO,";" (m'd) I
SOO - '1 M i000- --~----------- ~-- !
O .• -----0'\--- _~_M ------:
:0: 1_ - :, -.~.- ~-~-lm~~- ~--~- 0 ~ Isoo J~-~--l--f~~~Jill§=rfb-~~t~~lt--i~~Jo °2 ~ ;0.. c: ~ ~ ~ :.a .c0- ~ s.. I 0":: ~.!:: •... I:>'() eo: :: c: eo: "0 0: eo: .c c.
eo: :: ~ c: ~ "0 .c c: 0: eo: c: E ~ eo:..§ ~ 5 ~ .g .s ·E ~ ~ E ~ •... t ~0: E U <3 ~ eo: ~ ~ .,g ~.t: .c ~ e: eo: ••••
- eo: ~ eo:•... .cQ:l ::
Fig. 2 ~Source: CPCB (2000)
Indus rial waste: About 35.30% of the over 3 million small-scale industrialunits SSIU s) are of polluting nature. In case of large water polluting industrialunits ischarging effluents into the rivers and lakes, only 29% have adequateefflue t treatment plants (Ministry of Environment & Forests, 1997). CPCBhas i fntified 17 categories as highly polluting industries for priority actionlike su ar sector followed by pharmaceutical, distillery, cement and fertilizer.
Ac ording to the 1996 figures, 229 class I cities in India generate about1666 MLD of waste water whereas the capacity to treat only 4037 MLDexists 345 Class II towns generate about 1650 MLD of waste water whereascapac ty to treat only 61.5 MLD exists, (CPCB, 2000). Estimates for the wastewater enerated by the rural households are not available. The current practices
299 c ass one cities in India generate about 1.66 million MLD of wastewater,wher as capacity to treat only 4037 MLD exists in these cities. CPCB (2000).The b sin wise waste water scenario of class one cities are given in Fig. 1 & 2.
Basinwise wastewater generation from class I cities

1·r-i====·======9=====~~~~===================~~=============-------~.
ad pted for disposal of industrial wastewater includes discharge into publicse ers, rivers, reservoirs or seas through creeks and estuaries with little or notret tment.
gricultural runoff: Agricultural activities are one of the important causesof environmental degradations. The problem of water pollution becomes morese ere as the magnitude of agricultural runoff is very vast .The fertilizer(N P?O_+K?O) consumption in India has increased from 7.7 million tonnes in
-) -19 4 to 17.54 million tonnes in 2000-01 (Ministry of Chemicals & Fertilizers,20 )3). Use of pesticides also increased from 24,305 tonnes in 1971 to 61,357to nes in 1994-95. The pesticide use however, decreased to 47,020 tonnes in20 1. It is interesting to note that only 25-30% of total cultivated area is underpe ticide cover. Yet the pesticides and their residues have polluted agriculturalpr duce and different components of environment. This is mainly due toim oroper handling, wrong use schedule, non-awareness about chemicals andth ir residue behaviour.
Water abstraction: The projected water requirement of India for irrigationan I other uses from the different watercourse as estimated during 2025 isap roximately 1100 billion cubic meter (Sunderesan, 1982). According to theMi istry of Water Resources (MoWR) 80% of India's utilizable water isde oted to agriculture in the form of irrigation. Demand for domestic sectorha remained low and accounts for only 5% of the annual fresh waterwi hdrawals in India. According to MoWR, industrial water use in India standsat bout 40 billion cubic meters or nearly 6% of the total fresh water abstraction.Ac ording to Central Pollution Control Board (CPCB), in 2000, India's annualfre hwater withdrawals were about 500 billion cubic metre and the Indianin ustry consumed about 10 billion cubic meter of water as process water and30 illion cubic meter as cooling water. This accounts for 8% consumption byth industry. The large scale abstraction alters the water quality by reducingthe load bearing capacity of down stream water. Although water abstractedfOI the various needs are drained back into the water system, but it isco taminated by a variety of substances detrimental to aquatic life. The dams,bar ages, rivers and other hydraulic structures constructed on riverine ecosystemdis urb the river continuity. The discharge downstream is reduced leading toha itat destruction both downstream and upstream. The migratory pathwaysof ishes are obstructed. As flood control measures various forms of rivertra ning viz. guide, banks, spruce and river revetments have been constructedin ur country. One of the direct impacts of river embankment is the increasein he water current velocity at particular sites of the river upsetting the lifeha its of aquatic organisms

Sil tion: Nearly 5334 million tons of soil is eroded annually from thecultiv: ble land and forests of India. On cropland, the erosion can range fromless th n 3 to more than 50t acre+yr'. The country's rivers carry approximately2050 illion tons of soil of which nearly 480 million tons is deposited in the
irs and 1572 million tons is washed into the sea every year. The loss ofcapacity of reservoir due to silting is by far the most serious problem
create by soil erosion (Gupta, 1975). The sediment load of the river Gangaand B ahmaputra are the highest in the country with 586 million t to 470 milliont resp ctively. Of the major river basins studied in the country more than onethird arry sediment loads of 100 million t or more (Jhingran,1991)
Cli ate change: The climate of the earth in the past few decades is showingperce tible changes both in global and regional scale manifested by increasein at ospheric and water temperature. Historical data shows an increase intempe ature by 0.3°C to 0.6°C between1890 to 1990 and projections by theend 0 the century show a range of 2-4.5 °C increase (IPCC,2007).As globalwarming continues to increase the atmosphere temperature, it will lead to acontinuous shift of zero temperature line (snow line) toward higher altitude.Thus laciers will receive more liquid precipitation and less monsoonal solidprecip tation. Shift in snowline will result in lesser input to glacier mass balancedurin summer periods. Therefore, higher atmospheric temperature and moreliquid recipitation at higher altitude in the Himalayas will lead to rapid retreatof gla iers and downstream flooding in the coming future (Hasnain 2002,Kado a et al. 1993). Its impact will be felt in the rivers and associatedecosy tems. This alteration in the hydrologic pattern of the rivers and associatedwetla ds will definitely impact inland fisheries (Das et al, 2007a) .In WestBeng 1for example the mean minimum and mean maximum air temperatureincrea ed in the range 0.19 °C - 0.67 °C and 0.09 °C - 0.37 °C in four districtsdurin! 1985 to 2006. The mean maximum and mean minimum watertempe ature during the fish breeding season (March-September) also increasedby 1.6 °C and 0.31°C respectively during the same time period in district North24 (P gs). This enhanced temperature is one of the prime reason for theadvan ced breeding by 1-2 months of the Indian Major Carps in all the districtssince ast twenty years in West Bengal. (Das et al, 2007b).Repo ts of fish killThe d graded rivers in specific stretches have recorded total loss in aquaticlife in .luding fishes. The severe impacts of industrial effluents disposed intoour ri er systems have resulted in fish kills, which have been reported fromtime t time.

,
Tab e 1. Fish kill reports from Indian rivers
, Place Year Cause Source
Ri er Gornti, 1983, 1984, 1986 Distillery waste Joshi, 1994.Lu know
Ri\ er Chahar, 1974 Pesticide Joshi, 1994.Al vage
Ri -er Tungabhadra, 1984 Poly fiber, rayon Murthy, 1984.Ha ihar 1994 effluents
Ri IeI' Ganga, 1968 Oil refinery effluents Sunderesan et at. 1983M mghyr, Bihar
Ri er Adyar, 1981-82 Tannery effluents Joshi, 1994.M idras
Ri vel' Gornti, 1988 Epizootic ulcerative Das and Das, 1993.TI pura syndrome (EUS)
Riv er Sheila, 1988 EUS Das and Das, 1993.M, ghalaya
Rver Churni, 1993 Sugar mill effluents Ghosh & Konar, 1993.\\ est Bengal 1997 Konar, 1997.
Rver Yamuna, 1999 Sudden increase in Anon, 1999.Haryana turbidity due to sugar
factory discharge
River Bhavani 1999 Untreated effluent of Bhavani RiverTamil Nadu South India Viscose Protection Council
River Burhi 2000 Effluent from Alam et al. 200 I.e andak, Bihar sugar mill
Fiver Sutlej 2001 Probably effluents of The Tribune,NFL and Punjab Chandigarh. 24th.Alkalis and November, 2001.Chemicals Ltd.
river Gomti 2003 Effluent from sugar India-ej News.B".ucknow mill, paper mill, July.2003
Sugar mill anddistilleries, upstreamof Sitapur and
, Lakhimpur-Kheri
~iver Gedilam 2005 Sugar mill effluents The Hindu,Farnil Nadu. of Nellikuppam, u- May 2005

All these reports indicate the laxity of our pollution monitoring system.4. Detailed Case StudiesGanga River System
4.1 Generalfeatures : The length of mainstream of the river is 2525 km. Itoriginates from the icepacks of Gangotri in Uttar Kashi District of U.P. at7100 m MSL. Its total basin area is 0.861 million km2 with a geographic location37° 3' - 85° 58' E and 25° 25 - 31° 30' N covering 8 states. Its main tributariesare the Yamuna, Ramganga, Gomti, Tons, Ghagra, Gandak, Burhi Gandak,Son, Bagmati and Kosi. A total of 1,42,637 million m3 of water is abstractedout of which the break up is for Irrigation - 85,000 million m'; Storage underreservoir projects- 33,476 million m'; and for other purposes (Industries.Collieries. power plants. etc.) - 24,161 million m'. The major water abstractionpoints on the main Ganga are: The Upper Ganga Canal at Haridwar; the LowerGanga Canal at Narora; the pumped canals -Dalmau, Bhoupali and Zamanieand the Farakka Barrage.
Among the northern tributaries, Ramganga, Ghagra and Sarda havediversion points. The Tribeni Canal taking off from the Gandak, Madhubanand Lalbakhuja canals and the recent projects on Gandak and Kosi are thediversion points on the eastern group of tributaries. In the southern sector, theChambal projects consisting of three dams and the barrage at Kota have a livestorage of 8500 m cu m. The Eastern and Western Yamuna Canals provideirrigation to the fertile Yamuna Ganga tract where 75% ofthe land is cultivable.There are a number of projects contemplated by Bihar on the tributaries ofSon like the Kanhar, North Koel etc.
The State of Uttar Pradesh has the maximum impoundment of Ganga waters(17,271.9 m cu m).This includes the largest storage reservoir of the Gangabasin viz: the Rihand which holds 8971 m cu m of water. GandhisagarinMadhya Pradesh has an overall capacity of 6.911 m.cu.m. Farakka barrage isthe only hydraulic structure on the main river which obstructs the flow of riverjust before its bifurcation into Bhagirathi and Padma. Commissioned in 1975.The barrage serves a vital purpose of flushing the Hooghly during the drymonths. Water impounded behind the barrage is regulated to flow into themain river Padma that flows into Bangladesh and to Bhagirathi in India througha feeder channel.
---------------------------~---------------------------

4.2 Water and nutrient quality: Along the banks of Ganges, over 29 cities,o towns, and thousands of villages are situated. Nearly all of their sewage -rver 1.3 billion litres per day r: goes directly into the river. Another 260 million
litres of industrial waste are added to this by hundreds of factories along theiver's banks. Municipal sewage constitutes 80 per cent by volume of theotal waste dumped into the Ganges, and industries contribute about 15 percent.he majority of the Ganges pollution is organic waste, sewage, trash food,nd human and animal remains. Recent water samples collected in Varanasievealed fecal-coliform counts of about 50,000 bacteria per 100 ml of water,0,000% higher than the government standard for safe river bathing.
The major polluting industries on the Ganga are the leather industries,specially near Kanpur, which use large amounts of chromium and other toxichemical waste, and much of it finds its way into the meager flow of theanga. From the plains to the sea, pharmaceutical companies, electronicslants, textile and paper industries, tanneries, fertilizer manufacturers and oilefineries discharge effluent into the river. This hazardous waste includesydrochloric acid, heavy metals, bleaches, dyes and pesticides. Damming theiver or diverting its water, mainly for irrigation purposes, also adds to theollution crisis.
The water quality data of the National River Conservation Directorate clearlyhowed that the Ganga has deteriorated over the period 1993-1999. During999 BOD exceeded the permissible limit at 10 out of 27 sampling stations, as
igainst only at 1 sampling station, viz. Kanpur down stream in 1993. The.oliform levels also exceeded in many places during 1999. The poor conditionf the river Ganga is reflected in various reports of CIFRI cited in succeedingages. The physico-chemical parameters of water exhibited poor condition athe out fall (OF) and below out fall (BOF) zones of the major effluent discharge.ites. Dissolved oxygen was critically low «4 mgl and even nil) at the OF.ites. At many OF sites the phosphate and nitrate contents was also high.
rganic load in the sediments (organic carbon %) was also noticed high at thenajor effluent discharge sites.
Though the water quality of river Ganga is optimum for fisheries is some.tretches but pollution from the domestic sewage and industries have in generalifJected fish species abundance and composition in some stretches.
4.3 Pesticide residue status in water, sediment and fish: Studies indicate

..
that the residues of organochlorine pesticides including HCH, DDT, endosulfanand their metabolites are commonly occurring substances in water of the riverand it. estuary. Unusual content of the pesticides was reported by Nayak et al.(1995 in the middle stretch (Varanasi) of the river (Table -2). Moderate contentof He H compounds were recorded in the studies of Kumari and Sinha (2001).DDT and its analogues was noticed moderate by Ray (1992) and Halder et al.(19891. Ray (1992) also reported moderate content of endosulfan compounds.Com Iarison of the data with the US EPA permissible limits for aquaticorgar isms or their consumers clearly indicates that the river water isconta ninated with the residues of organochlorine pesticides, the content ofwhicl often cross thousands of times over the permissible limits.
Table :2 Organochlorine pesticide residues (ng I') or ppt) in water of river Ganga
Wateresou ce
HCH DDT Aldrin Endosulfan Heptachlor Chlordane Reference
Gang'[River
0-5808
Ray, 1992Gang'River
I - 971 0 - 1240
Singh,1992
0-2890
Gang [River
0-11190-8320-120 0-232 0-412 Agnihotri,1993
GangRiver
105- 69 -99517 143226
189 - 19 - 0-8002597 1663
1--400 2-500
6--4000
1.5 6.2
GangRiver
HooghlyEstua y
HooghlyEstua y
83 - 66516
0-862
0-97
Nayak et aI.,1995
Kumari &Sinha, 2001
Thakar, 1986
Halder et al,1989
0.180 Anbu, 2002HooghlyEstua y
o ly limited studies available on the sediment phase of the river indicatelow I vels. Senthilkumar et al. (1999) reported HCH <0.1 - 8.1, DDT 0.1 - 36and chlordane <0.1-49 ppb in the river while Joshi (1986a,b) observed DDT17 - )9 ppb in the estuary.
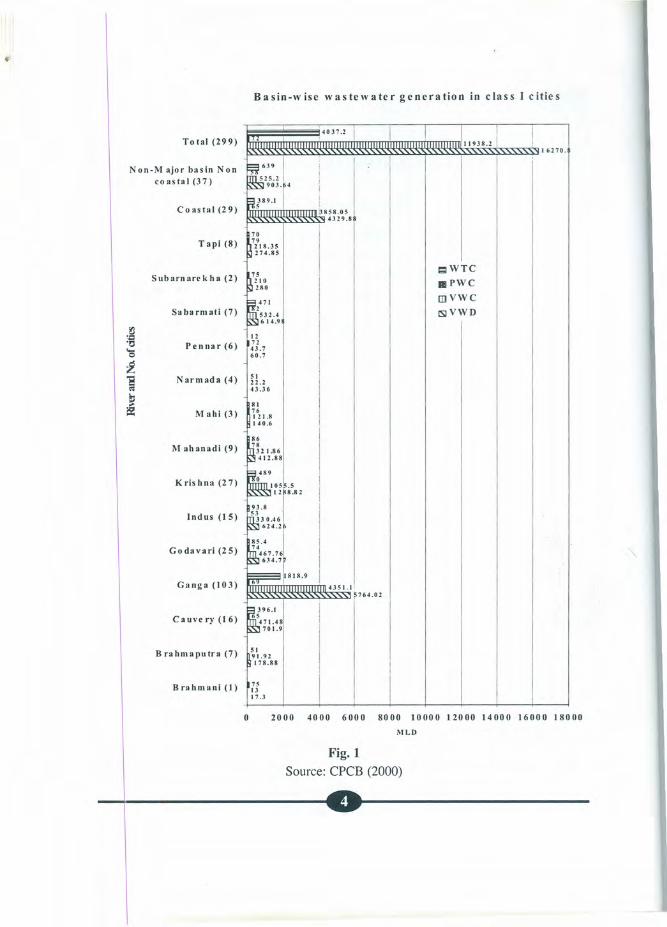
In the fishes of river Ganga,(Table-3) significant accumulation of DDT(60 - 3700 ppb) was noticed by Senthilkumar et al. (1999). In the studies ofKurnari et al. (2001) observed pesticide levels in fishes were: HCH
55 - 1207 ppb) and DDT (14 - 1666 ppb). Aldrin and endosulfan wereelatively low of 0 - 225 and 0 - 175 ppb respectively. In the estuary zone the[eported levels were relatively low (Joshi, 1986 a & band Samanta, 2006).rhus, it may be concluded that the Ganga river fishes sometimes cross theimits for HCH (Kumari et al., 2001) and endosulfan (Kumari et al., 2001).~lthough in majority of the cases, the observed residues of DDT in fish samples;Veremuch more than that of HCH or endosulfan, the permissible limit is not( xceeded. Probably the dilution effect in the estuary is protecting the fishesrom accumulating these persistent compounds.
Table -3: Organochlorine pesticide residues (ng g-l or ppb) in fish andmolluscs of river Ganga
HCH DDT Aldrin Dieldrin Endosulfan Reference
IFish 77 160 2.7 2.9 Kannan et al., 1993
Fish 28 - 110 60 - 3700 Senthilkumar et al.,1999
Fish 55 - 1207 14 - 1666 0- 225 0-175 Kumari et al., 2001
Hooghly estuary Joshi, 1986 a & bFish 31 - 460Molluscs 66 - 953
Hooghlyestuary 0.1 -9.0 1.4 - 73.4 0-0.7 0-4.2 Samanta, 2006fish
Safe limits for human
US FDA 5000 300 300 FAD,1983'FAD 100 lindane 5000 200 200 100
Irhailand 500 lindane 5000 100 300
II;lIndia, permissible limits of the organochlorine pesticides for aquaticorganisms or their consumers have not yet been developed. Thus the US EPAl mits (EPA, 2002, 2006)are considered for comparison. It is very clear thatII the surface water resources are contaminated with the residues of
)rganochlorine pesticides, the levels of which often cross thousands of timeso er the permissible limits. However, the residues in fish flesh are belowli rmfullevel for human consumption except in a few cases.
4.4 Heavy metals in water, sediment andfish: Metal contamination in theriver Ganga has been reported by several workers (Table-4). The upper mosts retch is relatively free from different metals. The middle stretch, receiving

different effluents, is found heavily polluted. Although a significant stretch ofthe estuarine zone is heavily industrialized and receive effluents regularly,due to greater dilution the metal contents were found lower than that of themiddle stretch. In majority of the cases the reported levels are found muchhigher than the US EPA permissible limits for the aquatic organisms. All theeffluents were found contaminated with metals and sometimes it goes tounusually high values as was observed by Prasad et al., (1989), Joshi (1991)and Ghosh et al (1983).
Metal content in sediment of river Ganga has been studied by many workers(Tab,Ie4). In the upper stretch, as per expectation, contents were found relativelylow except Cd (Saiki a et al., 1988). Since the area is free from human activities,the metal contents were attributed to the geochemical sources. In the middlestretch (Rishikesh to Ramghat near Bulandshahr), highest content of the metalswas recorded in the Ghaziabad stretch receiving industrial discharges. Althoughthe Kanpur stretch of the river is reported to be heavily polluted, these are notreflected in the sediment metal content due to huge sediment load of the riverand fresh deposition is protecting the system from the accumulation of thesame. As a whole the river is found moderately polluted.
Joshi (1991) studied metal content in fish in the Rishikesh to Kolkata stretchof river Ganga. The highest values recorded are given in the Table -5. Likesediment, the content of Cr, Cu, Pb and Zn was found high in the fish samplescollected from middle stretch of the river while Hg was high in the estuarinesamples. Kaviraj (1989) reported relatively high content of Zn (135.6 p,g go,)in Penaeus indicus. Among the studied fishes, Mastacembelus pancalusaccumulated more amount of Zn (108.2p,g go'). As per the US FDA limit forhuman consumption, the Pb and Cr are found to cross the limits in someoccasions.
Sinha et al. (2007) reported mercury concentration in different samples ofthe 'Ganga river in various seasons (water: 0.00037-.00032; sediment: 0.08-0.106; benthos; 0.108-0.144; fish: 0.205-4.369; floodplain soil: 0.095-0.126;vegetation: 0.098 - 0.254 )
The high pH level (> 7.5) also facilitates metal precipitation in the Gangariver system in addition with the heavy silt load. Since fresh silt is also depositedevery year, the cumulative impact of metal accumulation on sediments is notobserved.
----------------~~~---------------

Table 4 . Heavy metals in sediment (p,g g-l) of river Ganga
River Cd Cr Cu Mn Ni Pb Zn Reference4.9 - Saikia et al.,
Ganga (upstream) 0.8 - 29.4 4.1 - 17.9 107.3 - 226.1 11.8 26.3 - 48.3 19883.0 - 51.0 4.5 - 125.0 -
Ganga (midstream) 0.0 - 1.2 2.5 - 45.0 70.9-511.0 49.0 1.2-16.0 259.0 Israili, 19918.4 - 13.0 Singh and
Mahaver,Ganga (midstream) 60.0 - 84.0 1997
Vass et al.,Ganga (midstream) 2.1 - 9.9 10.2 - 128.1 30.5-47.1 50 - 249 1998
12.8 - 20.9 Khan et al.,Ganga (midstream) 0.4 - 1.0 1.9 - 22.0 2003
83.2 28.8 MohammadGanga 3.5 95.0 470.0 21.8 et al .. 1987
12.0 - 12.0- Subramanian,Hooghly Estuary 4.0 - 53.0 250.0 - 800.0 115.0 611.0 1985Hooghly 9.1 - 21.1 - Mitra et al ..Estuary mouth 7.9 - 32.2 53.6 - 286.0 39.0 3.0 - 27.4 147.7 1996Hooghly 145.8 - Vass et al ..Estuary 2.5 - 7.7 35.5 - 52.5 24.0 - 36.4 165.6 1998
61.5 37.5 64.4 Ramesh et al.,Hooghly 0.4 (24.9 - 96.6) (16.9 - 10.5 (27.2 - 1999Estuary mouth (0.1-0.7) 58.3) (6.8 - 14.2) 95.2)
2.0 26.0 298.5 36.0 no(0.4 - 4.4) (3.9 - 80.4) (34.4- 539.6) (0.5 - (25.0- Samanta et
Hooghlv & Haldi 79.4) 363.4) al .. 2007US EPA limitNot polluted - < 25 < 25 - <20 <40 < 90Moderate pollution - 25 -75 25 - 50 - 20 - 50 40- 60 90 - 200 Nichols et al ..Heavy pollution >6 > 75 > 50 - > 50 > 60 > 200 1991
••

Metat is a point source pollutant and since it gets adsorbed or precipitatedvery guickly on particulate matters, the effect is not clearly observed zonewise. Although the estuarine zone of river Ganga is heavily industrialised, thehigh tidal flushing activity is not allowing the metals to accumulate atalar ingly high levels.5. C mparative Contamination of Inland Waters
5.11\ etal contaminationIn general, metal pollution was found more in the rivers since these have
beco e the discharge sites of the effluents which are mostly untreated. Studiesare r latively less, in the reservoirs, since these are mostly located in theupstr
lams of the river and the huge water volume is protecting these water
bodi s from pollution. Some of the reservoirs receiving effluents are reportedto be heavily polluted. Floodplain wetlands are also reported to have heavymeta contamination. The levels of heavy metal in various water bodies aregive in (Table- 5)
Heav metal contamination has been a problemfor fisheries only in the riversespec ially at the point source of pollution5.2 esticide contamination
Mlajority of the studies on the pesticide residues in the inland aquatic systemsin In ia were conducted in the rivers. In some cases the observed levels inwate are enormously high as has been reported in Table 6.If w generalize the rest of the data generated from the Indian rivers, theobset ved range for HCH was 0 - 5000 ppt of which the 1000 - 5000 ppt weredetec1tednear the pollutant receiving areas. In case ofDDT also, rivers exhibitedsimilar levels (0 - 5000 ppt) and trend. Aldrin was not recorded in all thecase . Its reported range was 0 - 200 ppt. Dieldrin was recorded in still lessnum,er of cases. Abundance of endosulfan was however, noticed, in the rangeof 0 - 3000 ppt. Heptachlor was reported 0 -412 ppt in river Ganga (Agnihotri,1993 . Chlordane was found in traces (Anbu, 2002).
Studies in reservoirs are meager. Very high accumulation of theorgai ochlorine pesticides are reported from the reservoirs of Rajasthan.Rajei dra Babu et al. (1983) observed 1000 - 10000 ppt HCH in the Aranyarreservoir of Andhra Pradesh. These published values are unusually high anddete ted in only isolated cases. Modern instrumental technique like GC-MS
--~-------------~-----------------

••
Table- 5 Table trace metals in water (ppb) of the Inland water bodiesWater bodies Cd Cr Cu Ni Pb Zn Reference
Ganga (upstream)Saikia et al., 1988 Israili,
0- 11 0 7 - 17 12 - 50 0 72 - 157 1991
Ganga (midstream)Singh and Mahaver, 1997
0-28 3 - 119 3 - 170 I - 10 1-680 I - 311 Vass et al., 1998
Hooghly Estuary 2-14 - 5-19 - 17-41 22-37 Samanta et. Al 2005Jhingran & Joshi
Yamuna 0-0.38 0- 1.32 (2.3 -18.0) (0.8 - 6.9) (22 - 54.7) 1987Singh & Mahaver
Yamuna (Allahabad) (2.2-2.4) (28-30) 1997(1.5 - (16.5- (9.75-
Hindon 6.75)** (12.5-210) 175)** 21.25)* (10-14)** ( 13-23.5) Mukhopadhva 2003(112- Krishnamurti & Bharat
Kali (2 - 4)** (6 - 17) (15-28)** (12 - 20) (17 - 55) 167)** 1994Datta Munshi and Singh,
Subarnarekha 150 - 250 127 - 182 200 - 420 205 - 292 1990
Motijhel Surajkhand Ranital(17-34)Reservoirs (MP) (9-10) 20-48 (1-4) (2-9) (65-120) Koushik et al 1999
Byramangala Reservior(Banglore) 0- 15 0 28 - 52 16 - 22 87 - 130 Joshi 1990Byramangala Reservior(Bang1ore) nd nd-15.0 (22-23) (18-22) (102-123) CIFRI ReportHussain Sagar(Hydrabad) 4.6 68 141 361 Khan et al1986Wyra, Moosi, Nagarjun SagarReservoirs -
(Karnataka) 0-30 0-20 0 (20-30) CIFRI ReportSuguna & BansdahWetlands 0-2 0-10 0 (10 - 60) CIFRI Repor** indicating above permissible level & * indicating bellow permissible level

coul validate such observations. Joshi (1990) detected the isomers of HCHand DT in water of Rihand reservoir.
I some ponds and floodplain wetlands of West Bengal relatively highcont nt of endosulfan (670 - 8350 ppt) was reported by Chowdhary, et al. (1994).
Although the observed residue levels are many a times high, the tropicalclim te of the country is protecting the water phase from the worst state ofpoll tion even after a huge consumption of these compounds in the past. It isclear that all the surface water resources are contaminated with the residues oforga iochlorine pesticides, the content of which often cross thousands of timesover the permissible limits of US EPA and the aquatic organisms or theircons mers are at a risk due to these pesticide residues.
o ly a few attempts have been made to study the residues oforga ophosphorus pesticide in the river waters in India. Malathion, methyl
I
parat ion and dimethoate were detected in many water samples of river Ganga,ethion was also found occasionally (Ray 1992). In the same river however,Agni otri (1993) observed very low concentrations of these insecticides.
In some pond and floodplain wetland of West Bengal, unusually high contentof m thyl parathion (85000 - 2113000 ppt) and monocrotophos (535000 -4410 00 ppt) were detected (Chowdhary, et al., 1994). Although the watersour es were near the paddy fields receiving these pesticides, more such studycan s rengthen the findings.
Studies on the residues in sediments of organochlorine pesticides arerelati~ely less than that of the water phase. For HCH, the reported range is'O-250 pb except river Gomti (0.1 - 1650 ppb). DDT and aldrin were foundtobe pr sent in the range of 0 - 1000 ppb. In only one report the levels of DDTand ldrin were high of 690 - 4850 and 0 - 17000 ppb respectively (UNEP,2002 . Dieldrin was also detected in many cases, observed range 0 - 500 ppb.Endo ulfan was reported in the sediments of river Gomti (0 - 72.6 ppb) (Singhet al. 2005).
S attered reports on the residue content in fish are available. In the fishfrom river Yamuna, huge residues of DDT (59 - 7575 ppb) were observed(Pillt· and Agarwal, 1979). In the fish samples of river Gomti, higher contentof D I T (0 - 1658 ppb) and moderate amount of HCH (4 - 410 ppb) wererepor ed by Kaphalia et al. (1986).

Application of fertilizers and pesticides are responsible for their higherresidues in the fishes of the floodplain wetlands. Very limited study wasundertaken to measure the pesticide residues in such environments. The residuesof endosulfan were found high (490 - 2390 ppb) in the fishes from pond andfloodplain wetlands of West Bengal.
A few studies on the residue of organophosphorus pesticides in fish aref available. Very high accumulation of methyl parathion (10250 - 10850 ppb)and monocrotophos (320000 - 523500 ppb) in the fishes from pond andfloodplain wetlands of West Bengal was observed (Chowdhury et aI., 1994).Agricultural applications were the source behind such unusual accumulation
Table- 6 Oraancchlorme nettctde residues In /1 or ppt in the surface water of India
Water Resource HCH DDT Aldrin Dieldrin Endosulfan HcptchlorGanga River 1-971 0"1240 0-2890Ganga River 0-5808Ganga River 0-1119 0-832 0-120 0-232 0-412
Pond FloodplainWetland(WB)
120
41
o
0-129
670-8350
69-Ganga River 105-99517 143226 83-66516
40-3400
110-25040
Chlordane Reference
Ray 1992Singh 1992Agnihotri,l993
Nayak, et a11995
Ganga River
Yamuna RiverYamuna RiverYamunaRiver(Delhi)
189-2597
0-939
19-1663 0-800 0-862Kumar! & Sinha2001Agrawal et a1,1986CPCB2000
<0.008 Anbu,2002CooumRivcr(Chcnnai)
0-1441 0-58
1 Anbu,2002UisoorRiver(Banglore)Comoti River
Gomoti River 0-4846
660
1.6 250
0-1372
0.54 Anbu,2002Singh,1996Singh et a12005
Vcllar RiverTammileru/KolleruRiver
26-3900
unto 2637
3.1 13
unto 18
Rarncsh ct a11990aVeeraiah andPrasad,l996
Kshiore River
Rivers ofNortheastern State
Chambal RiverTributaries ofGanga
6-214272000
4-26
0-53165 0-627
0-7
2
Pathak et al1992Kulshrestha 1989Ku lshrestha 1989
Sarkar et a1 2003
Hoozhlv EstuaryHoonhlv Estuary
HooghlyEstuary(Kolkata)Lakefl.ucknow)
1-400
1450
0-4578 0-205
0-97Thakar 1986Halder et a11989
0.18 A nbu,2002Nigam et a11998
Jalmahalreservoir/Rajasthan)Mahalalreservoir(Rajasthan)
10-4600
0-46530
1-5
uDt095
13-2182190014470
9-722-5606-4000
1.5 6.2
0-1560
Kumar ct a11988
Bakre et al, 1990Aranyar reservoir(AP)
1000-10000
121
40-4700
70-33630Rajendra Babu ct a11983
Bheri (Kolkata)Floodplain Wetland(WB)
59 53
2
6 2
13
Samanta et ai, 2005
Samanta ef "I, 2005Chowdhury et a11994
------------------------------~------------------------------
9

Pesticide contamination offishes has not been a major problem for fishes inour inland water bodies as indicated by the reports.
6. Impact of Stressed Environment6.1 Hydraulics6.1.1 Salinity: In river Hooghly river course modifications have played theirpart in estuarine fisheries. There has been a overall decline in the salinity ofHooghly- Matla estuary after commissioning of Farrakka barrage (Sinha et aI,1996) with gradient and marine zones pushed down towards sea. This hasbrought about distinct change in the species composition of fishes caught,with freshwater species making their appearance in tidal zone and a few neriticspecies disappearing.
The likely impact of taming of river Narmada on its estuarine fishery is anexample. In a desk review (Anon, 1994) of the likely impact of Narmada Sagarand Sardar Sarobar on the fisheries downstream, carried out by CIFRI forNarmada Control Authority, it has been pointed out that as per the report ofthe Narmada Water Dispute Tribunal (Anon,1978) there would be 72.71 %reduction in water availability down stream at 30 years of commencement ofconstruction.It may not change the salinity regime during non-monsoon monthsby the annual event of dilution during months shall not be maintained.Thisshall effect the migratory fauna, particularly Tenualosa ilisha andMacrobrachium rosenbergi, and accordingly the fish yield downstream willdecline. Stage attained at 45 years from the commencement of construction ofconstruction, when freshwater release from Sardar Sarovar shall cease, willbe very critical as it shall be associated with steep hike in salinity and in absenceof compromising factor (Freshwater flow) the tidal ingress shall be moretowards river side. It is more likely that the whole estuary shall undergo a .transformation into a biotope characterized by hypersaline condition withsalinity tongue further invading inland. Fishery shall drastically change. Withthe present height of 80.3m attained by Sardar Sarovar Dam, impact ofimpoundment are already visible in the down stream.
In river Krishna changes due to salinity are discernible. Recent investigationsconducted by CIFRI in river Krishna estuary in Andhra Pradesh, revealed thatthe establishment of upper Krishna projects in Maharashtra, and Karnatakainvolving reservoirs viz., Srisailam and Nagarjunasagar, the water availabilityin the river downstream of Prakasam Barrage has dwindled. Further, the----------------~~~---------------

requirement of water for irrigation and the Vijayawada Thermal Power Station,the gates of Prakasam Barrage remain closed resulting in complete drying upof the upper estuary bed. The seawater incursion into the riverine stretch hasresulted in ground water becoming saline. The increase in salinity is due toreduction of freshwater river flows. Present investigations revealed the salinityamplitude in Krishna estuary to range from 20 to 35 ppt, a hyper-salinecondition. During high tide the seawater reaches up to Nadakudu coveringabout 90% of the tidal stretch. Only during monsoon the rainwater anddischarges from Prakasam Barrage on account of attainment of full storagelevel, lowers the estuarine salinity. Thus the Krishna estuary at present is whollya tide-fed, polyhaline estuary threatened by the absence of freshwater fromthe main river. Thus Mullets are dominant in catches (80%) represented byMugil cephalus, Liza parsia, Lira spp. Clupeids, perches, sciaenids, catfishes,penaeid prawns and mud crabs (Scylla serrata) form the other groups. Themarine catch includes mackerels, sardines and pomfrets etc.6.1.2 Siltation: Land use patterns in a watershed influence runoff, riverhydrography and sediment load. Deforestation is a reason for the excessivesilt load in most of the Himalyan river tributaries, a load which has increasedrates of siltation downstream in oxbow lakes, floodplain sloughs & backwaters(Natarajan1989). Reduction in forest cover has led to a great increase in boththe dissolved and particulate solids in Ganga river system Rao (1979). Thesediment loads of the Ganga and Brahmaputra are the highest in the countrywith 586 million tones and 470 million tones respecti vely. Of the major basinsstudied in the country more than one third carry sediment loads of 100 milliontones or more which is very high. In Chilka lagoon (Banerjee et al, 1996)regulated decreased discharges in corning rivers have made considerablenegative impact on its fishery. Siltation of lagoon bed and its connecting channelwith sea, profuse weed infestation, decrease in salinity and qualitative andquantitative decline in the fishery of this lagoon has been observed.6.1.3 Recruitment: The impact of water abstraction is very obvious in riverGanga. Water abstraction and consequent reduced stream flow has affectedthe breeding and recruitment of fishes. The fish spawn availability index inriver Ganga declined from 2984 ml in the 1960s to 27 ml in recent years(1994-2004) (Natarajan 1984, CIFRI Annual Report 1971-2004). It also showeda continuing deterioration of Indian major carps seed with decreasing
------------------~------------------

.U
percentage of major carps seed (78.62% in 1961-1965 to 34.48% in 2000-04)whereas minor carps (from 20.68% in 1961-65 to 52.95% in 1991-95) andother fish seed (from 0.7% in 1961-65 to 47.8% in 2000-04) showed anincreasing percentage in total seed collection.
In the Ganga basin approximately 85 billion m" of water is diverted bycanal project and by hydro-electric and storage reservoir for irrigation, powerand flood control. Canal projects accounted for a little over 60% of theimpounded water (Natarajan, 1989). The construction of flood control dykesand levees in flood prone low lying areas has deprived the major carps of theirextensive breeding habitats, previously available in network of interlacedchannels connected with the Kosi river (David,1959) and the flood plains ofthe Kosi, Gandak, Rapti, Sarju and other tributaries. Canal projects and floodcontrol measures are the two major factors that are specially responsible fordestruction of breeding habitat for major carps (Natarajan1989). The spawninggrounds of Indian major carps are situated in the flood plains which areinundated during the monsoon. It is believed that a flood level between 5-8 mhelps the fish to migrate upto the breeding grounds & a moderate current(0.35 to 1.6km/hr) help the spawn to shift down. Breeding and recruitment areseriously hampered when the water level in the streams do not reach thespawning ground due to inadequate discharge rate. Flood levels have a closerelationship with the spawn availability of major carps (Jhingran, 1989)
The oxbow laks, deep pools and other lentic water bodies associated withthe river act as sanctuaries for the brooders which get connected to themainstream during the monsoon, when the discharge rate become inadequate,these water bodies fail to get connected and the brooders get isolated.6.2 Dams and Fish passes
Hilsa: Hilsa is a classical example of anadromous fishes being affecteddue to obstruction of their migratory pathways by dams. The natural migratoryrange of these fishes in 1500 km from the Hooghly estuary to Allahabad onthe Ganga. The 1975 construction of the Farrakka barrage at the head of theBhagirathi and Padma tributaries of the Ganga, some 470 km from the rivermouth, has not affected the hilsa fishing in the tidal stretch of the delta.However;the barrage has nearly dominated the riverine fishery upstream of Farrakka onthe main stream of the Ganga, a fishery whish was based on runs of bothPadma & Hooghly stocks. (Natarajan, 1989). Similarly hilsa ceased to migrate
------------------~~----------------

up to Damodar River, a tributary of the Hooghly after construction of dams(DYC), a barrage (Durgapur), and a weir (Anderson weir).The migration offish is also restricted to 40km in the Rupnarayan River (Pantulu et.al. 1966).The dams in the upper stretches of the river obstruct migration of mahseers(Tor spp) that move from low land to upland reachs for breeding. Shetty &Malhotra(1983) reported decline of Tor tor along with other fishes followingconstruction of a barrage at Tribeni on the Gandhak river, Barrage at Son,Okhla and Farrakka are also known to impede major carp migration forbreeding. For example the yield of major carps are reported to have beenreduced about 50% of the 1964 level in the lower Ganga following constructionof Farrakka (Jhingran & Ghosh 1978)
Fish pass: Major irrigation structures on rivers such as dams, weirs andbarrages form solid obstruction to the migratory path of fish for spawning orfeeding. Majority of these hydraulic structures in India have no provisions offish pass resulting in significant reduction offish species and yield. Fish passesare key elements for the restoration of free passage for fish and other aquaticspecies in rivers. The few fish passes built in India are on the Mahanadi barrage,Naraj barrage on river Mahanadi, the Hathnikund barrage on river Jamunaand Farakka barrage on river Ganga. The fish passes in the barrages on riverMahanadi are of the Denil type and in Farakka barrage on river Ganga it isFish lock. These passes were constructed to take care of the migratoryrequirement of the Indian major carps, Macrobrachium rosenbergi andTenualosa ilisha. Unfortunately these requirements has been partially fulfilled.Most of these structures had some drawbacks. This can be overcome byintensive research on the hydraulic design offish passes for structures of varyingheights and on migration behavior of the migratory fishes of India CIFRI isconducting research on this important aspect and has designed pool type fishpasses for some upcoming dams in the rivers of north eastern India. Thisenvironmental requirement of constructing fish passes for maintaining fishpopulation in the entire stretch of the river for sustainable fisheries developmentneeds due importance.6.3 Contamination6.3.1 Water quality: Sewage pollution is the major source of water qualitydeterioration of our rivers and floodplain wetlands. The major adverse impactsof sewage pollution are deoxygenation, high BOD load, rapid eutrophication
----------------~~-----------------

and accumulation of heavy metals in the environment. Sharp fall in dissolvedoxygen in water puts the biotic communities under severe stress. While somespecies can tolerate a wide range of dissolved oxygen, many communities arehighly sensitive to this parameter. . For instance, complete absence ofzooplankton during January to August and its reappearance in Septemberrepresented by Keratella sp. have been observed in the downstream of sewageeffluent outfall on the Ganga and Yamuna.
Bacterial population in river water and river bed gives a direct indication ofthe organic waste load. The mean concentration of total coliform organisms inGanga water shows considerable seasonal and sectoral variations. The countis low in the sectors from Rishikesh to Kanauj (normally less than 2,400 MPNI100 rnl) and higher concentrations are noticed at Uluberia, Dakshineswar,Palla. Kalyani, and Darbhanga Ghat (Patna). It is estimated that domesticwastewater contains 100 million coliform per 100 ml and 7000 viral particlesper 100 m\. Synthetic detergents being absorbed into the body system of fishimpair their growth and reproduction capacity. Detergents mixed with oil maybe 60 times more toxic than oil alone. Synergistic action of detergents withinsecticides has also been recorded. Its sub-lethal concentration causes thinningand elongation of respiratory epithelial cells. (Jhingran 1989)
Observation in river Kali (Qasim and Siddiqui, 1960) revealed deteriorationof water quality by sugar mill effluent. It increases the BOD which depletes agreat deal of DO in the river water and very often fish mortality occurred.6.3.2 Toxicants: Paper and pulp mill effluent: Impact of toxic discharge fromTriveni paper and pulp mill is reflected in erratic movement and mortality offishes spreading over an area of 50 sq. m.( Das et.al). The fishes affected wereMystus vittatus, Puntius sophore, Esomus danricus, Rita rita. Bleaching powderpresent in the effluents release free chlorine which is highly poisonous withcorrosive properties and is responsible for fish mortality.
Suspended solids: Exposure of fishes in river Damoder to fly ash producedfrom thermal power plants cause respiratory distress. This is due to depositionof coal dust particles and fine silt on the gills. Damages occur in the primaryand secondary gill lamellae with swollen tips (.Banerjee et. el, 1998)
Heavy metals: Fishes in the industrial effluent outfall area in river Haldi atHaldia are exposed to an average metal concenrrationtul' ) of Cd (2-14), Cu(5-19), Mn (8-88), Pb (17-41) and Zn (22-37).The levels of Cd, Pb and Pb------------------~------------------

were alarming ( Samanta et al 2005)Biopsy of the gills, liver and kidney of fish A. gagora, A. aor and P. pamashowed gill hyperplasia and swelling. Necrotic hemopoitic tissue and renaltubular degeneration is evident.
Investigations conducted in 110 Km stretch of river Hooghly passing througha densely industrialised zone indicated the levels of metals and pesticides tobe within permissible limits. However fish abundance and richness declinedin the downstream sites of this stretch. This is because of sandification of theriver with frequent sand extraction from the river bed and point source pollution.( Das and Samanta, 2006)
6.3.3 Bio-magnificationIn the Hooghly estuary, studies were conducted to determine the bio-
concentration factor of DDT. The observed levels of DDT in differentcomponents of the food chain and bio-magnification factors are given in theFigure (3). The bio-concentration factor of7500 for fish and 15833 for bivalvesare indicating risk associated with the terrestrial consumers including humanbeing.
Fig. 3
Water 0.06 ppb Sediment 70 ppbfactor 1 -- .. _------- factor 1166
~
i~~ Plankton 150 ppb
:;:~:;:;:~l factor 2500
r: Fish 450 ppb--- factor 7500
ii! Bivalve 950 ppb _0_0i factor 15833 ---
,/ __ Gastropod 220 ppb-- factor 3666
Biomagnification of DOT in aquatic food chain in Hooghly estuary
----------------~4S)~---------------

:--------
he ecological malady afflicting the inland aquatic resources and theconsequent decline in fisheries can be traced to the anthropogenic activitiesass ciated with population growth in the river basins. Irrigation projects, floodcon rol measures have nearly destroyed floodplains, sloughs, inundation zones,and oxbow lakes, all of which are breeding habitats of the major carps. Theimp irment of recruitment in these fishes has set into motion changes andrea justments of fish populations at the second and third trophic levels. TheMajor carp populations are now declining, while minor carps and other lesseco omic species are increasing in relative abundance. The impact of irrigationproj ct on fisheries is compounded by land use practices, pollution, exploitation,and fishing. Hydraulic structures have all eliminated the fishery for anadromousfish s Tenualosa ilisha
7. xisting Policy support
or inland fisheries and its beneficiaries as stake holder the significance ofwat r lies in the fact that water in the river, reservoir or lake serve as habitatfor 'ish unlike other stakeholders. For suggesting any policy for inland fisheriesdev lopment it is essential to understand the structure and mechanism of waterqua ity govermence in India. Basically it has three aspects; policy frame workto d al with water quality issues, a legal framework for violators of the policyand institutional framework to implement the policies
7.1 olicy Framework
Th policy framework of Government of India for management of waterresc urces in India are elucidated in National Water Policy (2002) (Box-l );National Conservation Strategy and Policy Statement on Environment 'andDe elopment (1992); Policy statement for Abatement of Pollution (1992) andDr ft National Environment Policy (2004) (Box-2). The policy statementsan strategies advocated are technological measures like use of cleantecl nologies and water pollution control systems; zoning strategy like settingup f source specific and area wise water quality standards and time boundplar s to prevent and control pollution; fiscal incentives for environmentallycle: n technologies, recycling and reuse of wastes and conservation of naturalres urces, operationalization of polluter pays principle and command controllik enforcement of pollution control norms, environmental audit, EIA andde, ranee of projects by MOEF above certain size.

Box-lNational Water Policy
1 Water is a prime natural resource, a basic human need and a preciousnational asset. Planning, development and management of waterresources need to be governed by national perspectives
2 Water is part of a larger ecological system. Realising the importanceand scarcity attached to the fresh water, it has to be treated as an essentialenvironment for sustaining all life forms
3 Water resources available to the country should be brought within thecategory of utilizable resources to the maximum possible extent.
4 Water resources development and management will have to be plannedfor a hydrological unit such as drainage basin as a whole or for a sub-basin, rnulti-sectorally, taking into account surface and ground waterfor sustainable use incorporating quantity and quality aspects as well asenvironmental considerations.
5 Watershed management through extensive soil conservation,catchment-area treatment, preservation of forests and increasing theforest cover and the construction of check-dams should be promoted.
6 With a view to give effect to the planning, development and managementof the water resources on a hydrological unit basis, along with a multi-sectoral, multi-disciplinary and participatory approach as well asintegrating quality, quantity and the environmental aspects" the existinginstitutions at various levels under the water resources sector will haveto be appropriately reoriented / reorganised and even created, wherevernecessary.
7 In the planning and operation of systems, water allocation prioritiesshould be broadly as follows:Drinking waterIrrigationHydro-powerEcology ?Agro-industries and non-agricultural industriesNavigation and other uses.
However, the priorities could be modified or added if warranted by thearea / region specific considerations.
--------------------------~-------------------------

••
8 There should be a close integration of water-use and land-use policies9 Management of the water resources for diverse uses should incorporate
a participatory approach; by involving not only the various governmentalagencies but also the users and other stakeholders, in an effective anddecisive manner, in various aspects of planning, design, developmentand management of the water resources schemes.
10 Both surface water and ground water should be regularly monitored forquality. A phased programme should be undertaken for improvementsin water quality.
11 Effluents should be treated to acceptable levels and standards beforedischarging them into natural streams.
12 Minimum flow should be ensured in the perennial streams formaintaining ecology and social considerations.
13 Principle of 'polluter pays' should be followed in management ofpolluted water.
14 Necessary legislation is to be made for preservation of existing waterbodies by preventing encroachment and deterioration of water quality.
15 While physical flood protection works like embankments and dykeswill continue to be necessary, increased emphasis should be laid onnon-structural measures such as flood forecasting and warning, floodplain zoning and flood proofing for the minimisation of losses and toreduce the recurring expenditure on flood relief.
16. The erosion of land, whether by the sea in coastal areas or by riverwaters inland, should be minimised by suitable cost-effective measures.·
Bo -2 National Environment Policy
The National Environment Policy (NEP, 2004) is a response to our nationalcorr mitment to a clean environment, mandated in the Constitution in Articles48 1\ and 51 A (g), strengthened by judicial interpretation of Article 21. ItIS r cognised that maintaining a healthy environment is not the state'sresj onsibility alone, but also that of every citizen.
Obj ectives of NEP 2004
The principal objectives of this policy are enumerated below.
1. Conservation of Critical Environmental Resources:

To protect and conserve critical ecological systems and resources, andinvaluable natural and man-made heritage which are essential for lifesupport, livelihoods, economic growth, and a broad conception of humanwell-being.
ii. Intra-generational Equity: Livelihood Security for the Poor:
To ensure equitable access to environmental resources and quality forall sections of society, and in particular, to ensure that poor communities,which are most dependent on environmental resources for theirlivelihoods, are assured secure access to these resources.
iii. Inter-generational Equity:
To ensure judicious use of environmental resources to meet the needsand aspirations of present and future generations.
iv. Integration of Environmental Concerns in Economic and SocialDevelopment:
To integrate environmental concerns into policies, plans, programmes,and projects for economic and social development.
v. Efficiency in Environmental Resource Use:
To ensure efficient use of environmental resources in the sense ofreduction in their use per unit of economic output, to minimize adverseenvironmental impacts.
vi. Environmental Governance:
To apply the principles of good governance (transparency, rationality,accountability, reduction in time and costs, and participation) to themanagement and regulation of use of environmental resources.
vii. Enhancement of Resources for Environmental Conservation:
To ensure higher resource flows, comprising finance, technology,management skills, traditional knowledge, and social capital, forenvironmental conservation through mutually beneficial multistakeholder partnerships between local communities, public agencies,and investors.
-----------------~-----------------

Under this objective the proposed action plan for Freshwater Resourcesviz., river systems is
a) Promote integrated approaches to management of river basins by theconcerned river authorities, considering upstream and downstreaminflows and withdrawals by season, pollution loads and naturalregeneration capacities, to ensure maintenance of adequate flows andadherence to water quality standards throughout their course in allseasons.
b) Consider and mitigate the impacts on river flora and fauna, and theresulting change in the resource base for livelihoods, of multipurposeriver valley projects, power plants, and industries.
c) Consider mandating the installation of water saving closets and taps inthe building byelaws of urban centres.
And for Wetlands it is
a) Set up a legally enforceable regulatory mechanism for identified valuablewetlands to prevent their degradation and enhance their conservation.Develop a national inventory of such wetlands.
b) Formulate conservation and prudent use strategies for each significantcatalogued wetland, with participation of local communities, and otherrelevant stakeholders.
c) Formulate and implement eco-tourism strategies for identified wetlandsthrough multistakeholder partnerships involving public agencies, localcommunities, and investors.
d) Take explicit account of impacts on wetlands of significant developmentprojects during the environmental appraisal of such projects; inparticular, the reduction in economic value of wetland environmentalservices should be explicitly factored into cost-benefit analyses.
e) Consider particular unique wetlands as entities with "IncomparableValues", in developing strategies for their protection.
----------------~~-----------------

---~-r--------------------------------"""""7.2 Legal FrameworkSome of the environmental laws of importance are
(a) The Water (Prevention and Control of Pollution) Act, 1974: It createdthe Central and State Pollution Control Boards (CPCB and SPCBs)
(b) The Water Cess Act, 1977: It was amended in 2003 and its mainattention is to enhance the finance of the CPCB and SPCBs by imposinga levy (cess) on water consumed by certain industries and by localauthorities.
(c) The Environmental (Protection) Act, 1986: It empowers the CentralGovernment to decide emission standards, restricting industrial sites,laying down procedures and safeguards for accident prevention andhandling of hazardous waste investigation and research on pollutionIssues.
(d) The Environment Impact Assessment introduced in 1994, empoweredCentral Government to impose restrictions and prohibitions oninstallation expansions or modernization of 30 types of activities unlessan environmental clearance is granted.
Environment standards: The prevailing aim of environment standards is toreduce potential damage to: human society in terms of health damages(morbidity and mortality); to sensitive ecosystems, resource conservation (fish)is also one of the aims.
Environment Management System (EMS): Such as ISO 1;4001 requiresadoption of standardized environment management practices, documentationand third party verification. Adoption of EMS could significantly ease theburden of monitoring by PCBs.
Ecolabeling: Ecolabels address the preference of environmentally consciousconsumers, rather than ensuring adherence to environmental standards.Labeling schemes may involve review of the entire product cycle from sourcingraw material to final disposal of the project.
7.3 Institutional FrameworkAt present, states generally plan, design and execute water supply schemes.
Water supply and sanitation is a state responsibility under the Constitution ofIndia. The states may give the responsibility and powers to the Panchayati Rajinstitutions (PRIs) and Urban Local Bodies (ULBs). In addition, a variety of
------------------~~~-----------------

dif erent government institutions at the centre have a role in the managementof eclining of water supply.
inistries of Water Resources, industry, power, agriculture, environmentan forests, rural development, urban development are some of the majorsta eholder's ministries that have a mandate in water resource management.Otl er important institutions that have a major role in water resource/qualityma iagernent are Central Water Commission, Central Groundwater Board/Au hority, Central Water Quality Authority, Central and State Pollution ControlBoc rds.7.4 Are the Interests of Fisheries Covered in the Above Policies
he National Water policy (NWP) of India stipulates (Clause 14.3) that"M' nimum water flow should be ensured in the perennial streams formai taining ecology and social considerations". However, the NWP also placesenv ronment in the fourth order of priority for allocation of water. The sequenceof p iority is drinking water, irrigation, hydropower, and then environment.
his means that at any particular location, the available water after supplyingthe equirements of drinking, irrigation and hydropower requirement, thereq irement of environment will be fulfilled. On the other hand, the conceptof a minimum flow in the river stipulates that a certain quantity of water is tobe f rst allocated to maintain this minimum flow, and all other requirementsare t be supplied only from the balance if any. This upgrades the environmentrequirements at priority one. Thus it is seen that placing of environment atfour h priority in the NWP creates a conflict with the concept of minimumflow or EFR.
Riverine and coastal biodiversity has not been adequately recognised inthe c nservation challenges ofNEP, nor the fisheries sector as such. It may benote I that exotics fishes have been introduced into the inland waters bodiesand -iverine systems without effective mechanisms to examine ecologicalcons -quences, particularly on biodiversity and aquatic life. One major concerndem nding the attention of policy makers is the question of water allocationsfor laintaining ecological services. Also as an environmental issue, the difficultproblem of land- water linkage is not being addressed in the present water orland iolicies.
TI e pressing problems of conservation and management of Inland fisheries
--~------------~~------------------

are not being addressed in the policy document. For the aquatic organismslike fish water serve as a habitat If we take the example of irrigation and floodmanagement which has relevance to fish and fisheries interesting set of supplyside and demand side option come out. For adaptation to the increased demandof water for irrigation, the supply side option aims at increasing supply.Increasing the water source for irrigation is expensive and has potentialenvironmental impact. The demand side options aims at reducing demand.They include increase use efficiency through improved technology and highprice for water and changes in cropping pattern by switching to crops thatrequire less or even no irrigation.
For flood management, supply side option include flood protectionwith levees and reservoirs, these are expensive and have potential environmentimpact. Another supply side option is to use catchment source controls toreduce peak flows; these are more effective for small floods. Demand sideoptions include improvement in flood warning and information and to curbfloodplain development. So a variety of options are available; influences onfish and fisheries depend on the details of such choices. The demand sideoptions would appear in most cases to be better choice for those interested infish and fisheries as opined by Arnell et al. (2001).
Graphic picture of water stakeholdersower Genemtio
Hydro-electric power Generators(Dams)
Flood Control )L SW(Levees) / CPCB, SP.CS, NRCD.
~ ~ ewe. cown= "~,~ '------~--'Channel straighting or re-'::: I "?h.'r. \ __ rm1'1'.m
deepening ~i (R1V(~rs) - (C"ptllrcJAquacuiture)
;/ ) /<:~.-.-.--..----- ~ A,--.._~)tt.j"ttift4tt4§ --4.(Water transfers / '--- -'
domestic usage) i-:;iiiii!iiiiiiM'-'iliIll!lmj(Waste discharge, water
extraction)
lood Control Activit
ild life conservatio ilill1iIif1ii[l:tilif1l(Gravel .•Saud, extraction
from river beds)
National Parks, Conservationareas
----------------~~~------------~-
8. Recommendations
1. Only 30% of the industries on the Ganga river system adopt any controlmeasure. Fly ash, coal ·particles, agro-industrial organic wastes andsettleable sewage have diminished benthic productivity. While sewageis taken care off to a certain extent through the Ganga action planprogrammes, the industrial wastes need effective control measures.
2. Siltation being one of the chief reasons for low productivity of riverstretches, it is necessary to promote aforestation along the catchmentareas of the river and its tributaries. Planting a 10-15 m wide strip ofland bordering the river with herbaceous plants, shrubs and small treescan act as a buffer zone.
3. Gravel and sand extraction from river beds should be restricted whereverpossible. Extractions should be confined to catchment areas where thereis already a high sand sediment input to streams.
4. Hydraulic structure, embankments or levees should be restricted to allowfree entry of fish into their known breeding grounds like oxbow lake,flood plains, low lying areas and back waters.
s. Critical water levels required for effective breeding of major carps andmaintenance of a minimum level of water downstream during the dryseason should be considered as a criterion while determining the quantumof water to be released from dams and barrages.
6. The migratory habits and behaviour of riverine fishes and prawns are tobe understood well, and any future river valley project on the river systemshould incorporate in the plan the construction of effective fish passes.Experience so far indicates that effectiveness of fish passes constructedin India are far from satisfactory. The appropriate technology for fishpass flocks based on the biological requirement of the migratory speciesneed be developed.
7. Fish along with other aquatic fauna and flora are natural claimants ofwater. But their requirements of water have always been overlookedwhile designing any project concerning modification of water courses.Care need be taken not to abstract or spoil the quantum and quality ofwater beyond their tolerance limit. Controlling the harmful effects of
----------------~4i»~----------------

these man-made interference would require the cooperation of variousagencies, such as fishery scientist, irrigation and flood control authorities,pollution control boards and general public. Fisheries scientists shouldbe involved in clearance of all development projects concerning inlandwaters.Programmes aimed at restoring the quality of river water and abatingpollution should urgently evolve viable standards for various waterquality and biological parameters stretch-wise and to ensure that thestandards are strictly adhered to by the agencies concerned. viz.industries, municipalities etc. There is also a need for a holistic bio-indicator approach using fish for evaluation of the ecological integrityof aquatic ecosystems in India.
The e are conflicting interests of various users of inland waters. Commonpro erty nature of resource with open access creates problems for management.In c se of rivers flowing through more than one state, the exploitation policiesare' t variance, with none caring for conservation or development of fisheries.A ell-defined national riverine policy needs to be evolved for optimumutili ation and conservation of fisheries resources. A coordinated mechanismma be evolved between the littoral states, fishery departments, wateraut orities and research institutions for formulation of a rational andecologically sound development and exploitation policy for fisheries of suchrive ·S. A reorientation of the water demand strategies is needed laying emphasison ) Public participation and awareness creation and b) Participation of allstak holders in decision- making at local, regional, state and national level.
9. eferences1. Agarwal,M.&Kumar,HD.I978. Physico-chemical and physiological assessment
of two mercury polluted effluents. Indian J Environ. Hth. 20: 141-155.2. Agnihotri, N.P. 1993. Contribution of agricultural application of pesticides
on quality of ground and river water. Project report, Indian AgriculturalResearch Institute, New Delhi, India.
3. Agrawal, A.; and Chak, A. 1991. Floods, Flood Plains and EnvironmentalMyths. State of India's Environment - A Citizen's Report 3. New Delhi: Centrefor Science and Environment. 167 pp.
4. Alam, N., Uma, S. & Hussain, H.M.Y. 2001. Impact of sugar mill effluentson the fish fauna of Bur hi Gandak River near Samastipur town, North Bihar.

National Seminar on Fish Health and Management organised by theDepartment of Zoology, L.N. Mithila University, Darbhanga, 25-27 March.(Abstract).
5. Anbu. M., 2002. Monitoring of POPs: A tough challenge ahead. Reportpresented at Regional Priority Setting Meeting, Region VI; Indian OceanRegion, New Delhi, Sept. 18-21,2002.
6. Anon, 1994. Studies on fish conservation in Narmada Sagar, Sardar Sarovarand its down stream. A desk review sponsored by Narmada Control Authority.Central Inland Fisheries Research Institute, Barrackpore.
7. Anon, 1978. report of Narmada Water Dispute Tribunal, Vol IV, Governmentof India.
8. Anon. 1999. Annual Report. Central Inland Capture Fisheries ResearchInstitute, Barrackpore.
9. Arnell, N., Liu, C., Compagnucci, R., Cunha, Li. Da., Hanaki, K, Howe, c.,Hailu., Shiklomanov, C. I. & Stakhiv, E. 2001. Hydrology and water resources.Chapter 4, pp. 190-233. In J.J. Mc Carthy, O.F. Canziani, N.A. Leary, D.J.Dokken and KS.White, (editors). Climate Change 2001: Impact, adaptationand vulnerability. Cambridge University Press, Cambridge, United Kingdom.
10. Ayyappan, S. and Modayil, M.J. 2007. Indian Fisheries: Highlights, Souvenir,8th Asian Fisheries Forum, Central Marine Fisheries Research Institute, Kochi.Pp 36-40
11. Babu Rajendran, R., Karunagaran, V. M., Babu, S. & Subramanian, A. N.,1992. Levels of chlorinated insecticides in fish from Bay of Bengal. Mar.Poll. Bull. 24, 567-570.
12. Bakre, P. P., Misra, V. & Bhatnagar, P. 1990. Organochlorine residues inwater from the Mahala water reservoir, Jaipur, India. Environ. Pollut. 63:275-281.
13. Banerjee, R.K, Mukhopadhyay, M.K, Pandit, P.K, Karmakar, H.C., Mitra, .K., Chatterjee, S.K, Das, B.B. and Sengupta, A. 1998. The river Darnodarand its environment. CIFRI Bull No. 79.
14. Banerjee, R.K, Pandit, P.K and Sinha, M. 1996. Chilka - Now & Then. Sci.Cult. 62 (5 & 6).
15. Canter, L.W. 1996. Environmental Impact Assessment. 2nd Ed. NY: McGraw-Hill. ECOM Program. 2002. St. Petersburg Society of Naturalists, PublicParticipation Resources Site. www.polit.spb.ru/index.php3?rub=146.
16. Chaudhury, N. 1985. Ganga needs clean up by all of us. Key note address inGanga basin conference and exposition. Calcutta, Nov. 28-30, 1985. Jour.Indian Cent. Pub. Hlth. Environ. (Spl. issue).------------------~~----------------

17. Chowdhury, A., Raha, P., Guha, P., Kole, R., Banerjee, H. & Das, M. K.1994. Effect of pesticides on the ulcerative disease syndrome on fish - a casestudy. Poll Res. 13, 161-167.
18. CIFRI. 1971-2004. Annual Report.19. CPCB (Central Pollution Control Board). 1996. Water Quality Status and
Statistics (1993 & 1994). Monitoring of Indian Aquatic Resources (MIN ARS/10/1995-96). New Delhi: Central Pollution Control Board. 459 pp.
20. CPCB. 2000. Status of water and wastewater generation, collection, treatmentand disposal in Classl1 towns, Central Pollution Control Board, Delhi
21. CPCB. 2000. Water Quality Status of Yamuna River. Assessment andDevelopment of River Basin. CPCB, MOEF: April, 2000.
22. Das M. K. and Samanta, S. 2006. Application of an index of biotic integrity(lBI) to fish assemblage of the tropical Hooghly estuary. Indian J. Fish. 53(1): 47 - 57.
23. Das, M.K. 2007b. Environment and Fish Health: A Holistic Assessment ofInland Fisheries in India. In U. C. Goswami (ed.). 'Natural and AnthropogenicHazards on Fish & Fisheries'. Narendra Publishing House, Delhi, India. pp137-151.
24. Das, M.K., and Das, R.K. 1993. A review of the fish disease epizootic ulcerativesyndrome in India. Environ. Ecol. 11: 134-148.
25. Das, M.K., Maurey, P., Brahmane, M.P., Mukhopadhyay, M.K. & Saha, P.K.2007a. Impact, Adaptation and Vulnerability of Inland Fisheries to ClimateChange. Journal of IAEM, Vol. 34(2), 68-76
26. Das, R. K., Bagchi, M. M., Mukhopadhyay, M. K., Ghosh, B. B. & Saha,Keya 1990. Impact of paper and pulp factory effluent on the fish and theirenvironment in Hooghly estuary. In. A. G. Jhingran, V. K. Unnithanand A.Ghosh. (Ed) Contributions to the Fisheries of Inland Open Water Systems inIndia (Part I).
27. David, A. 1959. Observation of the some some spownimng ground of theGengetic major carps with a note on carp seed resources in India. Indian J.fish. 6(2): 327-341.
28. Dey, S., Srivastava, P.K., Maji, S., Das, M.K., Mukhopadhyaya, M.K. andSaha, P.K. 2007. Impact of climate change on the breeding of Indian MajorCarps in West Bengal J. Inland Fish. Soc. India, 39 (1):26-34.
29. Ganesan, V., Srinivasulu, K. and Pandey, A. K., 1991. Trace metalconcentration in water and sediments of the river Khan and Kshipra (Ujjain).Tnt. J. Eco. Env. Sci. 17(3),225-236.

30. Ghosh, B.B.; Bagchi, M.M. and De, D.K. (1983) Some observations on thestatus of pollution in the Hooghly estuary (West Bengal) with reference toheavy metals deposited through industrial wastes. J. Inland Fish. Soc. India15(1 & 2): 44-53.
31. Ghosh, T.K. & Konar, S.K. 1993. Mass' mortality in fish in the riverMathabhanga - Churni, West Bengal. Environ. Ecol. 11: Pages 833-838.
32. Gopal, B.; and Chauhan, M. 2003. River Restoration in India: A Case Studyof River Yamuna East Asia Regional Seminar on River Restoration, KualaLumpur, January 13-15,2003.
33. Groombridge, B.; and Jenkins, M. 1998. Freshwater Biodiversity: Apreliminary global assessment. World Conservation Monitoring Centre(WCMC) Biodiversity Series No.8. World Conservation Press. http://www.unep-wcmc.org/resources/publications/biodiv_series.htm .
34. Gupta, G.P. 1975. Sediment production status reports on data collection andutilization. Soil Cons. Digest. 3(2): 10-21.
35. Halder, P., Raha, P., Bhattacharya, A., Chowdhury, A. & Adityachowdhury,N. 1989. Studies on the residues of DOT and endosulfan occurring in Gangawater. Indian J. Environ. Health. 31, 156-161.
36. Hasnain, S.l. 2002. Himalayan Glacier melts down: impact on South AsianRivers. IAHS Pub No. 274, pp: 1-7.
37. ICAR, 2002. All India Coordinated Research Project on Pesticide Residue.ICAR, Annual Report, 2001 and Proc. of the Group Meeting held at GujaratAgril. University, Anand, Feb. 1-2,2002.
38. India's Initial National Communication to the United Nations FrameworkConvention on Climate Change, 2004. Ministry of Environment and Forests,Government of India
39. India-ej News, 13th July.200340. Israili, Abdul Wahid. 1991. Occurrence of heavy metals in Ganga river water'
and sediments of western Uttar Pradesh. Poll. Res. 10(2), 103-109.41. Jhingran A. G. 1991. Impact of environmental stress on fresh waster fisheries
resources. J. Inland. Fish. India, 23 (2): 20-32.42. Jhingran, A.G. & Ghosh. 1978. The fisheries ofthe Ganga river system in the
context ofIndian aquaculture. Aquaculture. 14: 141-162.43. Jhingran, A.G. 1989. A synopsis. Impact of environmental perturbations on
the fisheries ecology of river Ganga. CIFRI. Barrackpore. Kolkata.44. Jhingran, G. A. & Joshi, H. C. 1987. Heavy metals in water sediments and
fish in the river Yamuna. J. Inland Fish. Soc. India, 19(1), 13-23.
-----------------~-----------------

45. Joshi, H. C. 1986 a. In: Proceedings of the National Seminar on PollutionControl and Environmental Management, NEERI, Nagpur, l7-19 Mar. pp80-86.
46. Joshi, H. C. 1986 b. DDT residues in fish in the river Hooghly. In: Proceedingsof the Symposium on Pesticide Residue and Environmental Pollution,
\Muzaffarnagar, 2-4 Oct. pp 93-96.
47. Joshi, H. C. 1994. Environmental constraints in management of fisheries ininland open waters systems in India.pp 8-19 In Manas Kr. Das and P.KChakraborty (eds) Contribution to the Fisheries ofInland Open Water Systemsin India Part II. Inland Fisheries Society of India, Barrackpore.
48. Joshi, H. c., 1991. Monitoring of toxic and hazardous substances in the riverGanga. In: R Gupta (Ed), Proc. Work.Trg. Biomon .., 62-68.
49. Kadota, T., Seko, K & Ageta, Y. 1993. Shrinkage of glacier AXO 10 since1978, Shorong Himal, east NepaUn: Young GJ. (ed) Snow and GlacierHydrology (Proc. Kathmandu Symp. Nov. 1992IAHS Pub\. No. 218,145-154.
50. Kaphalia, B. S., Nigam, U., Mehrotra, S., Seth, T. D. 1986. Fresh water fish:an indicator of pesticide contamination in the aquatic environment. J. Environ.Bioi., 7, 1-9.
51. Kaunan, K, Sinha, RK. Tanabe, S., lchihashi, H., Tatsukawa, R. 1993. Heavymetals and organochlorine residues in Ganga river dolphins from India. Mar.PoIlut. Bull. 26(3): 159-162.
52. Kaushik, S., Sahu, B. K., Lawania, R K and Tiwari, R K, 1999. Occurrenceof heavy metals in lentic water of Gwalior region. Poll. Res. 18(2), 137-140.
53. Konar, S.K 1979. Hazards of water pollution by pesticides. Proceedings ofthe Symp. Environ. Pollut. & Toxicol. Pages 83-94.
54. Koshy and Nayar, T. Vasudevan, 2002. Trace metals in the sediments of riverPamba. Poll. Res. 2,1(3),235-242.
55. Krishnamurthy, S. R & Bharat, S. G. 1994. Studies on the metal pollution ofthe river Kali around Dandeli, (North Kanara district), Karnataka, India. Poll.Res. 13 (3), 249-251.
56. Kulasrestha, S. K, 1989. Monitoring and surveillance of residues oforganochlorine pesticides and heavy metals in fishes from selectedenvironmental components of Madhyapradesh and Rajasthan. Project report,Motilal Vigyan Mahavidyalaya, Bhopal, India.
57. Kumar, S. 1989. Heavy metal pollution in Gomoti river sediments aroundLucknow, Uttar Pradesh. Curro Sci. 58(10),557-559.
-----------------~-----------------

58. Kumari, A. & Sinha, R.K. 2001. Concentration of organochlorine pesticideresidues in Ganga water in Bihar, India. Environ. Ecol. 19(2), 351-356.
59. Ministry of Chemicals & Fertilizers 2003. Annual report 2002-03, Governmentof India New Delhi.
60. Ministry of Environment and Forestry. 1992. Policy Statement for Abatementof Pollution. Government of India, New Delhi.
61. Ministry of Environment and Forestry. 1997. Minutes of the ConsultativeCommittee of the Member of Parliament attached to the Ministry ofEnvironment and Forestry. Government ofIndia, New Delhi.
62. Mitra, A., Trivedi, S., Gupta, A., Choudhuri, A., & Choudhuri, A. 1996.Distribution of trace metals in the sediments from Hooghly estuary, India.Poll. Res. 15(2),137-141.
63. Mohammad, A., Rozi, D. & Ullah, K. A. 1987. Monitoring of heavy metalsin the water and sediment of Ganga river. India Water Sci. Tech. 19(9), 107-117.
64. Mukhopadhyay, M. K., 2003. Status and methods of assessment of heavymetals in aquatic ecosystem in India in relation to fish health. CIFRI, Bull.No.ll5,70-73.
65. Murthy, c.K. 1984. A few aspects offish hill in Tungabhadra River DharwadDistrict during Feb., 1984.Report of the Department of Fisheries, Dharwad, 6 p.
66. Namalwar, P. 1985. Heavy metal pollution in Adayarestuary, Madras. Nationalsymp. on Assess. Environ. Proc. 235-238.
67. Natrajan, A.V. 1989. Environmental impact of Ganga basin development onGene-Pool and fisheries of the Ganga river system. P.545-560. in D.P. Dodge(ed) proceedings of the international large river system symposium. Can. Spc ..Pub!. Fish. Aquat. Sci. 106.
68. Nayak, A. K., Raha, R. & Das, A. K., 1995. Organochlorine pesticide residuesin middle stream of the Ganges river, India. Bull. Environ. Contam. Toxicol.54,68-75.
69. Nigam, D., Hans, R. K., Prakash, S., Seth, T. D. & Siddiqui, M. K. 1. 1998.Biomagnification of organochlorine pesticides and metals in biota of an Indianlake. Poll Res. 17,83-86.
70. Panday, K.S. and Sharma, S.D. 1999. Distribution of organic matter and toxicmetals in the sediment of Ramganga rivers at Muradabad. Poll. Res. 18,43-47.
71. Pantalu, V.R.., Alagaraja, K. and Bhimchar, B.S. 1966. Fisheries of theDamodar velley in relation to construction of dam. Proc. Nat. Inst. Sci. India.32B (5&6): 191-207.
72. Pillai, M. K M. & Agarwal, H. C. 1979. Final report on the project DOTresidues and its degradation in the soil, water and few aquatic animals of riverJamuna in Delhi. Department of Science and Technology, New Delhi.
73. Pillai, M. K M. & Agarwal, H. C. 1979. Final report on the project DDTresidues and its degradation in the soil, water and few aquatic animals of riverJamuna in Delhi. Department of Science and Technology, New Delhi.
74. Prasad, S., Mathur, A. & Rupainwar, D. D. 1989. Heavy metals distributionin the sediments and sewer - river confluence points of river Ganga in Varanasi- Mirzapur region. Asian Env. 11(2), 73-82.
75. Qasim, S.Z. & Siddiqui, R.H. 1960. Preliminary observation on the pollutionof the river Kali caused by the effluent of industrial wastes. Curr Sci.8: 310-31l.
76. Raghavan S. L., Sukumaran, P. K, Govind, B. V. & Naija, I. 1977. A case offish mortality in Byramangala reservoir. 1. Inland Fish .Society. India. 9: 203-204.
77. Ramesh, A., Tanabe, S., Iwata, H., Tatsukawa, R. 1990a. Seasonal variationof persistent organochlorine insecticide residues in Vellar river water inTamilnadu, South India. Environ. Pollut. 67,289-304.
78. Ramesh, A., Tanabe, S., Karman, K, Subramanian, A.N., Kumaran, P.L. &Tatsukawa, R. 1992. Characteristic trend of persistent organochlorinecontamination in wild life from a tropical agricultural watershed, South India.Arch. Environ Contam. Toxicol. 23,26-36.
79. Ramesh, A., Tanabe, S., Subramanian, A. N., Mohan, D. & Venugopalan, V.K 1990b. Persistent organochlorine residues in green mussels from coastalwaters of South India. Mar. Pollut. Bull. 21,587-590.
80. Ramesh, R., Ramanathan, A. L., James, R. Arther., Subramanian, V., Jacobsen,S. B. & Holland, H. D. 1999. Rare earth elements and heavy metals distributionin estuarine sediments of east coast India. Hydrobiologia. 397, 89-99.
81. Rao, KL. 1979. India's water wealth: its assessment, uses and projection.Ilnd ed. Orient Longman Limited, New Delhi. 267p.
82. Ray, P.K 1992. Measurement of Ganga river quality- heavy metals andpesticides. Project report, Industrial Toxicology Research Centre, Lucknow,India.
83. Saha, P. K, Md., Aftabuddin & Sarkar, A. 2003. Total and DTPA extractablezinc, copper, iron and manganese in some beel soils of Assam, India. 1. InlandFish. Soc. India 35(2), 62-67.
--------------------~-------------------

84 Saikia, D. K., Mathur, R. P. & Srivastava, S. K. 1988. Heavy metals in waterand sediments of upper Ganga. Indian 1. Environ. 1, 11-17
85 Samanta S. (2007) Pesticide use and its implications on the Indian aquaticecosystems with special emphasis on fishery. In U. e. Goswami (ed.). 'Naturaland Anthropogenic Hazards on Fish & Fisheries '. Narendra Publishing House,Delhi, India. pp 305-326.
86. Samanta, S. 2006. Organochlorine pesticide residue studies in fish of the riverGanges in West Bengal. Pes tic. Res. 1. 18, (in press).
87. Samanta, S. Chandra, K., Manna, S. K. and Saha, K. 2007. Sediment status ofthe Hooghly and Haldi estuaries at Haldia industrial area with special referenceto trace metals. 1. Indian Soc. Soil Sc. (in press).
88. Samanta, S. Mitra, K., Chandra, K, Saha, K., Bandopadhyay, S. and Ghosh,, A. 2005. Heavy metal in water of the rivers Hooghly at Haldia and theirimpact on fish. 1. of Environ. Biol. 26(3),517-523.
89.' Samanta, S., Mitra, K., Chandra, K, Saha, K., Bandopadhyay, S. & Ghosh,A., 2005. Heavy metals in water of the rivers Hooghly and Haldi at Haldiaand their impact on fish. 1. Eviron. Biol. 26(3), 517 -523.
90. Samanta, S., Sharma, A., Sarkar U. K., & Mahaver, L. R., 2005. Organochlorinepesticide residues in water and fish from a sewage fed bheri and a floodplainwetland in West Bengal. Environ. Ecol. 23, 149-153.
91. Sen, R.N. & K. Prashad.1991. Vayu Mandal, 69-82.92. Senthilkumar, K., Karman, K., Sinha, R. K, Tanabe, S. & Giesy, J. P. 1999.
Bioaccumulation profiles of polychlorinated biphenyl congeners andorganochlorine pesticides in Ganges river dolphins. Environ. Toxicol. Chem.18, 1511-1520.
93. Shetty, H.P.e. and Malhotra, J.e. 1983. A report on the survey of north Biharin relation to effects of Gandak and Kosi river valley projects on the fisheriesof the area. Survey report 7. CIFRI. Barrackpore. 30. Kolkata.
94. Shrivastava, Pradeep, Saxena, Alok and Swamp, Abha, 2003. Heavy metal'pollution in a sewage fed lake of Bhopal (M. P.), India. Lakes & Reservoirs:'Research and Management, 1-4.
95. 'Singh, H. P. & Mahaver, L. R. 1997. Preliminary observation on heavy metalsin water and sediments in a stretch of river Ganga and some of its tributaries .. Environ. Bioi. 18(1),49-53.
96. ingh, K. P. 1992. Measurement of Ganga river quality with particulareference to heavy metals and pesticides. Project report, NRCD funded projectonducted by ITRC, Lucknow.

97. Sinha, R. K., Sinha, S. K., Kedia, D. K., Kumari, A., Rani., Sharma; N. G.,Prasad, K. 2007. A holistic study on mercury pollution in the Ganga Riversystem at Varanasi, India. Curr Sci. 92 (9):1223-1228.
98. Subramanian, V., Van, T. Dack, & Van, Grieken R. 1985. Chemicalcomposition of river sediments from the Indian Sub continent. ChemicalGeology. 81,241-253.
99. Sunderesan, B.B., Subrahmanyam, P.V.R. & Bhide, A.D. 1983. An overviewof toxic and hazardous waste in India, UNEP Industry & Environment (Spec.Issue),p.70-73.
100. Sundersan, B.B. 1982. State of environment in India-Environment pollution.Keynote address. l " National Environmental Congress. IARI, New Delhi,28-30, 14p.
101. Thakar, N. 1986. Pesticide pollution levels in some urban water sources.IAWPC Tech. Annual. 13, 103-109.
102. The Hindu, n- May 2005103. The New Indian Express, 200l. 25 (20),9.104. The Tribune, Chandigarh. 24thNovember, 200l.
105. UNEP, 2002. Regionally Based Assessment of Persistent Toxic Substances.United Nations Environment Programme, Chemicals. Indian Ocean regionalreport. Global Environment Facility, pp 1-93 (available in: http://www.chem.unep.ch/ptslregreports/IndianOcean .pdf).
106. Vass, K. K., Mukhopadhayay, M. K., Mitra, K., Bagchi, M. M. andBandopadhyay, S. (1998) Fish as biomonitoring tool for environmental.impactassessment in Ganga river system. In K.K. Vass and M. Sinha (eds.) 'ChangingPerspecti ves in Inland Fisheries'. Proceedings of the National Seminar, March16-17, Inland Fisheries Society of India, Barrackpore, West Bengal. pp.15-23.
107. Veeraiah, K. & Durga Prasad, M. K. 1996. A study on the organochlorinepesticide residue input into lake Kolleru through Tamilleru river. Ecol. Env.& Cons. 2, 83-86.
-----------------~~---------------