Embed Size (px)
Citation preview
Massachusetts Division of Marine Fisheries Technical Report TR-54
River Herring Spawning and Nursery
Habitat Assessment
Silver Lake 2008-2009
Tec
hn
ica
l Re
po
rt
B. C. Chase1, A. Mansfield2, and Pine duBois2
1Massachusetts Division of Marine Fisheries
South Shore Field Station
1213 Purchase Street, 3rd Floor
New Bedford, MA 02740
2Jones River Watershed Association
55 Landing Road
Kingston, MA 02364
Commonwealth of Massachusetts
Executive Office of Energy and Environmental Affairs
Department of Fish and Game
Massachusetts Division of Marine Fisheries
August 2013
Massachusetts Division of Marine Fisheries Technical Report Series Managing Editor: Michael P. Armstrong
Technical Editor: Elaine Brewer The Massachusetts Division of Marine Fisheries Technical Reports present information and data pertinent to the
management, biology and commercial and recreational fisheries of anadromous, estuarine, and marine organisms of the
Commonwealth of Massachusetts and adjacent waters. The series presents information in a timely fashion that is of
limited scope or is useful to a smaller, specific audience and therefore may not be appropriate for national or
international journals. Included in this series are data summaries, reports of monitoring programs, and results of
studies that are directed at specific management problems. All Reports in the series are available for download in PDF format at:
http://www.mass.gov/eea/agencies/dfg/dmf/publications/technical.html or hard copies may be obtained from the Annisquam
River Marine Fisheries Station, 30 Emerson Ave., Gloucester, MA 01930 USA (978-282-0308).
Recent publications in the Technical Report series:
TR-53 Nelson, G. 2012. Massachusetts Striped Bass Monitoring Report for 2011.
TR-52 Camisa, M. and A. Wilbur. 2012. Buzzards Bay Disposal Site Fisheries Trawl Survey Report March 2001-March
2002. TR-51 Wood, C. H., C. Enterline, K. Mills, B. C. Chase, G. Verreault, J. Fischer, and M. H. Ayer (editors). 2012. Fourth North
American Workshop on Rainbow Smelt: Extended Abstract Proceedings.
TR-50 Hoffman, W. S., S. J. Correia, and D. E. Pierce. 2012. Results of an industry-based survey for Gulf of Maine cod, May
2006-December 2007.
TR-49 Hoffman, W. S., S. J. Correia, and D. E. Pierce. 2012. Results of an industry-based survey for Gulf of Maine cod,
November 2003—May 2005.
TR-48 Nelson, G. A. 2011. Massachusetts striped bass monitoring report for 2010.
TR-47 Evans, N. T., K. H. Ford, B. C. Chase, and J. J. Sheppard. 2011. Recommended time of year restrictions (TOYs) for
coastal alteration projects to protect marine fisheries resources in Massachusetts. TR-46 Nelson, G. A., P. D. Brady, J. J. Sheppard, and M. P. Armstrong. 2011. An assessment of river herring stocks in
Massachusetts.
TR-45 Ford, K. H., and S. Voss. 2010. Seafloor sediment composition in Massachusetts determined through point data.
TR-44 Chase, B. C., T. Callaghan, M. B. Dechant, P. Patel. 2010. River herring spawning and nursery habitat assessment:
Upper Mystic Lake, 2007-2008.
TR-43 Evans, N. T., and A. S. Leschen. 2010. Technical guidelines for the delineation, restoration, and monitoring of
eelgrass (Zostera marina) in Massachusetts coastal waters.
TR-42 Chase, B. C. 2010. Quality assurance program plan (QAPP) for water quality measurements for diadromous fish
monitoring 2008-2012, version 1.0.
TR-41 Nelson, G. A. 2010. Massachusetts striped bass monitoring report for 2009.
TR-40 Pol, M., P. He, and P. Winger. 2010. Proceedings of the international technical workshop on gadoid capture by pots
(GACAPOT).
TR-39 Dean, M. J. 2010. Massachusetts lobster fishery statistics for 2006.
TR-38 King, J. R., M. J. Camisa, V. M. Manfredi. 2010. Massachusetts Division of Marine Fisheries trawl survey effort, list
of species recorded, and bottom temperature trends, 1978-2007.
TR-37 Leschen, A. S., R. K. Kessler, and B. T. Estrella. 2009. Eelgrass restoration used as construction impact mitigation in
Boston Harbor, Massachusetts.
TR-36 Nelson, G. A. 2009. Massachusetts striped bass monitoring report for 2008.
TR-35 Barber, J. S., K. A. Whitmore, M. Rousseau, D. M. Chosid, and R. P. Glenn. 2009. Boston Harbor artificial reef site
selection and monitoring program.
TR-34 Nelson, G. A. 2008. 2007 Massachusetts striped bass monitoring report.
TR-33 Chase, B. C., Plouff, J. H., and M. Gabriel. 2007. An evaluation of the use of egg transfers and habitat restoration to
establish an anadromous rainbow smelt spawning population. TR-32 Nelson, G. A. 2007. 2006 Massachusetts striped bass monitoring report.
TR-31 Dean, M.J., S. R. Reed, and T.B. Hoopes. 2007. 2005 Massachusetts lobster fishery statistics.
TR-30 Chase, B. C. 2006. Rainbow smelt (Osmerus mordax) spawning habitat on the Gulf of Maine coast of Massachusetts.
TR-29 Glenn, R., T. Pugh, J. Barber, and D. Chosid. 2007. 2005 Massachusetts lobster monitoring and stock status report.
TR-28 Nelson, G. A. 2006. 2005 Massachusetts striped bass monitoring report.
TR-27 Estrella, B. T., and R. P. Glenn. 2006. Lobster trap escape vent selectivity.
TR-26 Dean, M. J., S. R. Reed, and T. B. Hoopes. 2006. 2004 Massachusetts lobster fishery statistics.
TR-25 Nelson, G.A. 2006. A guide to statistical sampling for the estimation of river herring run size using visual counts.
Massachusetts Division of Marine Fisheries Technical Report TR-54
River Herring Spawning and Nursery Habitat Assessment
Bradford C. Chase Massachusetts Division of Marine Fisheries
1213 Purchase Street, 3rd Floor
New Bedford, MA 02740
Alex Mansfield and Pine duBois Jones River Watershed
55 Landing Road
Kingston, MA 02364
August 2013
Commonwealth of Massachusetts
Deval Patrick, Governor
Executive Office of Energy and Environmental Affairs
Richard K. Sullivan, Jr., Secretary
Department of Fish and Game
Mary B. Griffin, Commissioner
Massachusetts Division of Marine Fisheries
Paul Diodati, Director

1
Introduction
Silver Lake is the primary headwaters of the
Jones River watershed and the largest lake in the
South Shore Coastal Drainage Area of
Massachusetts. Silver Lake is a naturally formed
lake of 634 acres that is over 3 km in length with a
maximum depth of about 20 m. The Jones River
runs for 12 km from Silver Lake to Kingston Bay
with a drainage area of 77 km2. The Jones River is
the largest freshwater drainage to Cape Cod Bay.
Silver Lake is included in or borders the towns of
Pembroke, Kingston, Plympton, and Halifax. Silver
Lake receives tributary flow from Tubbs Meadow
Brook in Pembroke, Mirage Brook in Kingston, and
seasonal water supply diversions; but is mainly
recharged from groundwater (WAA 2006). The
U.S. Geological Service has maintained a Jones
River stream flow gauge at the Elm Street Dam
since 1966 (# 01105870, contributing drainage area
= 40.7 km2). The mean monthly discharge at this
station for April for 1966-2011 is 57 cfs.
Silver Lake was selected for monitoring
following ongoing discussions with the Jones River
Watershed Association (JRWA) on restoring
diadromous –or sea-run fish that move between salt
and fresh water – fish in the watershed. Restoring
fish passage to Silver Lake is one of the highest
ranking restoration priorities for MarineFisheries in
the South Shore Coastal Drainage Area. The JRWA
has a long history of working to improve water
management and restoring natural connectivity in
the Jones River watershed. These mutual interests
led to a partnership with JRWA to conduct a two-
year river herring spawning and nursery habitat
assessment starting in 2008.
Diadromous Fisheries. The Jones River
estuary historically supported large and diverse runs
of diadromous fish that were valued by the
Plymouth Colony in the 17th and 18th centuries
(Iwanowicz et al. 1974). The Jones River was
subject to early fish passage regulations in
Massachusetts that required mill owners to provide
passage for sea-run fish starting in 1667.
The Belding survey (1921) described two dams
that prevented passage to Silver Lake but noted
efforts spanning from 1872 to 1913 to maintain an
alewife fishery by moving fish from below the first
dam to Silver Lake. In 1909, the Town of Kingston
closed alewife harvest and in 1913 appropriated
funds to construct fishways at the dams (Belding
1921).
The MarineFisheries fish passage survey in the
late 1960s (Reback and DiCarlo 1972) documented
the presence of a concrete fishway at the Elm Street
Dam and a run of alewives that were spawning in
three ponds in the Furnace Brook sub-watershed.
The most recent MarineFisheries fish passage
survey (Reback et al. 2004) reported the continued
presence of a river herring run, the installation of an
Abstract: River herring are native, diadromous fish that make spring spawning runs to coastal
rivers in Massachusetts seeking suitable freshwater habitat for egg incubation and juvenile rearing.
River herring is the common name for two similar species; the alewife (Alosa psuedoharengus) and
blueback herring (Alosa aestivalis). River herring are important forage for many species of fish and
wildlife and formerly supported valuable commercial, recreational, and subsistence fisheries. The
Massachusetts Division of Marine Fisheries (MarineFisheries) conducts river herring spawning and
nursery habitat assessments to assist habitat and population restoration efforts and to contribute to
Massachusetts Department of Environmental Protection (MassDEP) Waterbody Assessments. Silver
Lake, in the Jones River Watershed, was assessed during 2008-2009 in collaboration with the Jones
River Watershed Association. At the time of the assessment, two impassable dams prevented river
herring from accessing the 643 acres of potential spawning and nursery habitat in Silver Lake. Project
partners initiated the assessment to confirm the status of Silver Lake for supporting the restoration of
sea-run fish. A comparison of field data to river herring habitat assessment criteria resulted in the
classification of: Impaired for dissolved oxygen, pH, total nitrogen, total phosphorus, fish passage, and
stream flow; and Suitable for water temperature and Secchi disc. Despite the finding of impairment
among assessment criteria, several parameters had marginal exceedances or were limited spatially due
to seasonal stratification and would not be considered a threat to early life stages of river herring.
Overall, much of Silver Lake had water quality conditions that would support river herring spawning
and nursery habitat requirements. The most significant impairment for the goal of restoring river
herring to Silver Lake was fish passage obstruction at Forge Pond Dam and reduced stream flow that
could prevent juvenile herring emigration during summer and early fall.
2
Alaskan steeppass fish ladder at Elm Street Dam in
2001, and noted the continued challenges of
obstructions at Wapping Road Dam and Forge Pond
Dam, and water supply management at Silver Lake.
In 2011, the Wapping Road Dam was removed,
eliminating a significant barrier to fish passage.
The JRWA leads a counting effort of river
herring each year at the Elm Street Dam that
produces a statistical run estimate (Nelson 2006).
The effort has documented a spawning run of river
herring that is likely a small proportion of the run
size existing prior to watershed alterations. The run
estimates from 2005 to 2012 range from 560 to
4,512.
As with river herring, the presence of other
diadromous species has attracted ongoing
monitoring efforts in the Jones River. The Jones
River rainbow smelt (Osmerus mordax) run was
considered one of the largest runs in Massachusetts
in the 1960s and 1970s (Iwanowicz et al. 1974;
Lawton et al. 1990). A more recent survey found
the amount of available smelt spawning habitat in
the Jones River remained among the largest for
Massachusetts rivers, however the run size has
declined since the 1970s studies (Chase 2006).
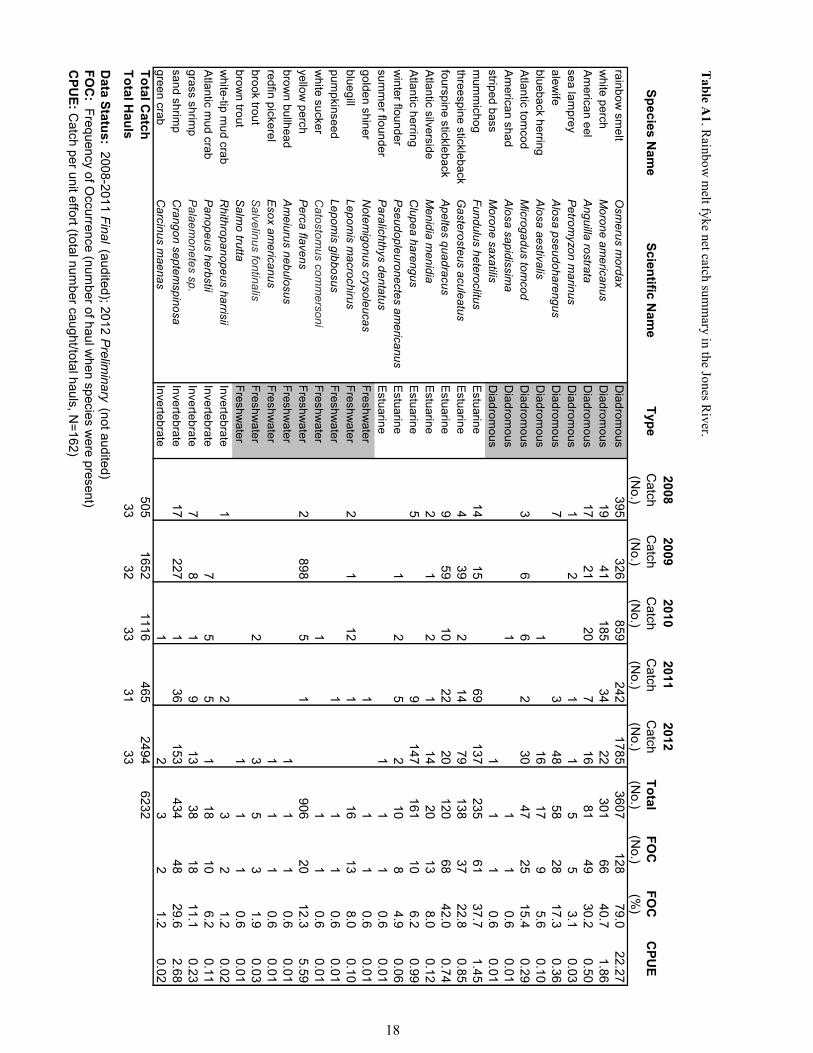
A current MarineFisheries smelt fyke net study
has confirmed the presence of nine species of
diadromous fish in the Jones River (Enterline et al.
2013; Table A.1.). MarineFisheries has maintained
a young-of-the-year eel monitoring station at the
Elm Street since 2001 that serves as a population
index of abundance for the Atlantic States Marine
Fisheries Commission (ASMFC) American eel
stock assessment (ASMFC 2012).
Water Supply Management. Silver Lake is a
vital water supply for the City of Brockton and
contributes to the Towns of Whitman and Hanson
water needs. State legislation in 1899 allowed
Brockton to divert water from Silver Lake. Over
time, Brockton's water supply grew to involve a
network of three reservoirs: Silver Lake in the Jones
River watershed, Monponsett Pond in the Taunton
River watershed, and Furnace Pond in the North
River watershed. Presently, over 90% of
Brockton's water for over 150,000 citizens comes
from these three reservoirs. Brockton's Water
Management Act (WMA) registration allows the
withdrawal of 11.11 MGD from the three
reservoirs. Since 1967, they have been allowed to
divert water from Monponsett Pond and Furnace
Pond into Silver Lake between October and May.
A water treatment plant on the shore of Silver Lake
in Halifax treats the water and sends it over 30 km
to the City of Brockton where it is distributed to
consumers and ultimately discharged to the Taunton
River watershed. Further details on the complex
infrastructure and authorizations related to Silver
Lake water management are available from several
sources (GZA 2003; HMA 2006; City of Brockton
2009; and Gomez and Sullivan 2013).
Assessment QAPP. The assessment of river
herring spawning and nursery habitat is a process
conducted by MarineFisheries to aid in the
management and restoration of diadromous fish
resources and the evaluation of waterbodies by the
Massachusetts Department of Environmental
Protection (MassDEP) as required by Section 305
(b) of the Clean Water Act (CWA). The river
herring habitat assessment follows a MassDEP-
approved Quality Assurance and Program Plan
(QAPP) on water quality measurements for
diadromous fish monitoring (Chase 2010).
MassDEP will only accept data for 305(b)
watershed assessments that were collected under an
approved QAPP. The 305(b) process evaluates the
capacity of waters to support designated uses as
defined by Massachusetts Surface Water Quality
Standards (SWQS). Waterbodies are assessed as
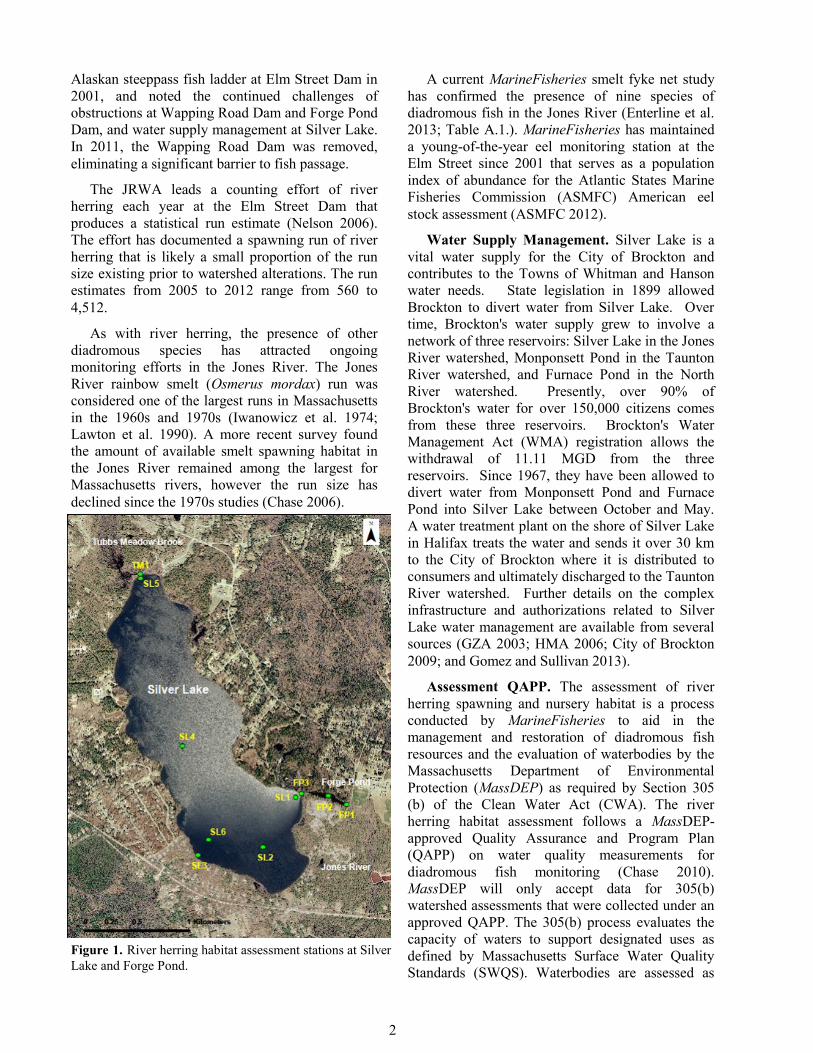
Figure 1. River herring habitat assessment stations at Silver
Lake and Forge Pond.
3
Support, Impaired, or Unassessed for specific
designated uses, such as Aquatic Life, as part of the
MassDEP 305(b) reporting requirements. Impaired
or threatened waters that require a Total Maximum
Daily Load (TMDL) estimate for specified
pollutants are placed on the 303(d) list. Starting in
2002, MassDEP combined reporting requirements
for the 303(d) list and 305(b) report into an
Integrated List of Waters for Massachusetts
(MassDEP 2009). The QAPP relates diadromous
fish life history requirements to water quality
criteria, and provides habitat sampling protocols
that contribute data to the 305(b) process for
assessing the designated use of Aquatic Life.
MassDEP Water Quality Status. The
MassDEP 2008 Integrated List of Waters records
Silver Lake (Segment MA94143) as Category 4
(Impairment not caused by pollutant) (MassDEP
2009). This impairment is identified in the 2001
South Shore Coastal Watersheds Water Quality
Assessment as flow alteration from water
withdrawals for the Brockton water supply
(MassDEP 2006). The same assessment also lists
two of three Jones River segments downstream of
Silver Lake – Wapping Road Dam (removed in
2011) and Forge Pond Dam – as Impaired for the
designated use of Aquatic Life primarily due to
flow alteration but also low dissolved oxygen and
fish passage barriers.
Methods
The river herring habitat assessment
methodology is fully outlined in MarineFisheries’
QAPP (Chase 2010). The assessment relates river
herring life history requirements to three categories
of reference conditions: Massachusetts SWQS
(MassDEP 2007), US Environmental Protection
Agency (US EPA) nutrient criteria
recommendations (US EPA 2001), and the Best
Professional Judgment (BPJ) of MarineFisheries
biologists. Monthly assessment trips were made to
Silver Lake and Forge Pond during the May-
September period when adult river herring
spawning and juvenile occupation of the lake would
occur if passage was available. Water quality
measurements are made at the surface (0.3 m depth)
and bottom (0.5 m from bottom) and at consistent
intervals at deeper stations. The following basic
water quality parameters were measured with a YSI
6920 sonde: water temperature, dissolved oxygen
(DO), pH, specific conductivity, turbidity, and
Secchi disc depth. Water temperature, DO, and pH
were related to SWQS water quality criteria.
Monthly sampling of total phosphorus (TP) and
total nitrogen (TN) was conducted by JRWA for
their watershed baseline index monitoring. The TP,
TN, and Secchi disc data were related to US EPA
nutrient criteria recommendations. Finally, QAPP
reference conditions for fish passage, stream flow,
and eutrophication were assigned with each
monthly visit based on BPJ. The sampling data
were combined for the two seasons to produce a
classification (Suitable or Impaired) for each
parameter. Criteria excursions of ≤10% or N=1
(when N = <10) for parameter measurements at
transect stations are acceptable for a Suitable
classification. All excursions that exceed the
thresholds result in an Impaired classification.
October sampling was added to this assessment to
investigate water quality in relation to water supply
operations. However, in accord with the QAPP
design, these data were not used to calculate
excursion percentages in the classification.
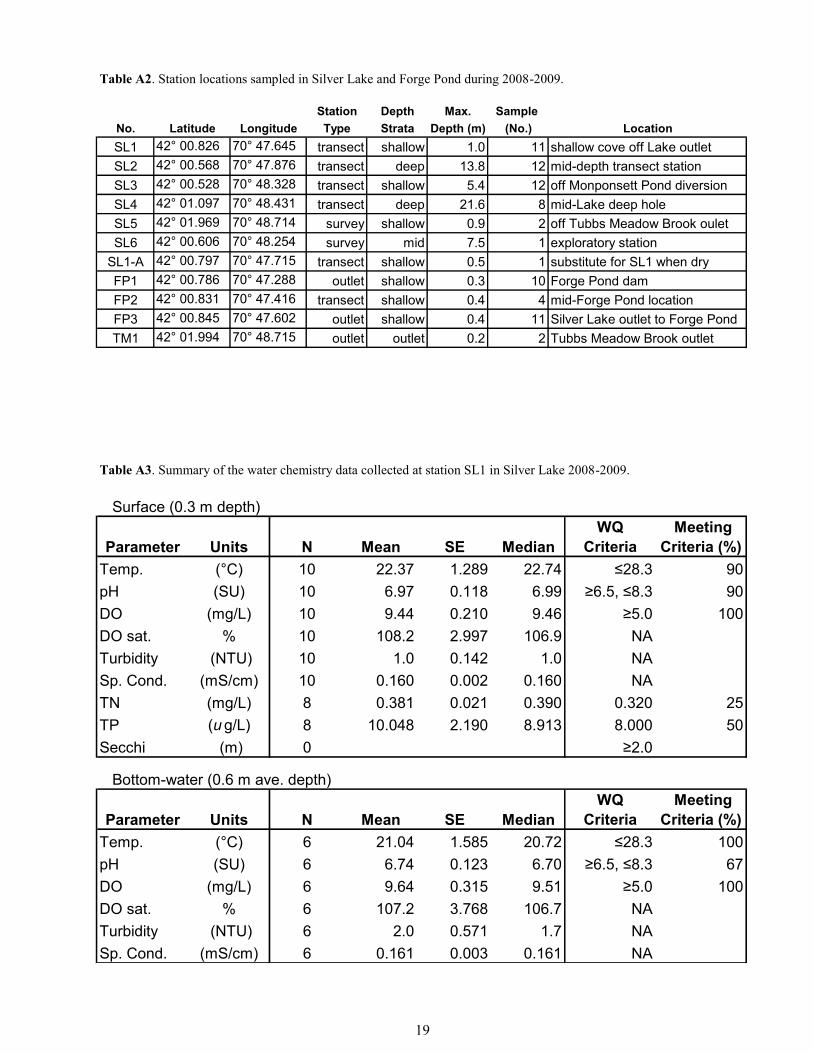
Assessment Stations. Stations were selected to
provide a transect starting at the lake outlet that
contained shallow, medium, and deep depth strata
based on lake bathymetry. Secondly, sampling
stations were set for primary inlets and outlets to the
lake and several off-transect stations were visited
periodically to gain information about other
locations in the lake. The assessment classification
was based on stations SL1, SL2, and SL3 selected
along a transect line running from the Silver Lake
outlet to the Monponsett Pond diversion outlet and
one additional deep station, SL4 (Figure 1; Table
A.2). Three stations were routinely sampled in
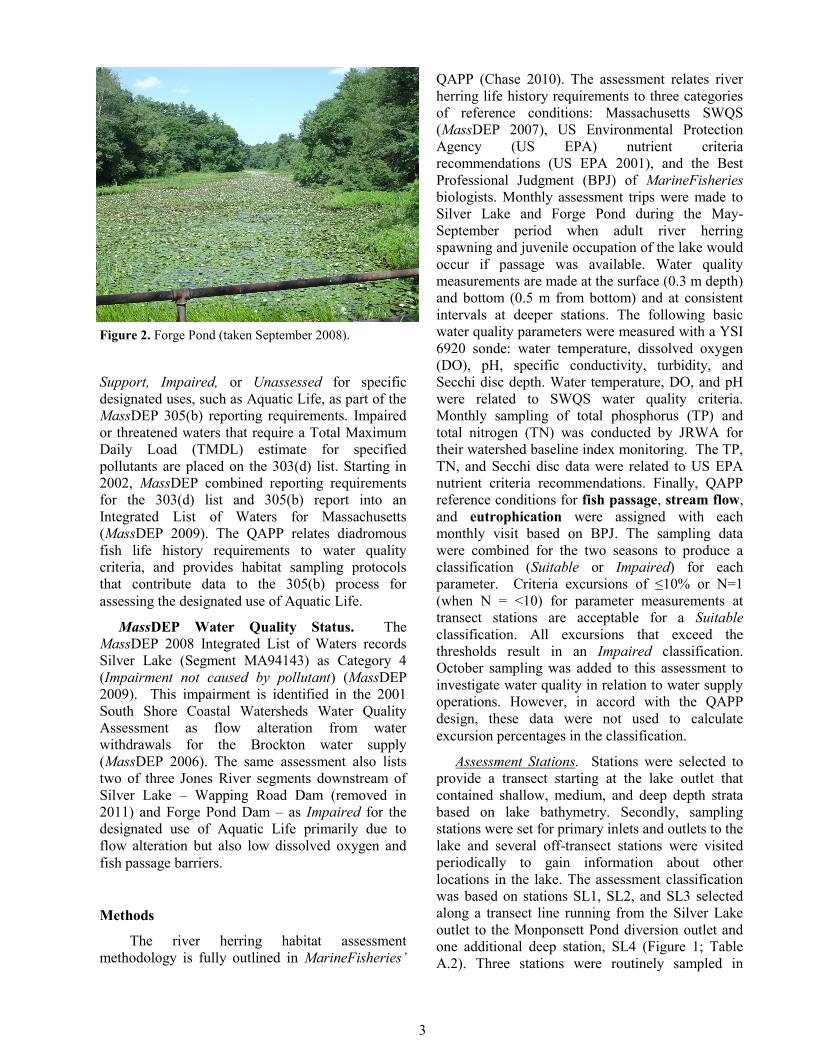
Figure 2. Forge Pond (taken September 2008).
4
Forge Pond and three exploratory Silver Lake
stations as well as a station at Tubbs Meadow
Brook were visited periodically.
Nutrient Criteria. The US EPA nutrient criteria
recommendations are based on the percentile
distribution of TN and TP measurements in a
designated Ecoregion. The nutrient criteria were
derived by calculating a 25th percentile for each of
the four seasons with pooled data from all sampling
stations in an Ecoregion. A median is then
calculated from the four seasonal 25th percentiles
that represents a threshold between minimally
impacted and impaired habitats. The QAPP adopts
this approach by relating nutrient measurements to
the EPA’s 25th percentile for the Northeast Coastal
Zone subecoregion #59 (US EPA 2001). The US
EPA nutrient criteria are 8.0 ug/L for TP and 0.32
mg/L for TN. The thresholds were accepted in the
QAPP while recognizing they are relatively low for
urban watersheds. With additional data collected
over time, the QAPP intends to use the US EPA
approach to develop TN and TP criteria specific to
river herring spawning and nursery habitat in the
coastal regions of Massachusetts.
Results
Massachusetts SWQS Criteria.
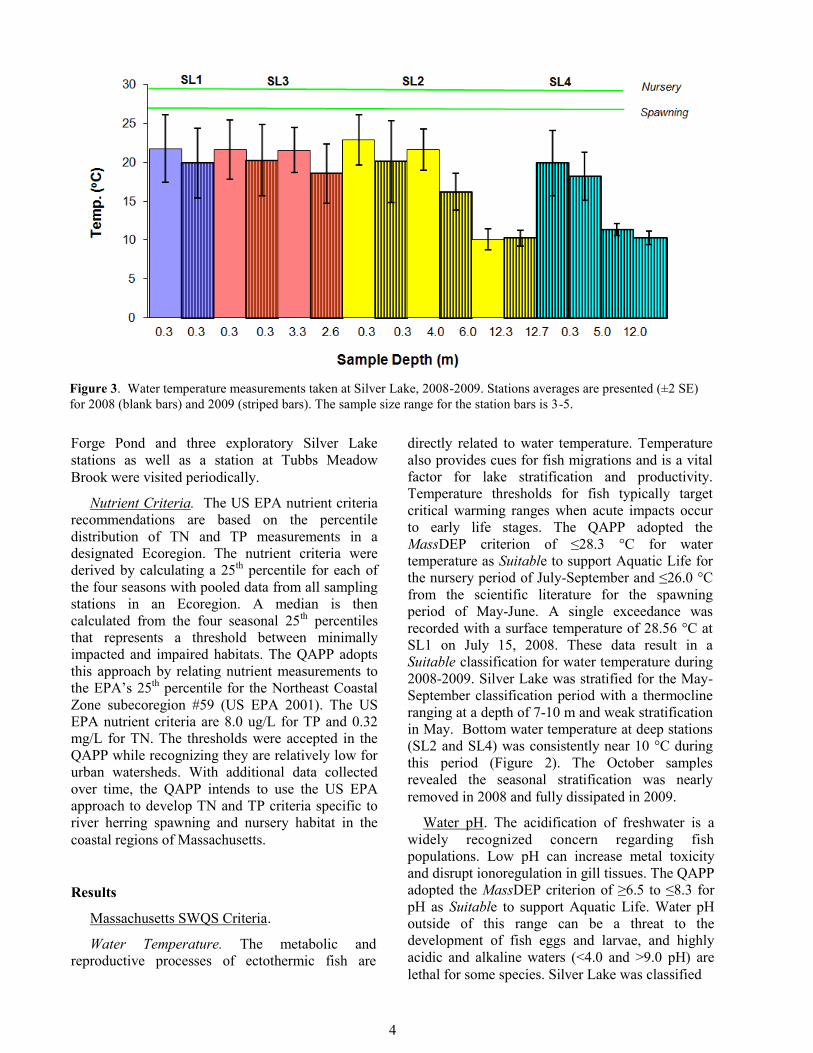
Water Temperature. The metabolic and
reproductive processes of ectothermic fish are
directly related to water temperature. Temperature
also provides cues for fish migrations and is a vital
factor for lake stratification and productivity.
Temperature thresholds for fish typically target
critical warming ranges when acute impacts occur
to early life stages. The QAPP adopted the
MassDEP criterion of ≤28.3 °C for water
temperature as Suitable to support Aquatic Life for
the nursery period of July-September and ≤26.0 °C
from the scientific literature for the spawning
period of May-June. A single exceedance was
recorded with a surface temperature of 28.56 °C at
SL1 on July 15, 2008. These data result in a
Suitable classification for water temperature during
2008-2009. Silver Lake was stratified for the May-
September classification period with a thermocline
ranging at a depth of 7-10 m and weak stratification
in May. Bottom water temperature at deep stations
(SL2 and SL4) was consistently near 10 °C during
this period (Figure 2). The October samples
revealed the seasonal stratification was nearly
removed in 2008 and fully dissipated in 2009.
Water pH. The acidification of freshwater is a
widely recognized concern regarding fish
populations. Low pH can increase metal toxicity
and disrupt ionoregulation in gill tissues. The QAPP
adopted the MassDEP criterion of ≥6.5 to ≤8.3 for
pH as Suitable to support Aquatic Life. Water pH
outside of this range can be a threat to the
development of fish eggs and larvae, and highly
acidic and alkaline waters (<4.0 and >9.0 pH) are
lethal for some species. Silver Lake was classified
Figure 3. Water temperature measurements taken at Silver Lake, 2008-2009. Stations averages are presented (±2 SE)
for 2008 (blank bars) and 2009 (striped bars). The sample size range for the station bars is 3-5.
5
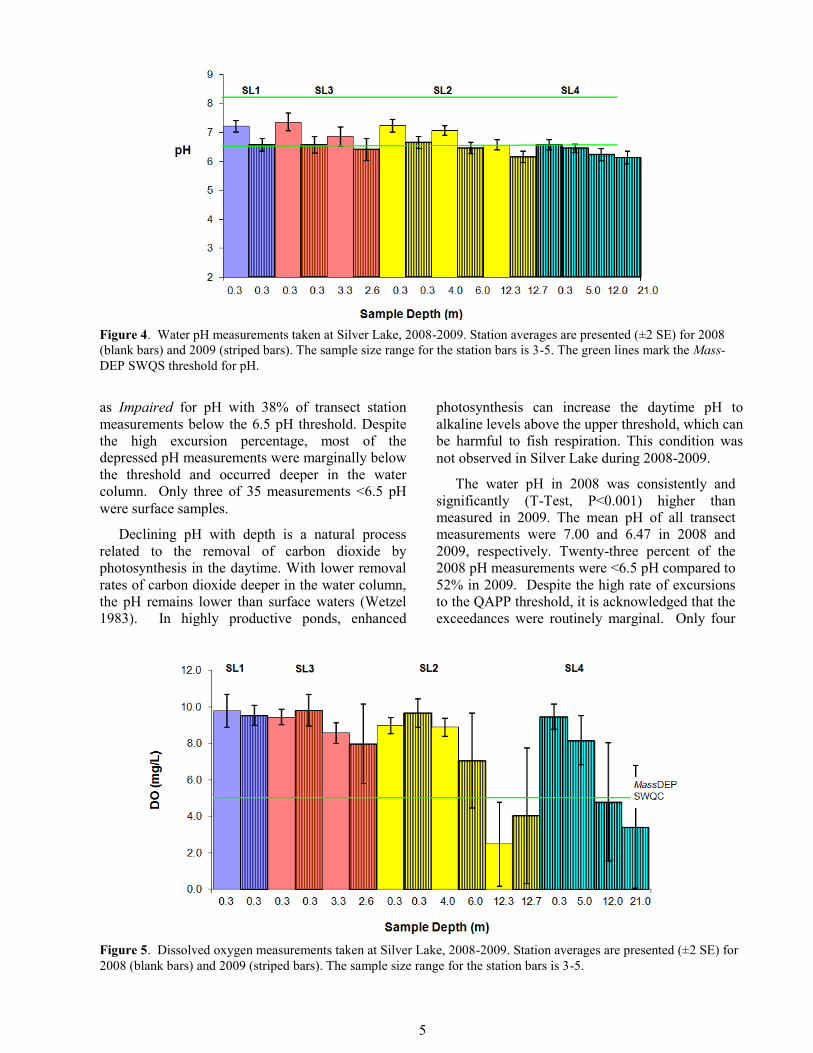
as Impaired for pH with 38% of transect station
measurements below the 6.5 pH threshold. Despite
the high excursion percentage, most of the
depressed pH measurements were marginally below
the threshold and occurred deeper in the water
column. Only three of 35 measurements <6.5 pH
were surface samples.
Declining pH with depth is a natural process
related to the removal of carbon dioxide by
photosynthesis in the daytime. With lower removal
rates of carbon dioxide deeper in the water column,
the pH remains lower than surface waters (Wetzel
1983). In highly productive ponds, enhanced
photosynthesis can increase the daytime pH to
alkaline levels above the upper threshold, which can
be harmful to fish respiration. This condition was
not observed in Silver Lake during 2008-2009.
The water pH in 2008 was consistently and
significantly (T-Test, P<0.001) higher than
measured in 2009. The mean pH of all transect
measurements were 7.00 and 6.47 in 2008 and
2009, respectively. Twenty-three percent of the
2008 pH measurements were <6.5 pH compared to
52% in 2009. Despite the high rate of excursions
to the QAPP threshold, it is acknowledged that the
exceedances were routinely marginal. Only four
Figure 4. Water pH measurements taken at Silver Lake, 2008-2009. Station averages are presented (±2 SE) for 2008
(blank bars) and 2009 (striped bars). The sample size range for the station bars is 3-5. The green lines mark the Mass-
DEP SWQS threshold for pH.
Figure 5. Dissolved oxygen measurements taken at Silver Lake, 2008-2009. Station averages are presented (±2 SE) for
2008 (blank bars) and 2009 (striped bars). The sample size range for the station bars is 3-5.
6
measurements fell below 6.0 in the range of 5.5-6.0
and were all from the bottom samples at SL4, the
deepest station in the assessment.
Dissolved Oxygen. Adequate dissolved oxygen
(DO) concentrations are essential for the
respiration and metabolism of aquatic life. Water
DO is highly influenced by water temperature as
well as chemical and biological processes resulting
in seasonal and diurnal cycles. The QAPP adopted
the MassDEP criterion of ≥5.0 mg/L for DO as
Suitable to support Aquatic Life. Silver Lake was
classified as Impaired for DO with 10.7% of
transect station measurements below the 5.0 mg/L
DO threshold.
The classification for DO is marginal; both
numerically given the excursion allowance of 10%
and from a practical consideration of the selected
transect stations. A second deep station (SL4) was
added in October 2008 and sampled each month in
2009. All DO bottom measurements during July-
September at the deep stations, SL2 (max. depth =
14 m) and SL4 (max. depth = 22 m), were anoxic.
During this period, the anoxia dissipated to hypoxia
at a depth range of 8-12 m with a worst-case
observation at SL4 in September 2009 when the
water column was anoxic from 8 m depth to bottom
depths of 20.5 m. Botttom samples are exempt
from the DO classification due to natural
stratification. The Impaired classification resulted
largely from the second depth measurement off the
bottom for SL2 and SL4 where hypoxia was
common. In the absence of sampling at the second
deep station SL4, the DO exceedances would have
been <10%. Therefore, despite the Impaired
classification and presence of anoxia at bottom
waters, DO was suitable at most depth strata and
few DO exceedances were recorded for
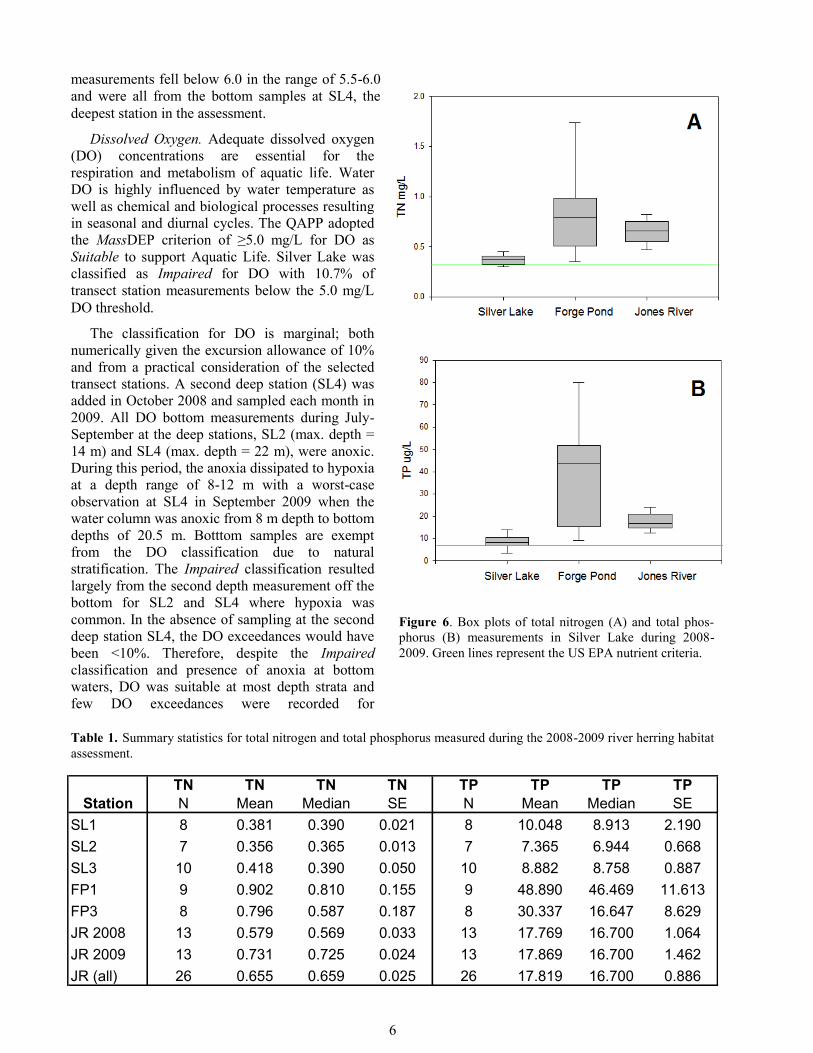
Figure 6. Box plots of total nitrogen (A) and total phos-
phorus (B) measurements in Silver Lake during 2008-
2009. Green lines represent the US EPA nutrient criteria.
Table 1. Total nitrogen (TN, mg/L) and Total phosphorus (TP, ug/L) summary statistics for
Silver Lake (SL), Forge Pond (FP), and the Jones River (JR) during 2008-2009.
TN TN TN TN TP TP TP TP
Station N Mean Median SE N Mean Median SE
SL1 8 0.381 0.390 0.021 8 10.048 8.913 2.190
SL2 7 0.356 0.365 0.013 7 7.365 6.944 0.668
SL3 10 0.418 0.390 0.050 10 8.882 8.758 0.887
FP1 9 0.902 0.810 0.155 9 48.890 46.469 11.613
FP3 8 0.796 0.587 0.187 8 30.337 16.647 8.629
JR 2008 13 0.579 0.569 0.033 13 17.769 16.700 1.064
JR 2009 13 0.731 0.725 0.024 13 17.869 16.700 1.462
JR (all) 26 0.655 0.659 0.025 26 17.819 16.700 0.886
Table 1. Summary statistics for total nitrogen and total phosphorus measured during the 2008-2009 river herring habitat
assessment.
7
measurements ≤5.0 m depth (4.5%).
Nutrient Criteria.
Nutrients. The JRWA conducted monthly
sampling of TN and TP at Silver Lake and Jones
River stations as part of their watershed baseline
index. The nutrient samples at transect stations
SL1, SL2, and SL3 were adopted for TN and TP
classification for this assessment. The JRWA
nutrient samples were processed by the
Provincetown Center for Coastal Studies under a
MassDEP approved QAPP for their laboratory
(PCCS 2008).
The pooled nutrient samples for the transect
stations routinely exceeded the US EPA nutrient
criteria of 8.0 ug/L for TP and 0.32 mg/L for TN,
leading to an Impaired classification for both
parameters. Nineteen of 25 TN measurements were
below the criterion, resulting in an exceedance rate
of 76%. Station SL3, next to the Monponsett Pond
diversion outlet, had the highest mean TN at 0.418
mg/L (Table 1). Fourteen of 25 TP measurements
were above the criterion resulting in an exceedance
rate of 56%. Despite the high proportion of Silver
Lake TP samples exceeding the criterion, the
margin of exceedance was slim (Figure 6). Station
SL2 had the lowest nutrient concentrations, with
median values for the two seasons slightly less than
the TP criterion and slightly higher than the TN
criterion.
Nutrients were also measured at the FP1 and
FP2 stations in Forge Pond during the assessment.
These measurements were typically much higher
than those found in Silver Lake with all TN and all
but one TP measurements exceeding the criteria.
The Forge Pond measurements are indicative of
water quality impairment, but data are not
comparable to Silver Lake due to the lack of flow
in the shallow mill pond for most of the study
period.
During the study period, TN and TP were
measured in the main stem Jones River as part of a
separate study assessing rainbow smelt spawning
habitat (Enterline et al. 2013). The main stem
nutrient data provide a useful comparison to the
Silver Lake nutrient data.
Weekly TN and TP measurements were made
during the smelt spawning period (early March to
mid-May) using the same QAPP as this study
(Chase 2010). The measurements were taken
below the Elm Street Dam approximately 8 km
downstream of Forge Pond. The TN and TP
concentrations routinely exceeded the Silver Lake
samples and all TN and TP measurements exceeded
the US EPA Lake criteria; however, different
criteria apply to rivers (TN = 0.57 mg/L and TP =
23.75 ug/L). When compared to the river criteria,
the Elm Street Dam station data was Impaired for
TN (73% exceedance) and TP was classified as
Minimally Impacted for TP (8% exceedance).
Despite the Impaired classification for TN and TP
in Silver Lake, the nutrient measurements were not
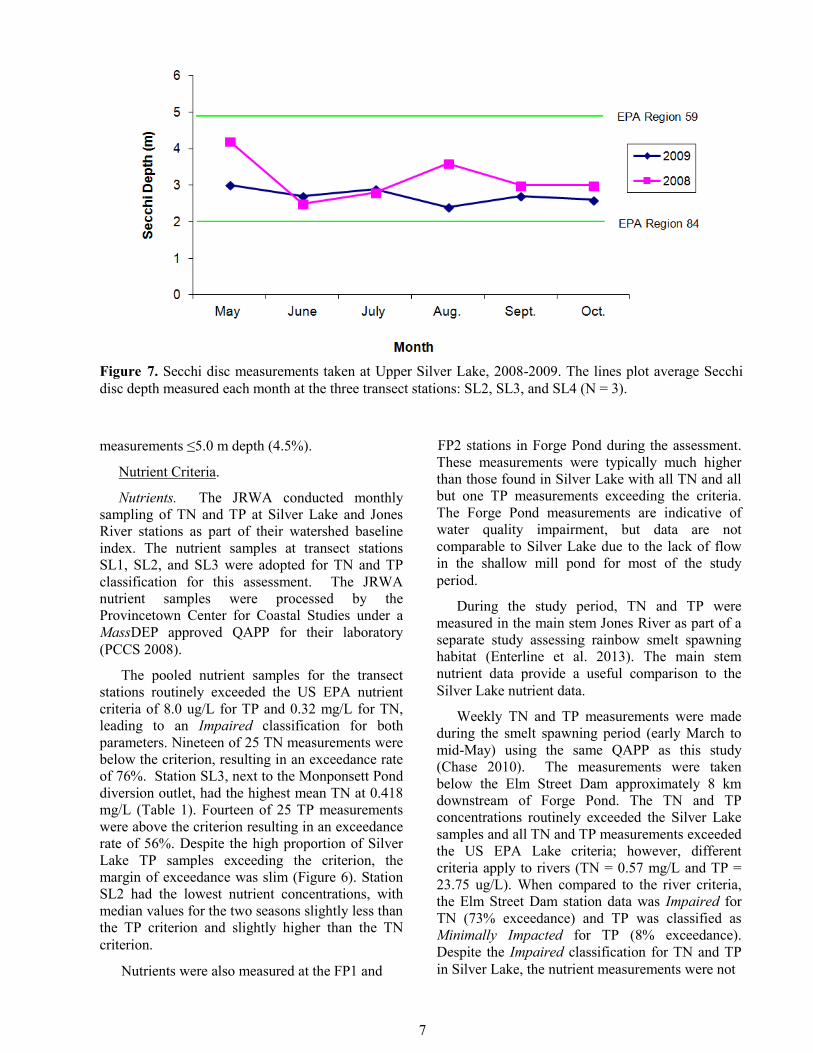
Figure 7. Secchi disc measurements taken at Upper Silver Lake, 2008-2009. The lines plot average Secchi
disc depth measured each month at the three transect stations: SL2, SL3, and SL4 (N = 3).
8
associated with indicators of eutrophication and
were relatively low for habitat assessments
conducted under the QAPP to date. It should be
noted that the assessment design would not provide
information on the relative contributions of
nutrients via water supply diversions from
Monponsett Pond, which is known to exhibit
impairment from nutrient loading (MassDEP 2006;
WAA 2006).
Secchi Disc. Secchi disc is an easily measured
proxy for the transparency of water to light. There
is little information that directly links Secchi disc
depth to river herring life history, although it is
widely accepted as an indicator of water quality.
The US EPA Secchi disc criterion of ≥4.9 m for
subecoregion #59 (Northeast Coastal) is higher
than water clarity typically seen in Massachusetts
coastal drainages, therefore the criterion for
subecoregion #84 (Cape Cod) of ≤2.0 m Secchi
disc depth was adopted by the QAPP as Suitable to
support Aquatic Life. No exceedances to the
criterion were measured at the transect stations
(SL2, SL3, and SL4, N = 23) during 2008-2009,
resulting in a Suitable classification (Figure 7). The
highest monthly average Secchi disc depth of 3.5 m
occurred in May. Water clarity in Silver Lake was
consistently good relative to other QAPP
assessments conducted to date where mid-summer
plankton blooms cause common excursions <2.0
m.
Best Professional Judgment.
Fish Passage. The QAPP provides a process
for using Best Professional Judgment to assess the
capability of river herring to pass barriers as
spawning adults and emigrating juveniles. This
classification results in the assignment of Suitable,
Impaired, or Unsuitable for each barrier or outlet.
During the study period, three dams impeded
the passage of diadromous fish from marine waters
into Silver Lake. The lowermost dam, the Elm
Street Dam (2.7 rm), has a fishway that was rebuilt
with an Alaskan Steeppass ladder in 2001. This
fishway has been the site of a JRWA herring count
since 2005. The next dam upstream was the
Wapping Road Dam (3.7 rm). This site was under
design for dam removal during the study period and
the dam was removed in 2011. Because of the
known passage condition during the study period,
sites visits were not made to the Elm Street
(Suitable) and Wapping Road (Unsuitable) dams.
Fish passage observations were therefore focused
on the Forge Pond Dam (FP1, 7.4 rm) and Silver
Lake outlet (FP3, 7.7 rm) to Forge Pond.
The Forge Pond Dam had no fishway or
provisions for fish passage, resulting in a
classification of Unsuitable for fish passage during
May-October, 2008-2009. Forge Pond Dam is a
concrete dam with a 48 ft total length and 5.5 ft
spillway height. The dam includes a 38 ft spillway
next to three bays with adjustable wood stoplogs.
Flow was only observed to pass over the dam crest
during the two May visits when 2-3 cm of water
depth was measured at a mid-crest reference
station. The water height over the western bay
stoplog was 8 cm during May each year. The Forge
Pond water level was much lower in 2008 than
2009. On average the pond level at the reference
station was 25 cm below the dam crest in 2008 and
8 cm in 2009. For both years, the conditions for
June to October were stable at FP1: flow was not
observed exiting Forge Pond except for minor
leakage through stoplog slots and surrounding
cracks in the dam concrete.
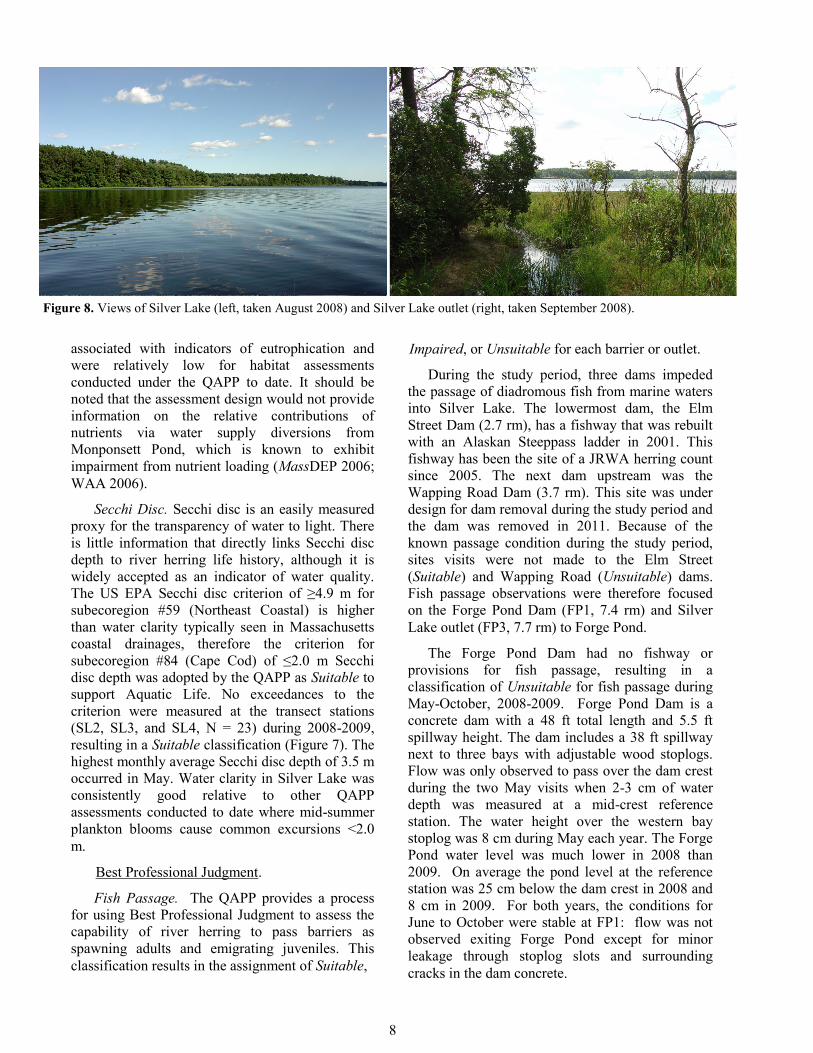
Figure 8. Views of Silver Lake (left, taken August 2008) and Silver Lake outlet (right, taken September 2008).
9
The outlet of Silver Lake (FP3) to Forge Pond
has the appearance of a natural channel and was the
likely natural outlet to the Jones River prior to the
construction of Forge Pond Dam. A transect was
established here to measure water chemistry and
depth. A berm of sand slightly upstream of the
transect has accumulated as a result of low outflow
and the Forge Pond impoundment. The berm is at
a higher elevation than the transect and is the
control for water exiting the Lake most of the year.
The fish passage assessment at this site considered
the ability of fish to pass the entire section from the
transect through the natural outlet. The fish
passage classification at FP3 was classified as
Impaired due to an Impaired or Unsuitable
assessment for 4 of the 12 (33%) site visits during
May-October 2008-2009. All four assessments that
were not Suitable came during July-October, 2008.
The Lake was lower in 2008 with much less
outflow than seen in 2009. The classification for
each site visit in 2009 was Suitable and the average
transect depth at mid-transect was 57 cm. The
average transect depth in 2008 at mid-transect was
39 cm.
Stream Flow. Stream flow is a separate
classification from fish passage because in some
cases, stream flow can influence passage and
habitat quality independently of a structural
impediment. A common example is a situation
where stream flow would be adequate to provide
upstream passage for spawning adult river herring
or downstream passage of juveniles in the absence
of an existing obstruction. In this example, the
station would be classified as Impaired for fish
passage and Suitable for stream flow. In the case
of Forge Pond Dam (FP1), stream flow was not
Suitable during any observation to support adult
herring passage, resulting in an Impaired
classification. The stream flow during both May
sites visits was potentially sufficient to allow
juvenile eel passage into Forge Pond and juvenile
herring emigration downstream. Forge Pond itself
would have been poor migratory habitat for most of
2008 and the summer of 2009. In 2008, stream
flow exiting Silver Lake declined sharply from
May to June. Forge Pond became choked with
surface plant growth by June and was estimated to
have a 95% surface coverage of lily pads in July.
The stream flow classification at FP3 mirrored
the fish passage classification of Impaired due to
an Impaired or Unsuitable assessment for 4 of the
12 site visits during May-October 2008-2009. This
location showed potential for fish passage in 2009
as water flow and depth were Suitable for
movements into and out of Silver Lake at each site
visit. Migratory habitat conditions were poor in
2008 as evident by the exposure of about 30 m of
lake perimeter from May to August and the
observation of reverse flow from Forge Pond into
Silver Lake. Conditions in September 2008 were
the driest observed, with about 50 m of dry lake
perimeter and thick grass growing in the natural
outlet. In contrast, the lake level remained high and
stable in 2009, supporting suitable stream flow and
fish passage during each month at FP3.
Flow records for the Jones River from the
USGS stream flow station at the Elm Street Dam
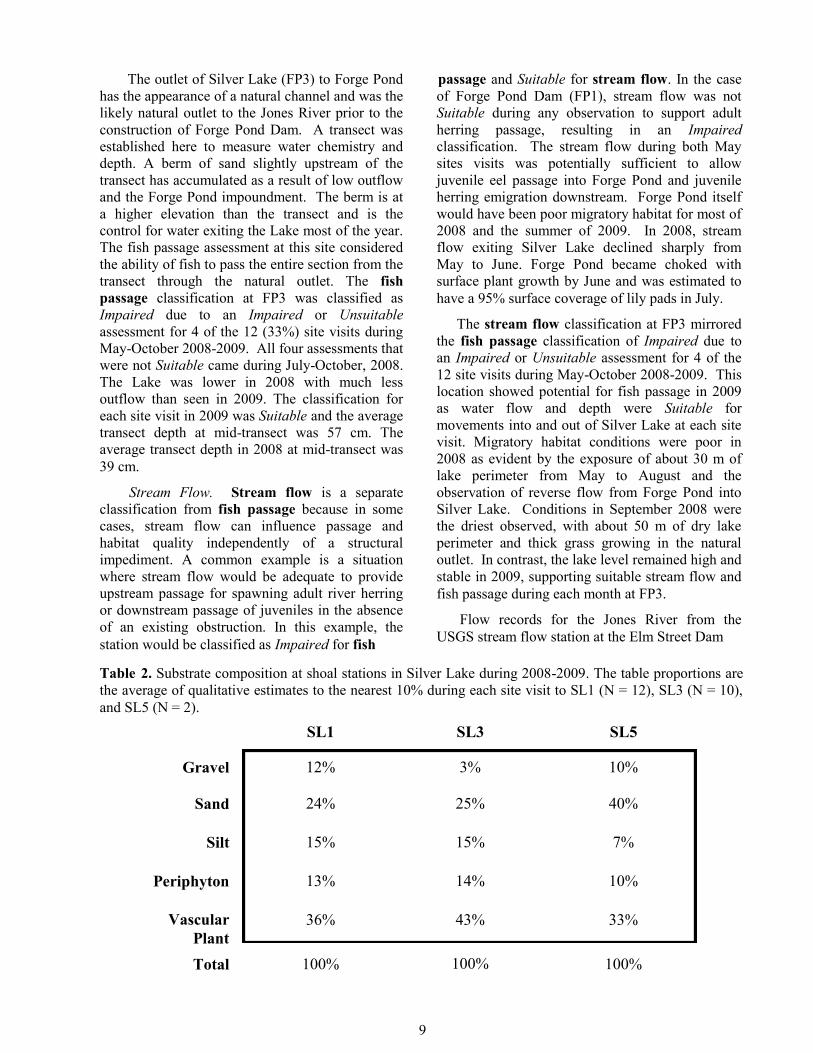
Table 2. Substrate composition at shoal stations in Silver Lake during 2008-2009. The table proportions are
the average of qualitative estimates to the nearest 10% during each site visit to SL1 (N = 12), SL3 (N = 10),
and SL5 (N = 2).
SL1 SL3 SL5
Gravel 12% 3% 10%
Sand 24% 25% 40%
Silt 15% 15% 7%
Periphyton 13% 14% 10%
Vascular
Plant
36% 43% 33%
Total 100% 100%
100%
10
revealed that 2008 discharge was below average
while 2009 flows were well above average. The
average daily flow in 2008 at the Elm Street gauge
during the May site visit was 28 cfs, and the daily
flow ranged from 8-16 cfs June-October. The
average daily flow in 2009 at the Elm Street gauge
during the May site visit was 36 cfs, and the flow
and daily ranged from 20-92 cfs June-October.
Additionally, the monthly mean discharge for
May-October in 2008 was 13% below the time
series (1966-2011) means for those months, while
2009 was 93% above the mean discharge. These
data should be considered with caution due to the
water supply manipulations at Silver Lake and
unknown influence of downstream tributaries.
However, it can be inferred from the stream flow
data that the 2008 flow conditions may have been
closer to the time series average than conditions in
2009.
Eutrophication. The QAPP provides a process
for using BPJ observations to assess if shoal
transect stations are impacted by eutrophication.
The indicators used are nutrients, DO, pH,
turbidity, Secchi disc, and plant growth in the water
column and substrate. When nitrogen and
phosphorus data are available, as was the case for
this assessment, the QAPP classification for
eutrophication is based on US EPA criteria and
not BPJ. Measured nutrient concentrations during
the Silver Lake habitat assessment resulted in an
Impaired classification for eutrophication.
However, it should be noted that the BPJ
designation for each site visit to SL1, SL3 and SL5
was Suitable. No combination of eutrophication
indicators resulted in an Impaired designation at
any site. Water clarity was adequate during for all
site visits with a minor reduction during a
suspected cyanobacteria bloom during June-August
2009. Water column plant growth did not exceed
25% for any sites visited. The substrata at SL1,
SL3, and SL5 did not experience significant
increases in periphyton or vascular plant growth.
For most observations, substrate plant growth was
estimated at 25-50%, with occasional exceedances
to >50% during the summer of 2009.
Dissolved oxygen was suitable at all site visits
with only occasional supersaturation during
summer daytime measurements when higher DO is
normally expected. Overall, the shoal stations in
Silver Lake exhibited relatively clean substrate and
a naturally diverse plant community that did not
suggest impairments that would be expected from
eutrophication.
Spawning Substrate. River herring deposit
dermersal eggs that stick to whatever surface they
encounter. After one day, the eggs become non-
adhesive, but remain on the bottom until hatching
in typically 2-5 days (Greene et al. 2009). No
spawning substrate classification was provided in
the QAPP because of the wide variety of substrate
used by river herring and the lack of consensus in
the scientific literature on optimal or preferred
substrate. Instead, the QAPP provides a qualitative
protocol for assessing the percent composition of
major substrate cover. To date, habitat monitoring
during QAPP assessments supports the view that
clean gravel may be a better surface for egg
survival than fine silt or dense periphyton growth.
The observations recorded on substrate conditions
at the three shoal stations complimented the BPJ
observations on eutrophication: the station substrate
featured a diversity of native vascular plants with
no evidence of nuisance growth and a range of
larger sediment sizes that would be expected to
provide suitable habitat for river herring spawning
and egg incubation.
The average percent composition of major
substrate types are reported in Table 2. The
conditions at SL1 (closest to Silver Lake outlet)
may have been most favorable; this station is
located in a large shoal with substrate containing a
diversity of aquatic plants, coarse sand, gravel, and
abundant freshwater mussels. Observations for SL3
were made about 50 m north of the Monponsett
Diversion outlet to avoid the scour pool and finer
sediments directly at the SL3 coordinates. This
shoal was an extensive shallow region that had less
gravel than SL1 but would likely provide very
suitable spawning habitat. The shoal station off
Tubb Meadow Brook (SL5) was visited twice. SL5
had the highest presence of sand, but still had
heterogeneous plant and sediment cover that would
be expected to be suitable for river herring.
Additional Water Quality Data
Turbidity. Turbidity in water is caused by
suspended inorganic and organic matter.
Concentrations of organic material can relate to
productivity and high levels of inorganic
particulates can threaten aquatic life, especially
filter feeders. No MassDEP or US EPA reference
conditions are provided for turbidity in lakes and
ponds, therefore the QAPP does not have a
turbidity criterion. The US EPA turbidity reference
11
condition for rivers in sub-ecoregion #59 is ≤1.7
NTU (US EPA 2001). Similar to the Secchi disc
measurements, the turbidity data reflect
consistently high water clarity at all transect
stations. The average turbidity for all four transect
stations with bottom samples removed was 1.3
NTU (N = 74) and 1.1 NTU (N = 41) for surface
samples only.
Specific Conductivity. Conductivity is
proportional to the concentration of major ions in
solution. Specific conductivity is a measure of the
resistance in a solution to electrical current that has
been corrected to the international standard of 25°
C. The ionic composition of fresh water is usually
dominated by dilute solutions of natural
compounds of bicarbonates, carbonates, sulfates
and chlorides. No MassDEP or US EPA reference
conditions are provided for conductivity, therefore
the QAPP does not have a conductivity criterion.
High conductance in freshwater can indicate
watershed contributions of natural alkaline
compounds or ionic contributions from pollution
sources. Specific conductivity at Silver Lake was
consistently low with little variability among
stations and depth strata. The average for all
transect measurements was 0.163 mS/cm (N =112,
SD = 0.011). Although the QAPP provides no
guidance on conductivity, this finding is favorable
for water quality considerations. The low
conductivity found at Silver Lake would not be
expected if high ionic contributions were present in
surface inflow or from historic pollution sources.
Carlson Trophic State Index. The Carlson
Trophic State Index (TSI) (Carlson 1977) is a
commonly used classification that relates water
chemistry indicators to an expected range of trophic
conditions. The TSI established relationships for
TP, chlorophyll a, and Secchi disc depth with a
range of scores from 0 to 100. Scores near zero
would indicate uncommon nutrient poor and low
productivity conditions, and scores near 100 would
indicate extremely degraded, highly productive
conditions. The TSI for each of these parameters
relates to a numeric scale of trophic conditions
based on the premise that increasing nutrients
elevate plant productivity and result in reduced
water clarity. The mean Secchi disc depths for
SL2, SL3, and SL4 during May-September
measurements resulted in TSI scores of 43.9 - 45.2
which are near the middle of the mesotrophic range,
a trophic class supportive of swimming and
aesthetic uses but having the potential for
hypolimnetic anoxia during summer. The mean TP
for SL1, SL2, and SL3 during May-September
measurements resulted in TSI scores of 32.9 - 37.4
which are near the middle of the oligotrohic range,
a trophic class of lower primary productivity that
prompts little concern over eutrophication.
The Carlson Index scores for Silver Lake are
generally supportive of the assessment's nutrient
data that were classified as Impaired, but not
associated with obvious indicators of
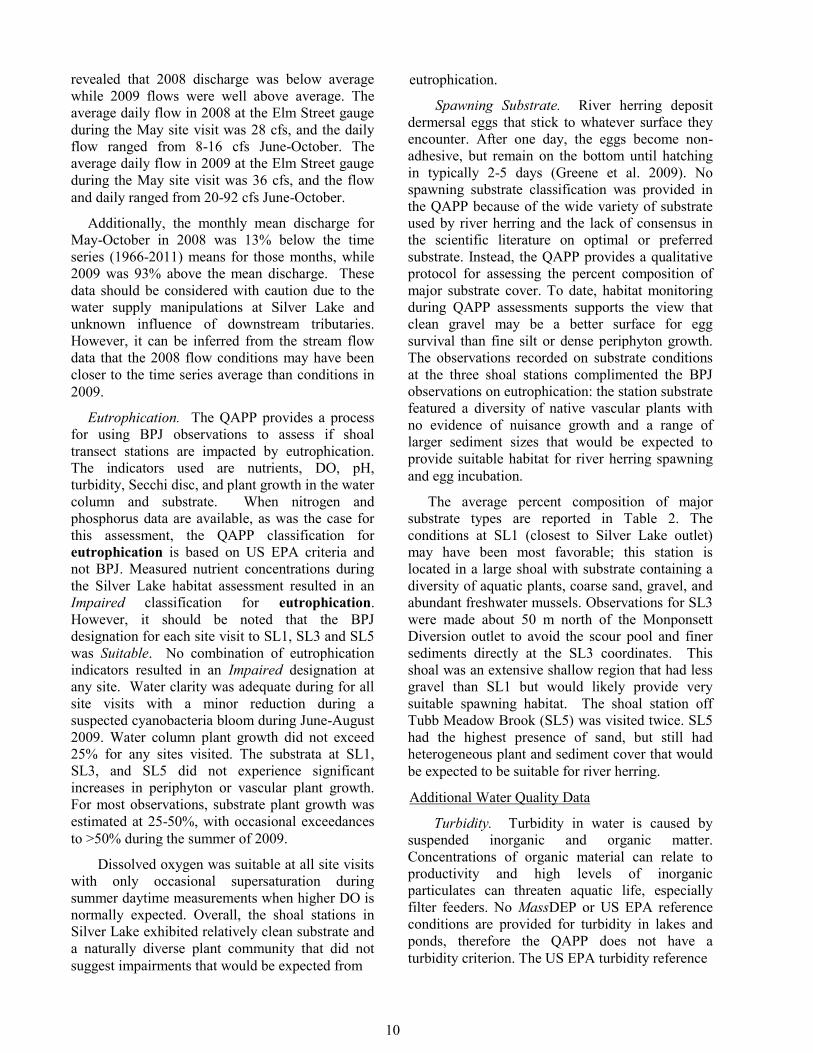
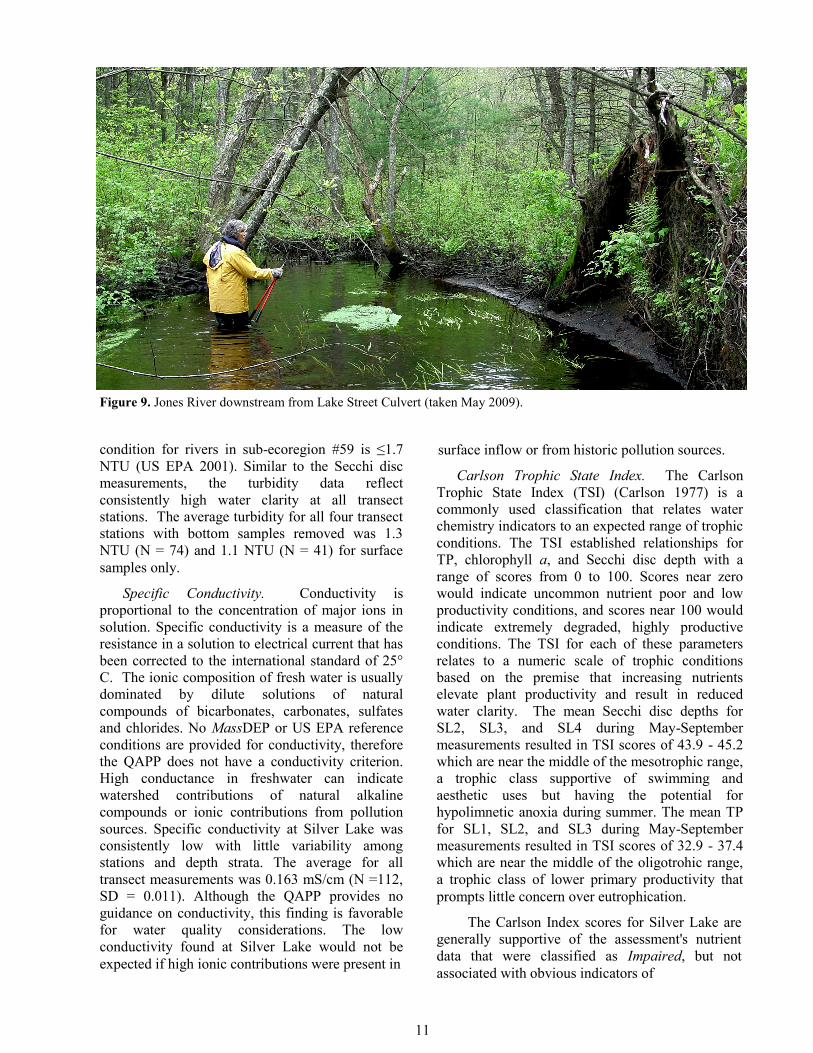
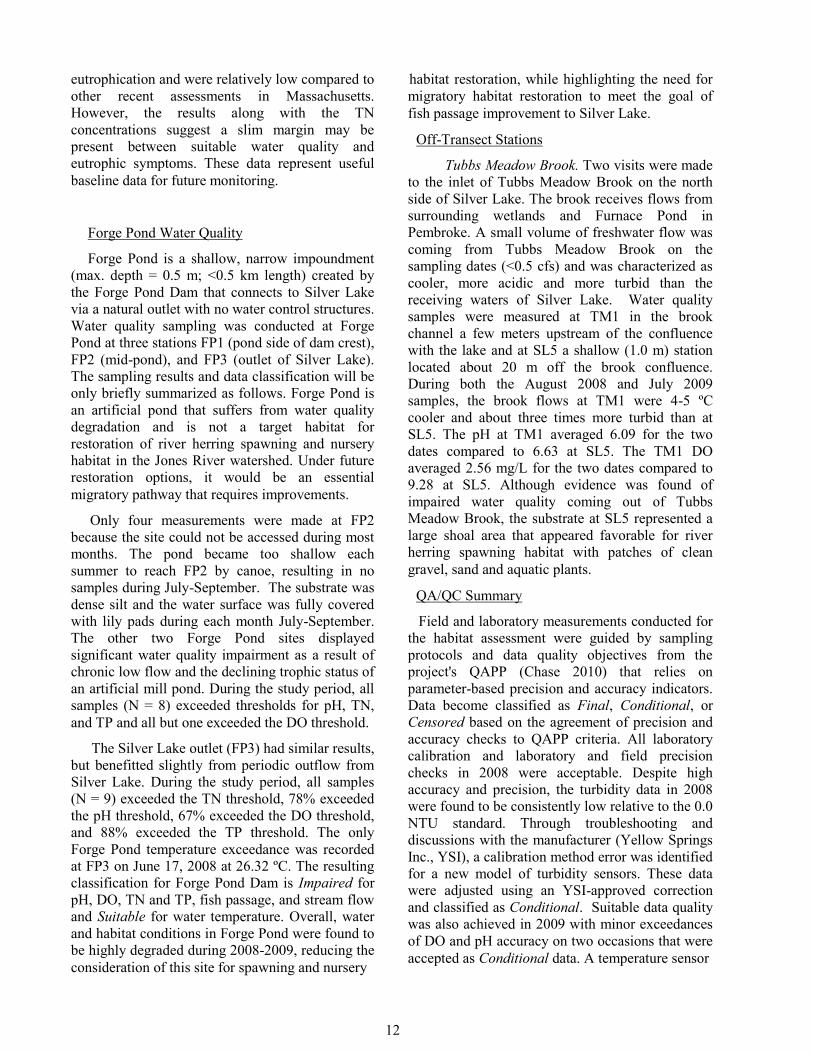
Figure 9. Jones River downstream from Lake Street Culvert (taken May 2009).
12
eutrophication and were relatively low compared to
other recent assessments in Massachusetts.
However, the results along with the TN
concentrations suggest a slim margin may be
present between suitable water quality and
eutrophic symptoms. These data represent useful
baseline data for future monitoring.
Forge Pond Water Quality
Forge Pond is a shallow, narrow impoundment
(max. depth = 0.5 m; <0.5 km length) created by
the Forge Pond Dam that connects to Silver Lake
via a natural outlet with no water control structures.
Water quality sampling was conducted at Forge
Pond at three stations FP1 (pond side of dam crest),
FP2 (mid-pond), and FP3 (outlet of Silver Lake).
The sampling results and data classification will be
only briefly summarized as follows. Forge Pond is
an artificial pond that suffers from water quality
degradation and is not a target habitat for
restoration of river herring spawning and nursery
habitat in the Jones River watershed. Under future
restoration options, it would be an essential
migratory pathway that requires improvements.
Only four measurements were made at FP2
because the site could not be accessed during most
months. The pond became too shallow each
summer to reach FP2 by canoe, resulting in no
samples during July-September. The substrate was
dense silt and the water surface was fully covered
with lily pads during each month July-September.
The other two Forge Pond sites displayed
significant water quality impairment as a result of
chronic low flow and the declining trophic status of
an artificial mill pond. During the study period, all
samples (N = 8) exceeded thresholds for pH, TN,
and TP and all but one exceeded the DO threshold.
The Silver Lake outlet (FP3) had similar results,
but benefitted slightly from periodic outflow from
Silver Lake. During the study period, all samples
(N = 9) exceeded the TN threshold, 78% exceeded
the pH threshold, 67% exceeded the DO threshold,
and 88% exceeded the TP threshold. The only
Forge Pond temperature exceedance was recorded
at FP3 on June 17, 2008 at 26.32 ºC. The resulting
classification for Forge Pond Dam is Impaired for
pH, DO, TN and TP, fish passage, and stream flow
and Suitable for water temperature. Overall, water
and habitat conditions in Forge Pond were found to
be highly degraded during 2008-2009, reducing the
consideration of this site for spawning and nursery
habitat restoration, while highlighting the need for
migratory habitat restoration to meet the goal of
fish passage improvement to Silver Lake.
Off-Transect Stations
Tubbs Meadow Brook. Two visits were made
to the inlet of Tubbs Meadow Brook on the north
side of Silver Lake. The brook receives flows from
surrounding wetlands and Furnace Pond in
Pembroke. A small volume of freshwater flow was
coming from Tubbs Meadow Brook on the
sampling dates (<0.5 cfs) and was characterized as
cooler, more acidic and more turbid than the
receiving waters of Silver Lake. Water quality
samples were measured at TM1 in the brook
channel a few meters upstream of the confluence
with the lake and at SL5 a shallow (1.0 m) station
located about 20 m off the brook confluence.
During both the August 2008 and July 2009
samples, the brook flows at TM1 were 4-5 ºC
cooler and about three times more turbid than at
SL5. The pH at TM1 averaged 6.09 for the two
dates compared to 6.63 at SL5. The TM1 DO
averaged 2.56 mg/L for the two dates compared to
9.28 at SL5. Although evidence was found of
impaired water quality coming out of Tubbs
Meadow Brook, the substrate at SL5 represented a
large shoal area that appeared favorable for river
herring spawning habitat with patches of clean
gravel, sand and aquatic plants.
QA/QC Summary
Field and laboratory measurements conducted for
the habitat assessment were guided by sampling
protocols and data quality objectives from the
project's QAPP (Chase 2010) that relies on
parameter-based precision and accuracy indicators.
Data become classified as Final, Conditional, or
Censored based on the agreement of precision and
accuracy checks to QAPP criteria. All laboratory
calibration and laboratory and field precision
checks in 2008 were acceptable. Despite high
accuracy and precision, the turbidity data in 2008
were found to be consistently low relative to the 0.0
NTU standard. Through troubleshooting and
discussions with the manufacturer (Yellow Springs
Inc., YSI), a calibration method error was identified
for a new model of turbidity sensors. These data
were adjusted using an YSI-approved correction
and classified as Conditional. Suitable data quality
was also achieved in 2009 with minor exceedances
of DO and pH accuracy on two occasions that were
accepted as Conditional data. A temperature sensor
13
Notes:
1. Bottom measurements at the deep stations (SL2 and SL4) were excluded from DO classification due to
QAPP hypolimnion exemption. See tables A.4 and A.6 for bottom DO data.
2. Classification Rules (Chase 2010, QAPP page 57): transect station samples for May-September during
both seasons are pooled. Criteria exceedances for temperature, pH, DO, and Secchi disc ≤10% of the sam-
ple size for each parameter result in a Support classification.
error was identified by reoccurring calibration
exceedances over four months in 2009. The
temperature data for these months were adjusted by
the average deviation from the calibration value
and classified as Conditional.
Natural Resource Observations
American Eel. Young-of-the-year (YOY)
American eel are known to undergo an annual
migration each spring in the Jones River. A
MarineFisheries monitoring station at the Elm
Street Dam provides an annual population index of
abundance (Chase 2011). In addition, eels were
observed during the study period at the spillway of
Forge Pond Dam and were captured in Silver Lake
while eel potting. Baited pots were set in 2009 to
confirm the presence of larger yellow eels and to
gauge the potential of developing a yellow eel
index of abundance for Silver Lake. Low numbers
of yellow eels were caught in Silver Lake in
August and September 2009. Also, juvenile age-
1+ eels were observed in the Forge Pond Dam
spillway in 2009: hundreds were observed in June
below the dam and several individuals were seen in
August.
American Shad. The historical presence of an
American shad (Alosa sapidissima) run in the Jones
River has been noted (Iwanowicz et al. 1974). A
photograph was received from a river abutter of
two dead adult shad taken downstream of the Elm
Street `Dam on May 23, 2009. The following
season, a juvenile American shad was captured near
the tidal interface in the Jones River during smelt
fyke net monitoring on March 9, 2010. These
recent observations and sporadic reports of
sportfishing catches of shad confirm the presence
of a persisting shad run, although our expectations
are that few shad are participating in the Jones
River run.
Invasive Plants. The QAPP followed during
the study period did not provide guidance for
routine sampling of invasive plants. Despite the
lack of a routine process during site visits, no
observations were made of an identified invasive
plant in Silver Lake. Likewise, previous studies in
the watershed did not identify Silver Lake as being
impaired by invasive plants (MassDEP 2006; WAA
2006). The plant communities at all shoal stations
were composed of diverse and apparently healthy
native vascular plants that were not burdened with
heavy periphyton growth. This was not the case at
the smelt spawning habitat station below Elm Street
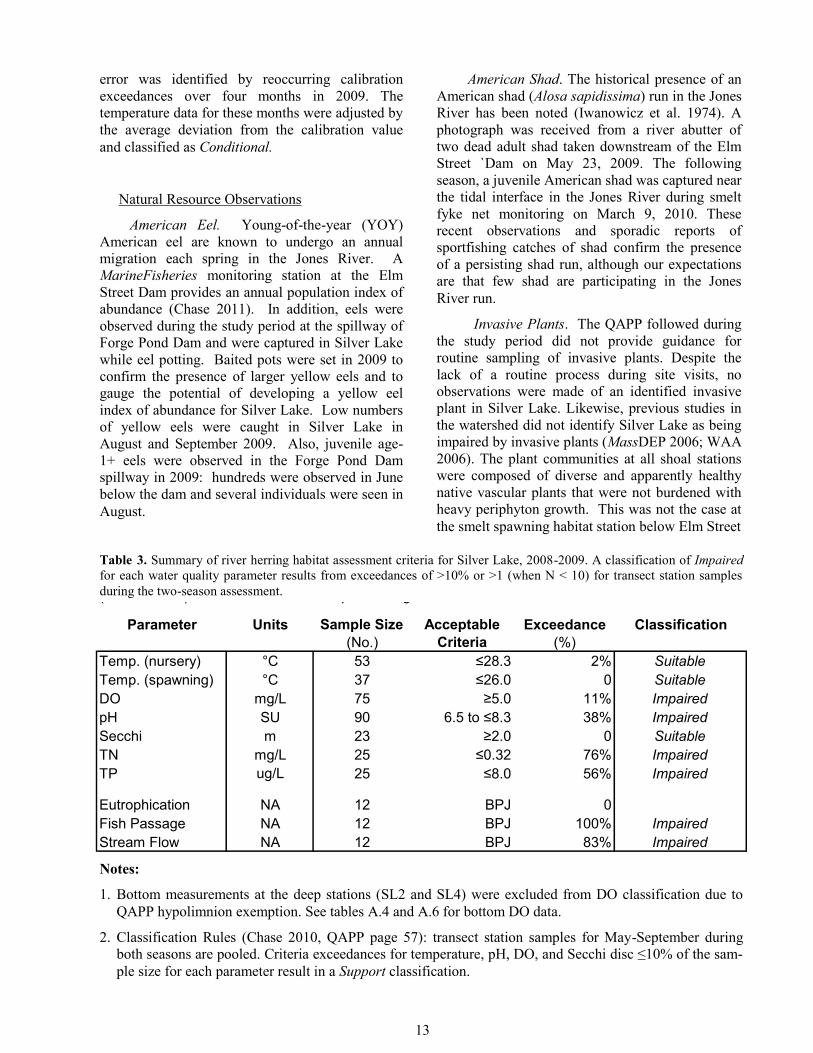
Table 3. Summary of river herring habitat assessment criteria for Silver Lake, Kingston, 2008-2009.
A classification of Impaired for each water quality parameter results from exceedances >10% or >1
(when N < 10) for transect station samples during the two-season assessment.
Parameter Units Sample Size Acceptable Exceedance Classification
(No.) Criteria (%)
Temp. (nursery) °C 53 ≤28.3 2% Suitable
Temp. (spawning) °C 37 ≤26.0 0 Suitable
DO mg/L 75 ≥5.0 11% Impaired
pH SU 90 6.5 to ≤8.3 38% Impaired
Secchi m 23 ≥2.0 0 Suitable
TN mg/L 25 ≤0.32 76% Impaired
TP ug/L 25 ≤8.0 56% Impaired
Eutrophication NA 12 BPJ 0
Fish Passage NA 12 BPJ 100% Impaired
Stream Flow NA 12 BPJ 83% Impaired
Notes:
1. Bottom measurements at the deep stations (SL2 and SL4) were excluded from DO classification
due to QAPP hypolimnion exemption. See tables A.4 and A.6 for bottom DO data.
2.) Classification Rules (Chase 2010, QAPP page 57): transect station samples for May-September
during both seasons are pooled. Criteria exceedances for temperature, pH, DO and secchi disc
≤10% of the sample size for each parameter result in a Support classification.
Table 3. Summary of river herring habitat assessment criteria for Silver Lake, 2008-2009. A classification of Impaired
for each water quality parameter results from exceedances of >10% or >1 (when N < 10) for transect station samples
during the two-season assessment.
14
Dam, where large growths of invasive variable
milfoil and filamentous green algae were observed
during late-spring in both years. The presence of
milfoil at this location had not been observed by
the lead author prior to 2008.
Downstream Survey. The co-authors conducted
a survey of the Jones River from Forge Pond Dam
to the Wapping Road Dam during May 2009 to
confirm no passage impediments were present in
the form of transportation infrastructure or natural
debris. The survey observations confirmed that fish
passage was possible for this segment of the Jones
River. The Lake Street culvert was identified as a
location that may need attention under future
restoration options. The culvert appeared passable
for river herring under most expected flow levels,
but may have high entrance velocity at higher
discharges. Further downstream, a few jams of logs
and sticks occurred that, if left to accumulate more
debris, could become an impediment. This segment
will need periodic maintenance as part of future
efforts to restore fish passage to Silver Lake.
Conclusion
Six out of nine criteria used to classify river
herring spawning and nursery habitat were found to
be Impaired at Silver Lake during 2008-2009. This
resulted because reference conditions were
routinely exceeded for four measured water quality
parameters, fish passage and stream flow (Table
3). Water quality impairment was classified for
field measurements of DO, pH, TN, and TP. Of
the Impaired classifications, all but TN were either
marginal (DO and TP) or influenced by seasonal
stratification (pH and DO).
Despite the classification of four parameters as
Impaired, the assessment documented a range of
conditions that should be considered suitable for
river herring spawning and nursery habitat. The
eutrophication and Substrate BPJ observations
provided no indication that eutrophication had
degraded spawning substrate or surface waters.
Water temperature and Secchi disc depth were
classified as Suitable. These observations support
the Carlson Trophic State indices that indicated the
lake was between an oligotrophic and mesotrophic
state, which would be supportive of early life
stages of river herring. The primary concern
identified in the assessment was the low flow
exiting Silver Lake during the period needed for
juvenile emigration and the obvious obstruction to
adult migration presented by Forge Pond Dam. A
secondary concern that should be considered for
future monitoring is over the presence of
hypolimnetic anoxia. This phenomenon was
spatially limited during 2008-2009 but could
become a threat to nursery habitat with increasing
lake productivity.
Recommendations
The water quality impairment documented in
Silver Lake was mainly limited to TN and the
effects of seasonal stratification and would not
prevent a large proportion of Silver Lake from
providing a significant contribution to river herring
spawning and nursery habitat in the South Shore
Coastal Drainage Area. Therefore, we recommend
that restoring a native river herring run to Silver
Lake should be a high priority for the region. The
impairments with the highest consequence are the
fish passage obstruction at Forge Pond Dam and the
water supply operations in Silver Lake that reduce
outflow to the Jones River. The concept of
restoring sea run fish to Silver Lake received an
essential contribution when the next dam
downstream, the Wapping Road Dam, was
removed during the summer of 2011 through a
proactive restoration project led by JRWA. Given
this momentum and the large amount of suitable
spawning and nursery habitat available in Silver
Lake we recommend that the City of Brockton
should be engaged to determine feasible options for
improving fish passage to Silver Lake and stream
flow exiting the lake.
1. A feasibility study should be conducted in
cooperation with the City of Brockton to determine
options for providing migratory habitat and
sustainable stream flow to pass sea-run fish and
other aquatic life from the Jones River into Silver
Lake (Gomez and Sullivan in Preparation).
2. Additional information is needed on the
tributaries leading into Silver Lake and the main
stem Jones River in terms of water quality, water
quantity, stormwater influences, and potential fish
habitat.
3. Silver Lake demonstrated trophic conditions
that are expected to support early life stages of
diadromous fish. However, signs hypolimnetic
anoxia were present in the summer. If these
conditions degraded further it could become
limiting for nursery habitat and negatively affect
15
other aquatic life. It is recommended that further
evaluations are conducted on the source and status
of nutrient loading in the watershed and that
comparable monitoring is repeated at regular
intervals.
4. The river herring spawning and nursery
habitat assessment data should be provided to
MassDEP to support 305(b) reporting and to assist
local water quality remediation.
Acknowledgements
Much appreciation is due to the Jones River
Watershed Association and the co-authors for their
volunteer efforts to assess water and habitat quality
in Silver Lake. We are thankful for the field
assistance provided by Lothian Buss on Silver Lake
as a technician for JRWA. This is the second
habitat assessment report to follow the QAPP for
water quality measurements conducted for
diadromous fish habitat monitoring (Chase 2010)
approved by MassDEP in November 2009. The
field and laboratory efforts of MarineFisheries are
supported by the Sportfish Restoration Act. We
thank the following reviewers of draft reports: John
Sheppard, Ben Gahagan, and Mike Bednarski, and
MarineFisheries Technical Report Series editor,
Elaine Brewer, for their review and guidance. All
photos taken by Brad Chase.
Literature Cited
ASMFC. 2012. American eel benchmark stack
assessment. Atlantic States Marine Fisheries
Commission, Stock Assessment Rep. No. 12-01.
Belding, D.L. 1921. A report upon the alewife
fisheries of Massachusetts. Mass. Div. of Fish.
and Game, Dept. of Natural Resources, 135 pp.
Carlson, R.E. 1977. A trophic state index for lakes.
Limnology and Oceanography 22: 361-369.
Chase, B.C., M.H. Ayer, K.J. MacGowan, and K.
Taylor. 2006. Population Indices of Rainbow
Smelt Spawning Runs in Massachusetts. Mass.
Div. of Mar. Fisheries, Completion Report for
NMFS Project No: O-2003-NER4, Gloucester,
MA.
Chase, B.C. 2010. Quality Assurance Program Plan
(QAPP) for Water Quality Measurements
Conducted for Diadromous Fish Habitat
Monitoring. Version 1.0, 2008-2012. Mass. Div.
of Mar. Fisheries, Tech. Report No. TR-42.
Chase, B.C. 2011. American eel compliance report
for 2010 to the Atlantic States Marine Fisheries
Commission. Mass. Div. of Mar. Fisheries, New
Bedford, MA.
City of Brockton. 2009. Comprehensive water
management plan. Prepared by CDM, for City
of Brockton Public Works Dept. and Brockton
Water Commission, Brockton, MA.
Enterline, C.L, G. Wipplehauser, J.M. Carloni, B.C.
Chase. 2013. A Multi-State Collaborative to
Develop & Implement a Conservation Program
for Three Anadromous Finfish Species of
Concern in the Gulf of Maine. Final Report
submitted for NOAA Species of Concern Grant
Program Award #NA06NMF4720249A.
Gomez and Sullivan Engineers. In Preparation.
Forge Pond Dam Fish Passage Improvement
Feasibility Study and Preliminary Design. For
Mass. Div. of Mar. Fisheries.
Greene, K.E., J.L. Zimmerman, R.W. Laney, and
J.C. Thomas-Blate. 2009. Atlantic coast
diadromous fish habitat: a review of utilization,
threats, recommendations for conservation, and
research needs. Atlantic States Marine Fisheries
Commission Habitat Mgt. Series No. 9,
Washington, D.C.
GZA. 2003. Jones River watershed study: Final
Report. Prepared by GZA GeoEnvironmental,
Inc., Norwood, MA, for Mass. Dept. of Environ.
Protection.
HMA. 2006. Silver Lake water supply system
overview report. Prepared by Hanson,
16
Murphy & Associates (HMA) for Brockton
Water Commission, Brockton, MA.
Iwanowicz, H.R., R.D. Anderson, and B.A.
Ketschke. 1974. A study of the marine
resources of Plymouth, Kingston, and Duxbury
Bay. Mass. Div. of Mar. Fisheries, Monograph
Series No. 17.
Lawton, R., P. Brady, C. Sheehan, S. Correia, and
M. Borgatti. 1990. Final report on spawning sea-
run rainbow melt (Osmerus mordax) in the
Jones River and impact assessment of Pilgrim
Station on the population, 1979-1981. Boston
Edison, Pilgrim Nuclear Power Station Marine
Environmental Monitoring Program Report
Series.
MassDEP. 2006. South Shore Coastal Watersheds
2001 Water Quality Assessment Report. Dept.
of Environ. Protection, Mass. Division of
Watershed Mgt. Report No. 94-AC-2.
MassDEP. 2007. Massachusetts Surface Water
Quality Standards. Massachusetts Department
of Environmental Protection, Division of
Water Pollution Control, Technical Services
Branch, Westborough, MA (Revision of 314
CMR 4.00, January 2007).
MassDEP. 2009. Massachusetts Year 2008
Integrated List of Waters. Final Listing of the
Conditions of Massachusetts’ Water Pursuant to
Sections 303(d) and 305 (b) of the Clean Water
Act. Dept. of Environ. Protection, Mass.
Division of Watershed Mgt., CN: 281.1
Nelson, G.A. 2006. A guide to statistical sampling
for the estimation of river herring run size using
visual counts. Mass. Div. of Mar. Fisheries,
Tech. Report No. TR-25.
PCCS. 2008. General Quality Assurance Project
Plan. Water Quality Monitoring of Cape Cod
Bay, 2008-2009. Provincetown Center for
Coastal Studies, Provincetown, MA.
Reback, K.E. and J.S. DiCarlo. 1972. Completion
report on the anadromous fish project. Mass.
Div. Mar. Fisheries, Publication No. 6496, 113
pp.
Reback, K.E., P.D. Brady, K.D. McLauglin, and
C.G. Milliken. 2004. A survey of anadromous
fish passage in coastal Massachusetts: Part 3.
South Shore. Mass. Div. of Mar. Fisheries, Tech.
Report No. TR-17.
US EPA. 2001. Ambient Water Quality Cireteria
Recommendations. Lakes and Reservoirs in
Nutrient Ecoregion XIV. Office of Water, US
Environ. Protection Agency, Washinggton, DC,
Document EPA 822-B-01-011.
Wetzel, R.G. 1983. Limnology. 2nd Edition,
Saunders College Publishing, Philadelphia. US
EPA. 2001. Ambient Water Quality Criteria
Recommendations. Lakes and Reservoirs in
Nutrient Ecoregion XIV. Office of Water, US
Environ. Protection Agency, Washington, DC,
Document EPA 822-B-01-011.
WAA. 2006. South Coastal Watershed Action
Plan. Prepared by Watershed Action Alliance of
Southeastern, MA. Marshfield, MA, for Mass.
Ex. Office. of Environ. Affairs.

17
Appendix
18
Ta
ble A
1. R
ainb
ow
melt fy
ke n
et catch su
mm
ary in
the Jo
nes R
iver.
Ta
ble
A.1
. Sm
elt fy
ke
ne
t ca
tch
su
mm
ary
for th
e J
one
s R
ive
r, Kin
gsto
n, 2
00
8-2
01
2.
2008
2009
2010
2011
2012
Sp
ecie
s N
am
eS
cie
ntific
Na
me
Typ
eC
atc
hC
atc
hC
atc
hC
atc
hC
atc
hT
ota
lF
OC
FO
CC
PU
E
(No
.)(N
o.)
(No
.)(N
o.)
(No
.)(N
o.)
(No
.)(%
)
rain
bo
w s
me
ltO
sm
eru
s m
ord
ax
Dia
dro
mo
us
395
326
859
242
1785
3607
128
79.0
22.2
7
wh
ite p
erc
hM
oro
ne
am
eric
an
us
Dia
dro
mo
us
19
41
185
34
22
301
66
40.7
1.8
6
Am
eric
an
ee
lA
ng
uilla
rostra
taD
iad
rom
ou
s17
21
20
716
81
49
30.2
0.5
0
se
a la
mp
rey
Pe
trom
yzo
n m
arin
us
Dia
dro
mo
us
12
11
55
3.1
0.0
3
ale
wife
Alo
sa
pse
ud
oh
are
ng
us
Dia
dro
mo
us
73
48
58
28
17.3
0.3
6
blu
eb
ack h
errin
gA
losa
ae
stiv
alis
Dia
dro
mo
us
116
17
95.6
0.1
0
Atla
ntic
tom
co
dM
icro
ga
du
s to
mco
dD
iad
rom
ou
s3
66
230
47
25
15.4
0.2
9
Am
eric
an
sh
ad
Alo
sa
sa
pid
issim
aD
iad
rom
ou
s1
11
0.6
0.0
1
strip
ed
ba
ss
Mo
ron
e s
axa
tilisD
iad
rom
ou
s1
11
0.6
0.0
1
mu
mm
ich
og
Fu
nd
ulu
s h
ete
roclitu
sE
stu
arin
e14
15
69
137
235
61
37.7
1.4
5
thre
esp
ine
stic
kle
ba
ck
Ga
ste
roste
us a
cu
lea
tus
Estu
arin
e4
39
214
79
138
37
22.8
0.8
5
fou
rsp
ine
stic
kle
ba
ck
Ap
elte
s q
ua
dra
cu
sE
stu
arin
e9
59
10
22
20
120
68
42.0
0.7
4
Atla
ntic
silv
ers
ide
Me
nid
ia m
en
idia
Estu
arin
e2
12
114
20
13
8.0
0.1
2
Atla
ntic
he
rring
C
lup
ea
ha
ren
gu
sE
stu
arin
e5
9147
161
10
6.2
0.9
9
win
ter flo
un
de
rP
se
ud
op
leu
ron
ecte
s a
me
rica
nu
sE
stu
arin
e
12
52
10
84.9
0.0
6
su
mm
er flo
un
de
rP
ara
lich
thys d
en
tatu
sE
stu
arin
e1
11
0.6
0.0
1
go
lde
n s
hin
er
No
tem
igo
nu
s c
ryso
leu
ca
sF
resh
wa
ter
11
10.6
0.0
1
blu
eg
illL
ep
om
is m
acro
ch
irus
Fre
sh
wa
ter
21
12
116
13
8.0
0.1
0
pu
mp
kin
se
ed
Le
po
mis
gib
bo
su
sF
resh
wa
ter
11
10.6
0.0
1
wh
ite s
ucke
rC
ato
sto
mu
s c
om
me
rso
ni
Fre
sh
wa
ter
11
10.6
0.0
1
ye
llow
pe
rch
Pe
rca
flave
ns
Fre
sh
wa
ter
2898
51
906
20
12.3
5.5
9
bro
wn
bu
llhe
ad
Am
eiu
rus n
eb
ulo
su
sF
resh
wa
ter
11
10.6
0.0
1
red
fin p
icke
rel
Eso
x a
me
rica
nu
sF
resh
wa
ter
11
10.6
0.0
1
bro
ok tro
ut
Sa
lve
linu
s fo
ntin
alis
Fre
sh
wa
ter
23
53
1.9
0.0
3
bro
wn
trou
tS
alm
o tru
ttaF
resh
wa
ter
11
10.6
0.0
1
wh
ite-tip
mu
d c
rab
Rh
ithro
pa
no
pe
us h
arris
iiIn
ve
rteb
rate
12
32
1.2
0.0
2
Atla
ntic
mu
d c
rab
Pa
no
pe
us h
erb
stii
Inve
rteb
rate
75
51
18
10
6.2
0.1
1
gra
ss s
hrim
pP
ala
em
on
ete
s s
p.
Inve
rteb
rate
78
19
13
38
18
11.1
0.2
3
sa
nd
sh
rimp
Cra
ng
on
se
pte
msp
ino
sa
Inve
rteb
rate
17
227
136
153
434
48
29.6
2.6
8
gre
en
cra
bC
arc
inu
s m
ae
na
sIn
ve
rteb
rate
12
32
1.2
0.0
2
To
tal C
atc
h505
1652
1116
465
2494
6232
To
tal H
au
ls33
32
33
31
33
Da
ta S
tatu
s: 2
00
8-2
01
1 F
inal (a
ud
ited); 2
012
Pre
limin
ary
(not a
udite
d)
FO
C: F
requ
en
cy o
f Occu
rrence
(nu
mb
er o
f hau
l wh
en
sp
ecie
s w
ere
pre
se
nt)
CP
UE
: Ca
tch
pe
r un
it effo
rt (tota
l num
ber c
aug
ht/to
tal h
au
ls, N
=1
62
)
19
Table A.2. Station locations sampled in Silver Lake and Forge Pond during 2008-2009.
Station Depth Max. Sample
No. Latitude Longitude Type Strata Depth (m) (No.) Location
SL1 42° 00.826 70° 47.645 transect shallow 1.0 11 shallow cove off Lake outlet
SL2 42° 00.568 70° 47.876 transect deep 13.8 12 mid-depth transect station
SL3 42° 00.528 70° 48.328 transect shallow 5.4 12 off Monponsett Pond diversion
SL4 42° 01.097 70° 48.431 transect deep 21.6 8 mid-Lake deep hole
SL5 42° 01.969 70° 48.714 survey shallow 0.9 2 off Tubbs Meadow Brook oulet
SL6 42° 00.606 70° 48.254 survey mid 7.5 1 exploratory station
SL1-A 42° 00.797 70° 47.715 transect shallow 0.5 1 substitute for SL1 when dry
FP1 42° 00.786 70° 47.288 outlet shallow 0.3 10 Forge Pond dam
FP2 42° 00.831 70° 47.416 transect shallow 0.4 4 mid-Forge Pond location
FP3 42° 00.845 70° 47.602 outlet shallow 0.4 11 Silver Lake outlet to Forge Pond
TM1 42° 01.994 70° 48.715 outlet outlet 0.2 2 Tubbs Meadow Brook outlet
Table A2. Station locations sampled in Silver Lake and Forge Pond during 2008-2009.
Table A.3. Summary water chemistry data collected at station SL1 in Silver Lake, 2008-2009.
The classification is based on May-September samples (N = 10, max. for each depth level).
The lake volume was lower in 2008, resulting in one bottom sample compared to five in 2009.
Surface (0.3 m depth)
Parameter Units N Mean SE Median
WQ
Criteria
Meeting
Criteria (%)
Temp. (°C) 10 22.37 1.289 22.74 ≤28.3 90
pH (SU) 10 6.97 0.118 6.99 ≥6.5, ≤8.3 90
DO (mg/L) 10 9.44 0.210 9.46 ≥5.0 100
DO sat. % 10 108.2 2.997 106.9 NA
Turbidity (NTU) 10 1.0 0.142 1.0 NA
Sp. Cond. (mS/cm) 10 0.160 0.002 0.160 NA
TN (mg/L) 8 0.381 0.021 0.390 0.320 25
TP (u g/L) 8 10.048 2.190 8.913 8.000 50
Secchi (m) 0 ≥2.0
Bottom-water (0.6 m ave. depth)
Parameter Units N Mean SE Median
WQ
Criteria
Meeting
Criteria (%)
Temp. (°C) 6 21.04 1.585 20.72 ≤28.3 100
pH (SU) 6 6.74 0.123 6.70 ≥6.5, ≤8.3 67
DO (mg/L) 6 9.64 0.315 9.51 ≥5.0 100
DO sat. % 6 107.2 3.768 106.7 NA
Turbidity (NTU) 6 2.0 0.571 1.7 NA
Sp. Cond. (mS/cm) 6 0.161 0.003 0.161 NA
Table A3. Summary of the water chemistry data collected at station SL1 in Silver Lake 2008-2009.
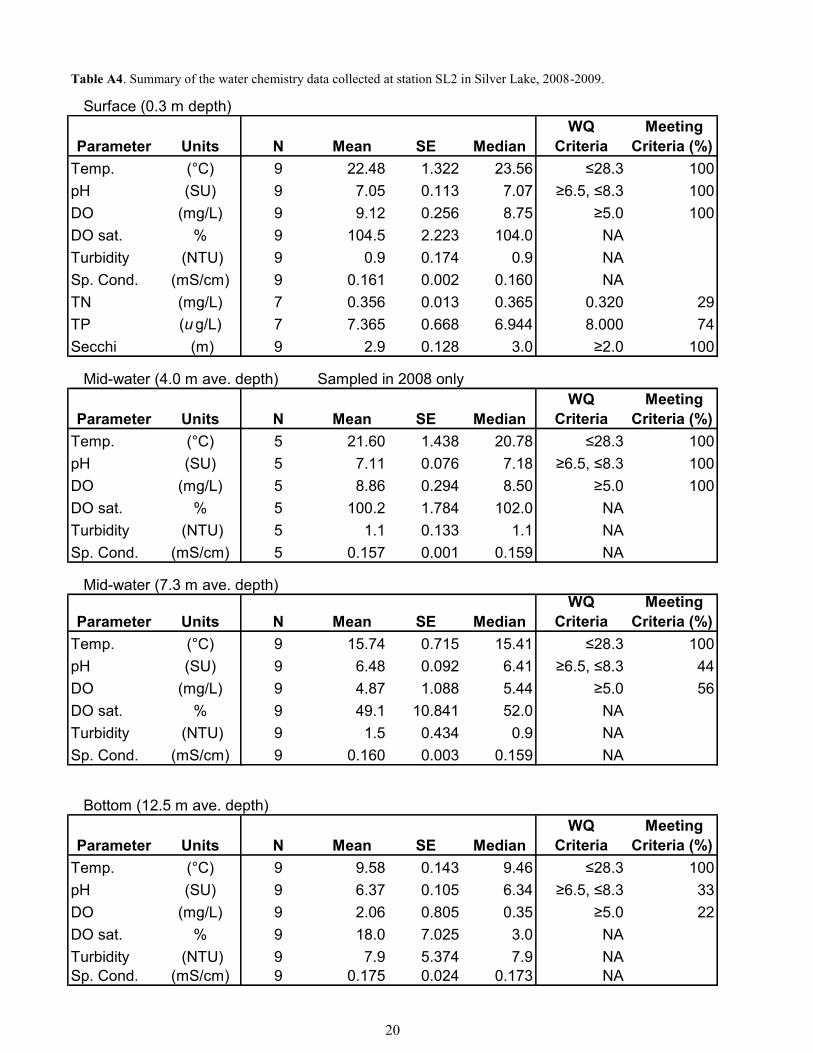
20
Table A.4. Summary water chemistry data collected at station SL2 in Silver Lake, 2008-2009.
The classification is based on May-September samples (N = 10, max. for each depth level).
Secchi disc depth measurements were only recorded at the surface.
Surface (0.3 m depth)
Parameter Units N Mean SE Median
WQ
Criteria
Meeting
Criteria (%)
Temp. (°C) 9 22.48 1.322 23.56 ≤28.3 100
pH (SU) 9 7.05 0.113 7.07 ≥6.5, ≤8.3 100
DO (mg/L) 9 9.12 0.256 8.75 ≥5.0 100
DO sat. % 9 104.5 2.223 104.0 NA
Turbidity (NTU) 9 0.9 0.174 0.9 NA
Sp. Cond. (mS/cm) 9 0.161 0.002 0.160 NA
TN (mg/L) 7 0.356 0.013 0.365 0.320 29
TP (u g/L) 7 7.365 0.668 6.944 8.000 74
Secchi (m) 9 2.9 0.128 3.0 ≥2.0 100
Mid-water (4.0 m ave. depth) Sampled in 2008 only
Parameter Units N Mean SE Median
WQ
Criteria
Meeting
Criteria (%)
Temp. (°C) 5 21.60 1.438 20.78 ≤28.3 100
pH (SU) 5 7.11 0.076 7.18 ≥6.5, ≤8.3 100
DO (mg/L) 5 8.86 0.294 8.50 ≥5.0 100
DO sat. % 5 100.2 1.784 102.0 NA
Turbidity (NTU) 5 1.1 0.133 1.1 NA
Sp. Cond. (mS/cm) 5 0.157 0.001 0.159 NA
Mid-water (7.3 m ave. depth)
Parameter Units N Mean SE Median
WQ
Criteria
Meeting
Criteria (%)
Temp. (°C) 9 15.74 0.715 15.41 ≤28.3 100
pH (SU) 9 6.48 0.092 6.41 ≥6.5, ≤8.3 44
DO (mg/L) 9 4.87 1.088 5.44 ≥5.0 56
DO sat. % 9 49.1 10.841 52.0 NA
Turbidity (NTU) 9 1.5 0.434 0.9 NA
Sp. Cond. (mS/cm) 9 0.160 0.003 0.159 NA
Bottom (12.5 m ave. depth)
Parameter Units N Mean SE Median
WQ
Criteria
Meeting
Criteria (%)
Temp. (°C) 9 9.58 0.143 9.46 ≤28.3 100
pH (SU) 9 6.37 0.105 6.34 ≥6.5, ≤8.3 33
DO (mg/L) 9 2.06 0.805 0.35 ≥5.0 22
DO sat. % 9 18.0 7.025 3.0 NA
Turbidity (NTU) 9 7.9 5.374 7.9 NA
Sp. Cond. (mS/cm) 9 0.175 0.024 0.173 NA
Table A4. Summary of the water chemistry data collected at station SL2 in Silver Lake, 2008-2009.
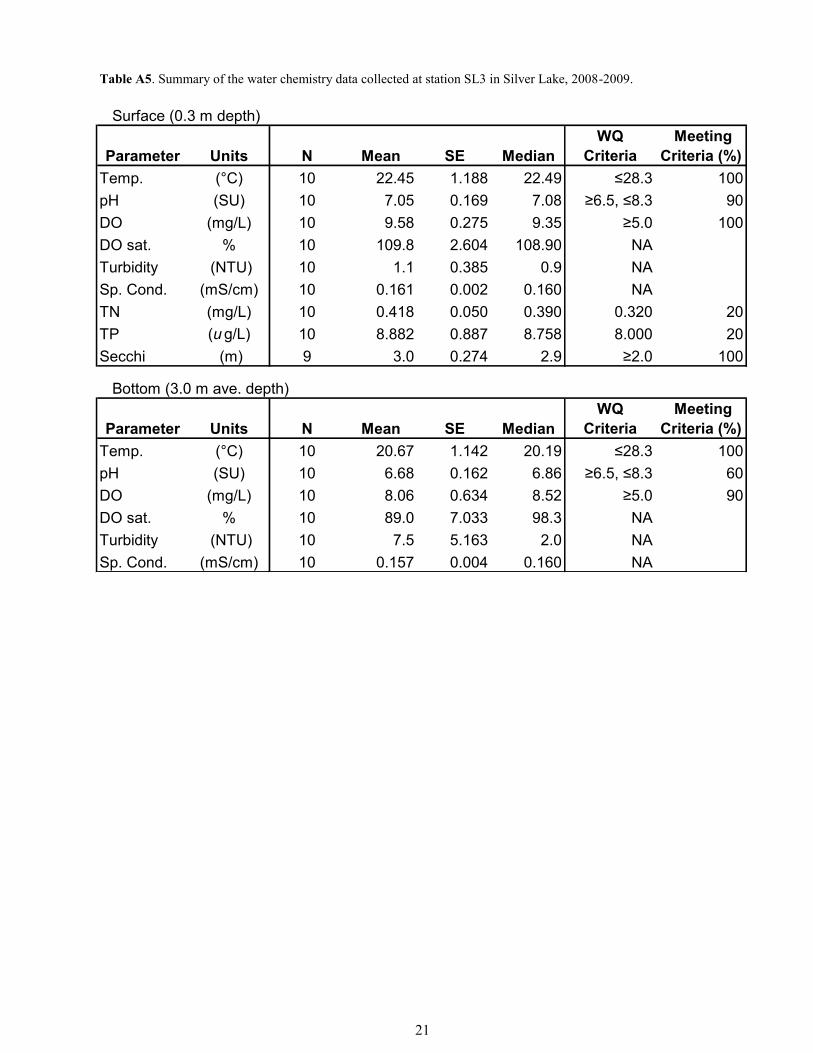
21
Table A.5. Summary water chemistry data collected at station SL3 in Silver Lake, 2008-2009.
The classification is based on May-September samples (N = 10, max. for each depth level).
Secchi disc depth measurements were only recorded at the surface.
Surface (0.3 m depth)
Parameter Units N Mean SE Median
WQ
Criteria
Meeting
Criteria (%)
Temp. (°C) 10 22.45 1.188 22.49 ≤28.3 100
pH (SU) 10 7.05 0.169 7.08 ≥6.5, ≤8.3 90
DO (mg/L) 10 9.58 0.275 9.35 ≥5.0 100
DO sat. % 10 109.8 2.604 108.90 NA
Turbidity (NTU) 10 1.1 0.385 0.9 NA
Sp. Cond. (mS/cm) 10 0.161 0.002 0.160 NA
TN (mg/L) 10 0.418 0.050 0.390 0.320 20
TP (u g/L) 10 8.882 0.887 8.758 8.000 20
Secchi (m) 9 3.0 0.274 2.9 ≥2.0 100
Bottom (3.0 m ave. depth)
Parameter Units N Mean SE Median
WQ
Criteria
Meeting
Criteria (%)
Temp. (°C) 10 20.67 1.142 20.19 ≤28.3 100
pH (SU) 10 6.68 0.162 6.86 ≥6.5, ≤8.3 60
DO (mg/L) 10 8.06 0.634 8.52 ≥5.0 90
DO sat. % 10 89.0 7.033 98.3 NA
Turbidity (NTU) 10 7.5 5.163 2.0 NA
Sp. Cond. (mS/cm) 10 0.157 0.004 0.160 NA
Table A5. Summary of the water chemistry data collected at station SL3 in Silver Lake, 2008-2009.
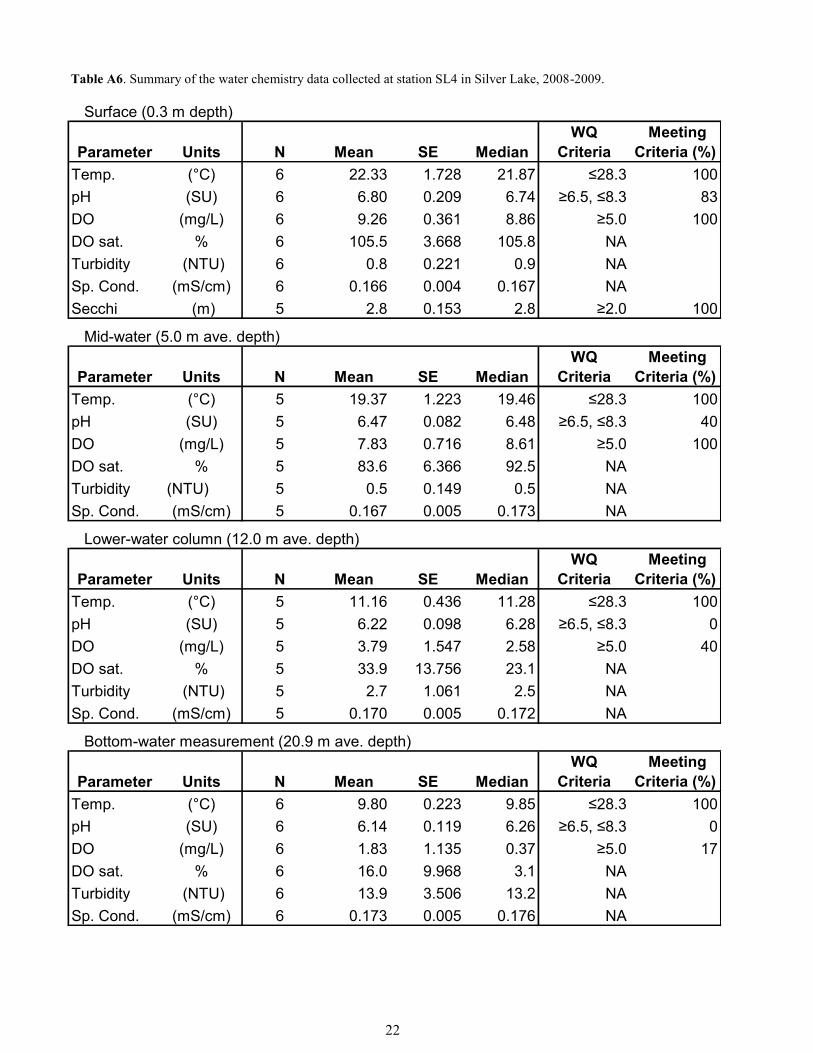
22
Table A.6. Summary water chemistry data collected at station SL4 in Silver Lake, 2008-2009.
The QAPP classification is based on May-September samples (N = 6, max. for each depth
level). Five of six samples occurred in 2009.
Surface (0.3 m depth)
Parameter Units N Mean SE Median
WQ
Criteria
Meeting
Criteria (%)
Temp. (°C) 6 22.33 1.728 21.87 ≤28.3 100
pH (SU) 6 6.80 0.209 6.74 ≥6.5, ≤8.3 83
DO (mg/L) 6 9.26 0.361 8.86 ≥5.0 100
DO sat. % 6 105.5 3.668 105.8 NA
Turbidity (NTU) 6 0.8 0.221 0.9 NA
Sp. Cond. (mS/cm) 6 0.166 0.004 0.167 NA
Secchi (m) 5 2.8 0.153 2.8 ≥2.0 100
Mid-water (5.0 m ave. depth)
Parameter Units N Mean SE Median
WQ
Criteria
Meeting
Criteria (%)
Temp. (°C) 5 19.37 1.223 19.46 ≤28.3 100
pH (SU) 5 6.47 0.082 6.48 ≥6.5, ≤8.3 40
DO (mg/L) 5 7.83 0.716 8.61 ≥5.0 100
DO sat. % 5 83.6 6.366 92.5 NA
Turbidity (NTU) 5 0.5 0.149 0.5 NA
Sp. Cond. (mS/cm) 5 0.167 0.005 0.173 NA
Lower-water column (12.0 m ave. depth)
Parameter Units N Mean SE Median
WQ
Criteria
Meeting
Criteria (%)
Temp. (°C) 5 11.16 0.436 11.28 ≤28.3 100
pH (SU) 5 6.22 0.098 6.28 ≥6.5, ≤8.3 0
DO (mg/L) 5 3.79 1.547 2.58 ≥5.0 40
DO sat. % 5 33.9 13.756 23.1 NA
Turbidity (NTU) 5 2.7 1.061 2.5 NA
Sp. Cond. (mS/cm) 5 0.170 0.005 0.172 NA
Bottom-water measurement (20.9 m ave. depth)
Parameter Units N Mean SE Median
WQ
Criteria
Meeting
Criteria (%)
Temp. (°C) 6 9.80 0.223 9.85 ≤28.3 100
pH (SU) 6 6.14 0.119 6.26 ≥6.5, ≤8.3 0
DO (mg/L) 6 1.83 1.135 0.37 ≥5.0 17
DO sat. % 6 16.0 9.968 3.1 NA
Turbidity (NTU) 6 13.9 3.506 13.2 NA
Sp. Cond. (mS/cm) 6 0.173 0.005 0.176 NA
Table A6. Summary of the water chemistry data collected at station SL4 in Silver Lake, 2008-2009.
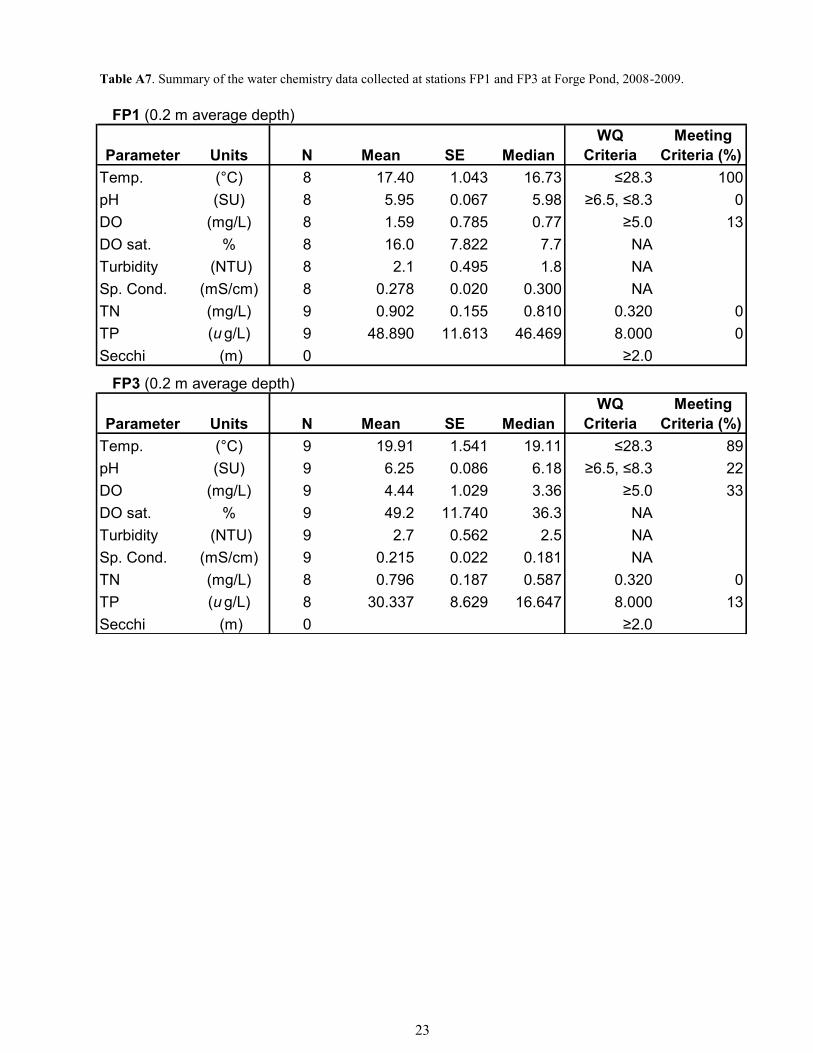
23
Table A.7. Summary water chemistry data collected at Forge Pond, 2008-2009.
The classification is based on May-September samples (N = 10, maximum).
FP1 (0.2 m average depth)
Parameter Units N Mean SE Median
WQ
Criteria
Meeting
Criteria (%)
Temp. (°C) 8 17.40 1.043 16.73 ≤28.3 100
pH (SU) 8 5.95 0.067 5.98 ≥6.5, ≤8.3 0
DO (mg/L) 8 1.59 0.785 0.77 ≥5.0 13
DO sat. % 8 16.0 7.822 7.7 NA
Turbidity (NTU) 8 2.1 0.495 1.8 NA
Sp. Cond. (mS/cm) 8 0.278 0.020 0.300 NA
TN (mg/L) 9 0.902 0.155 0.810 0.320 0
TP (u g/L) 9 48.890 11.613 46.469 8.000 0
Secchi (m) 0 ≥2.0
FP3 (0.2 m average depth)
Parameter Units N Mean SE Median
WQ
Criteria
Meeting
Criteria (%)
Temp. (°C) 9 19.91 1.541 19.11 ≤28.3 89
pH (SU) 9 6.25 0.086 6.18 ≥6.5, ≤8.3 22
DO (mg/L) 9 4.44 1.029 3.36 ≥5.0 33
DO sat. % 9 49.2 11.740 36.3 NA
Turbidity (NTU) 9 2.7 0.562 2.5 NA
Sp. Cond. (mS/cm) 9 0.215 0.022 0.181 NA
TN (mg/L) 8 0.796 0.187 0.587 0.320 0
TP (u g/L) 8 30.337 8.629 16.647 8.000 13
Secchi (m) 0 ≥2.0
Table A7. Summary of the water chemistry data collected at stations FP1 and FP3 at Forge Pond, 2008-2009.