Embed Size (px)
Citation preview

1 1
Per Sandberg and Sigurd Tjelmeland
Harvest rules and recovery strategiesThe case of Norwegian spring spawning herring

2 2
Background

3 3
Agreed harvest control rule
F F=0.125 F=0.05
SSB 2.5 m.t. 5.0 m.t.

4 4
Questions evaluated:
1. Is the expected net economic revenue of this agreed harvest rule higher than the economic revenue from a so-called ”target escapement” rule?
2. Which ”target fishing mortality” would give the highest economic revenue?
3. Is the harvest rule performing better or worse than a ”target escapement rule” in a period of recovery?

5 5
Biological model and assumptions
• Model: Seastar – (ICES assessment model for Norwegian spring
spawning herring).
• Prognostic simulation– Period: 50 years
– Number of replicates: 500
– Beverton Holt stochastic recruitment (as in Seastar)
– Deterministic growth, natural mortality and exploitation pattern.

6 6
Recruitment = Rmax*SSB/(Rhalf + SSB)- where Rmax and Rhalf is estimated from two subsets of recruitment numbers as illustrated below. The variance of the residuals is the basis for stochasticity. 75% of prognostic recruitment is drawn from the black subset and 25% from the red subset.
2.5 5 7.5 10 12.5 15
200
400
600
800
recruitmentMax 242.582recruitmentHalf 44.1937recruitmentDistributionUncertainty 0.999643
648979767384
9766 61
8696
74
51
88876978 9452
7753
7568 0062 5482 5658 5780 55659572 6781 017071
83
50
9291
59
85
6390
9802
9360
99

7 7
Economic model and assumptions
• Consequences for Norwegian fishermen only– Fixed share of TAC to Norway
– Allocation of Norwegian quota on three vessel groups according to pre-agreed rule
– Price: Either fixed or decreasing in harvest
– Variable costs: Decreasing in harvest for all three vessel groups, decreasing in biomass for coastal vessels.
– Discount rate: 5 % per annum

8 8
The expected NPV, E[NPV] of the Norwegian harvest of Norwegian spring spawning herring in a 50- year period when applying constant escapement from 1 to 7 million tonnes and the Ad Hoc Rule established by the managers of the stock. Discount rate is set to 5%. Figures in million NOK
Constant Escapement E[NPV] (in million tonnes) Fixed prices
1 8 772 2 9 529 3 8 979 4 9 051 5 7 739 6 6 423 7 5 276
AdHocRule 6 048
9 9
The expected NPV, E[NPV] of the Norwegian harvest of Norwegian spring spawning herring in a 50- year period when applying constant escapement from 1 to 7 million tonnes and the Ad Hoc Rule established by the managers of the stock. Discount rate is set to 5%. Figures in million NOK
Constant Escapement E[NPV] (in million tonnes) Price decreasing in harvest
1 1 296 2 1 631 3 1 873 4 2 057 5 2 072 6 1 739 7 1 608
AdHocRule 3 265

10 10
Question 2: Which ”target fishing mortality would give highest economic revenue?
F F=0.125 F=0.05
SSB 2.5 m.t. 5.0 m.t.
11 11
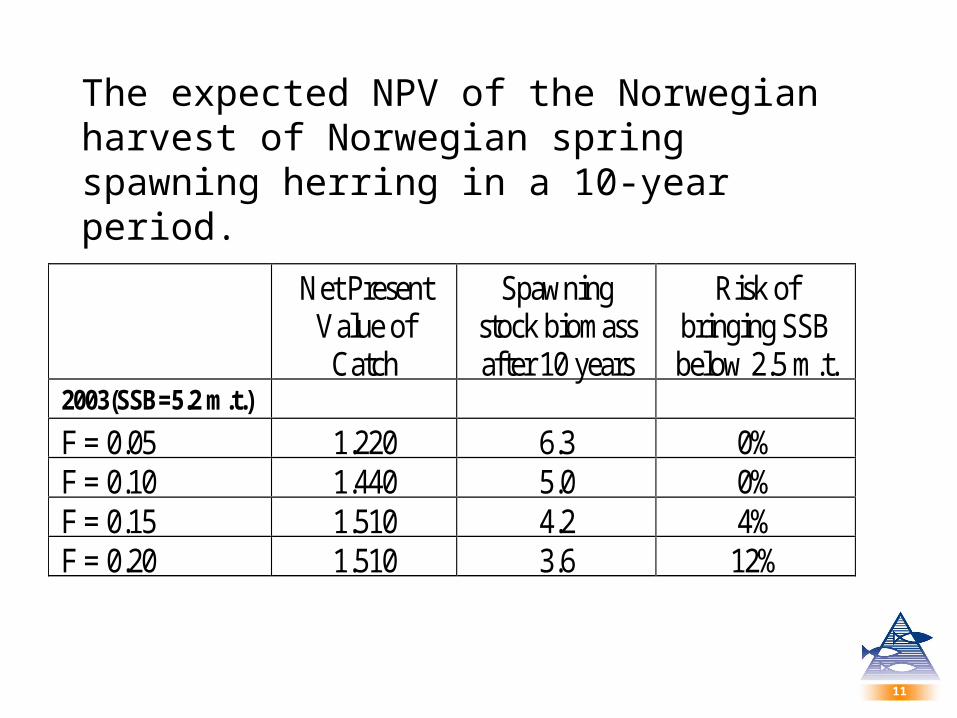
The expected NPV of the Norwegian harvest of Norwegian spring spawning herring in a 10-year period.
Net Present Value of
Catch
Spawning stock biomass after 10 years
Risk of bringing SSB below 2.5 m.t.
2003(SSB=5.2 m.t.) F = 0.05 1.220 6.3 0% F = 0.10 1.440 5.0 0% F = 0.15 1.510 4.2 4% F = 0.20 1.510 3.6 12%

12 12
Question 3: Is the agreed harvest rule performing better or worse than a constant escapement strategy in a period of recovery?
• Consequences for Norwegian fishermen– Starting year: 1975– Simulation period: 50 years– Prices decreasing in harvest– Discount rate: 5%– Fixed shares of TAC to Norway, allocation on
three Norwegian vessel groups with cost structure as identified above.

13 13
•Development in spawning stock. Left panel: Target escapement of 5 million tonnes.Right panel: Agreed harvest control rule.
50Time
2
4
6
8
10
12
14
Spawning stock ,Million tonnes
50Time
2
4
6
8
10
12
14
Spawning stock ,Million tonnes

14 14
Expected NPV, expected SSB at the end of the period and the probability of SSB<2.5 million
tonnes during the period.
Harvest rule E[NPV] during period
E[SSB] at end of period
P(SSB<2.5 m.t.) during
period
Target escapement= 5 m.t.
326 4,3 56%
Agreed harvest rule 869 4,1 70%

15 15
Summing up
1. When prices are fixed, and adjustment costs in the fleet are zero, target escapement gives higher NPV than the agreed harvest control rule.
2. When prices are decreasing in harvest, this conclusion is reversed.
3. In the agreed harvest strategy, increasing the fishing mortality above 0.10 only gives a moderate increase in NPV but a substantial reduction in SSB

16 16
Summing up (2)
4. In a period of recovery, the consequences of a target escapement strategy and the agreed harvest rule are very different.
– A target escapement strategy would imply a moratorium on the fishery for a long period.
– The agreed harvest rule would allow a fishery also at low stock levels.
– Consequently, there is a tradeoff between stock rebuilding and NPV of the fishery.