Embed Size (px)
Citation preview
Rivalry, Market Structure and Innovation: The Case of Mobile Banking*
Zhaozhao Hea
This Draft: September, 2014
* I am grateful to Robert DeYoung for his substantial guidance and support in accomplishing this
research project. I have also benefitted greatly from the constructive suggestions of George Bittlingmayer
and Lawrence J. White. For helpful comments, I would like to thank Ferhat Akbas, Christopher
Anderson, Allen Berger, Yuliya Demyanyk, Ling T. He, Jian Huang, Paul Koch, Lei Li, Felix Meschke,
Gokhan Torna, Babajide (Jide) Wintoki, Raluca Roman, and seminar participants at the University of
Kansas, and the 2013 Southern Finance Association (SFA) meeting in Puerto Rico. All remaining errors
are my own.
aUniversity of Kansas. Zhaozhao can be reached at phone: (785)-864-8065, email: [email protected], and
mailing address: 1300 Sunnyside Avenue, Lawrence, KS 66045
2
Rivalry, Market Structure and Innovation: The Case of Mobile Banking
Abstract
This paper focuses on a novel phenomenon—mobile banking diffusion—to analyze innovative behavior
in the U.S. modern banking era. Using a unique, hand-collected dataset of mobile banking app adoption
for 2008-2012, this study shows strong evidence that rivalry adoptions spur technological innovation.
This effect increases monotonically with the degree of market concentration, and is the strongest in most
concentrated markets, where banks compete on non-price attributes. These results are robust to the
application of instrumental variables that address the possibility that adoptions are merely simultaneous
reactions to the same common forces. Finally, the impact of mobile app adoption on bank performance is
also examined.
Keywords: Competitive Rivalry, Innovation, Market Structure, Mobile Banking, Technology Adoption
JEL Classifications: D43, G21, O14, O33
3
I. Introduction
The prominent role of product market competition in spurring innovation has been the subject of a long
line of research in the economic literature.1 And yet, this topic area has generated an extraordinary
amount of debate and disagreement. Theoretical models suggest rather mixed effects of the impact of
competition on innovation (Aghion, et al., 2005). On the empirical side, existing studies document diverse
and conflicting results, suggesting that a competitive market can either encourage or deter innovative
activities.2 Further, both theoretical and empirical literature on the relation between competition and
technology adoption is limited (Milliou and Petrakis, 2011; p.515). Almost none of the prior work
examines how rivalry adoptions, a proxy for dynamic competitive pressure, interact with market structure
during the technology diffusion process. One exception is the research on the adoption of the Automated
Teller Machines (ATMs) in the banking sector. Hannan and McDowell (1987) document that the positive
role of peers’ adoptions in ATM diffusion diminishes in more concentrated markets.
More than two decades after the ATM study, this paper focuses on a novel phenomenon—mobile
banking technology—to investigate the joint role of prior adoptions and market structure in fostering
future adoptions. Mobile banking has grown substantially in the last few years and has gained rising
attention from financial intermediaries by virtue of the critical role of retail banking. Meanwhile, mobile
applications, also called “mobile apps”, catalyze its growth and remain as the superior mobile platform
recently. Mobile apps create unique user experiences with rich interface capabilities for distributing
banking services, and thus are better perceived as strategic technologies that enable banks to differentiate
from their competitive peers.
This study uses a unique, hand-collected dataset of mobile app adoption from iTunes as a proxy for the
adoption of mobile banking from July 2008 to June 2012. Specifically, I ask whether and how banks react
to competitors’ adoptions of apps, and whether the reactions depend on market structure. I use market
1 See e.g., Mansfield (1968); Reinganum (1981); Hannan and McDowell (1984, 1987); Hernández-Murillo, et al.
(2010); 2 See e.g., Escuer et al. (1991); Hernández-Murillo, et al. (2010); Hannan and McDowell (1984, 1987); Saloner and
Shepard (1995)
4
concentration levels, measured by Hirshman-Herfinhdal index (HHI), to proxy for the mode of
competition. Intuitively, firm strategic interactions may differ substantially in markets with different
features. For instance, markets with low concentration ratios are better characterized by competition in
prices (Bertrand competition) and highly concentrated markets dominated by competition in quantities
(Cournot competition). Milliou and Petrakis (2011) develop a theoretical model and show that Cournot
competition encourages technology adoption by the second firm more than Bertrand competition. This is
because technology adoption increases adopters’ output and decrease peers’ output, which is referred to
as the strategic effect. Thus, their model suggests a positive strategic effect of adoptions by rivals under
Cournot competition.3 Along these lines, I argue that rivals’ adoptions of mobile apps encourage potential
adoptions more in concentrated markets than in competitive markets, primarily because the dominant
strategic component of apps makes them more appealing under the non-price competition.4
Empirical work faces the challenge that a bank may well move to mobile banking not because a rival
has done so, but rather because the two are subject to the same, partly unmeasured exogenous forces. I
address this identification challenge by using rivals’ deposit shares in other markets to predict rivals’
adoption decisions. While rivals’ deposit shares in other markets correlate with their incentives to adopt
mobile apps, there is little reason to believe that outside deposit shares of competitors have a direct
influence on the potential adopters in that market other than through rivals’ strategic behavior.
Based on a total of 99,960 bank-quarter observations with 694 commercial banks that adopted mobile
apps, the instrumented rivalry adoptions estimated in a Cox proportional hazard model show strong
evidence that the propensity to innovate is affected by peers’ strategic decisions. Further, the influence of
rival precedence on the adoption of mobile apps depends on the degree of market concentration.
Specifically, banks react more strongly to strategic rivals in more concentrated markets than in
3 Milliou and Petrakis (2011) suggest a negative strategic effect under Bertrand competition, because prior adoptions
decrease the market price level including the price of peers. However, this is unlikely the case for mobile app
technology. In the current context, the positive strategic effect is diminished under Bertrand competition because
banks are competing on price attributes. 4 For instance, adopting rivals may be able to attract more customers from banks not having apps, and thus make
adoptions appealing.
5
competitive markets. To cement the validity of the interpretation, I provide further evidence using
subsamples sorted on HHI. The results uncover a monotonically increasing impact of rivalry adoptions on
the likelihood of adoption across HHI quartiles, with the strongest impact in highly concentrated markets,
where banks compete on non-price attributes. This finding supports the economic theory of the classic
oligopolistic competition, in which firms are interdependent and most sensitive to rivals’ non-price
choices (Scherer and Ross, 1990, pp. 199).
Finally, I investigate the impact of mobile app adoption on bank performance. The evidence indicates
first mover advantage in that mobile app adoption improves a bank’s overall profitability by adopting
early. The results show that a potential revenue source is deposit-related service charges. Mobile app
adoption is also associated with higher advertising expenditures, more workers relative to assets, and
increased labor costs, supporting the view that banks adopted mobile apps for strategic purposes. Finally,
there is little evidence of changes in the branch intensity, suggesting that mobile banking, like the Internet
channel, might be a complement to physical branches (DeYoung, Lang, and Nolle, 2007).
This research makes two major contributions. First, it employs a unique, hand-collected dataset to first
study the latest banking technology diffusion—the adoption of mobile apps—to add to our understanding
of the nature of firm interactions in the financial service sector, which has been received little attention in
the innovation literature (Frame and White, 2004). Moreover, prior studies on financial innovations have
almost exclusively relied on special survey data due to the scarcity of suitable data (e.g., Akhavein,
Frame, and White, 2005).5
Second, this paper addresses the long-standing and unsettled question of the effect of rivalry on the
adoption of a new technology in the banking industry. Research on the dynamic impact of competitive
rivalry during waves of technology diffusion has been limited, mainly because empirically identifying the
role of competitive pressure in adopting innovations is inherently difficult (Forman, 2005). Major hurdles
include the quality of measurements and potential simultaneity problems. The present study addresses
5 See Frame and White (2004) for an excellent literature review on the adoption of financial innovations
6
both issues—measurement and simultaneity—and establishes that the impact of strategic adoptions
increase monotonically with the degree of market concentration. Interestingly, the classic study of ATM
adoptions by Hannan and McDowell (1987) finds the opposite results. Plausibly, since ATMs are in large
part a labor-saving technology, the adoption is more likely when firms are sensitive to peers’ pricing
moves (Arrow, 1962).
Taken together, this study illuminates that strategic rivalry needs to be taken into account when
assessing the relation between competitive pressure and firms’ innovative behavior. The results also
highlight the differential impact of rivals’ competitive strategies on adopting different types of
technological products conditional on the mode of the competition, which might have implications for
policy makers when trying to modify the nature of competitive environment to spur innovation.
The reminder of the paper is organized as follows. Section II describes the development of mobile
banking. Second III reviews the relevant literature. Section IV develops the main hypotheses. Section V
describes the data and methodology. Section VI presents the empirical results. Finally, Section VII
concludes.
II. Mobile Banking
Mobile banking is defined as using a mobile phone to access financial accounts by means of a bank’s web
page, either through a mobile web browser, text messaging (SMS), or a mobile app, according to Federal
Reserve (2012).6,7
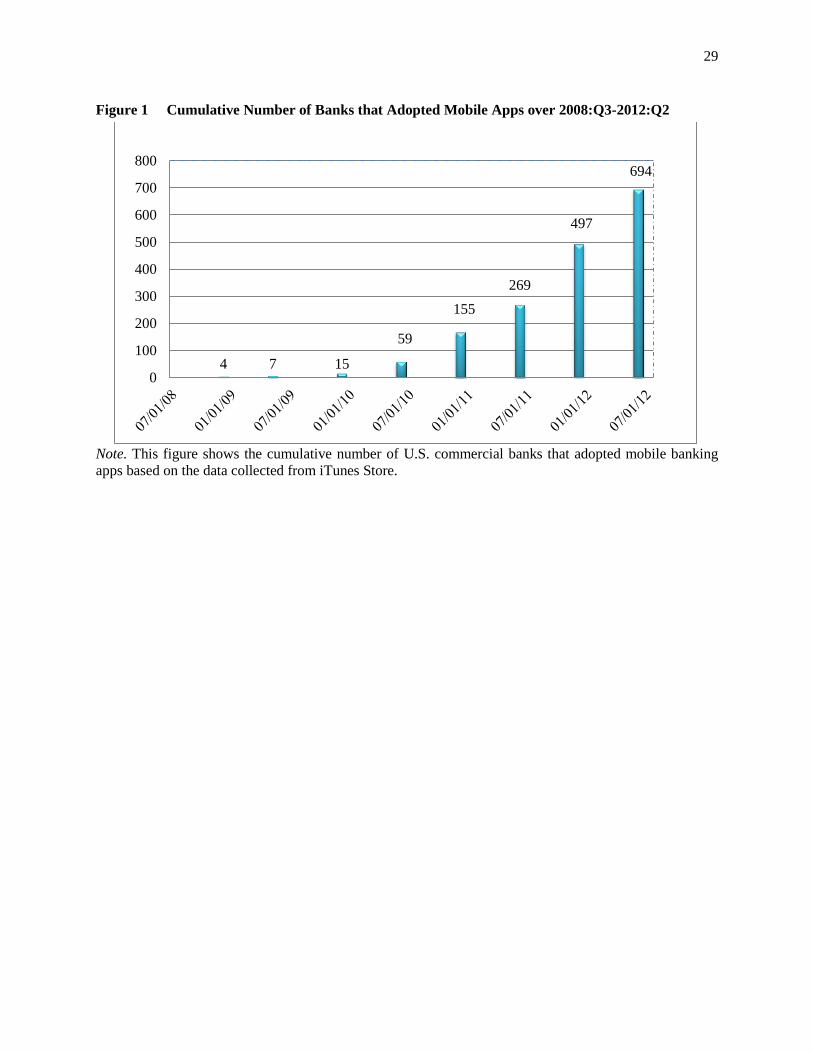
Mobile banking apps have proliferated since the appearance of iPhone apps in July
2008, when Bank of America was the pioneer adopter. The number of banks with an iPhone app more
than tripled from 155 to 497 during 2011, and the trend continues to increase, as illustrated in Figure 1.
6 Mobile banking is distinct from mobile payment techniques, such as Google Wallet and Paypal services, which
enable users to make “tap payments” through a near field communication (NFC) chip installed in the smartphone
(Federal Reserve, 2012). 7 Mobile banking has attracted considerable attention from Federal Reserve,
financial institutions and social media.
In March 2012, Board of Governors of the Federal Reserve System reported the findings from an online survey
conducted in December 2011 and January 2012, examining the use of mobile technology to access financial services
and make financial decisions. It is reported that mobile phones and mobile Internet access are in widespread use.
7
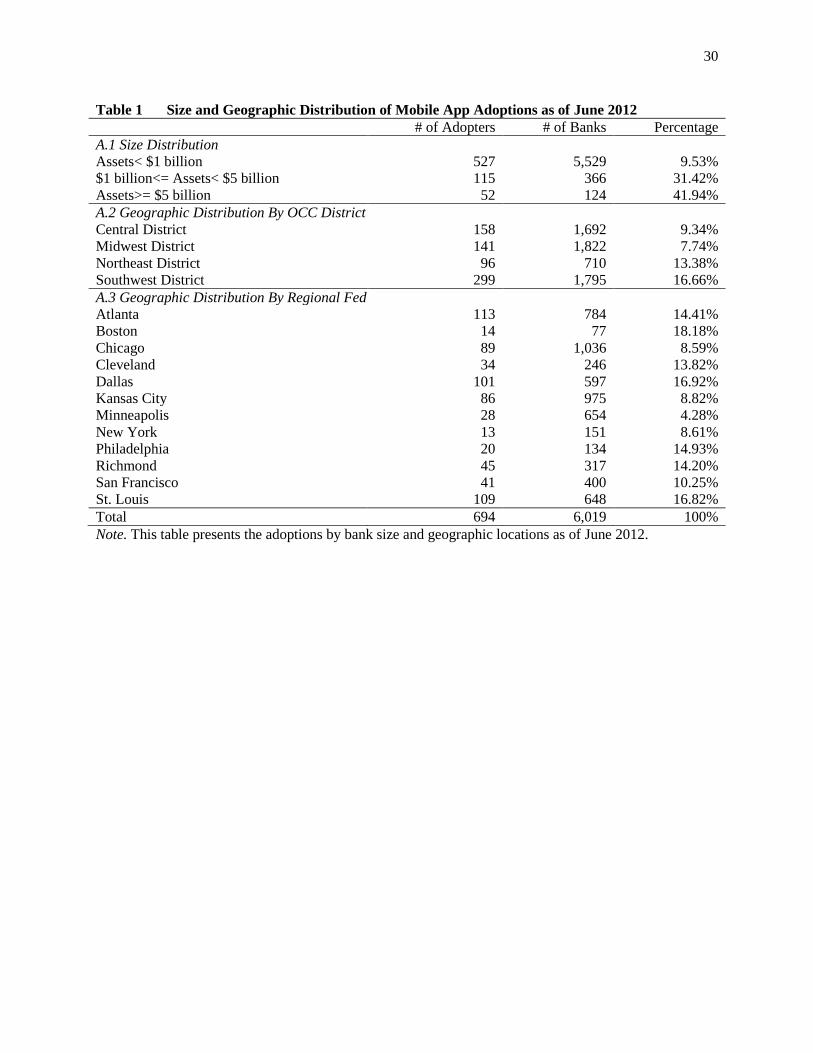
By July 2012, the end of sample period, 694 out of 6,019 U.S. banks had introduced iPhone apps.
8 Table
1 presents the adoption rates by bank size and geographic region. As seen, banks with larger size are more
likely to adopt, consistent with prior studies on technology adoption by banks. In terms of geographic
distribution, the Southwest district exhibits the highest adoption rates of 16.7%, while the Midwest
district has the lowest. When grouped by regional Federal Reserve District, banks under the jurisdiction
of Boston, Dallas, or St. Louis Fed show the greatest propensities to develop mobile banking apps.
These observations raise an important question: what drive the mobile app adoptions by banks?
Anecdotal evidence suggests that the fundamental goal of rolling out mobile offerings is to deepen
customer relationships (American Banker, February 6, 2012), since mobile apps enable banks to develop
divergent distribution channels and to deliver customized financial services, thus enhancing customer
satisfaction and further stabilizing market shares.9 With regards to functionalities, mobile apps mainly
offer transactional-based services that are similar to Internet websites, ranging from account information
to personal wealth management. One of the superiorities of mobile banking over online banking come
from a special feature, the Remote Deposit Capture (RDC), which allows customers to deposit checks by
snapping digital photos without going to a banking center. Recently, banks have started to monetize some
of the mobile conveniences.10
As such, adopting mobile apps allow banks to grow revenues more easily,
while the impact of adoption on cost reduction is less clear. For example, banks may invest more on
advertising to market their new mobile services, and may have to hire specialized employees to roll out
and maintain the apps and to address security issues. In all, this novel phenomenon provides a good
opportunity to examine the adoption of a strategic technology in the financial service sector.
8 iTunes stopped disclosing newly launched banking apps around September, 2012. So the sample period ends in
mid-2012. 9 “Banks Seek Sticky Relationships from Mobile Apps”, American Banker, February 6, 2012.
10 “Mobile Banking Pricing Model Becomes Clearer As More Banks Charge Fees,” American Banker, October 30,
2013.
8
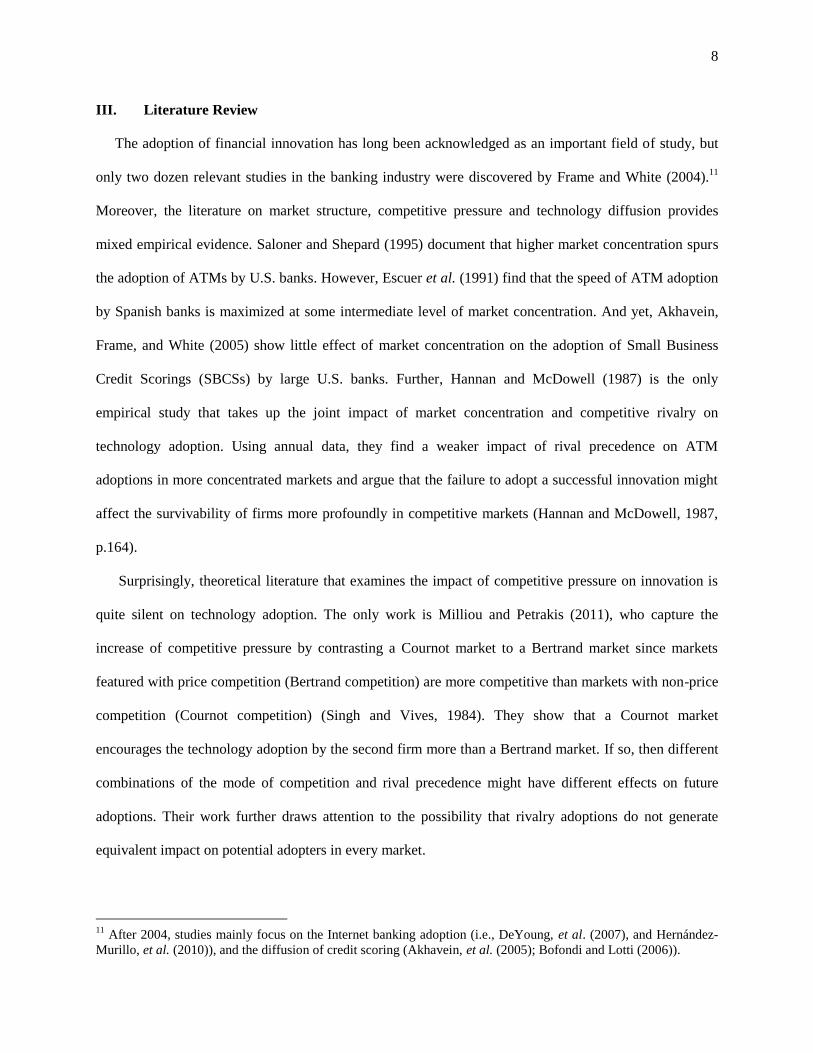
III. Literature Review
The adoption of financial innovation has long been acknowledged as an important field of study, but
only two dozen relevant studies in the banking industry were discovered by Frame and White (2004).11
Moreover, the literature on market structure, competitive pressure and technology diffusion provides
mixed empirical evidence. Saloner and Shepard (1995) document that higher market concentration spurs
the adoption of ATMs by U.S. banks. However, Escuer et al. (1991) find that the speed of ATM adoption
by Spanish banks is maximized at some intermediate level of market concentration. And yet, Akhavein,
Frame, and White (2005) show little effect of market concentration on the adoption of Small Business
Credit Scorings (SBCSs) by large U.S. banks. Further, Hannan and McDowell (1987) is the only
empirical study that takes up the joint impact of market concentration and competitive rivalry on
technology adoption. Using annual data, they find a weaker impact of rival precedence on ATM
adoptions in more concentrated markets and argue that the failure to adopt a successful innovation might
affect the survivability of firms more profoundly in competitive markets (Hannan and McDowell, 1987,
p.164).
Surprisingly, theoretical literature that examines the impact of competitive pressure on innovation is
quite silent on technology adoption. The only work is Milliou and Petrakis (2011), who capture the
increase of competitive pressure by contrasting a Cournot market to a Bertrand market since markets
featured with price competition (Bertrand competition) are more competitive than markets with non-price
competition (Cournot competition) (Singh and Vives, 1984). They show that a Cournot market
encourages the technology adoption by the second firm more than a Bertrand market. If so, then different
combinations of the mode of competition and rival precedence might have different effects on future
adoptions. Their work further draws attention to the possibility that rivalry adoptions do not generate
equivalent impact on potential adopters in every market.
11
After 2004, studies mainly focus on the Internet banking adoption (i.e., DeYoung, et al. (2007), and Hernández-
Murillo, et al. (2010)), and the diffusion of credit scoring (Akhavein, et al. (2005); Bofondi and Lotti (2006)).
9
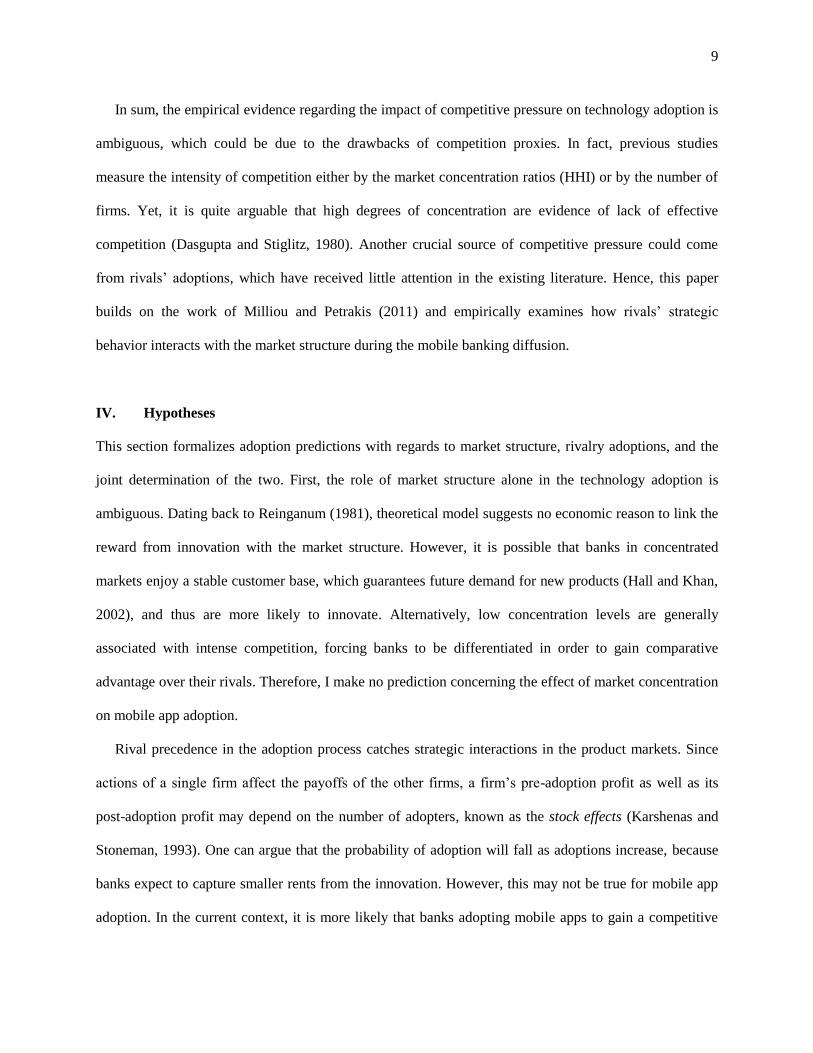
In sum, the empirical evidence regarding the impact of competitive pressure on technology adoption is
ambiguous, which could be due to the drawbacks of competition proxies. In fact, previous studies
measure the intensity of competition either by the market concentration ratios (HHI) or by the number of
firms. Yet, it is quite arguable that high degrees of concentration are evidence of lack of effective
competition (Dasgupta and Stiglitz, 1980). Another crucial source of competitive pressure could come
from rivals’ adoptions, which have received little attention in the existing literature. Hence, this paper
builds on the work of Milliou and Petrakis (2011) and empirically examines how rivals’ strategic
behavior interacts with the market structure during the mobile banking diffusion.
IV. Hypotheses
This section formalizes adoption predictions with regards to market structure, rivalry adoptions, and the
joint determination of the two. First, the role of market structure alone in the technology adoption is
ambiguous. Dating back to Reinganum (1981), theoretical model suggests no economic reason to link the
reward from innovation with the market structure. However, it is possible that banks in concentrated
markets enjoy a stable customer base, which guarantees future demand for new products (Hall and Khan,
2002), and thus are more likely to innovate. Alternatively, low concentration levels are generally
associated with intense competition, forcing banks to be differentiated in order to gain comparative
advantage over their rivals. Therefore, I make no prediction concerning the effect of market concentration
on mobile app adoption.
Rival precedence in the adoption process catches strategic interactions in the product markets. Since
actions of a single firm affect the payoffs of the other firms, a firm’s pre-adoption profit as well as its
post-adoption profit may depend on the number of adopters, known as the stock effects (Karshenas and
Stoneman, 1993). One can argue that the probability of adoption will fall as adoptions increase, because
banks expect to capture smaller rents from the innovation. However, this may not be true for mobile app
adoption. In the current context, it is more likely that banks adopting mobile apps to gain a competitive
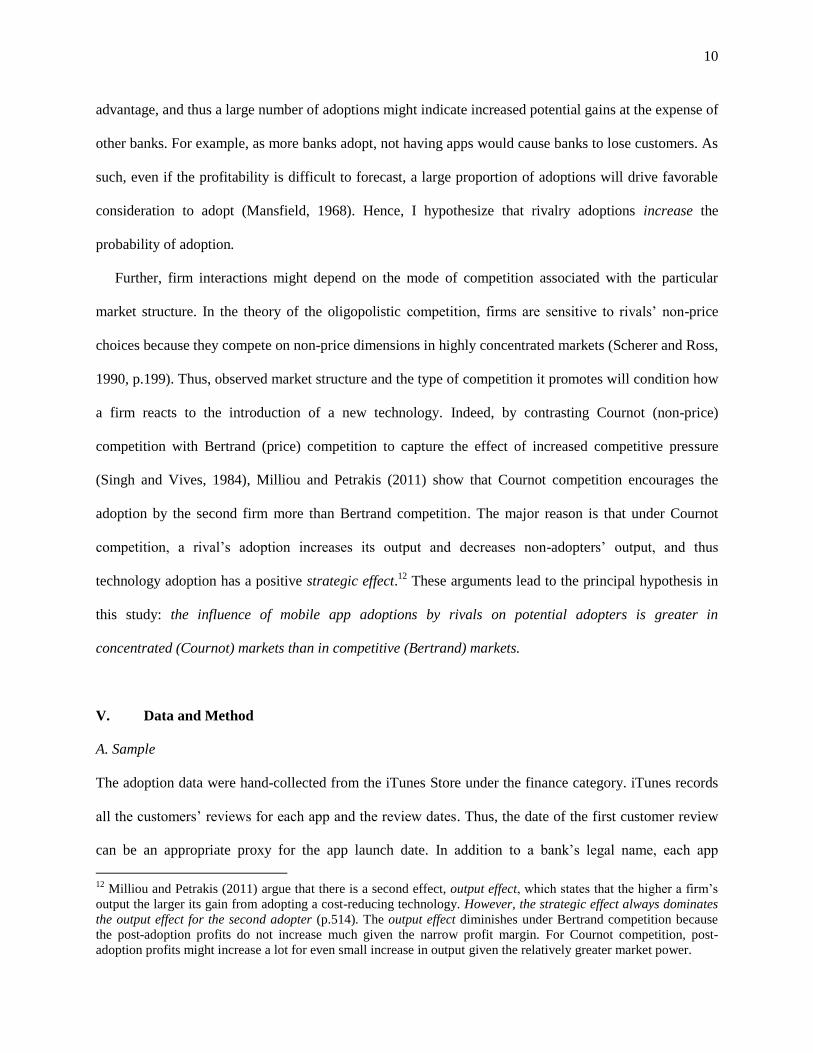
10
advantage, and thus a large number of adoptions might indicate increased potential gains at the expense of
other banks. For example, as more banks adopt, not having apps would cause banks to lose customers. As
such, even if the profitability is difficult to forecast, a large proportion of adoptions will drive favorable
consideration to adopt (Mansfield, 1968). Hence, I hypothesize that rivalry adoptions increase the
probability of adoption.
Further, firm interactions might depend on the mode of competition associated with the particular
market structure. In the theory of the oligopolistic competition, firms are sensitive to rivals’ non-price
choices because they compete on non-price dimensions in highly concentrated markets (Scherer and Ross,
1990, p.199). Thus, observed market structure and the type of competition it promotes will condition how
a firm reacts to the introduction of a new technology. Indeed, by contrasting Cournot (non-price)
competition with Bertrand (price) competition to capture the effect of increased competitive pressure
(Singh and Vives, 1984), Milliou and Petrakis (2011) show that Cournot competition encourages the
adoption by the second firm more than Bertrand competition. The major reason is that under Cournot
competition, a rival’s adoption increases its output and decreases non-adopters’ output, and thus
technology adoption has a positive strategic effect.12
These arguments lead to the principal hypothesis in
this study: the influence of mobile app adoptions by rivals on potential adopters is greater in
concentrated (Cournot) markets than in competitive (Bertrand) markets.
V. Data and Method
A. Sample
The adoption data were hand-collected from the iTunes Store under the finance category. iTunes records
all the customers’ reviews for each app and the review dates. Thus, the date of the first customer review
can be an appropriate proxy for the app launch date. In addition to a bank’s legal name, each app
12
Milliou and Petrakis (2011) argue that there is a second effect, output effect, which states that the higher a firm’s
output the larger its gain from adopting a cost-reducing technology. However, the strategic effect always dominates
the output effect for the second adopter (p.514). The output effect diminishes under Bertrand competition because
the post-adoption profits do not increase much given the narrow profit margin. For Cournot competition, post-
adoption profits might increase a lot for even small increase in output given the relatively greater market power.
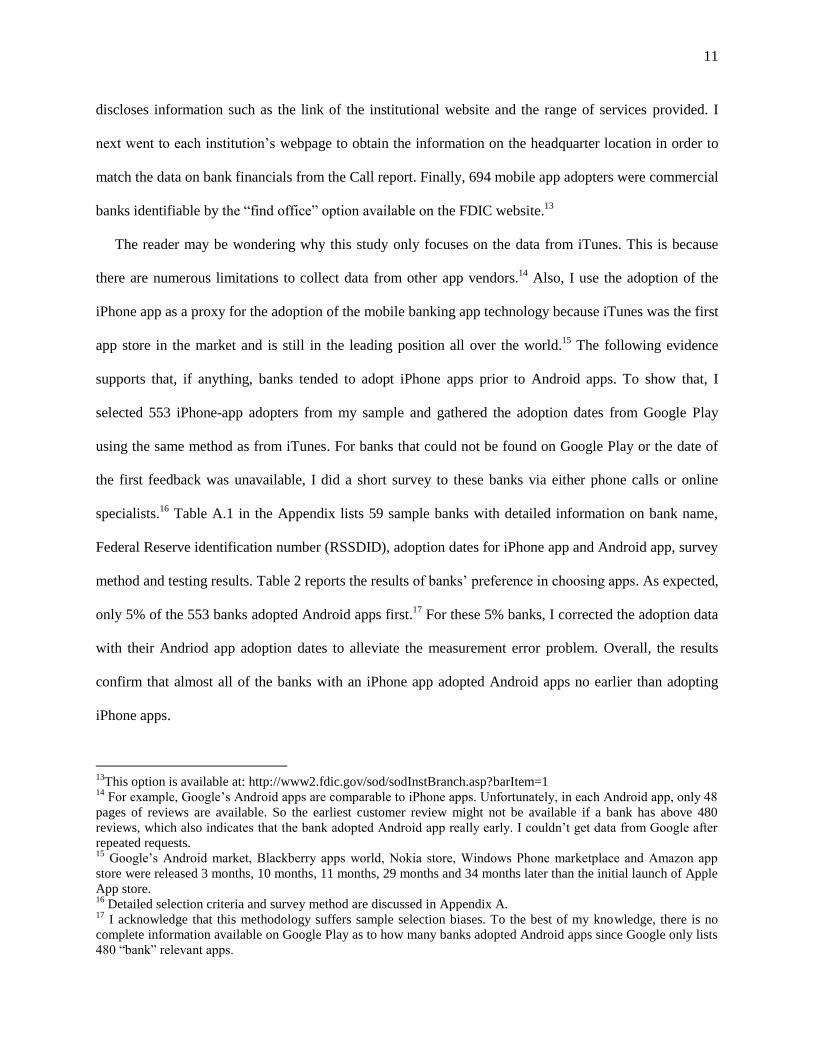
11
discloses information such as the link of the institutional website and the range of services provided. I
next went to each institution’s webpage to obtain the information on the headquarter location in order to
match the data on bank financials from the Call report. Finally, 694 mobile app adopters were commercial
banks identifiable by the “find office” option available on the FDIC website.13
The reader may be wondering why this study only focuses on the data from iTunes. This is because
there are numerous limitations to collect data from other app vendors.14
Also, I use the adoption of the
iPhone app as a proxy for the adoption of the mobile banking app technology because iTunes was the first
app store in the market and is still in the leading position all over the world.15
The following evidence
supports that, if anything, banks tended to adopt iPhone apps prior to Android apps. To show that, I
selected 553 iPhone-app adopters from my sample and gathered the adoption dates from Google Play
using the same method as from iTunes. For banks that could not be found on Google Play or the date of
the first feedback was unavailable, I did a short survey to these banks via either phone calls or online
specialists.16
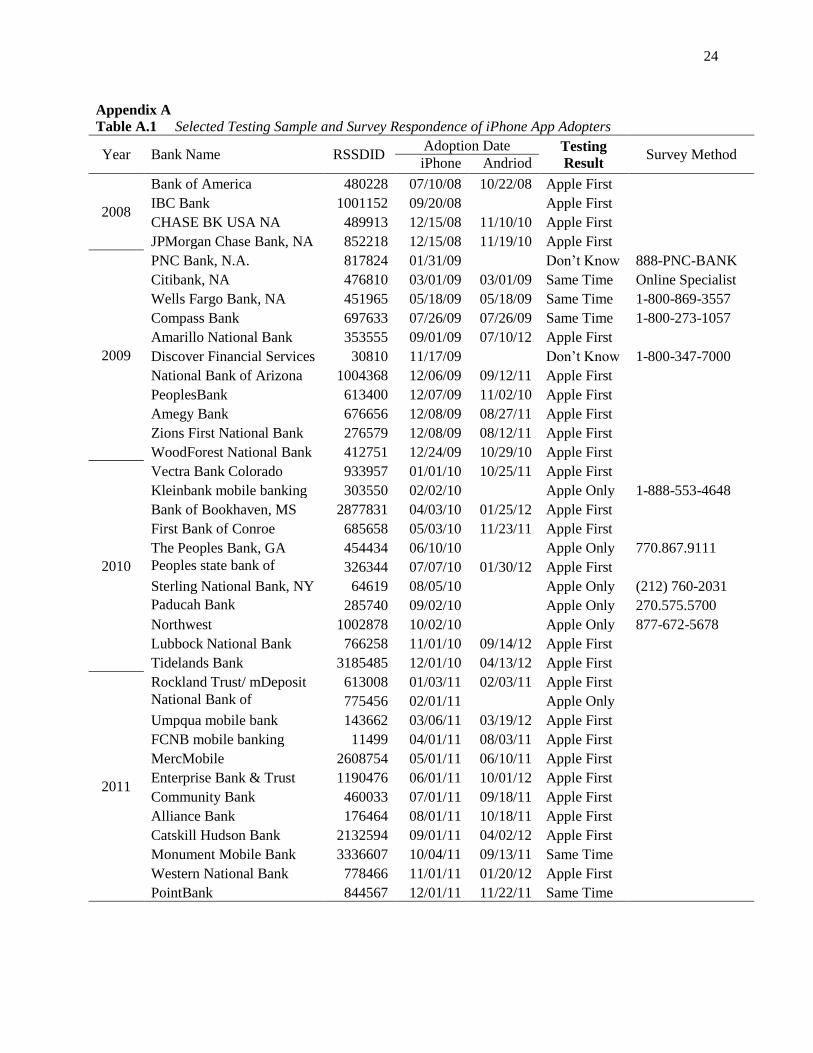
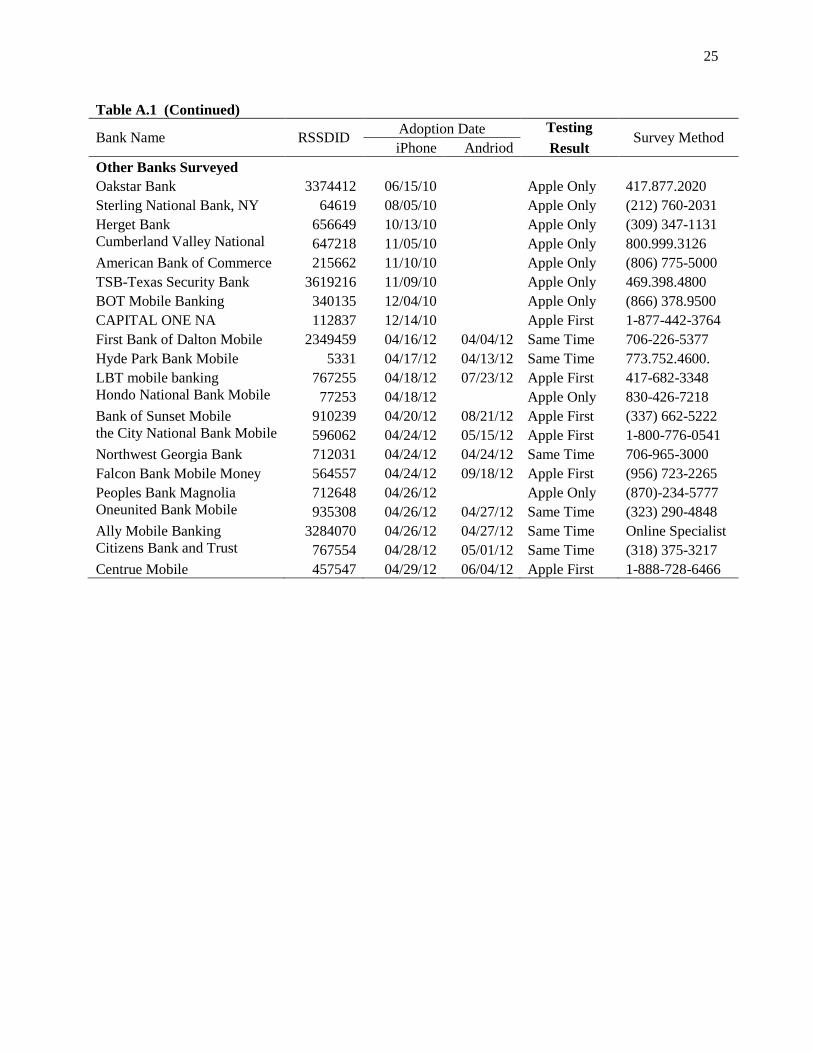
Table A.1 in the Appendix lists 59 sample banks with detailed information on bank name,
Federal Reserve identification number (RSSDID), adoption dates for iPhone app and Android app, survey
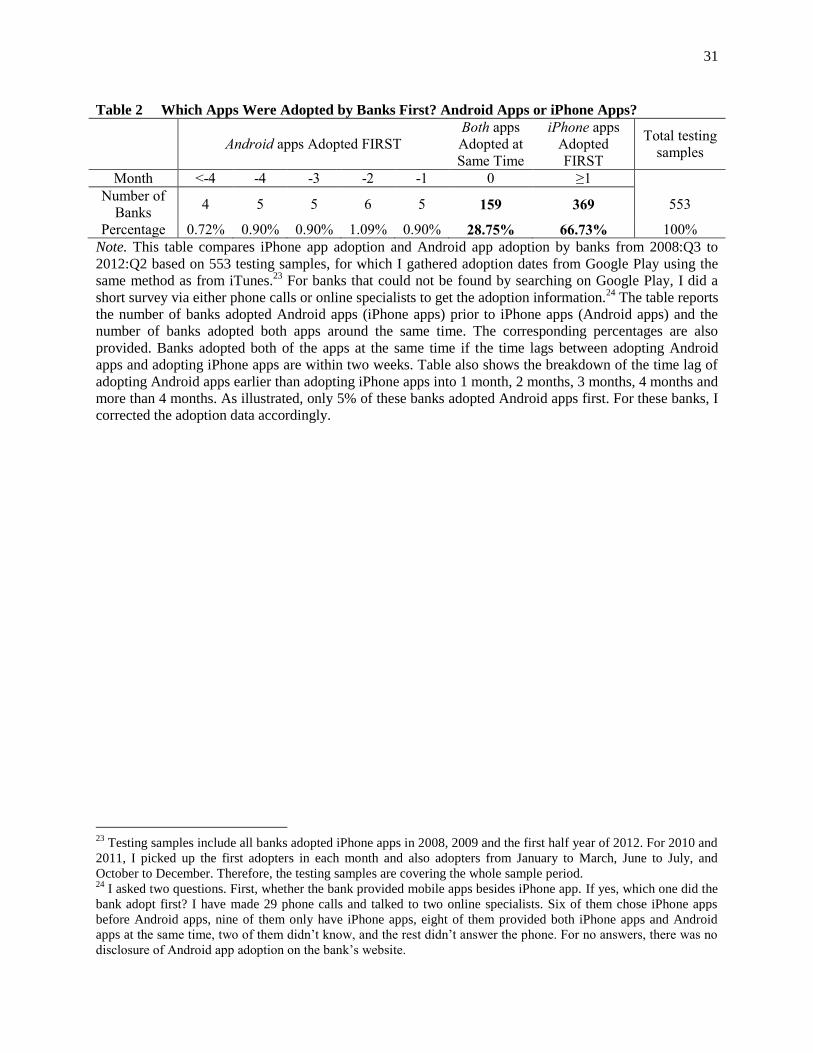
method and testing results. Table 2 reports the results of banks’ preference in choosing apps. As expected,
only 5% of the 553 banks adopted Android apps first.17
For these 5% banks, I corrected the adoption data
with their Andriod app adoption dates to alleviate the measurement error problem. Overall, the results
confirm that almost all of the banks with an iPhone app adopted Android apps no earlier than adopting
iPhone apps.
13
This option is available at: http://www2.fdic.gov/sod/sodInstBranch.asp?barItem=1 14
For example, Google’s Android apps are comparable to iPhone apps. Unfortunately, in each Android app, only 48
pages of reviews are available. So the earliest customer review might not be available if a bank has above 480
reviews, which also indicates that the bank adopted Android app really early. I couldn’t get data from Google after
repeated requests. 15
Google’s Android market, Blackberry apps world, Nokia store, Windows Phone marketplace and Amazon app
store were released 3 months, 10 months, 11 months, 29 months and 34 months later than the initial launch of Apple
App store. 16
Detailed selection criteria and survey method are discussed in Appendix A. 17
I acknowledge that this methodology suffers sample selection biases. To the best of my knowledge, there is no
complete information available on Google Play as to how many banks adopted Android apps since Google only lists
480 “bank” relevant apps.
12
In addition to the adoption data, information was gathered from three data sources. Call report data on
bank financials were obtained from the Wharton Financial Institutional Center and the Federal Reserve
Bank of Chicago website. Branch-level data on deposits and locations were collected from the Summary
of Deposits from the FDIC website. Lastly, economic and demographic data were extracted from the
Bureau of Labor Statistics.
B. Empirical Methodology
As with the case of other innovative technologies, banks face idiosyncratic short-run circumstances that
influence the costs and benefits of adopting mobile apps. I thus employ a Cox proportional hazard model
to examine the effects of rivalrous adoption and the market structure conditional on other covariates that
might influence the adoption decisions. The model specifies a hazard rate taking the form:
[ ( ) ] ( ) [ ( ) ] ( )
where [ ( ) ], referred to as the hazard rate, is the probability that a bank developed a mobile app at
time t given that it has not done so before time t. ( ) is the vector of explanatory variables and is a
vector of parameters to be estimated. ( ) is the baseline hazard rate without specific functional form. At
each quarter t, captures the effect of change in ( ) on the relative risk of failure (probability of
adoption). A positive coefficient suggests that an increase in the variable increases the hazard of adoption.
To reliably gauge the effect of competitive rivalry on mobile app adoption, I identify rival banks at the
branch level to capture their geographical presence. For each quarter, I calculate Local Rivals as the
percentage of rival banks that had introduced mobile apps in each market, and then weight the percentage
by the deposit shares a bank has in each market. I define markets at the MSA level when a bank operates
within an MSA, otherwise at the county level. Hence, Local Rivals dynamically capture the weighted
average competitive pressure a bank faces throughout the investigation period. To proxy for the market
structure, I compute the market concentration ratio, which is defined as the deposit-weighted sum of
squared deposit shares of banks within each market and denoted as HHI_Deposits.
13
The vector ( ) incorporates a host of control variables, MSA fixed effects and year fixed effects. The
MSA fixed effects control for common time-invariant unobserved market characteristics that may have
driven adoptions by both rivals and potential adopters. The year fixed effects account for transitory
nation-wide factors, such as negative macroeconomic conditions, that could influence the likelihood of
adoption. To mitigate the concern that there might be some other firm- or market- specific factors
connected to the adoption decisions, I follow the literature on technology adoption in the banking industry
(e.g., Akhavein, et al., 2005; and Hernández-Murillo, et.al., 2010) and include bank size, age, Tier 1 ratio
(a control for financial health), share of core deposits (a proxy for retail focus), service revenue relative to
deposits (a control for the profitability of the customer base), labor and salaries, worker per branch,
branch intensity (controlling for current service delivery channels), advertising and marketing
expenditures (a proxy for image focus), and asset growth. Further, loan loss provision, loan charge-offs
and a dummy indicating whether a bank has received TARP funds are included to alleviate the possibility
that adoption might be polluted by the stressful recession period. I also include the fraction of the
population under age 20-34, job growth rate and wage level to control for local market conditions. These
market variables are weighted by the deposit shares of a bank to construct bank-specific market-level
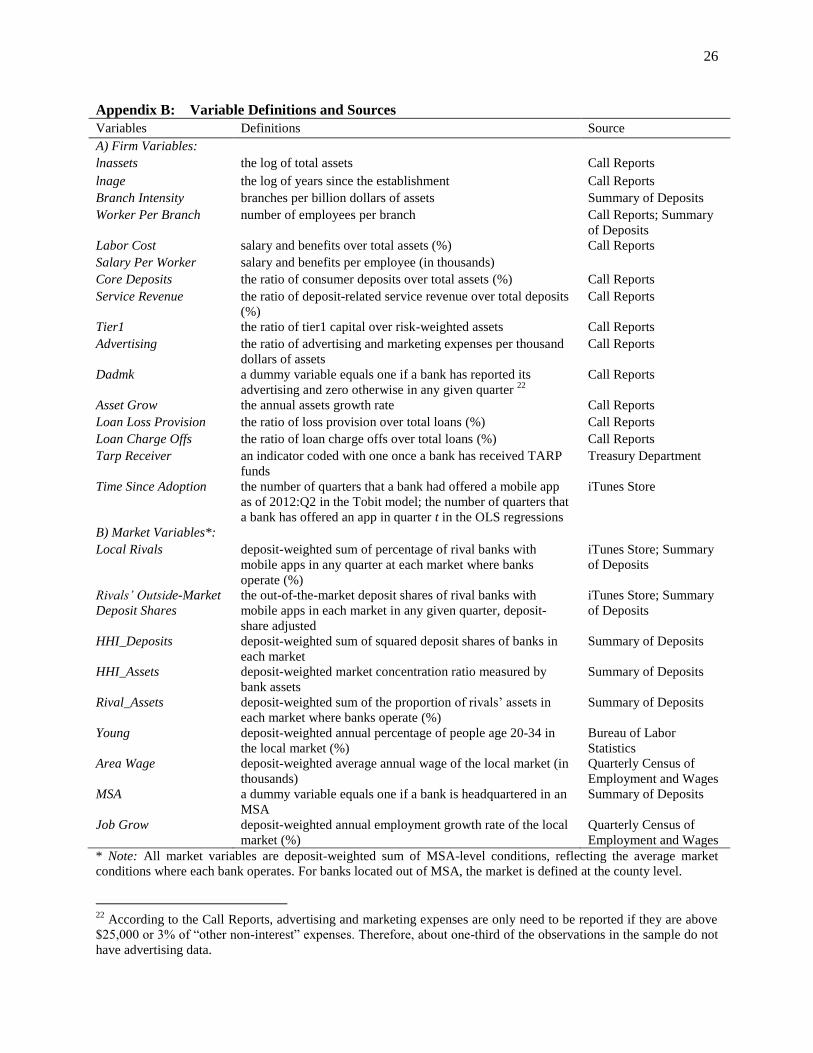
variables, thus reflecting the average market conditions where the bank operates. All variable definitions
and data sources are reported in Appendix B. Finally, to mitigate the effect of outliers, all controls are
winsorized at the 1st and 99
th percentiles.
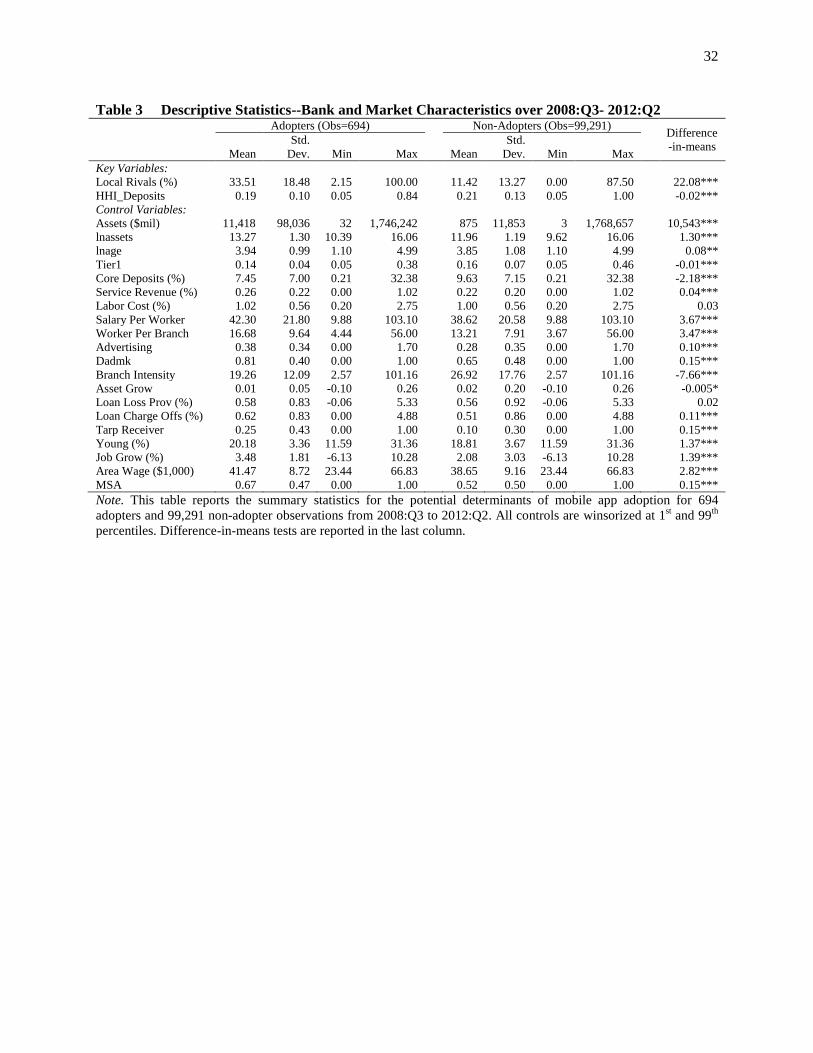
Table 3 reports the summary statistics of all variables included in the empirical analysis. We see that
mobile app adopters are significantly different from non-adopters in virtually all of the measured
dimensions except for labor cost, asset growth and loan loss provision, demonstrated by the difference-in-
means tests in the last column. It is at primary importance to note that the average percentage of rivals
with mobile apps when adoptions occur is 33.51%, much higher than the mean rivalry adoptions for non-
adopters (11.42%). Moreover, mobile app adopters are situated in significantly less concentrated markets
than their counterparts.

14
Some of the control variables show evidence consistent with the extant literature. For example, banks
that have adopted apps are substantially larger, earn greater revenue from the services on deposit
accounts, more focus on advertising and marketing strategies, and locate in MSA areas with higher wage
levels and healthier local economic conditions. Other covariates might be specific to the case of mobile
banking technology. Banks that have less intensive branching networks are more likely to be adopters
because these banks might prefer branchless delivery channels. They appear to have worse conditions
than non-adopters, indicated by lower Tier 1 ratio, higher loan charge-offs and higher likelihood to
receive TARP funds. Finally, the adoptions tend to occur in the markets with young adults populated,
suggesting higher demand for such services from the youth. More detailed discussion will be presented in
the result section.
C. Identification
Although the MSA fixed effects soak up the average effect of the unobserved market heterogeneity, it is
still possible that some other time-varying market characteristics simultaneously determine adoptions by
rivals and potential adopters. To tackle this simultaneity bias, I use an instrumental variables (IV)
approach. Specifically, Local Rivals are instrumented by rivals’ deposit shares outside of the market and a
dummy indicating whether a bank is headquartered in an MSA. The main instrument, denoted as Rivals’
Outside-Market Deposit Shares, is constructed as follows: for each quarter, I compute the deposit shares
of rival banks out of the market for any given market, adjusting for the market shares of rival banks, and
then weight by the deposit shares of each bank. Essentially, I extract the portion of rivals’ decisions that
are uncorrelated with potential adoptions within the market to explain these rivals’ adoptions. While
rivals’ deposit shares in other markets affect their propensity to adopt, there is little reason to think that
out-of-market attributes of competitors have a direct impact on future adoptions in that market other than
through rivals’ strategic behavior. In a similar vein, a bank’s headquarter location determine its

15
innovation incentives, but is unlikely to be directly associated with adoptions by other banks. Hence,
these two variables are reasonably justified and should be valid instruments for Local Rivals.18
Even if the instrumental variables approach alleviates the concern about simultaneity of rivalry
adoptions, this method does not fully resolve the simultaneous bias due to unobservable market
characteristics. Note, however, I address this issue in three ways. First, the host of controls should capture
a wide range of unobservable effects. Second, the incorporation of MSA fixed effects removes the time-
invariant unobserved market heterogeneity that may lead to the increases in both rivalry adoptions and the
probability of adoption. Third, I cluster the standard errors at the MSA level to account for potential time-
varying correlations in unobserved factors that affect banks within the same MSAs.
VI. The Empirical Findings
A. The Influence of Rivalry and Market Structure on Mobile App Adoption – Main Results
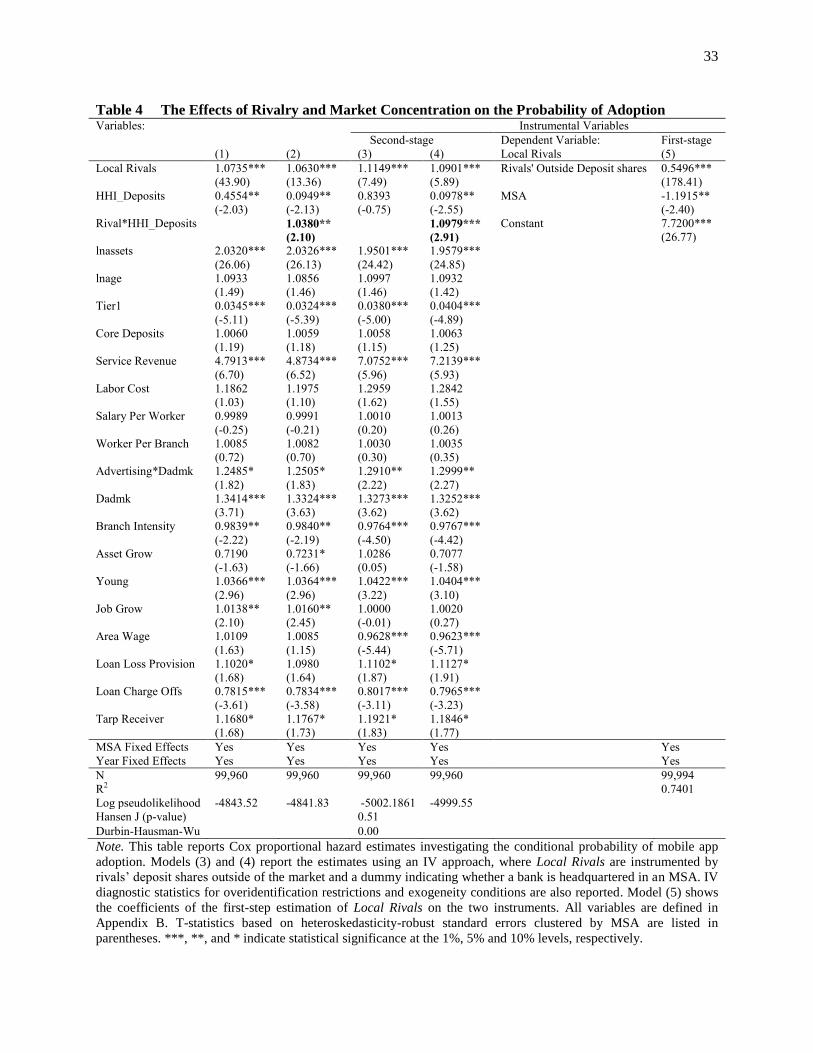
This section reports the results obtained from the Cox proportional hazard model. Table 4 gives the odds
ratios and t-statistics based on the heteroskedasticity-robust standard errors clustered by MSA. In column
(1), the odds ratio of Local Rivals is greater than one and is significant at a 1% statistical level, indicating
that the adoptions by rivals significantly increase a bank’s incentives to offer a mobile app. The odds ratio
of HHI_Deposits is smaller than one and significant at a 5% level, suggesting that banks operating in less
concentrated markets exhibit a higher propensity to adopt. This result is consistent with studies on the
Internet banking adoption (DeYoung, et al., 2007). In column (2), I perform the test of joint effect of
rivalry adoptions and market structure by interacting Local Rivals with HHI_Deposits. As hypothesized,
the odds ratio on the interaction term is larger than one and significant at a 1% level, reflecting a stronger
effect of rivalrous adoption in more concentrated markets.
Note, however, these results might be biased due to the simultaneity issue of rivalry adoptions. I thus
apply the IV approach by regressing Local Rivals on Rivals’ Outside-Market Deposit Shares and an MSA
18
In the empirical analysis, I provide detailed identification tests to show the validity of the instruments.
16
dummy, while controlling for MSA fixed effects and year fixed effects, to get the predicted Local Rivals,
which is then used in the estimation of the hazard model. The results are reported in columns (3) and (4)
of Table 4. Column (3) shows that rivalry adoptions have an even stronger positive impact on adoption
decisions, after largely eliminating the source of simultaneity bias. In terms of economic magnitude, a
one-standard-deviation-increase in the percentage of rivalry adoptions translates into an 11.49%-increase
in the odds of adoption, holding other things constant. This finding supports the notion that the adoption
of a mobile service channel is a strategic, defensive move, in line with the phenomenon of Internet
banking (Forman 2005; Hernández-Murillo, et al., 2010, DeYoung, et al., 2007). However, the odds ratio
on HHI_Deposits becomes insignificant, implying that market structure alone has little predictive power
on the likelihood of adopting a mobile app, which supports the conclusion of Reinganum (1981). This
result is also consistent with the finding in Akhavein, Frame, and White (2005), who fail to discern any
significant impact of market concentration on SBCS adoptions.
Of particular importance, column (4) of Table 4 shows that the odds ratio on the interaction term
becomes larger in magnitude (increasing from 1.038 in column (2) to 1.098 in column (4)) and is
statistically significant at a 1% level. Consequently, we obtain an even stronger conclusion that rival
precedence has a significantly greater impact on adoption decisions of mobile apps in more concentrated
markets. This result provides empirical evidence to the economic theory of the classic oligopolistic
competition that firms tend to compete on non-price attributes when markets are highly concentrated
(Scherer and Ross, 1990, pp.595). As mentioned, such adoption behavior differs remarkably from the
findings in Hannan and McDowell (1987), possibly due to the mode of competition and the distinct nature
of underlying technological products. As ATMs should be more attractive in competitive markets, banks
have stronger reactions to rivals’ low prices than those in concentrated markets (Arrow, 1962).
I also examine the effect of heterogeneity of participants and market environment on the rate of mobile
app adoption. First, consistent with the literature, bank size (lnassets) positively predicts the likelihood of
adoption, supporting the rank effects that larger banks are more likely to invest in technologies than

17
smaller banks because of scale economics or low risk exposure (Karshenas and Stoneman, 1993; Hall and
Khan, 2002).19
Second, bank’s financial condition, as proxied by the Tier 1 ratio, has a significant and
negative effect on adoption incentives, suggesting that banks with worse financial conditions are more
likely to be adopters; these banks might view mobile banking as a means of attracting new customers and
improving performance. Third, the deposit-related service revenue (Service Revenue) positively and
significantly determines adoption decisions, indicating that mobile apps are considered a retail strategy to
improve service quality, and might be used to prevent the loss of high-valued customers. Fourth, banks
that spend more on advertising and marketing expenditures exhibit a higher inclination to offer mobile
financial products. This result suggests that bankers, who rely more on media channels to build brand
reputation, believe that mobile apps will allow them to attract more image-based customers. Fifth, with
respect to bank’s distribution and service strategies, branch intensity (Branch Intensity) has an odds ratio
that is significantly less than one, implying that banks that are less branch-focused prefer mobile banking,
probably because their customers have lower demand for person-to-person contact services. This finding
is also similar to the case of Internet adoption (Hernández-Murillo, et al., 2010). Finally, the demographic
and geographic variables shed light on the occurrence of adoptions due to some demand-side factors.
Among the market characteristics, large population of young adults (Young) significantly promotes the
proliferation of mobile apps, implying an intense demand for mobile banking services from the youth and
revealing high adoption rates of such services among young customers (Federal Reserve, 2012).
One possible caveat of the analysis is that the sample period was the most disruptive in the U.S.
banking industry due to the 2008 global financial crisis, which might contaminate the results. For
instance, banks that were particularly hard hit by the financial meltdown might be too stressful to
introducing mobile offerings. To account for the level of stress faced by banks, I include loan loss
provision, loan charge-offs and a dummy indicating whether a bank has received TARP funds. The results
show that the probability of adoption is negatively related with loan charge-offs, indicating that banks’
19
See e.g., Schumpeter (1950), Hannan and McDowell (1984), Furst, et al. (2002), Hernández-Murillo, et.al.
(2010), DeYoung, et al. (2007)
18
willingness to invest in new technologies were negatively affected by the financial crisis. However, the
introduction of these controls does not materially change the main results.
For completeness, column (5) shows the results of the first stage IV regression. We see that both of the
instruments are significantly associated with the percentage of rivalry adoptions. Moreover, the large R2
(0.74) demonstrates that the instruments explain a substantial portion of the variation in rivalry adoptions
in a given market, which mitigates the concern of weak instruments. Further, the test of overidentifying
restrictions (Hansen J-statistics) reported in column (3) fail to reject the null that the instruments are valid.
B. The Joint Effect of Rivalry and Market Concentration on Mobile App Adoption – Robustness
B.1. Subsample Analysis
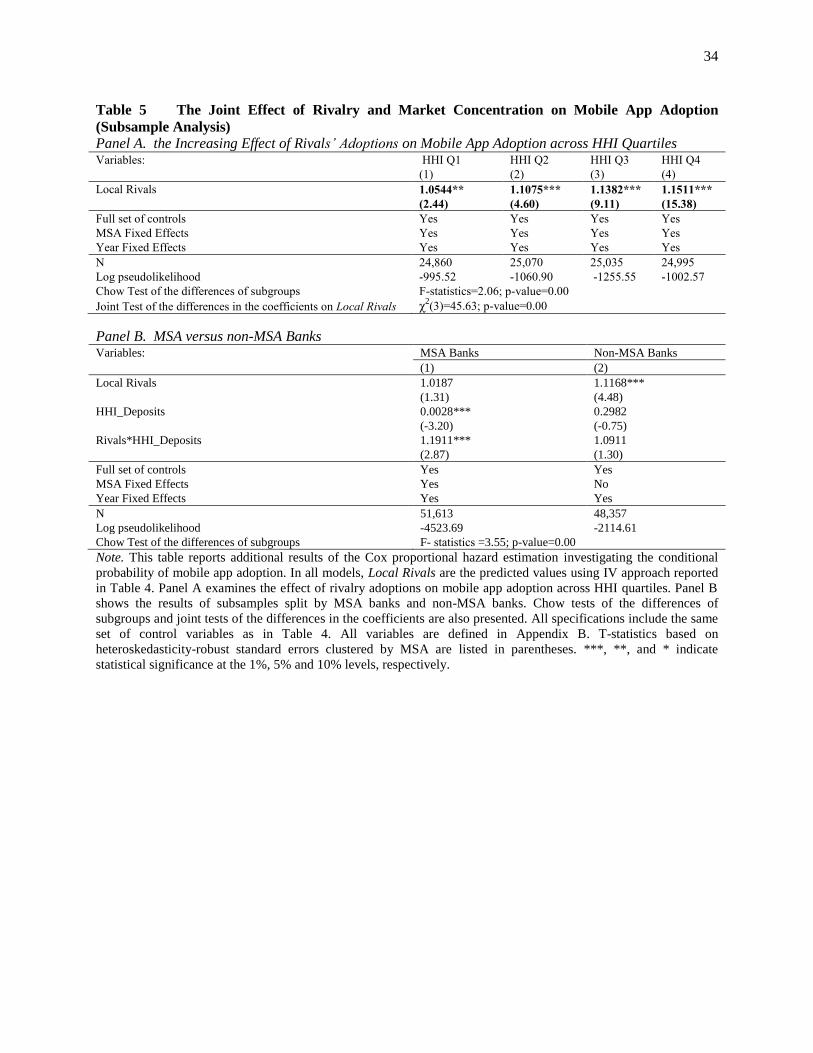
To assess the differential impact of rivalrous adoptions on potential adopters across markets, I sort the
sample into HHI_Deposits quartiles, rebalanced quarterly. Next, I estimate the hazard model on each
group and compare the estimates of Local Rivals across the quartiles. For brevity, only the odds ratios on
Local Rivals are reported in Panel A of Table 5. Clearly, the effect of Local Rivals increases
monotonically from the least concentrated markets to the most concentrated ones. Specifically, a one-
standard-deviation increase in the proportion of prior adoptions results in a 15.11% (t-statistic = 15.38)
increase in the likelihood of adoption by banks in the top quartile of HHI, which is three times as large as
the impact of rivalry in the bottom quartile (odds ratio of 1.054 with a t-statistic of 2.44). Further, a Chow
test rejects the equality of the four subgroups (p-value < 0.00), and a test strongly rejects the null that
these four estimates are not significantly different from each other (p-value < 0.00). In all, the evidence of
rivalry interactions in the adoption of mobile apps is the strongest in most concentrated markets, where
banks are predominately competing on non-price strategies. Hence, these findings further support the
notion that future adoptions are determined jointly by rival precedence and market structure, and that the
role of rivals in stimulating the adoption of non-price, strategic technology reinforces with market
concentration.
19
Another sample splits worth investigating is MSA banks versus rural banks since banks located in
MSAs are generally bearing more intensified competitive pressure than those in rural areas; and therefore,
these banks might react differently to peers’ strategies. To investigate whether the adoption pattern in
MSAs is different from that in rural areas, I repeat the analysis on MSA banks, defined as those
headquartered in MSAs, and on all other banks, classified into non-MSA banks. The estimates are
reported in Panel B of Table 5. Before proceeding, the Chow test rejects the equality of MSA banks and
non-MSA banks (p-value < 0.00). The main result indicates that the interactive effect is more pronounced
among MSA banks but is not significant among non-MSA banks. The potential explanation is that there is
not much variation in the degree of market concentration for rural banks due to the fact that rural banks
are often located in a single county and/or often far apart (DeYoung et al., 2007).
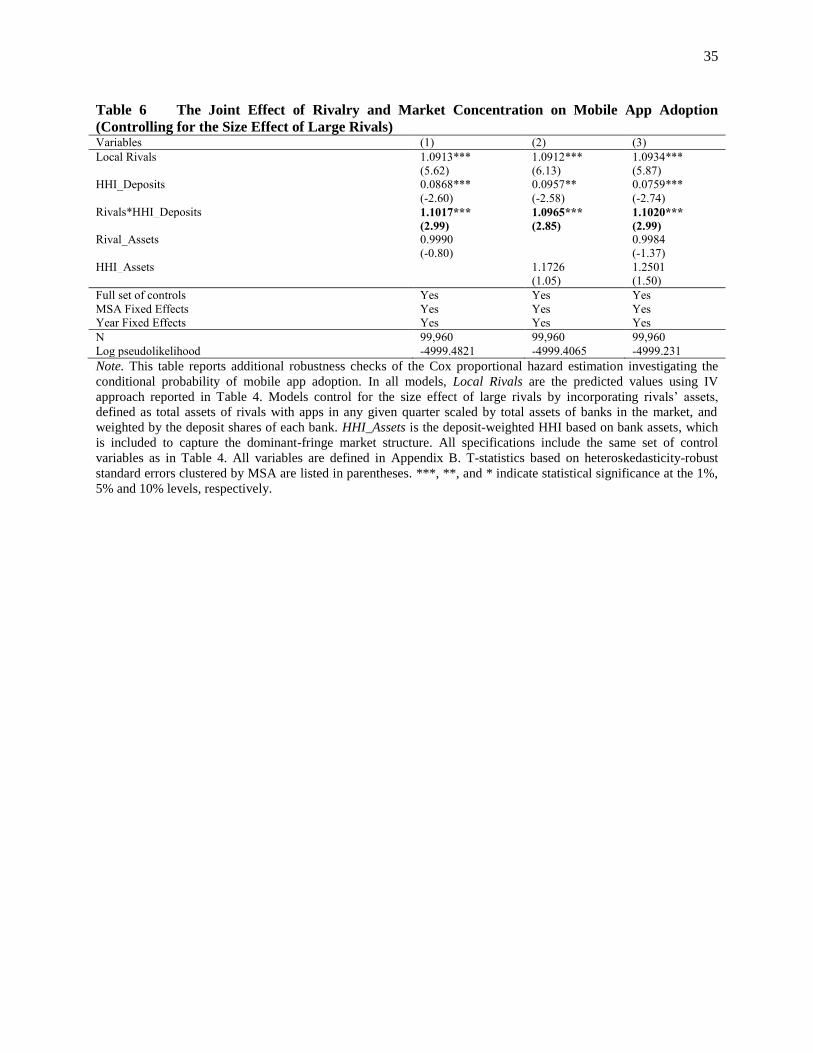
B.2. Size Effect of Large Rivals
One potential concern is that the observed results might simply pick up the size effect of large rivals.
Indeed, theories have proposed both demand side and supply side factors to explain why large firms are
more likely to engage in innovation activities (e.g., Schumpeter, 1950; Mansfield, 1968). If this dataset is
prevalent with the case where large banks dominate in a number of markets, and if these dominant banks
are the ones adopting the innovation first, then the results might reflect a pure size effect of large rivals in
the diffusion of innovation instead of rivals’ interaction with the market structure.
To empirically disentangle these independent effects, I construct two variables to be included in the
analysis. First, I control for rivals’ assets, defined as total assets of rivals with apps in any given quarter
scaled by total assets of banks in the market, and weighted by the deposit shares of each bank. This
variable measures the strength of rivals. Second, to further capture the dominant-fringe market structure, I
construct deposit-weighted HHI based on bank assets, denoted as HHI_Assets. As reported in Table 6, the
results are robust to the additions of rivals’ assets (Column 1), HHI_Assets (Column 2), or both (Column
3), suggesting that size effect of rivals should have no bearing on the conclusions.
20
B.3. The Impact of Rivalry and Market Concentration on the Speed of Adoption
Finally, I investigate whether the preceding results hold for the timing of adoption by estimating a Tobit
model. The dependent variable is Time Since Adoption, defined as the number of quarters that a bank had
offered the mobile app as of 2012:Q2. The model is estimated on a cross-sectional data of 2008:Q2 with
the instrumented Local Rivals as of 2012:Q2. Essentially, I examine the timing of adoption observed in
2012:Q2, while controlling for the pre-adoption characteristics using mid-2008 data. The results are
reported in Table 7. The reported marginal effect is the change in the expected value of Time Since
Adoption for banks that had adopted apps. As seen, the Tobit estimations generate a set of quantitatively
similar results.
C. Mobile App Adoption and Bank Performance
Since research has shown that innovation is an important driver of productivity, a further question is
whether mobile delivery channel has any economic and financial impact on banks’ performance. Also,
some anecdotal evidence suggests that mobile banking might enable banks to reduce costs by closing
branches and replacing tellers (American Banker, September 10, 2012) and to earn additional fee revenue
(American Banker, October 30, 2013).20, 21
To fill in the curiosity, this sub-section examines whether the
adoption of mobile apps improves banks’ ROA, helps banks to attract more deposits or stabilize customer
relationships, and allows banks to reduce branches or labor force. To do this, I focus on banks that
adopted mobile apps and estimate an OLS regression taking the following specification:
( )
20
American Banker, “Bankers Talk Bluntly About Closing, Streamlining Branches”, September 10, 2012 21
American Banker, “ Mobile Banking Pricing Model Becomes Clearer As More Banks Charge Fees”, October 30,
2013
21
where the first key variable is , a dummy equal to one once bank i adopted a mobile app
and zero otherwise, which captures the difference in performance before and after the adoption. To
explore the first mover advantage, I include , defined as the number of
quarters a bank has provided an app in quarter t. The dependent variable is a vector of the performance
measures including ROA, deposit-related service charges, deposits, advertising expenditures, branch
intensity, number of workers and labor costs, all scaled by total assets. is a vector of lagged firm
characteristics as controls, as I incorporated in the previous analysis. All regressions account for bank
( ) and year ( ) fixed effects to mitigate the issue of unobservable heterogeneity.
Table 8 presents the estimation results using 10,868 bank-quarter observations. The reported t-
statistics are based on robust standard errors clustered by bank. Models (1) and (2) examine the
profitability. The results show a positive but insignificant coefficient on POST ADOPT, and a
significantly positive coefficient on TIME SINCE ADOPTION, suggesting that early adopters exhibit
greater improvements in their ROA. This result supports the argument of first mover advantage in the
technology diffusion literature. Model (2) examines the source of gains. The results suggest that the
enhanced profitability might be achieved through the increased revenues from deposit-related service
charges, in line with what has been found in the studies of Internet adoption (DeYoung, Lang, and Nolle,
2007). This finding implies that mobile apps might allow banks to earn additional revenue by improving
the menu of services. As discussed, banks are motivated to offer mobile financial services with the hope
of reducing customer attrition rate through building multi-product customer relationships. To evaluate this
efficacy, model (3) investigates the condition of the deposit funding. As seen, the adoption fails to enable
banks to attract more deposits. Another way to interpret the result is that adopters do not lose deposits
after rolling out the mobile apps.
The next four columns shed light on how the adoption of mobile apps affects banks’ operating
expenditures. Model (4) shows that banks have incurred greater advertising and marketing expenses after
the adoption; and this phenomenon is more pronounced among early adopters, supporting the idea that
22
banks need to invest more on advertising to market their new mobile financial services. The examination
on branch intensity in model (5) helps to determine whether mobile service channel can be viewed as a
substitute or a complement to physical branches. I find that there is little evidence that banks decrease
their branch intensity during the post adoption period, favoring the notion of mobile apps as a
complement to branches. This result is contrary to the anecdotal evidence (American Banker, September
10, 2012) but similar to the case of online banking (DeYoung, Lang, and Nolle, 2007). Finally, banks
have increased work force and labor costs subsequent to the adoption, possibly due to higher demand for
specialized technology workers to address potential security issues of mobile platform, which are
currently the most challenging tasks of mobile banking business mode. By and large, the adoption of
mobile apps is associated with greater advertising and labor expenditures, implying that banks roll out
mobile apps potentially for strategic reasons.
VII. Conclusions
Using a unique dataset on the first wave of mobile app adoption by 694 U.S. commerical banks, this work
shows robust evidence that firms react strongly to rivals’ adoptions in reaching decisions to innovate. The
analysis reveals that banks’ reaction to rivalry adoptions depends on the market structure. In particular,
for the case of mobile banking, the impact of rival precedence upon potential adopters is the least in
highly competitive markets (featured with Bertrand competition), is monotonically increasing with the
level of market concentration, and is the strongest in highly concentrated markets (dominated by Cournot
competition). This empirical evidence is consistent with the theoretical prediction by Milliou and Petrakis
(2011) and supports the economic theory of the classic oligopolistic competition that firms tend to
compete on non-price attributes when markets are highly concentrated (Scherer and Ross, 1990, pp.595).
Moreover, consistent with Reinganum (1981), the role of market structure alone in promoting innovation
is still uncertain, after correcting for a number of unobservable, simultaneous biases.
23
In summary, this paper has improved our understanding on how rival interactions in the technology
adoption differ with market structure by presenting evidence that banks are more likely to adopt strategic
innovations in response to competitive peers in concentrated markets. For policy implications, this paper
identifies that rivalry adoption is an important source of competitive pressure during the diffusion
process. It also hints on the complexity of the relationship between competition and innovation.
Recognizing these perspectives may be helpful for policy makers attempting to promote innovation
through altering competitiveness, as the effect of competitive pressure varies with the type of the
innovation and also with the market environment. Last but not least, competition authorities and
regulators might need to be cautious about employing the traditional measures of competition, such as
market concentration ratio, to evaluate the intensity of competition of a market.
24
Appendix A
Table A.1 Selected Testing Sample and Survey Respondence of iPhone App Adopters
Year Bank Name RSSDID Adoption Date Testing
Result Survey Method
iPhone
App
Andriod
App
2008
Bank of America 480228 07/10/08 10/22/08 Apple First
IBC Bank 1001152 09/20/08
Apple First
CHASE BK USA NA 489913 12/15/08 11/10/10 Apple First
JPMorgan Chase Bank, NA 852218 12/15/08 11/19/10 Apple First
2009
PNC Bank, N.A. 817824 01/31/09
Don’t Know 888-PNC-BANK
Citibank, NA 476810 03/01/09 03/01/09 Same Time Online Specialist
Wells Fargo Bank, NA 451965 05/18/09 05/18/09 Same Time 1-800-869-3557
Compass Bank 697633 07/26/09 07/26/09 Same Time 1-800-273-1057
Amarillo National Bank 353555 09/01/09 07/10/12 Apple First
Discover Financial Services 30810 11/17/09
Don’t Know 1-800-347-7000
National Bank of Arizona 1004368 12/06/09 09/12/11 Apple First
PeoplesBank 613400 12/07/09 11/02/10 Apple First
Amegy Bank 676656 12/08/09 08/27/11 Apple First
Zions First National Bank 276579 12/08/09 08/12/11 Apple First
WoodForest National Bank 412751 12/24/09 10/29/10 Apple First
2010
Vectra Bank Colorado 933957 01/01/10 10/25/11 Apple First
Kleinbank mobile banking 303550 02/02/10
Apple Only 1-888-553-4648
Bank of Bookhaven, MS 2877831 04/03/10 01/25/12 Apple First
First Bank of Conroe 685658 05/03/10 11/23/11 Apple First
The Peoples Bank, GA 454434 06/10/10
Apple Only 770.867.9111
Peoples state bank of
Newton, IL 326344 07/07/10 01/30/12 Apple First
Sterling National Bank, NY 64619 08/05/10
Apple Only (212) 760-2031
Paducah Bank 285740 09/02/10
Apple Only 270.575.5700
Northwest 1002878 10/02/10
Apple Only 877-672-5678
Lubbock National Bank 766258 11/01/10 09/14/12 Apple First
Tidelands Bank 3185485 12/01/10 04/13/12 Apple First
2011
Rockland Trust/ mDeposit 613008 01/03/11 02/03/11 Apple First
National Bank of
Commerce 775456 02/01/11
Apple Only
Umpqua mobile bank 143662 03/06/11 03/19/12 Apple First
FCNB mobile banking 11499 04/01/11 08/03/11 Apple First
MercMobile 2608754 05/01/11 06/10/11 Apple First
Enterprise Bank & Trust 1190476 06/01/11 10/01/12 Apple First
Community Bank 460033 07/01/11 09/18/11 Apple First
Alliance Bank 176464 08/01/11 10/18/11 Apple First
Catskill Hudson Bank 2132594 09/01/11 04/02/12 Apple First
Monument Mobile Bank 3336607 10/04/11 09/13/11 Same Time
Western National Bank 778466 11/01/11 01/20/12 Apple First
PointBank 844567 12/01/11 11/22/11 Same Time
25
Table A.1 (Continued)
Bank Name RSSDID Adoption Date Testing
Result Survey Method
iPhone Andriod Result
Other Banks Surveyed
Oakstar Bank 3374412 06/15/10
Apple Only 417.877.2020
Sterling National Bank, NY 64619 08/05/10
Apple Only (212) 760-2031
Herget Bank 656649 10/13/10
Apple Only (309) 347-1131
Cumberland Valley National
Bank &Trust 647218 11/05/10
Apple Only 800.999.3126
American Bank of Commerce 215662 11/10/10
Apple Only (806) 775-5000
TSB-Texas Security Bank 3619216 11/09/10
Apple Only 469.398.4800
BOT Mobile Banking 340135 12/04/10
Apple Only (866) 378.9500
CAPITAL ONE NA 112837 12/14/10
Apple First 1-877-442-3764
First Bank of Dalton Mobile 2349459 04/16/12 04/04/12 Same Time 706-226-5377
Hyde Park Bank Mobile 5331 04/17/12 04/13/12 Same Time 773.752.4600.
LBT mobile banking 767255 04/18/12 07/23/12 Apple First 417-682-3348
Hondo National Bank Mobile
App 77253 04/18/12
Apple Only 830-426-7218
Bank of Sunset Mobile 910239 04/20/12 08/21/12 Apple First (337) 662-5222
the City National Bank Mobile
Banking 596062 04/24/12 05/15/12 Apple First 1-800-776-0541
Northwest Georgia Bank 712031 04/24/12 04/24/12 Same Time 706-965-3000
Falcon Bank Mobile Money 564557 04/24/12 09/18/12 Apple First (956) 723-2265
Peoples Bank Magnolia 712648 04/26/12
Apple Only (870)-234-5777
Oneunited Bank Mobile
Banking 935308 04/26/12 04/27/12 Same Time (323) 290-4848
Ally Mobile Banking 3284070 04/26/12 04/27/12 Same Time Online Specialist
Citizens Bank and Trust
Mobile 767554 04/28/12 05/01/12 Same Time (318) 375-3217
Centrue Mobile 457547 04/29/12 06/04/12 Apple First 1-888-728-6466
26
Appendix B: Variable Definitions and Sources
Variables Definitions Source
A) Firm Variables:
lnassets the log of total assets Call Reports
lnage the log of years since the establishment Call Reports
Branch Intensity branches per billion dollars of assets Summary of Deposits
Worker Per Branch number of employees per branch Call Reports; Summary
of Deposits
Labor Cost salary and benefits over total assets (%) Call Reports
Salary Per Worker salary and benefits per employee (in thousands)
Core Deposits the ratio of consumer deposits over total assets (%) Call Reports
Service Revenue the ratio of deposit-related service revenue over total deposits
(%)
Call Reports
Tier1 the ratio of tier1 capital over risk-weighted assets Call Reports
Advertising the ratio of advertising and marketing expenses per thousand
dollars of assets
Call Reports
Dadmk a dummy variable equals one if a bank has reported its
advertising and zero otherwise in any given quarter 22
Call Reports
Asset Grow the annual assets growth rate Call Reports
Loan Loss Provision the ratio of loss provision over total loans (%) Call Reports
Loan Charge Offs the ratio of loan charge offs over total loans (%) Call Reports
Tarp Receiver an indicator coded with one once a bank has received TARP
funds
Treasury Department
Time Since Adoption the number of quarters that a bank had offered a mobile app
as of 2012:Q2 in the Tobit model; the number of quarters that
a bank has offered an app in quarter t in the OLS regressions
iTunes Store
B) Market Variables*:
Local Rivals deposit-weighted sum of percentage of rival banks with
mobile apps in any quarter at each market where banks
operate (%)
iTunes Store; Summary
of Deposits
Rivals’ Outside-Market
Deposit Shares
the out-of-the-market deposit shares of rival banks with
mobile apps in each market in any given quarter, deposit-
share adjusted
iTunes Store; Summary
of Deposits
HHI_Deposits deposit-weighted sum of squared deposit shares of banks in
each market
Summary of Deposits
HHI_Assets deposit-weighted market concentration ratio measured by
bank assets
Summary of Deposits
Rival_Assets deposit-weighted sum of the proportion of rivals’ assets in
each market where banks operate (%)
Summary of Deposits
Young deposit-weighted annual percentage of people age 20-34 in
the local market (%)
Bureau of Labor
Statistics
Area Wage deposit-weighted average annual wage of the local market (in
thousands)
Quarterly Census of
Employment and Wages
MSA a dummy variable equals one if a bank is headquartered in an
MSA
Summary of Deposits
Job Grow deposit-weighted annual employment growth rate of the local
market (%)
Quarterly Census of
Employment and Wages
* Note: All market variables are deposit-weighted sum of MSA-level conditions, reflecting the average market
conditions where each bank operates. For banks located out of MSA, the market is defined at the county level.
22
According to the Call Reports, advertising and marketing expenses are only need to be reported if they are above
$25,000 or 3% of “other non-interest” expenses. Therefore, about one-third of the observations in the sample do not
have advertising data.
27
References
Akhavein, J., Frame, W.S. and White, L.J. (2005). The diffusion of financial innovation: an
examination of the adoption of small business credit scoring by large banking organizations,
Journal of Business, 78(2), 577-596.
Aghion, P., Bloom, N., Blundell, R., Griffith, R., & Howitt, P. (2005). Competition and innovation: an
inverted-U relationship. The Quarterly Journal of Economics, 120(2), 701-728.
Arrow, K. (1962). Economic welfare and the allocation of resources for invention. In The rate and
direction of inventive activity: Economic and social factors (pp. 609-626). NBER.
Board of Governors of the Federal Reserve System, (2012), Survey report of “Consumers and Mobile
Financial Services.”
Bofondi, M., & Lotti, F. (2006). Innovation in the retail banking industry: the diffusion of credit scoring.
Review of Industrial Organization, 28(4), 343-358.
Crosman, P. Banks Seek Sticky Relationships from Mobile Apps, American Banker, February 6, 2012
Crosman, P. Mobile Banking Pricing Model Becomes Clearer As More Banks Charge Fees, American
Banker, October 30, 2013
Dasgupta, P., & Stiglitz, J. (1980). Industrial structure and the nature of innovative activity. The
Economic Journal, 266-293.
DeYoung, R., Lang, W. and Nolle, D.L. (2007). How the Internet affects output and performance at
community banks, Journal of Banking and Finance, 31(4), 1033–1060
Escuer, M. E., Redondo, Y. P., & Fumás, V. S. (1991). Market Structure And The Adoption Of
Innovations: The Case Of The Spanish Banking Sector. Economics of Innovation and New
Technology, 1(4), 295-307.
Forman, C. (2005). The corporate digital divide: Determinants of Internet adoption. Management Science,
51(4), 641-654.
Frame, W.S. and White, L.J. (2004). Empirical studies of financial innovation: lots of talk, little action?
Journal of Economic Literature, 42(1), 116-144.
Furst, K., Lang, W. and Nolle, D. (2002). Internet banking, Journal of Financial Services Research,
22(1/2), 95-117.
Hall B.H, Khan B. (2003). Adoption of new technology. In New Economy Handbook, Elsevier Science:
Amsterdam, the Netherlands; 230–251.
Hannan, T. H., and McDowell, J. M. (1984). "The Determinants of Technology Adoption: The Case of
the Banking Firm." RAND Journal of Economics, 15, 328-335.
Hannan, T. H., and McDowell, J. M. (1987). "Rival Precedence and the Dynamics of Technology
Adoption: An Empirical Analysis" Economica, 54(214), 155-171.
28
Hernández-Murillo, R., Llobet, G., & Fuentes, R. (2010). Strategic online banking adoption. Journal of
Banking & Finance, 34(7), 1650-1663.
Karshenas, M., & Stoneman, P. L. (1993). Rank, stock, order, and epidemic effects in the diffusion of
new process technologies: An empirical model. The RAND Journal of Economics, 503-528.
Mansfield, E. (1968). Industrial research and technological innovation: An econometric analysis. New
York: Norton.
Milliou, C., & Petrakis, E. (2011). Timing of technology adoption and product market competition.
International Journal of Industrial Organization, 29(5), 513-523.
Reinganum, J. F. (1981). Market Structure and the Diffusion of New Technology, The Bell Journal of
Economics,12, 618-624.
Saloner, G. and Shepard, A. (1995). Adoption of technologies with network effects: an empirical
examination of the adoption of automated teller machines, RAND Journal of Economics, 26(3)
479-501.
Scherer, F. M., & Ross, D. (1990). Industrial Market Structure and Economic Performance. Boston:
Houghton Mifflin Company, Print.
Schumpeter, J. A. (1950) Capitalism, Socialism and Democracy. New York: Harper & Bros.
Singh, N., & Vives, X. (1984). Price and quantity competition in a differentiated duopoly. The RAND
Journal of Economics, 546-554.
Sullivan, R.J. (2000). How has the adoption of internet banking affected performance and risk in banks?
Financial Industry Perspectives, Federal Reserve Bank of Kansas City, December, 1-16.
Sullivan, R. and Wang, Z. (2005). Internet banking: An exploration in technology diffusion and impact,
Federal Reserve Bank of Kansas City Payments System Research Working Paper 05-05.
29
Figure 1 Cumulative Number of Banks that Adopted Mobile Apps over 2008:Q3-2012:Q2
Note. This figure shows the cumulative number of U.S. commercial banks that adopted mobile banking
apps based on the data collected from iTunes Store.
4 7 15
59
155
269
497
694
0
100
200
300
400
500
600
700
800
30
Table 1 Size and Geographic Distribution of Mobile App Adoptions as of June 2012
# of Adopters # of Banks Percentage
A.1 Size Distribution
Assets< $1 billion 527 5,529 9.53%
$1 billion<= Assets< $5 billion 115 366 31.42%
Assets>= $5 billion 52 124 41.94%
A.2 Geographic Distribution By OCC District
Central District 158 1,692 9.34%
Midwest District 141 1,822 7.74%
Northeast District 96 710 13.38%
Southwest District 299 1,795 16.66%
A.3 Geographic Distribution By Regional Fed
Atlanta 113 784 14.41%
Boston 14 77 18.18%
Chicago 89 1,036 8.59%
Cleveland 34 246 13.82%
Dallas 101 597 16.92%
Kansas City 86 975 8.82%
Minneapolis 28 654 4.28%
New York 13 151 8.61%
Philadelphia 20 134 14.93%
Richmond 45 317 14.20%
San Francisco 41 400 10.25%
St. Louis 109 648 16.82%
Total 694 6,019 100%
Note. This table presents the adoptions by bank size and geographic locations as of June 2012.
31
Table 2 Which Apps Were Adopted by Banks First? Android Apps or iPhone Apps?
Android apps Adopted FIRST
Both apps
Adopted at
Same Time
iPhone apps
Adopted
FIRST
Total testing
samples
Month <-4 -4 -3 -2 -1 0 ≥1
Number of
Banks 4 5 5 6 5 159 369 553
Percentage 0.72% 0.90% 0.90% 1.09% 0.90% 28.75% 66.73% 100%
Note. This table compares iPhone app adoption and Android app adoption by banks from 2008:Q3 to
2012:Q2 based on 553 testing samples, for which I gathered adoption dates from Google Play using the
same method as from iTunes.23
For banks that could not be found by searching on Google Play, I did a
short survey via either phone calls or online specialists to get the adoption information.24
The table reports
the number of banks adopted Android apps (iPhone apps) prior to iPhone apps (Android apps) and the
number of banks adopted both apps around the same time. The corresponding percentages are also
provided. Banks adopted both of the apps at the same time if the time lags between adopting Android
apps and adopting iPhone apps are within two weeks. Table also shows the breakdown of the time lag of
adopting Android apps earlier than adopting iPhone apps into 1 month, 2 months, 3 months, 4 months and
more than 4 months. As illustrated, only 5% of these banks adopted Android apps first. For these banks, I
corrected the adoption data accordingly.
23
Testing samples include all banks adopted iPhone apps in 2008, 2009 and the first half year of 2012. For 2010 and
2011, I picked up the first adopters in each month and also adopters from January to March, June to July, and
October to December. Therefore, the testing samples are covering the whole sample period. 24
I asked two questions. First, whether the bank provided mobile apps besides iPhone app. If yes, which one did the
bank adopt first? I have made 29 phone calls and talked to two online specialists. Six of them chose iPhone apps
before Android apps, nine of them only have iPhone apps, eight of them provided both iPhone apps and Android
apps at the same time, two of them didn’t know, and the rest didn’t answer the phone. For no answers, there was no
disclosure of Android app adoption on the bank’s website.
32
Table 3 Descriptive Statistics--Bank and Market Characteristics over 2008:Q3- 2012:Q2
Adopters (Obs=694) Non-Adopters (Obs=99,291) Difference
-in-means Mean
Std.
Dev. Min Max Mean
Std.
Dev. Min Max
Key Variables:
Local Rivals (%) 33.51 18.48 2.15 100.00
11.42 13.27 0.00 87.50
22.08***
HHI_Deposits 0.19 0.10 0.05 0.84
0.21 0.13 0.05 1.00
-0.02***
Control Variables:
Assets ($mil) 11,418 98,036 32 1,746,242
875 11,853 3 1,768,657
10,543***
lnassets 13.27 1.30 10.39 16.06
11.96 1.19 9.62 16.06
1.30***
lnage 3.94 0.99 1.10 4.99
3.85 1.08 1.10 4.99
0.08**
Tier1 0.14 0.04 0.05 0.38
0.16 0.07 0.05 0.46
-0.01***
Core Deposits (%) 7.45 7.00 0.21 32.38
9.63 7.15 0.21 32.38
-2.18***
Service Revenue (%) 0.26 0.22 0.00 1.02
0.22 0.20 0.00 1.02
0.04***
Labor Cost (%) 1.02 0.56 0.20 2.75
1.00 0.56 0.20 2.75
0.03
Salary Per Worker 42.30 21.80 9.88 103.10
38.62 20.58 9.88 103.10
3.67***
Worker Per Branch 16.68 9.64 4.44 56.00
13.21 7.91 3.67 56.00
3.47***
Advertising 0.38 0.34 0.00 1.70
0.28 0.35 0.00 1.70
0.10***
Dadmk 0.81 0.40 0.00 1.00
0.65 0.48 0.00 1.00
0.15***
Branch Intensity 19.26 12.09 2.57 101.16
26.92 17.76 2.57 101.16
-7.66***
Asset Grow 0.01 0.05 -0.10 0.26
0.02 0.20 -0.10 0.26
-0.005*
Loan Loss Prov (%) 0.58 0.83 -0.06 5.33
0.56 0.92 -0.06 5.33
0.02
Loan Charge Offs (%) 0.62 0.83 0.00 4.88
0.51 0.86 0.00 4.88
0.11***
Tarp Receiver 0.25 0.43 0.00 1.00
0.10 0.30 0.00 1.00
0.15***
Young (%) 20.18 3.36 11.59 31.36
18.81 3.67 11.59 31.36
1.37***
Job Grow (%) 3.48 1.81 -6.13 10.28
2.08 3.03 -6.13 10.28
1.39***
Area Wage ($1,000) 41.47 8.72 23.44 66.83
38.65 9.16 23.44 66.83
2.82***
MSA 0.67 0.47 0.00 1.00 0.52 0.50 0.00 1.00 0.15***
Note. This table reports the summary statistics for the potential determinants of mobile app adoption for 694
adopters and 99,291 non-adopter observations from 2008:Q3 to 2012:Q2. All controls are winsorized at 1st and 99
th
percentiles. Difference-in-means tests are reported in the last column.
33
Table 4 The Effects of Rivalry and Market Concentration on the Probability of Adoption Variables: Instrumental Variables
Second-stage Dependent Variable: First-stage
(1) (2) (3) (4) Local Rivals (5)
Local Rivals 1.0735*** 1.0630*** 1.1149*** 1.0901*** Rivals' Outside Deposit shares 0.5496***
(43.90) (13.36) (7.49) (5.89)
(178.41)
HHI_Deposits 0.4554** 0.0949** 0.8393 0.0978** MSA -1.1915**
(-2.03) (-2.13) (-0.75) (-2.55)
(-2.40)
Rival*HHI_Deposits
1.0380**
1.0979*** Constant 7.7200***
(2.10)
(2.91)
(26.77)
lnassets 2.0320*** 2.0326*** 1.9501*** 1.9579***
(26.06) (26.13) (24.42) (24.85)
lnage 1.0933 1.0856 1.0997 1.0932
(1.49) (1.46) (1.46) (1.42)
Tier1 0.0345*** 0.0324*** 0.0380*** 0.0404***
(-5.11) (-5.39) (-5.00) (-4.89)
Core Deposits 1.0060 1.0059 1.0058 1.0063
(1.19) (1.18) (1.15) (1.25)
Service Revenue 4.7913*** 4.8734*** 7.0752*** 7.2139***
(6.70) (6.52) (5.96) (5.93)
Labor Cost 1.1862 1.1975 1.2959 1.2842
(1.03) (1.10) (1.62) (1.55)
Salary Per Worker 0.9989 0.9991 1.0010 1.0013
(-0.25) (-0.21) (0.20) (0.26)
Worker Per Branch 1.0085 1.0082 1.0030 1.0035
(0.72) (0.70) (0.30) (0.35)
Advertising*Dadmk 1.2485* 1.2505* 1.2910** 1.2999**
(1.82) (1.83) (2.22) (2.27)
Dadmk 1.3414*** 1.3324*** 1.3273*** 1.3252***
(3.71) (3.63) (3.62) (3.62)
Branch Intensity 0.9839** 0.9840** 0.9764*** 0.9767***
(-2.22) (-2.19) (-4.50) (-4.42)
Asset Grow 0.7190 0.7231* 1.0286 0.7077
(-1.63) (-1.66) (0.05) (-1.58)
Young 1.0366*** 1.0364*** 1.0422*** 1.0404***
(2.96) (2.96) (3.22) (3.10)
Job Grow 1.0138** 1.0160** 1.0000 1.0020
(2.10) (2.45) (-0.01) (0.27)
Area Wage 1.0109 1.0085 0.9628*** 0.9623***
(1.63) (1.15) (-5.44) (-5.71)
Loan Loss Provision 1.1020* 1.0980 1.1102* 1.1127*
(1.68) (1.64) (1.87) (1.91)
Loan Charge Offs 0.7815*** 0.7834*** 0.8017*** 0.7965***
(-3.61) (-3.58) (-3.11) (-3.23)
Tarp Receiver 1.1680* 1.1767* 1.1921* 1.1846*
(1.68) (1.73) (1.83) (1.77)
MSA Fixed Effects Yes Yes Yes Yes Yes
Year Fixed Effects Yes Yes Yes Yes Yes
N 99,960 99,960 99,960 99,960 99,994
R2
0.7401
Log pseudolikelihood -4843.52 -4841.83 -5002.1861 -4999.55
Hansen J (p-value)
0.51
Durbin-Hausman-Wu 0.00
Note. This table reports Cox proportional hazard estimates investigating the conditional probability of mobile app
adoption. Models (3) and (4) report the estimates using an IV approach, where Local Rivals are instrumented by
rivals’ deposit shares outside of the market and a dummy indicating whether a bank is headquartered in an MSA. IV
diagnostic statistics for overidentification restrictions and exogeneity conditions are also reported. Model (5) shows
the coefficients of the first-step estimation of Local Rivals on the two instruments. All variables are defined in
Appendix B. T-statistics based on heteroskedasticity-robust standard errors clustered by MSA are listed in
parentheses. ***, **, and * indicate statistical significance at the 1%, 5% and 10% levels, respectively.
34
Table 5 The Joint Effect of Rivalry and Market Concentration on Mobile App Adoption
(Subsample Analysis)
Panel A. the Increasing Effect of Rivals’ Adoptions on Mobile App Adoption across HHI Quartiles Variables: HHI Q1 HHI Q2 HHI Q3 HHI Q4
(1) (2) (3) (4)
Local Rivals 1.0544** 1.1075*** 1.1382*** 1.1511***
(2.44) (4.60) (9.11) (15.38)
Full set of controls Yes Yes Yes Yes
MSA Fixed Effects Yes Yes Yes Yes
Year Fixed Effects Yes Yes Yes Yes
N 24,860 25,070 25,035 24,995
Log pseudolikelihood -995.52 -1060.90 -1255.55 -1002.57
Chow Test of the differences of subgroups F-statistics=2.06; p-value=0.00
Joint Test of the differences in the coefficients on Local Rivals χ2(3)=45.63; p-value=0.00
Panel B. MSA versus non-MSA Banks Variables: MSA Banks Non-MSA Banks
(1) (2)
Local Rivals 1.0187 1.1168***
(1.31) (4.48)
HHI_Deposits 0.0028*** 0.2982
(-3.20) (-0.75)
Rivals*HHI_Deposits 1.1911*** 1.0911
(2.87) (1.30)
Full set of controls Yes Yes
MSA Fixed Effects Yes No
Year Fixed Effects Yes Yes
N 51,613 48,357
Log pseudolikelihood -4523.69 -2114.61
Chow Test of the differences of subgroups F- statistics =3.55; p-value=0.00
Note. This table reports additional results of the Cox proportional hazard estimation investigating the conditional
probability of mobile app adoption. In all models, Local Rivals are the predicted values using IV approach reported
in Table 4. Panel A examines the effect of rivalry adoptions on mobile app adoption across HHI quartiles. Panel B
shows the results of subsamples split by MSA banks and non-MSA banks. Chow tests of the differences of
subgroups and joint tests of the differences in the coefficients are also presented. All specifications include the same
set of control variables as in Table 4. All variables are defined in Appendix B. T-statistics based on
heteroskedasticity-robust standard errors clustered by MSA are listed in parentheses. ***, **, and * indicate
statistical significance at the 1%, 5% and 10% levels, respectively.
35
Table 6 The Joint Effect of Rivalry and Market Concentration on Mobile App Adoption
(Controlling for the Size Effect of Large Rivals) Variables (1) (2) (3)
Local Rivals 1.0913*** 1.0912*** 1.0934***
(5.62) (6.13) (5.87)
HHI_Deposits 0.0868*** 0.0957** 0.0759***
(-2.60) (-2.58) (-2.74)
Rivals*HHI_Deposits 1.1017*** 1.0965*** 1.1020***
(2.99) (2.85) (2.99)
Rival_Assets 0.9990
0.9984
(-0.80)
(-1.37)
HHI_Assets
1.1726 1.2501
(1.05) (1.50)
Full set of controls Yes Yes Yes
MSA Fixed Effects Yes Yes Yes
Year Fixed Effects Yes Yes Yes
N 99,960 99,960 99,960
Log pseudolikelihood -4999.4821 -4999.4065 -4999.231
Note. This table reports additional robustness checks of the Cox proportional hazard estimation investigating the
conditional probability of mobile app adoption. In all models, Local Rivals are the predicted values using IV
approach reported in Table 4. Models control for the size effect of large rivals by incorporating rivals’ assets,
defined as total assets of rivals with apps in any given quarter scaled by total assets of banks in the market, and
weighted by the deposit shares of each bank. HHI_Assets is the deposit-weighted HHI based on bank assets, which
is included to capture the dominant-fringe market structure. All specifications include the same set of control
variables as in Table 4. All variables are defined in Appendix B. T-statistics based on heteroskedasticity-robust
standard errors clustered by MSA are listed in parentheses. ***, **, and * indicate statistical significance at the 1%,
5% and 10% levels, respectively.
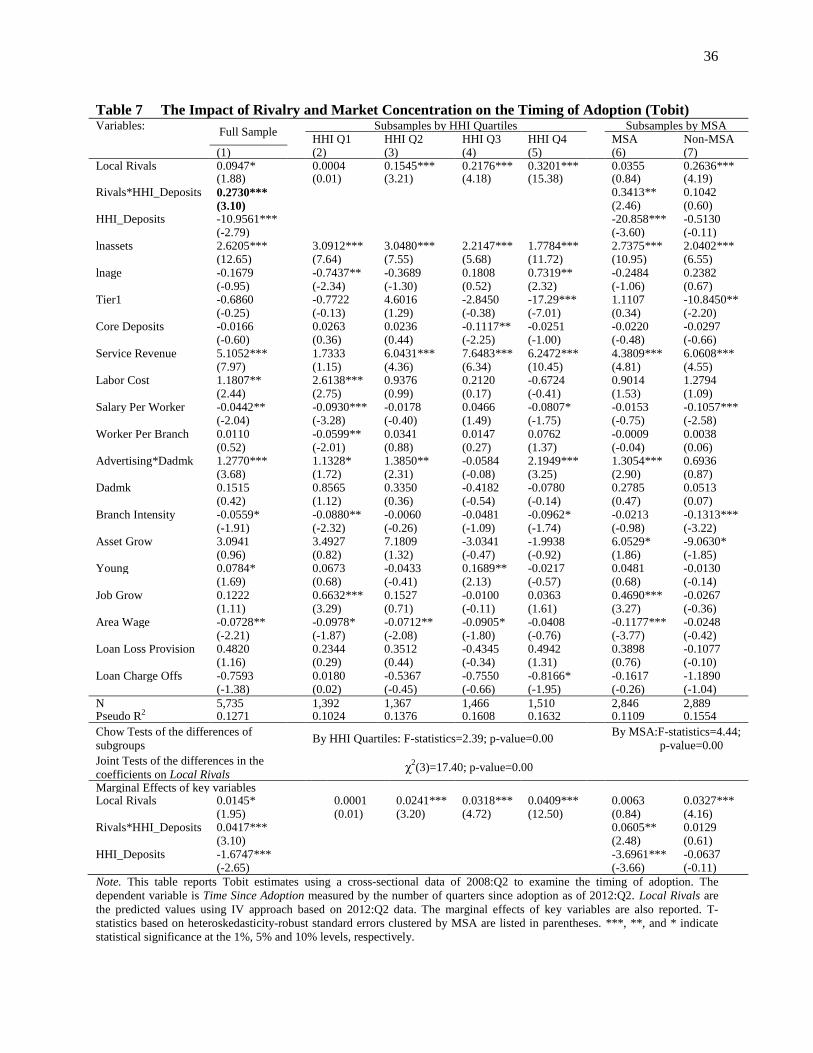
36
Table 7 The Impact of Rivalry and Market Concentration on the Timing of Adoption (Tobit) Variables:
Full Sample Subsamples by HHI Quartiles Subsamples by MSA
HHI Q1 HHI Q2 HHI Q3 HHI Q4
MSA Non-MSA (1) (2) (3) (4) (5) (6) (7) Local Rivals 0.0947*
0.0004 0.1545*** 0.2176*** 0.3201***
0.0355 0.2636***
(1.88)
(0.01) (3.21) (4.18) (15.38)
(0.84) (4.19)
Rivals*HHI_Deposits 0.2730***
0.3413** 0.1042
(3.10)
(2.46) (0.60)
HHI_Deposits -10.9561***
-20.858*** -0.5130
(-2.79)
(-3.60) (-0.11)
lnassets 2.6205***
3.0912*** 3.0480*** 2.2147*** 1.7784***
2.7375*** 2.0402***
(12.65)
(7.64) (7.55) (5.68) (11.72)
(10.95) (6.55)
lnage -0.1679
-0.7437** -0.3689 0.1808 0.7319**
-0.2484 0.2382
(-0.95)
(-2.34) (-1.30) (0.52) (2.32)
(-1.06) (0.67)
Tier1 -0.6860
-0.7722 4.6016 -2.8450 -17.29***
1.1107 -10.8450**
(-0.25)
(-0.13) (1.29) (-0.38) (-7.01)
(0.34) (-2.20)
Core Deposits -0.0166
0.0263 0.0236 -0.1117** -0.0251
-0.0220 -0.0297
(-0.60)
(0.36) (0.44) (-2.25) (-1.00)
(-0.48) (-0.66)
Service Revenue 5.1052***
1.7333 6.0431*** 7.6483*** 6.2472***
4.3809*** 6.0608***
(7.97)
(1.15) (4.36) (6.34) (10.45)
(4.81) (4.55)
Labor Cost 1.1807**
2.6138*** 0.9376 0.2120 -0.6724
0.9014 1.2794
(2.44)
(2.75) (0.99) (0.17) (-0.41)
(1.53) (1.09)
Salary Per Worker -0.0442**
-0.0930*** -0.0178 0.0466 -0.0807*
-0.0153 -0.1057***
(-2.04)
(-3.28) (-0.40) (1.49) (-1.75)
(-0.75) (-2.58)
Worker Per Branch 0.0110
-0.0599** 0.0341 0.0147 0.0762
-0.0009 0.0038
(0.52)
(-2.01) (0.88) (0.27) (1.37)
(-0.04) (0.06)
Advertising*Dadmk 1.2770***
1.1328* 1.3850** -0.0584 2.1949***
1.3054*** 0.6936
(3.68)
(1.72) (2.31) (-0.08) (3.25)
(2.90) (0.87)
Dadmk 0.1515
0.8565 0.3350 -0.4182 -0.0780
0.2785 0.0513
(0.42)
(1.12) (0.36) (-0.54) (-0.14)
(0.47) (0.07)
Branch Intensity -0.0559*
-0.0880** -0.0060 -0.0481 -0.0962*
-0.0213 -0.1313***
(-1.91)
(-2.32) (-0.26) (-1.09) (-1.74)
(-0.98) (-3.22)
Asset Grow 3.0941
3.4927 7.1809 -3.0341 -1.9938
6.0529* -9.0630*
(0.96)
(0.82) (1.32) (-0.47) (-0.92)
(1.86) (-1.85)
Young 0.0784*
0.0673 -0.0433 0.1689** -0.0217
0.0481 -0.0130
(1.69)
(0.68) (-0.41) (2.13) (-0.57)
(0.68) (-0.14)
Job Grow 0.1222
0.6632*** 0.1527 -0.0100 0.0363
0.4690*** -0.0267
(1.11)
(3.29) (0.71) (-0.11) (1.61)
(3.27) (-0.36)
Area Wage -0.0728**
-0.0978* -0.0712** -0.0905* -0.0408
-0.1177*** -0.0248
(-2.21)
(-1.87) (-2.08) (-1.80) (-0.76)
(-3.77) (-0.42)
Loan Loss Provision 0.4820
0.2344 0.3512 -0.4345 0.4942
0.3898 -0.1077
(1.16)
(0.29) (0.44) (-0.34) (1.31)
(0.76) (-0.10)
Loan Charge Offs -0.7593
0.0180 -0.5367 -0.7550 -0.8166*
-0.1617 -1.1890
(-1.38)
(0.02) (-0.45) (-0.66) (-1.95)
(-0.26) (-1.04)
N 5,735 1,392 1,367 1,466 1,510 2,846 2,889 Pseudo R2 0.1271
0.1024 0.1376 0.1608 0.1632
0.1109 0.1554
Chow Tests of the differences of
subgroups By HHI Quartiles: F-statistics=2.39; p-value=0.00
By MSA:F-statistics=4.44;
p-value=0.00
Joint Tests of the differences in the
coefficients on Local Rivals χ
2(3)=17.40; p-value=0.00
Marginal Effects of key variables Local Rivals 0.0145*
0.0001 0.0241*** 0.0318*** 0.0409***
0.0063 0.0327***
(1.95)
(0.01) (3.20) (4.72) (12.50)
(0.84) (4.16)
Rivals*HHI_Deposits 0.0417***
0.0605** 0.0129
(3.10)
(2.48) (0.61)
HHI_Deposits -1.6747***
-3.6961*** -0.0637 (-2.65) (-3.66) (-0.11)
Note. This table reports Tobit estimates using a cross-sectional data of 2008:Q2 to examine the timing of adoption. The
dependent variable is Time Since Adoption measured by the number of quarters since adoption as of 2012:Q2. Local Rivals are
the predicted values using IV approach based on 2012:Q2 data. The marginal effects of key variables are also reported. T-
statistics based on heteroskedasticity-robust standard errors clustered by MSA are listed in parentheses. ***, **, and * indicate
statistical significance at the 1%, 5% and 10% levels, respectively.
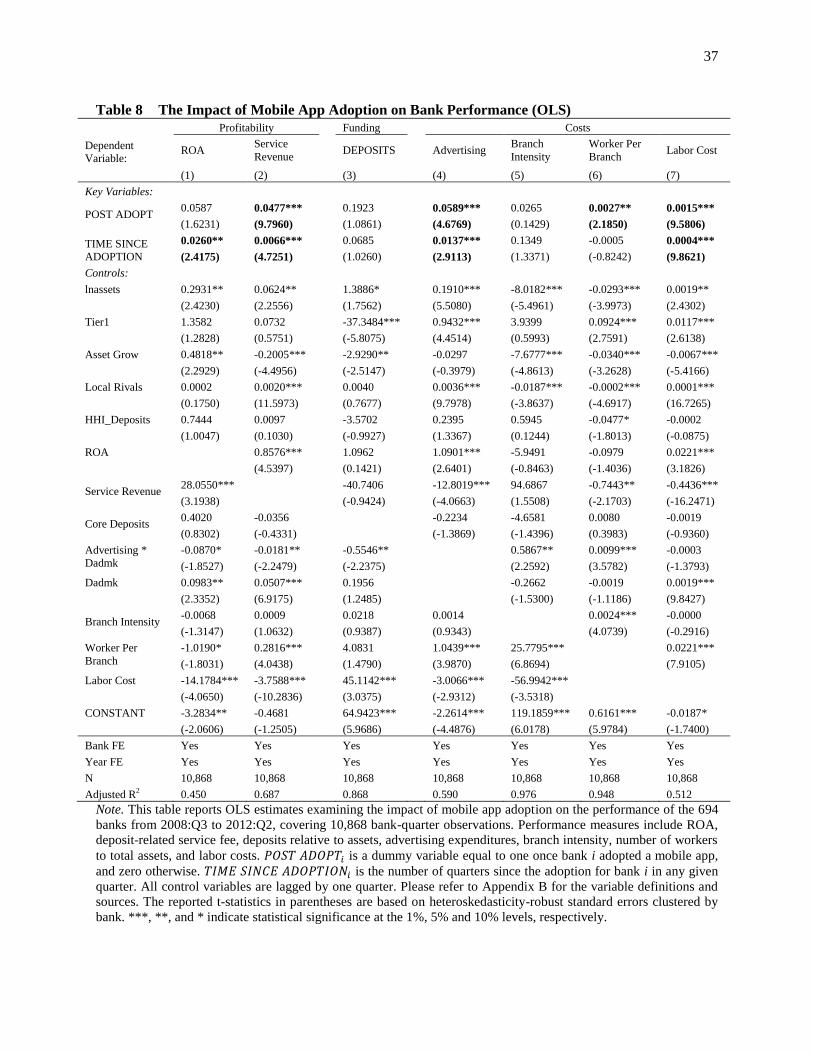
37
Table 8 The Impact of Mobile App Adoption on Bank Performance (OLS)
Profitability Funding Costs
Dependent
Variable:
ROA Service
Revenue DEPOSITS
Advertising
Branch
Intensity
Worker Per
Branch Labor Cost
(1) (2) (3) (4) (5) (6) (7)
Key Variables:
POST ADOPT 0.0587 0.0477***
0.1923
0.0589*** 0.0265 0.0027** 0.0015***
(1.6231) (9.7960)
(1.0861)
(4.6769) (0.1429) (2.1850) (9.5806)
TIME SINCE
ADOPTION
0.0260** 0.0066***
0.0685
0.0137*** 0.1349 -0.0005 0.0004***
(2.4175) (4.7251)
(1.0260)
(2.9113) (1.3371) (-0.8242) (9.8621)
Controls:
lnassets 0.2931** 0.0624**
1.3886*
0.1910*** -8.0182*** -0.0293*** 0.0019**
(2.4230) (2.2556)
(1.7562)
(5.5080) (-5.4961) (-3.9973) (2.4302)
Tier1 1.3582 0.0732
-37.3484***
0.9432*** 3.9399 0.0924*** 0.0117***
(1.2828) (0.5751)
(-5.8075)
(4.4514) (0.5993) (2.7591) (2.6138)
Asset Grow 0.4818** -0.2005***
-2.9290**
-0.0297 -7.6777*** -0.0340*** -0.0067***
(2.2929) (-4.4956)
(-2.5147)
(-0.3979) (-4.8613) (-3.2628) (-5.4166)
Local Rivals 0.0002 0.0020***
0.0040
0.0036*** -0.0187*** -0.0002*** 0.0001***
(0.1750) (11.5973)
(0.7677)
(9.7978) (-3.8637) (-4.6917) (16.7265)
HHI_Deposits 0.7444 0.0097
-3.5702
0.2395 0.5945 -0.0477* -0.0002
(1.0047) (0.1030)
(-0.9927)
(1.3367) (0.1244) (-1.8013) (-0.0875)
ROA
0.8576***
1.0962
1.0901*** -5.9491 -0.0979 0.0221***
(4.5397)
(0.1421)
(2.6401) (-0.8463) (-1.4036) (3.1826)
Service Revenue 28.0550***
-40.7406
-12.8019*** 94.6867 -0.7443** -0.4436***
(3.1938)
(-0.9424)
(-4.0663) (1.5508) (-2.1703) (-16.2471)
Core Deposits 0.4020 -0.0356
-0.2234 -4.6581 0.0080 -0.0019
(0.8302) (-0.4331)
(-1.3869) (-1.4396) (0.3983) (-0.9360)
Advertising *
Dadmk
-0.0870* -0.0181**
-0.5546**
0.5867** 0.0099*** -0.0003
(-1.8527) (-2.2479)
(-2.2375)
(2.2592) (3.5782) (-1.3793)
Dadmk 0.0983** 0.0507***
0.1956
-0.2662 -0.0019 0.0019***
(2.3352) (6.9175)
(1.2485)
(-1.5300) (-1.1186) (9.8427)
Branch Intensity -0.0068 0.0009
0.0218
0.0014
0.0024*** -0.0000
(-1.3147) (1.0632)
(0.9387)
(0.9343)
(4.0739) (-0.2916)
Worker Per
Branch
-1.0190* 0.2816***
4.0831
1.0439*** 25.7795***
0.0221***
(-1.8031) (4.0438)
(1.4790)
(3.9870) (6.8694)
(7.9105)
Labor Cost -14.1784*** -3.7588***
45.1142***
-3.0066*** -56.9942***
(-4.0650) (-10.2836)
(3.0375)
(-2.9312) (-3.5318)
CONSTANT -3.2834** -0.4681
64.9423***
-2.2614*** 119.1859*** 0.6161*** -0.0187*
(-2.0606) (-1.2505)
(5.9686)
(-4.4876) (6.0178) (5.9784) (-1.7400)
Bank FE Yes Yes Yes Yes Yes Yes Yes
Year FE Yes Yes Yes Yes Yes Yes Yes
N 10,868 10,868 10,868 10,868 10,868 10,868 10,868
Adjusted R2
0.450 0.687 0.868 0.590 0.976 0.948 0.512
Note. This table reports OLS estimates examining the impact of mobile app adoption on the performance of the 694
banks from 2008:Q3 to 2012:Q2, covering 10,868 bank-quarter observations. Performance measures include ROA,
deposit-related service fee, deposits relative to assets, advertising expenditures, branch intensity, number of workers
to total assets, and labor costs. is a dummy variable equal to one once bank i adopted a mobile app,
and zero otherwise. is the number of quarters since the adoption for bank i in any given
quarter. All control variables are lagged by one quarter. Please refer to Appendix B for the variable definitions and
sources. The reported t-statistics in parentheses are based on heteroskedasticity-robust standard errors clustered by
bank. ***, **, and * indicate statistical significance at the 1%, 5% and 10% levels, respectively.