Embed Size (px)
Citation preview
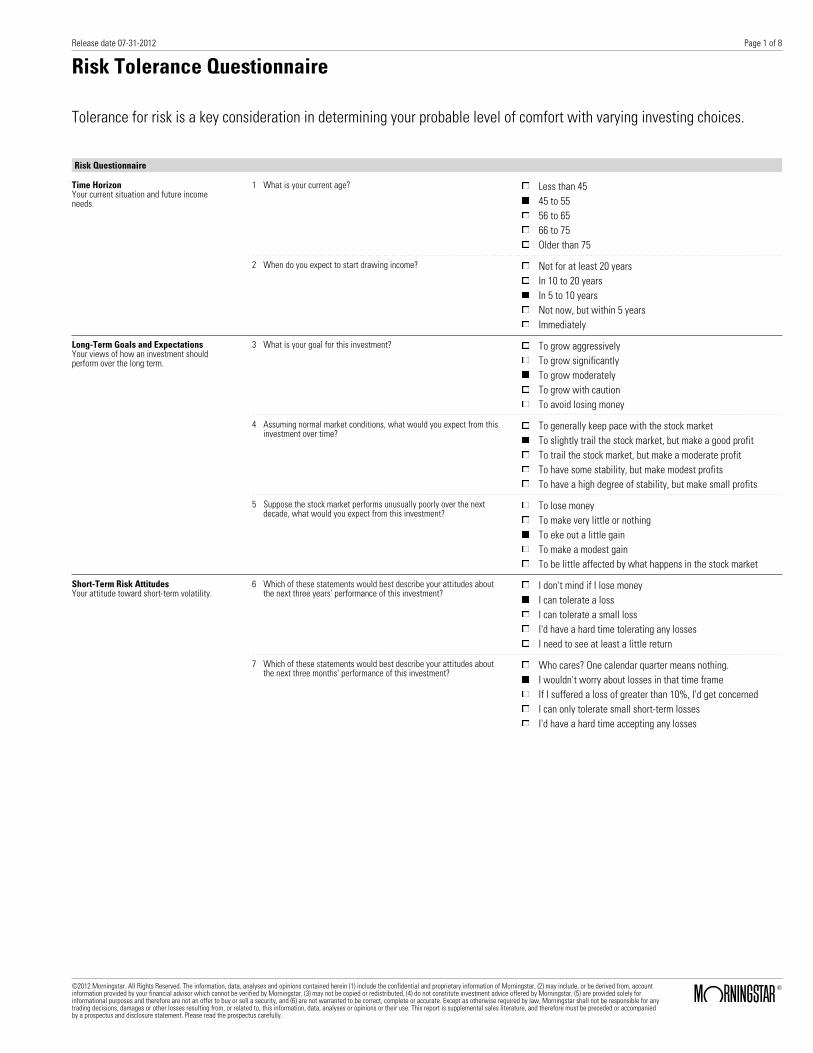
Risk Tolerance Questionnaire
Tolerance for risk is a key consideration in determining your probable level of comfort with varying investing choices.
Risk Questionnaire
Time HorizonYour current situation and future incomeneeds.
1 What is your current age? Less than 4545 to 5556 to 6566 to 75Older than 75
2 When do you expect to start drawing income? Not for at least 20 yearsIn 10 to 20 yearsIn 5 to 10 yearsNot now, but within 5 yearsImmediately
Long-Term Goals and ExpectationsYour views of how an investment shouldperform over the long term.
3 What is your goal for this investment? To grow aggressivelyTo grow significantlyTo grow moderatelyTo grow with cautionTo avoid losing money
4 Assuming normal market conditions, what would you expect from thisinvestment over time?
To generally keep pace with the stock marketTo slightly trail the stock market, but make a good profitTo trail the stock market, but make a moderate profitTo have some stability, but make modest profitsTo have a high degree of stability, but make small profits
5 Suppose the stock market performs unusually poorly over the nextdecade, what would you expect from this investment?
To lose moneyTo make very little or nothingTo eke out a little gainTo make a modest gainTo be little affected by what happens in the stock market
Short-Term Risk AttitudesYour attitude toward short-term volatility.
6 Which of these statements would best describe your attitudes aboutthe next three years' performance of this investment?
I don't mind if I lose moneyI can tolerate a lossI can tolerate a small lossI'd have a hard time tolerating any lossesI need to see at least a little return
7 Which of these statements would best describe your attitudes aboutthe next three months' performance of this investment?
Who cares? One calendar quarter means nothing.I wouldn't worry about losses in that time frameIf I suffered a loss of greater than 10%, I'd get concernedI can only tolerate small short-term lossesI'd have a hard time accepting any losses
Release date 07-31-2012
©2012 Morningstar. All Rights Reserved. The information, data, analyses and opinions contained herein (1) include the confidential and proprietary information of Morningstar, (2) may include, or be derived from, accountinformation provided by your financial advisor which cannot be verified by Morningstar, (3) may not be copied or redistributed, (4) do not constitute investment advice offered by Morningstar, (5) are provided solely forinformational purposes and therefore are not an offer to buy or sell a security, and (6) are not warranted to be correct, complete or accurate. Except as otherwise required by law, Morningstar shall not be responsible for anytrading decisions, damages or other losses resulting from, or related to, this information, data, analyses or opinions or their use. This report is supplemental sales literature, and therefore must be preceded or accompaniedby a prospectus and disclosure statement. Please read the prospectus carefully.
ß®
Page 1 of 8
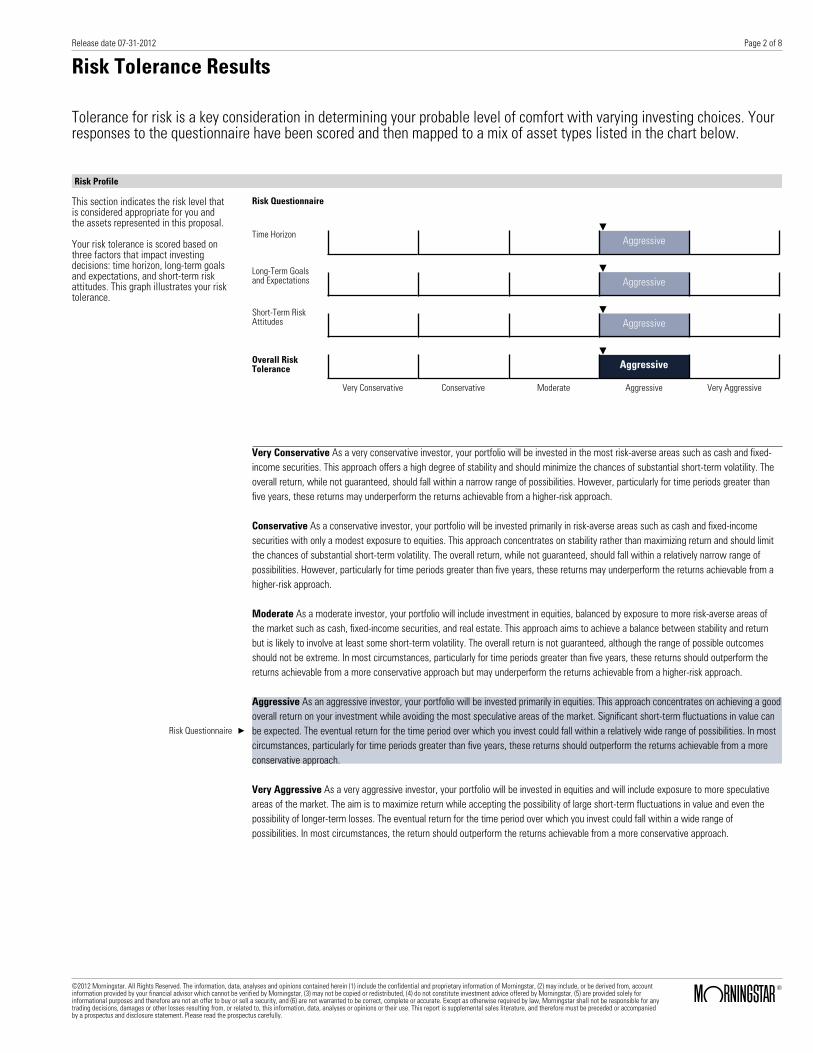
Risk Tolerance Results
Tolerance for risk is a key consideration in determining your probable level of comfort with varying investing choices. Yourresponses to the questionnaire have been scored and then mapped to a mix of asset types listed in the chart below.
Risk Profile
This section indicates the risk level thatis considered appropriate for you andthe assets represented in this proposal.
Your risk tolerance is scored based onthree factors that impact investingdecisions: time horizon, long-term goalsand expectations, and short-term riskattitudes. This graph illustrates your risktolerance.
Risk Questionnaire
Time HorizonÕ
Aggressive
Long-Term Goalsand Expectations
ÕAggressive
Short-Term RiskAttitudes
ÕAggressive
Overall RiskTolerance
ÕAggressive
Very Conservative Conservative Moderate Aggressive Very Aggressive
Very Conservative As a very conservative investor, your portfolio will be invested in the most risk-averse areas such as cash and fixed-income securities. This approach offers a high degree of stability and should minimize the chances of substantial short-term volatility. Theoverall return, while not guaranteed, should fall within a narrow range of possibilities. However, particularly for time periods greater thanfive years, these returns may underperform the returns achievable from a higher-risk approach.
Conservative As a conservative investor, your portfolio will be invested primarily in risk-averse areas such as cash and fixed-incomesecurities with only a modest exposure to equities. This approach concentrates on stability rather than maximizing return and should limitthe chances of substantial short-term volatility. The overall return, while not guaranteed, should fall within a relatively narrow range ofpossibilities. However, particularly for time periods greater than five years, these returns may underperform the returns achievable from ahigher-risk approach.
Moderate As a moderate investor, your portfolio will include investment in equities, balanced by exposure to more risk-averse areas ofthe market such as cash, fixed-income securities, and real estate. This approach aims to achieve a balance between stability and returnbut is likely to involve at least some short-term volatility. The overall return is not guaranteed, although the range of possible outcomesshould not be extreme. In most circumstances, particularly for time periods greater than five years, these returns should outperform thereturns achievable from a more conservative approach but may underperform the returns achievable from a higher-risk approach.
Risk Questionnaire ×
Aggressive As an aggressive investor, your portfolio will be invested primarily in equities. This approach concentrates on achieving a goodoverall return on your investment while avoiding the most speculative areas of the market. Significant short-term fluctuations in value canbe expected. The eventual return for the time period over which you invest could fall within a relatively wide range of possibilities. In mostcircumstances, particularly for time periods greater than five years, these returns should outperform the returns achievable from a moreconservative approach.
Very Aggressive As a very aggressive investor, your portfolio will be invested in equities and will include exposure to more speculativeareas of the market. The aim is to maximize return while accepting the possibility of large short-term fluctuations in value and even thepossibility of longer-term losses. The eventual return for the time period over which you invest could fall within a wide range ofpossibilities. In most circumstances, the return should outperform the returns achievable from a more conservative approach.
Release date 07-31-2012
©2012 Morningstar. All Rights Reserved. The information, data, analyses and opinions contained herein (1) include the confidential and proprietary information of Morningstar, (2) may include, or be derived from, accountinformation provided by your financial advisor which cannot be verified by Morningstar, (3) may not be copied or redistributed, (4) do not constitute investment advice offered by Morningstar, (5) are provided solely forinformational purposes and therefore are not an offer to buy or sell a security, and (6) are not warranted to be correct, complete or accurate. Except as otherwise required by law, Morningstar shall not be responsible for anytrading decisions, damages or other losses resulting from, or related to, this information, data, analyses or opinions or their use. This report is supplemental sales literature, and therefore must be preceded or accompaniedby a prospectus and disclosure statement. Please read the prospectus carefully.
ß®
Page 2 of 8
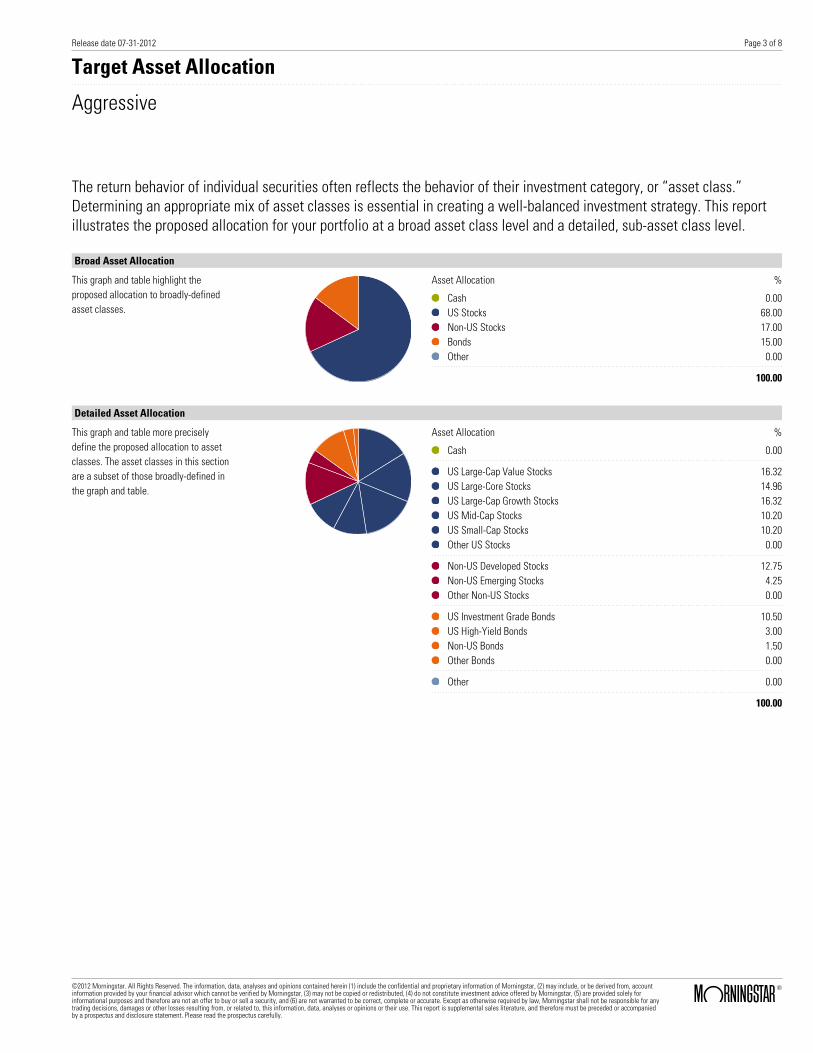
Target Asset Allocation
Aggressive
The return behavior of individual securities often reflects the behavior of their investment category, or “asset class.”Determining an appropriate mix of asset classes is essential in creating a well-balanced investment strategy. This reportillustrates the proposed allocation for your portfolio at a broad asset class level and a detailed, sub-asset class level.
Broad Asset Allocation
This graph and table highlight theproposed allocation to broadly-definedasset classes.
Asset Allocation %
Cash 0.00US Stocks 68.00Non-US Stocks 17.00Bonds 15.00Other 0.00
100.00
Detailed Asset Allocation
This graph and table more preciselydefine the proposed allocation to assetclasses. The asset classes in this sectionare a subset of those broadly-defined inthe graph and table.
Asset Allocation %
Cash 0.00
US Large-Cap Value Stocks 16.32US Large-Core Stocks 14.96US Large-Cap Growth Stocks 16.32US Mid-Cap Stocks 10.20US Small-Cap Stocks 10.20Other US Stocks 0.00
Non-US Developed Stocks 12.75Non-US Emerging Stocks 4.25Other Non-US Stocks 0.00
US Investment Grade Bonds 10.50US High-Yield Bonds 3.00Non-US Bonds 1.50Other Bonds 0.00
Other 0.00
100.00
Release date 07-31-2012
©2012 Morningstar. All Rights Reserved. The information, data, analyses and opinions contained herein (1) include the confidential and proprietary information of Morningstar, (2) may include, or be derived from, accountinformation provided by your financial advisor which cannot be verified by Morningstar, (3) may not be copied or redistributed, (4) do not constitute investment advice offered by Morningstar, (5) are provided solely forinformational purposes and therefore are not an offer to buy or sell a security, and (6) are not warranted to be correct, complete or accurate. Except as otherwise required by law, Morningstar shall not be responsible for anytrading decisions, damages or other losses resulting from, or related to, this information, data, analyses or opinions or their use. This report is supplemental sales literature, and therefore must be preceded or accompaniedby a prospectus and disclosure statement. Please read the prospectus carefully.
ß®
Page 3 of 8
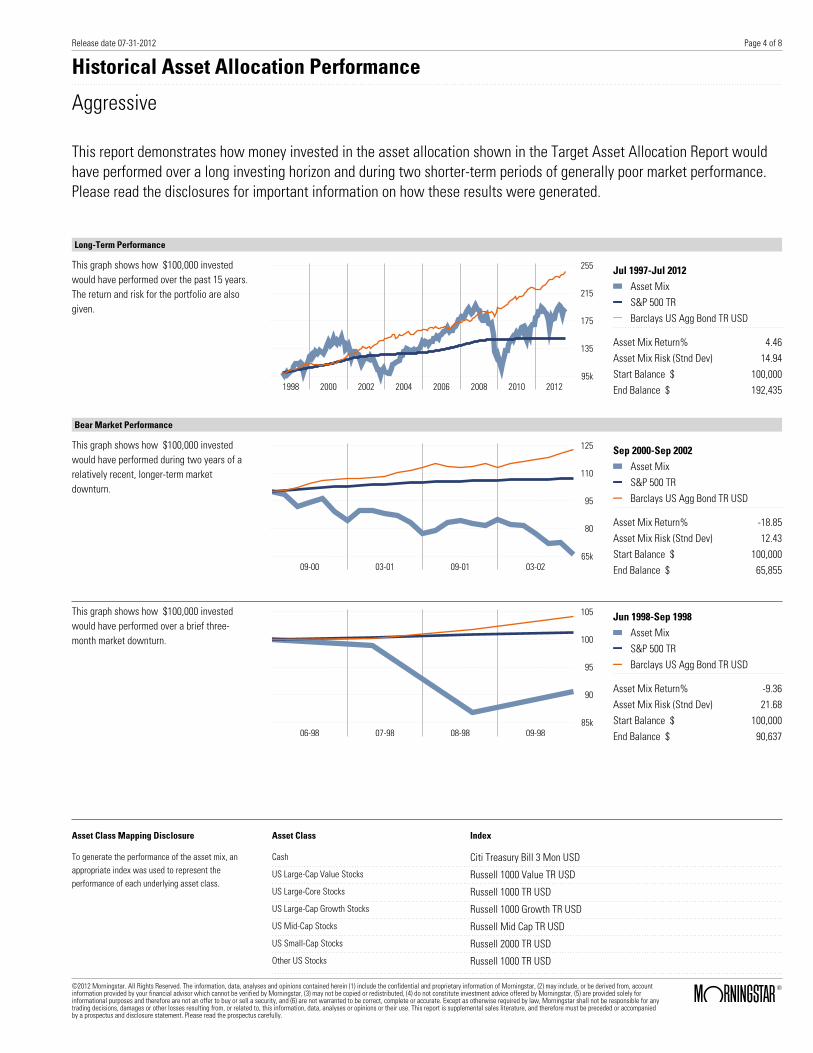
Historical Asset Allocation Performance
Aggressive
This report demonstrates how money invested in the asset allocation shown in the Target Asset Allocation Report wouldhave performed over a long investing horizon and during two shorter-term periods of generally poor market performance.Please read the disclosures for important information on how these results were generated.
Long-Term Performance
This graph shows how $100,000 investedwould have performed over the past 15 years.The return and risk for the portfolio are alsogiven.
95k
135
175
215
255
1998 2000 2002 2004 2006 2008 2010 2012
Jul 1997-Jul 2012Asset MixS&P 500 TRBarclays US Agg Bond TR USD
Asset Mix Return% 4.46Asset Mix Risk (Stnd Dev) 14.94Start Balance $ 100,000End Balance $ 192,435
Bear Market Performance
This graph shows how $100,000 investedwould have performed during two years of arelatively recent, longer-term marketdownturn.
65k
80
95
110
125
09-00 03-01 09-01 03-02
Sep 2000-Sep 2002Asset MixS&P 500 TRBarclays US Agg Bond TR USD
Asset Mix Return% -18.85Asset Mix Risk (Stnd Dev) 12.43Start Balance $ 100,000End Balance $ 65,855
This graph shows how $100,000 investedwould have performed over a brief three-month market downturn.
85k
90
95
100
105
06-98 07-98 08-98 09-98
Jun 1998-Sep 1998Asset MixS&P 500 TRBarclays US Agg Bond TR USD
Asset Mix Return% -9.36Asset Mix Risk (Stnd Dev) 21.68Start Balance $ 100,000End Balance $ 90,637
Asset Class Mapping Disclosure
To generate the performance of the asset mix, anappropriate index was used to represent theperformance of each underlying asset class.
Asset Class Index
Cash Citi Treasury Bill 3 Mon USD
US Large-Cap Value Stocks Russell 1000 Value TR USD
US Large-Core Stocks Russell 1000 TR USD
US Large-Cap Growth Stocks Russell 1000 Growth TR USD
US Mid-Cap Stocks Russell Mid Cap TR USD
US Small-Cap Stocks Russell 2000 TR USD
Other US Stocks Russell 1000 TR USD
Release date 07-31-2012
©2012 Morningstar. All Rights Reserved. The information, data, analyses and opinions contained herein (1) include the confidential and proprietary information of Morningstar, (2) may include, or be derived from, accountinformation provided by your financial advisor which cannot be verified by Morningstar, (3) may not be copied or redistributed, (4) do not constitute investment advice offered by Morningstar, (5) are provided solely forinformational purposes and therefore are not an offer to buy or sell a security, and (6) are not warranted to be correct, complete or accurate. Except as otherwise required by law, Morningstar shall not be responsible for anytrading decisions, damages or other losses resulting from, or related to, this information, data, analyses or opinions or their use. This report is supplemental sales literature, and therefore must be preceded or accompaniedby a prospectus and disclosure statement. Please read the prospectus carefully.
ß®
Page 4 of 8

Asset Class Index
Non-US Developed Stocks MSCI EAFE PR USD
Non-US Emerging Stocks MSCI EM PR USD
Other Non-US Stocks MSCI EAFE PR USD
US Investment Grade Bonds Barclays US Agg Bond TR USD
US High-Yield Bonds Barclays US Corporate High Yield TR USD
Non-US Bonds Citi WGBI NonUSD USD
Other Bonds Barclays US Agg Bond TR USD
Other Russell 1000 Value TR USD
Release date 07-31-2012
©2012 Morningstar. All Rights Reserved. The information, data, analyses and opinions contained herein (1) include the confidential and proprietary information of Morningstar, (2) may include, or be derived from, accountinformation provided by your financial advisor which cannot be verified by Morningstar, (3) may not be copied or redistributed, (4) do not constitute investment advice offered by Morningstar, (5) are provided solely forinformational purposes and therefore are not an offer to buy or sell a security, and (6) are not warranted to be correct, complete or accurate. Except as otherwise required by law, Morningstar shall not be responsible for anytrading decisions, damages or other losses resulting from, or related to, this information, data, analyses or opinions or their use. This report is supplemental sales literature, and therefore must be preceded or accompaniedby a prospectus and disclosure statement. Please read the prospectus carefully.
ß®
Page 5 of 8
Page 6 of 8Release date 07-31-2012
Page 7 of 8Release date 07-31-2012

Page 8 of 8Release date 07-31-2012