Embed Size (px)
Citation preview
1
Universidade Técnica de Lisboa
Faculdade de Motricidade Humana
Risk of Falls, Fear of Falling, and Loss of Autonomy on Old
Women: Impact of Physical Activity and Fitness in the
Performance of Activities of Daily Living
Dissertation submitted in order to obtain a Ph.D. in the Branch of Human
Movement, Specialty in Health and Physical Fitness
Supervisor: Professora Doutora Maria de Fátima Marcelina Baptista
Jury Chair: Reitor da Universidade Técnica de Lisboa
Jury Members: Professora Doutora Maria de Fátima Marcelina Baptista
Professora Doutora Maria Joana Mesquita Cruz Barbosa de Carvalho
Professor Doutor Filipe Manuel Soares de Melo
Professor Doutor Armando Manuel de Mendonça Raimundo
Professora Doutora Maria Helena Santa Clara Pombo Rodrigues
Catarina Lino Neto Pereira
2011
2
Portuguese Science and Technology Foundation support this research, PhD grant
SFRH/BD/31450/2006 awarded to Catarina Lino Neto Pereira.

3
To my family, colleagues and friends
4
ACKNOWLEDGEMENTS
To Professor Fatima Baptista for her continuous incentive and for her high quality
orientation that allowed me overpass my own limits.
To my papers co-authors for their fundamental contribution to the research.
To Ana Ravara, Daniel Dolan, Ilda Mendes Rosa, Maria João Soares and Steve Dyson,
for their help with manuscript revision.
To Ana Caramujo for her precious help in data collection organization.
To the team that helped data collection.
To my colleague from the Department of Sports and Health of University of Évora for
their solidarity and encouragement.
To all volunteers for participating in this research.
To Portuguese Science and Technology Foundation for its financial support (PhD grants
SFRH/BD/31450/2006).
To my family and friends that helped me in difficult situation, creating a background
that allowed me to think and going on with this work.
5
INDEX
Pag.
GENERAL INDEX 5
TABLES INDEX 9
FIGURES INDEX 10
ABSTRACT 12
KEY WORDS 12
RESUMO 13
PALAVRAS CHAVE 13
ABBREVIATIONS 14
CHAPTER 1 GENERAL INTRODUCTION 15
Introduction 16
The fall 17
The injury 21
Maintenance of autonomy and independence in
elderly
22
Objective 23
References 24
CHAPTER 2 ROLE OF PHYSICAL ACTIVITY IN THE
PREVENTION OF FALLS AND THEIR
CONSEQUENCES IN THE ELDERLY
29
Abstract 30
Problems of falls 31
Risk factors for falling and fractures 32
Prevention strategies for falls and fractures 36
Physical exercise programmes 36
Multi-disciplinary programmes 37
Conclusion 38
References 39
6
Pag.
CHAPTER 3 VARIATION OF THE DIFFERENT ATTRIBUTES
THAT SUPPORT THE PHYSICAL FUNCTION IN
COMMUNITY-DWELLING OLDER ADULTS
48
Abstract 49
Introduction 50
Materials and methods 51
Participants 51
Measures and data collection 52
Statistical analysis 53
Results 54
Discussion 58
Conclusions 61
References 62
CHAPTER 4 OVER 50 YEARS OLD MEN ARE MORE LIKELY
TO FALL THAN WOMEN UNDER SIMILAR
CONDITIONS OF HEALTH, BODY
COMPOSITION AND BALANCE
65
Abstract 66
Introduction 67
Materials and methods 68
Participants 68
Measures 68
Statistical analysis 69
Results 71
Discussion 75
Conclusions 78
References 79
CHAPTER 5 ROLE OF PHYSICAL ACTIVITY IN THE
OCCURRENCE OF FALLS AND INJURIES IN
COMMUNITY-DWELLING ADULTS OVER 50
YEARS OLD
82
Abstract 83

7
Pag.
Introduction 84
Methods 85
Subjects 85
Measures and data collection 85
Statistical analysis 87
Results 88
Fall occurrence 88
Fall-related injuries 93
Discussion 94
Conclusions 97
References 98
CHAPTER 6 ASSOCIATIONS BETWEEN FALLS, FALL-
RELATED INJURIES, FEAR OF FALLING AND
DISABILITY IN ACTIVITIES OF DAILY LIVING
IN ADULTS OVER 55 YEARS OLD
102
Abstract 103
Introduction 104
Methods 105
Participants 105
Outcome measures 105
Statistical analysis 107
Results 108
Discussion 114
Conclusions 115
References 116
CHAPTER 7 INFLUENCE OF HEALTH STATUS, PHYSICAL
ACTIVITY AND FITNESS IN AUTONOMY OF
COMMUNITY-DWELLING OLD ADULTS OVER
A FIVE YEAR PERIOD
120
Abstract 121
Introduction 122
8
Pag.
Methods 122
Design 122
Participants 123
Outcome measures 124
Statistical analysis 125
Results 126
Discussion 131
Conclusions 133
References 134
CHAPTER 8 GENERAL DISCUSSION AND CONCLUSIONS 137
Discussion 138
Recommendations 142
References 143
9
TABLES INDEX
Pag.
CHAPTER 2 Table 1. Risk factors for falling. 33
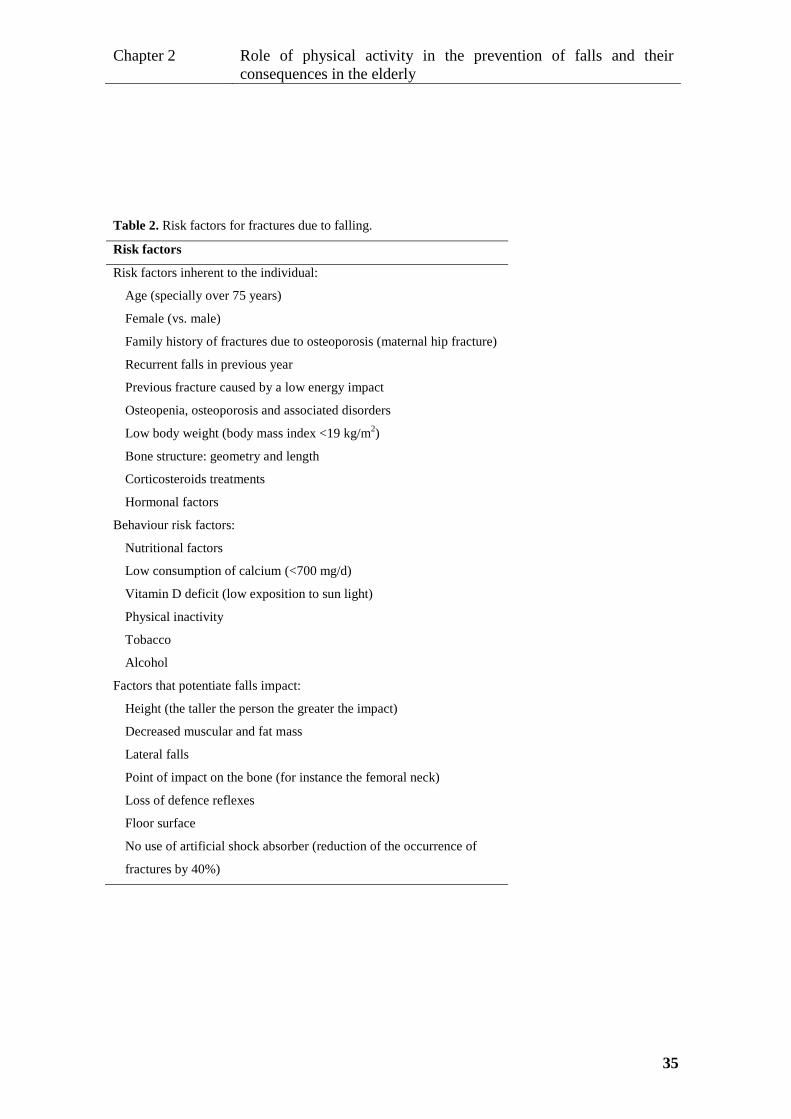
Table 2. Risk factors for fractures due to falling. 35
CHAPTER 3 Table 1. Age, body composition, health, education, and
physical activity of the sample.
55
Table 2. Comparison of physical function attributes
(absolute scores) among age groups.
57
CHAPTER 4 Table 1. Characteristics of subjects (N=587). 71
Table 2. Predictors of falling. 72
CHAPTER 5 Table 1. Subjects characteristics: age, education, health,
fear of falling, environment hazards, and physical activity
according falls and severe injuries occurrence.
89
Table 2. Subjects characteristics: body composition and
physical function according falls and fall-related severe
injuries occurrence.
90
Table 3. Predictors of falls and fall-related severe
injuries.
91
CHAPTER 6 Table 1. Characteristics of the sample by group of ADLs
functioning.
110
CHAPTER 7 Table 1. Initial and final chronological age, autonomy,
health status and physical activity of participants.
127
Table 2 Initial and final body composition and physical
fitness of the participants.
128
Table 3 – Predictors of change in autonomy over 5 years. 129

10
FIGURES INDEX
Pag.
CHAPTER 1 Figure1. The three elements involved in the fall. 17
Figure 2. Disease triangle (adapted from AEMT ACoS,
2003).
21
CHAPTER3 Figure 1. Comparison between physical attribute T-scores
according to each age group in elderly women and men.
59
CHAPTER 4 Figure 1. Falling probability variance according gender, co-
morbidities, multidimensional balance, fat, and lean body
mass. The values of each of these variables were calculated
from logistic regression considering the 50th percentile of the
remaining variables in the equation and a cut off-point of
0.336 to discriminate fallers from non-fallers.
74
CHAPTER 5 Figure 1. Fall probability as a function of habitual total, and
vigorous-intensity physical activity performed during the
week. This graph shows cut-off values for total and for
vigorous-intensity physical activity (1,125 MET-min/wk and
501MET-min/wk, respectively) that discriminate fallers from
non-fallers.
93
Figure 2. Severe injury likelihood according to physical
activity (PA) level. This graph quantifies the decrease in the
likelihood of fall-related severe injuries in people with
moderate (less 76%) and high (less 58%) physical activity
levels relative to people with low physical activity level
(considered as reference).
94
CHAPTER 6 Figure 1.Prevalence of disability in the 12 activities of daily
living evaluated by the Composite Physical Function Scale.
109
11
Pag.
Figure 2 –Disability odds ratio due to fall-related injuries
and fear of falling. The figure illustrates the likelihood of a
person with no disability becoming severely (A) or
moderately (B) disabled due to the occurrence of fall-related
severe injuries and fear of falling.
112
Figure 3 –Disability in basic (BADLs), instrumental
(IADLs) and advanced activities of daily living (AABLs)
due to fall-related severe injuries and to fear of falling. The
figure illustrates the significant increase in the likelihood of a
person becoming disabled (cannot do or can do with
difficulty or help), in the performance of each activity of
daily living due to the occurrence of fall-related severe
injuries (Injury +) and the increase in fear of falling (FES ±;
FES +).
113
CHAPTER 7 Figure 1. Flow of participants through study. 123
Figure 2. Change in autonomy over 5-year follow-up in
accordance with minimum and maximum variation observed in
predictors.
130

12
ABSTRACT
This thesis examined the importance of physical activity and fitness, in the performance
of daily living activities (ADLs). The research comprised 600 adults over 50 year old
and 79 young adults, of whom 106 old adults were followed-up for a 5 years period.
Falls and injuries, fear of falling, disability in performing ADLs, usual physical activity,
intrinsic (physical fitness, body composition and health status) and extrinsic risk factors
(environmental hazards) for these events/behaviors were evaluated. Data were analyzed
by using comparisons, correlations and regression analyses. Results showed that frailty
regarding intrinsic factors leads to an increase in the risk of extrinsic factors and limit
the performance of ADLs. The number of co-morbidities was the main intrinsic risk
factor for falls and ADL disability. Fear of falling was found to be a higher risk for
ADL disability than falls and injuries. Decreased balance was the physical fitness
parameter that contributed most for falls, while reduced aerobic endurance was the most
important parameter for ADL disability.
Key words: fall; injury; fear of falling; activities of daily living; autonomy; disability;
physical fitness; physical activity; environmental hazards; elderly.
13
RESUMO
Esta tese analisou a importância da actividade e da aptidão física, na realização das
actividades da vida diária (AVDs). Foram incluídos 600 adultos com mais de 50 anos de
idade e funcionamento independente e 79 adultos jovens, dos quais 106 adultos idosos
foram observados por um período de 5 anos. Foram avaliadas as quedas, as lesões, o
medo de cair, a incapacidade na realização das AVDs, a actividade física habitual e os
factores de risco intrínsecos (aptidão funcional, composição corporal, estado de saúde) e
extrínsecos (perigos do envolvimento) para estes eventos/comportamentos. Os dados
foram analisados através de comparações, correlações e regressões. Os resultados
evidenciaram que uma maior fragilidade dos factores intrínsecos aumenta o risco dos
factores extrínsecos e limita a realização das AVDs. O número de co-morbilidades foi o
factor intrínseco que mais contribuiu para a ocorrência de quedas e incapacidade nas
AVDs. O medo de cair revelou constituir um risco maior para a incapacidade nas AVDs
do que as quedas e as lesões. Um equilíbrio diminuído foi o parâmetro da aptidão
funcional que mais contribuiu para as quedas, enquanto uma baixa capacidade aeróbia
foi o parâmetro que mais determinou a incapacidade para as AVDs.
Palavras-chave: queda; lesão; medo de cair; actividades da vida diária; autonomia;
incapacidade; aptidão física; actividade física; riscos do envolvimento; idosos.
14
ABBREVIATIONS
ADL: Activities of daily living
BADL: Basic activities of daily living
IADL: Instrumental activities of daily living
AADL: Advanced activities of daily living
AUC: Area under the ROC curve
BMI: Body mass index
BML: Body lean mass
BMLI: Body lean mass index
BFM: Body fat mass
BMD: Bone mineral density
CI: Confidence interval
CPF: Composite physical function
DXA: Dual energy x-ray absorptiometry
FAB: Fullerton Advanced Balance
FES: Falls Efficacy Scale
FF: Fear of falling
IPAQ: International physical activity questionnaire
MB: Multidimensional balance
MET: Metabolic equivalent of task
OR: Odds ratios
PA: Physical activity
R2: Coefficient of determination
ROC: receiver operating characteristic
SD: standard deviation.
Chapter 1
General introduction
15
CHAPTER 1 GENERAL INTRODUCTION
Chapter 1
General introduction
16
INTRODUCTION
Maintaining quality of life throughout the aging process expressed as independent
functioning and healthy status is a major concern of each subject. Given the current
demographic explosion of the third age 1, it has also become a key issue of modern
societies. In the United States, life expectancy at birth rose by 0.4 years from 2003 to
2004, reaching a record 77.8 years 2; in Germany, life expectancy increased from
75 years, in 1990, to 80 years, in 2008 3; in Portugal it is expected that the number of
people over 65 years will increase from 17% to 32% between 2008 and 2060 and that
the percentage of those over 80 years will rise during the same period from 4% to
13% 4. Successful aging implies not only more years of life (quantity) but also quality
of life: the absence of chronic diseases and the ability to function effectively, both
physically and mentally, in old age 5.
The risk of both falls and fall-related injuries, and loss of autonomy coexist and increase
with age; with falls in the elderly being pointed as a major reason for lower quality of
life, loss of autonomy, institutionalisation or death 6-8. Not only the most obvious
consequences of fall-related injuries but also fear of falling lead to the restriction of
normal activities among a large percentage of the elderly 9-12. Furthermore, this
restriction can lead to a further functional decline, depression, feeling of helplessness
and social isolation 13. Moreover, most risk factors for loss of autonomy - as the
disability in the performance of activities of daily living (ADL) - such as age 14, reduced
physical function/fitness 15, deterioration in gait 16, and poor body composition 17,
decreased health status, and the presence of incapacities 18, 19, are also pointed as risk
factors for falls and related injuries (reported in Chapter 2). Physical activity is one of
the main factors known to help maintain autonomy 14, 18, 20 and to be effective in fall
prevention 21.
Therefore it is essential to examine the problem of falls and how it relates to loss of
autonomy. To this end, the theoretical approach underlying the investigation is
presented below.
Chapter 1
General introduction
17
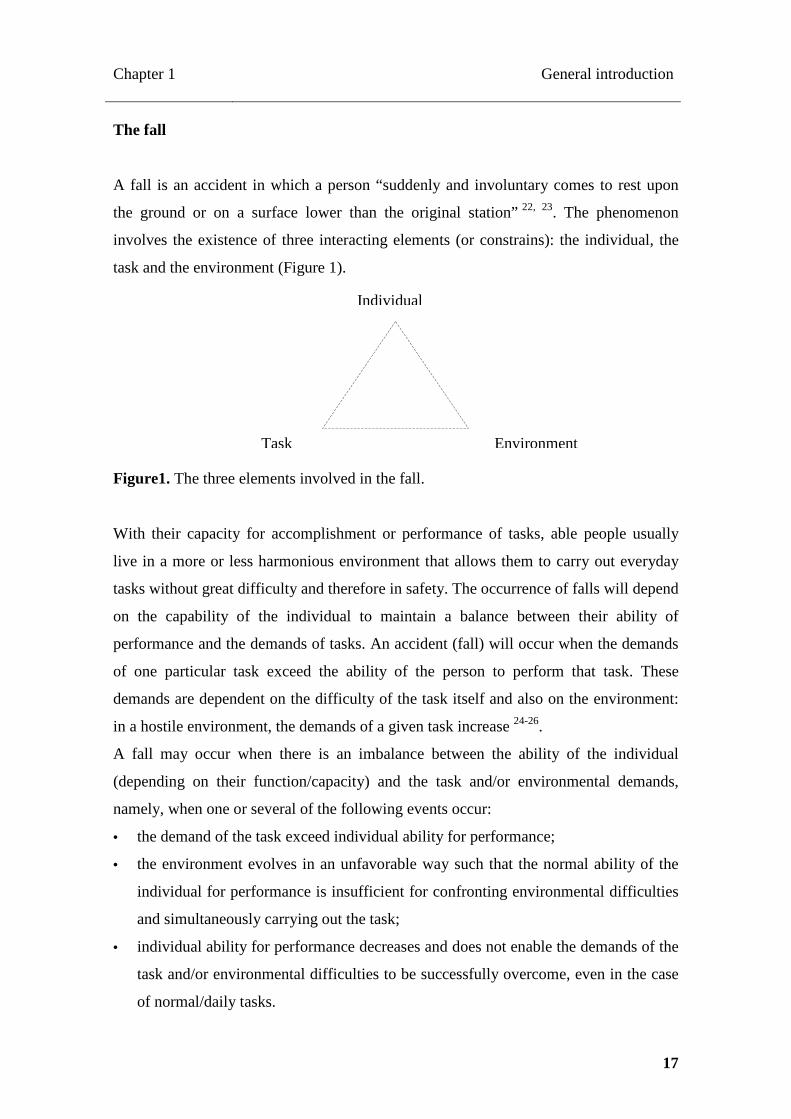
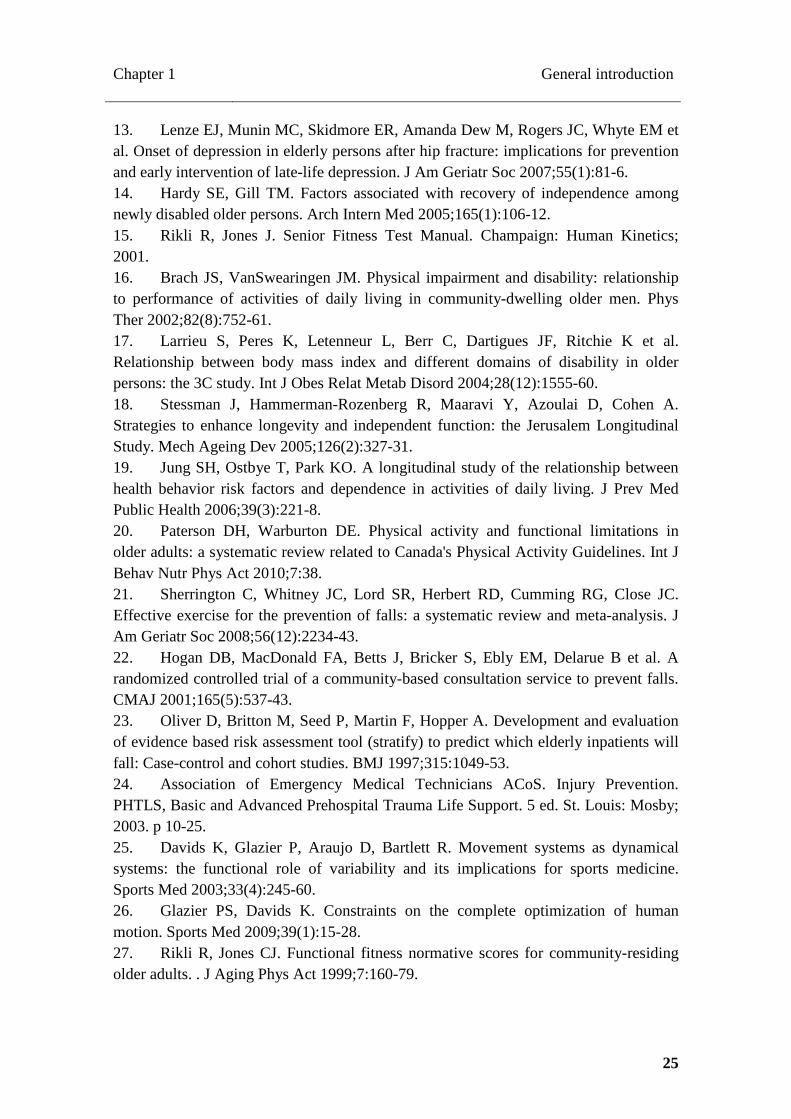
The fall
A fall is an accident in which a person “suddenly and involuntary comes to rest upon
the ground or on a surface lower than the original station” 22, 23. The phenomenon
involves the existence of three interacting elements (or constrains): the individual, the
task and the environment (Figure 1).
Figure1. The three elements involved in the fall.
With their capacity for accomplishment or performance of tasks, able people usually
live in a more or less harmonious environment that allows them to carry out everyday
tasks without great difficulty and therefore in safety. The occurrence of falls will depend
on the capability of the individual to maintain a balance between their ability of
performance and the demands of tasks. An accident (fall) will occur when the demands
of one particular task exceed the ability of the person to perform that task. These
demands are dependent on the difficulty of the task itself and also on the environment:
in a hostile environment, the demands of a given task increase 24-26.
A fall may occur when there is an imbalance between the ability of the individual
(depending on their function/capacity) and the task and/or environmental demands,
namely, when one or several of the following events occur:
• the demand of the task exceed individual ability for performance;
• the environment evolves in an unfavorable way such that the normal ability of the
individual for performance is insufficient for confronting environmental difficulties
and simultaneously carrying out the task;
• individual ability for performance decreases and does not enable the demands of the
task and/or environmental difficulties to be successfully overcome, even in the case
of normal/daily tasks.
Individual
Environment Task
Chapter 1
General introduction
18
The fall may not occur when:
• individual function and consequently ability is sufficiently high that it enables them
to carry out any task in a normal environment or those with a degree of difficulty or
some demands;
• there occurs a reduction in one or more of the functional abilities of the individual;
however, this reduction is compensated by other abilities that still allow them to
successfully perform the task;
• the demands of the task do not challenge the ability of the individual to perform, in
an environment of normal difficulty;
• the environment is so favorable that it enables the task to be successfully carried
out;
• there is no task to be carried out, hence there is no difficulty.
Therefore, the variability of functional performance must be considered, since in the
performance of functional movement, different degrees of freedom enable different
solutions for the successful accomplishment of a given task. The variability of
movement helps the individual to adapt to the unique constraints (associated with the
individual, the task and the environment) successfully (without falling) 25.
When people age their ability to perform tasks is expected to decrease because, besides
demonstrating a higher level of morbidity, functional ability naturally decreases with
age 27, 28. As functionality decreases, people are increasingly less able to deal with less
demanding situations 29, either in terms of the environment or the task. Furthermore, as
aging advances, human movement systems tend to be characterized by a loss in
complexity and also decreasing movement variability resulting in poor adaptation to
environmental changes 25, 30. In fact, the aging process contributes to a progressively
precarious balance between the three elements of the system, and, as the probability of
the rupture of this balance increases, the probability of the occurrence of falls rises.
When the ability of the elderly in terms of performance is drastically reduced, they may
lose even the ability for meeting the demands of everyday tasks 29. In this case, a fall
may occur during the performance of such tasks, which nevertheless present a very low
degree of difficulty, and not only during the performance of more demanding tasks 29, 31.
Loss of functionality in the elderly is accompanied by a decrease in their capacity for
carrying out tasks in less favorable environments (for example, negotiating toys on the
floor constituting an obstacle to reaching the telephone); this is why an understanding of
Chapter 1
General introduction
19
the role of extrinsic risk factors for falling and/or environment hazards with different
degrees of functionality is so important 32-34.
Therefore, the ability for accomplishing tasks and, accordingly, the ability for carrying
out tasks without falling depends on several ability factors: the somatic, the physical,
the sensorial, information analysis and response, among others 31, 35-37. If the task and/or
the environment are not excessively demanding, a high level of ability as regards some
factors will probably compensate for a lower level of ability for others, allowing the
individual to successfully perform a given task. However, the gradual nature of the
aging process means that rupture in the balance between the three elements of the
system ends only with death 38.
The main question is which and how the elements involved in this model can be
manipulated to counteract or delaying the tendency for rupture and how this can be
achieved.
Task
The first attempt at avoiding falls and related injuries is inactivity: if the individual does
not move, and lies or sits without doing anything, consequently not performing any
physical activity or task, the probability of falling will be practically zero. However, if
he does not perform any physical activity, his functional level will decline and his
ability to perform will decrease drastically 39. Consequently, any task (e.g. go to the
bathroom) may make demands on the elderly person that he may be not able to
successfully meet, and a fall may occur during the performance of the task. Current
research studies recommend that interventions designed to prevent falls should promote
physical activity/exercise 39-41. However, it is not clear the influence of physical activity
on falls, namely which kind and amount of physical activity is required to prevent falls
and related injuries, neither are the relationship between physical activity and other risk
factors for falls.
Environment
Environmental control is always an important factor, because, with advancing age, the
elderly tend to neglect their houses, gardens and their general environment, and
Chapter 1
General introduction
20
sometimes live in the midst of very hazardous conditions 42. In caring for them, an
external agent may be required to draw up an inventory of risk situations and find the
best solution for each individual 29, 42. This may involve simply installing supporting
bars in the bathtub, replacing the chair stood on to change light bulbs with a small
ladder or relocating cooking utensils in a more accessible place. However, it is
important to identify the relationships between the different functional abilities, other
intrinsic risk factors (like diseases), and the role of environmental hazards, both with
regards to falls and fall-related injuries, and loss of autonomy: in some cases, while
environmental hazards are known to be extremely high, falls do not occur; by contrast,
in some cases where environmental hazards are known to be low, falls still occur.
The individual
Although the aging process cannot be arrested, some measures can be implemented to
attenuate its negative effects 43. Obtaining glasses or a hearing aid can counteract the
natural loss of capacity of the visual and auditory systems 44. At proprioceptive level, it
may be more difficult to attenuate the loss of sensory capacity, but the use of suitable
foot-ware, for example, with non-slip soles, may be significant in preventing falls 45.
Additionally, medicines and treatments may be prescribed for incapacity caused either
by the natural degradation of the organism or illnesses 46. However, care must be taken
to safeguard against the side-effects of both drugs and treatments, such as the effects of
anti-depressants that decrease attention and may therefore contribute to a fall 47.
Another level of intervention involves physical exercise for the maintenance of
functional abilities, due to the fact that, as mentioned above, physical activity/exercise
may prevent the reduction of some functional abilities 43. A high physical fitness
prevents the occurrence of falls, especially a good level of motor coordination, balance,
agility, muscle strength, flexibility and aerobic endurance, as does the maintenance of
gait pattern and attention capacity for successfully meeting the demands inherent to the
performance of specific motor tasks (the dual-task paradigm) 48-51. Furthermore,
physical activity prevents or decreases the effects of illness and promotes good body
composition 52. However, the relative importance of each of these factors is not known.
One concrete situation reported in some studies 53 is the increased susceptibility of
Chapter 1
General introduction
21
women to falls as compared with men; however, the reasons for this difference are little
known.
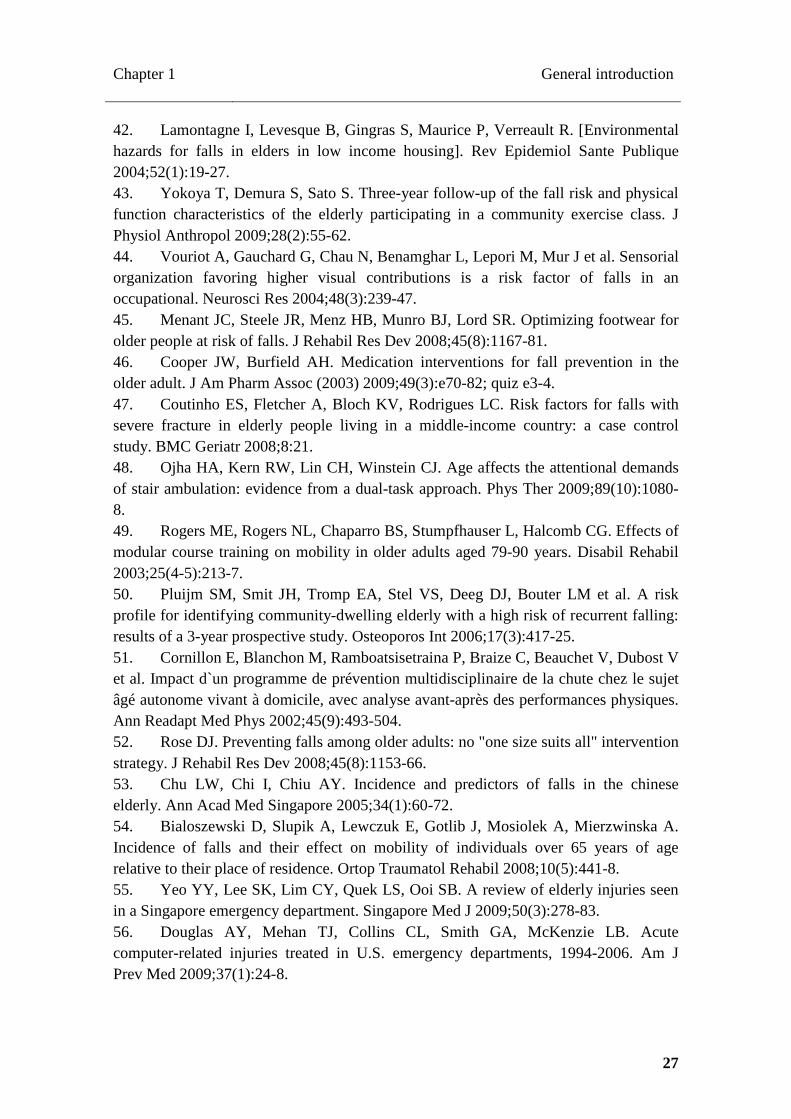
The injury
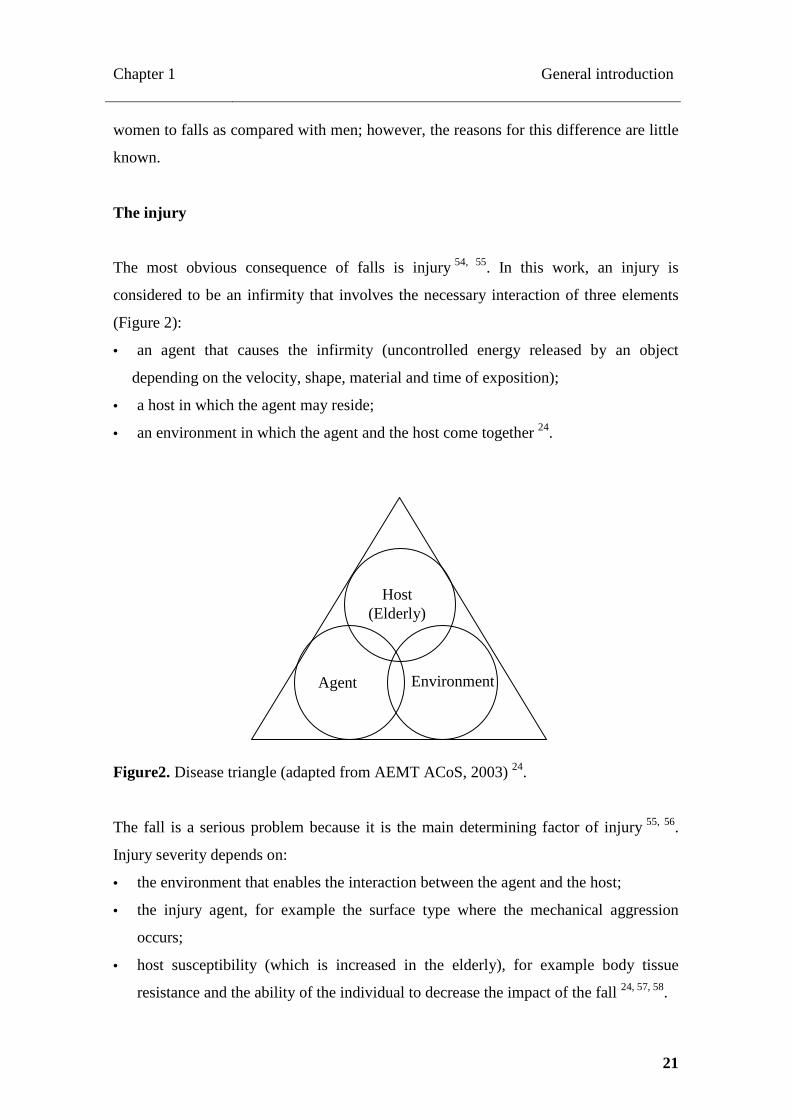
The most obvious consequence of falls is injury 54, 55. In this work, an injury is
considered to be an infirmity that involves the necessary interaction of three elements
(Figure 2):
• an agent that causes the infirmity (uncontrolled energy released by an object
depending on the velocity, shape, material and time of exposition);
• a host in which the agent may reside;
• an environment in which the agent and the host come together 24.
Figure2. Disease triangle (adapted from AEMT ACoS, 2003) 24.
The fall is a serious problem because it is the main determining factor of injury 55, 56.
Injury severity depends on:
• the environment that enables the interaction between the agent and the host;
• the injury agent, for example the surface type where the mechanical aggression
occurs;
• host susceptibility (which is increased in the elderly), for example body tissue
resistance and the ability of the individual to decrease the impact of the fall 24, 57, 58.
Agent
Host (Elderly)
Environment
Chapter 1
General introduction
22
Injuries severity range from simple abrasions or contusions to bone fractures, and
depend on the location in the body 55, 59, 60. However, injury can be controlled by
adapting the environment, destroying the agent, or by strengthening the host.
Injury prevention
Preventive interventions should promote every action that decreases the occurrence and
probability of falls 61. As it is impossible to remove the possibility of falls because they
may occurs in any place and any object may unexpectedly act as an injury agent (a
chair, the bathtub, stairs, or the floor), the priority is on decreasing the risk of a fall. The
identification of environmental hazards and the implementation of measures to control
them (the use of a bath chair in the bathtub, for example) or possibly eliminate them
(removing dangerous objects from the environment) may prevent injury or at least
decrease the severity of injuries 29, 42.
The reduction of host susceptibility to the agent is also an option. However, this is to
attempt to counteract the natural trend towards aging 38. Elderly people gradually lose
their reflexes and functional abilities, which may lead to an increase in the amount of
uncontrolled energy released by the aggressive agent. They also have less tissue
elasticity and are consequently more susceptible to tissue rupture 62, 63. Moreover, age is
associated with the osteoporosis phenomenon, the main reason for decline in bone
resistance and the consequently increase in fracture susceptibility 64, 65, which is higher
in women 66.
It is known that weight-bearing physical activity/exercise throughout life represents an
efficient method for preventing osteoporosis-related fractures in the elderly 67, 68.
However, physical activity/exercise effect on other type of fall-related injuries has not
been satisfactorily explained.
Maintenance of autonomy in elderly people
Associated with falls, there is the problem of the maintenance of autonomy for the
accomplishment of everyday tasks, thereby enabling elderly people to lead an
independent life.
Chapter 1
General introduction
23
Fall-related fractures are responsible for further falls, loss of autonomy, and sometimes
lead to institutionalization 7, 8, 69. However, fear of falling may constitute the reason why
the elderly do not carry out everyday tasks independently, even if there is no physical
impairment 70, 71. There are no in-depth studies on how physical function/fitness
interacts with the fear of falling and the consequent refusal to accomplish everyday
tasks. Even so, fear of falling has been point to as a risk factor for falls50. Age, health
status, physical activity and fitness, including body composition, are considered the
main predictors of falls, fall-related injuries and loss of autonomy 10, 14-21, 50, 72, but the
role of each predictor and their interaction on the outcomes of these variables are not
clear.
OBJECTIVE
The main objective of this research was to analyze the factors involved in falls and
injuries, fear of falling, and loss of autonomy, and determine which and how the
elements described in theoretical approach (task, individual [elderly], environment; and
injury agent) can be controlled in order to counteract the trend towards the rupture that
will result in these undesirable events. In particularly, this work aimed to analyze the
role of physical activity and fitness, including body composition, and also the role of
health status and environmental hazards as predictors of falls and injuries, fear of falling
and loss of autonomy. To this end, five studies were conducted with the following
purposes:
• to analyze the variation of the different attributes that enable physical
functioning in community-dwelling older adults using scores from young
adults as reference (Chapter 3);
• to analyze the influence of gender on the occurrence of falls after accounting
for health status, body composition and physical function differences
(Chapter 4);
• to analyze the role of physical activity in the occurrence of falls and fall-
related injuries (Chapter 5);
• to analyze the associations between falls, fall-related injuries, fear of falling
and disability in activities of daily living (Chapter 6);

Chapter 1
General introduction
24
• to analyze the influence of health status, physical activity and fitness on
autonomy over a 5-year period (Chapter 7).
In Chapter 2 there is a review of the literature focusing on falls and their consequences
which potentially lead to loss of autonomy.
Chapter 8 includes a general discussion of the main findings of the studies conducted
and provides recommendations based on the main findings of the investigation.
REFERENCES
1. Eurostat. EU27 population is expected to peak by around 2040. 2011 [26 July 2011]. Available from URL: http://epp.eurostat.ec.europa.eu/cache/ITY_PUBLIC/3-08062011-BP/EN/3-08062011-BP-EN.PDF. 2. Minino AM, Heron MP, Murphy SL, Kochanek KD. Deaths: final data for 2004. Natl Vital Stat Rep 2007;55(19):1-119. 3. WHO. World Health Statistics 2010. 2010 [28 December 2010]. Available from URL: http://www.who.int/whosis/whostat/2010/en/index.html. 4. Barrett-Connor E, Weiss TW, McHorney CA, Miller PD, Siris ES. Predictors of falls among postmenopausal women: results from the National Osteoporosis Risk Assessment (NORA). Osteoporos Int 2009;20(5):715-22. 5. Britton A, Shipley M, Singh-Manoux A, Marmot MG. Successful aging: the contribution of early-life and midlife risk factors. J Am Geriatr Soc 2008;56(6):1098-105. 6. Robbins JA, Biggs ML, Cauley J. Adjusted mortality after hip fracture: From the cardiovascular health study. J Am Geriatr Soc 2006;54(12):1885-91. 7. Arfken CL, Lach HW, Birge SJ, Miller JP. The prevalence and correlates of fear of falling in elderly persons living in the community. Am J Public Health 1994;84(4):565-70. 8. Donald IP, Bulpitt CJ. The prognosis of falls in elderly people living at home. Age Ageing 1999;28(2):121-5. 9. Bruce DG, Devine A, Prince RL. Recreational physical activity levels in healthy older women: the importance of fear of falling. J Am Geriatr Soc 2002;50(1):84-9. 10. Tinetti ME, Speechley M, Ginter SF. Risk factors for falls among elderly persons living in the community. N Engl J Med 1988;319(26):1701-7. 11. Zijlstra G, Haastregt J, Eijk J, Kempen G. Evaluating an intervention to reduce fear of falling and associated activity restriction in elderly persons: design of a randomised controlled trial. BMC Public Health 2005;5(26):1-9. 12. Fuzhong L, Fisher KJ, Harmer P, MacAuley E, Wilson NL. Fear of falling in elderly persons: association with falls, functional ability and quality of life. J Gerontol 2003;58B(5):P283-P90.
Chapter 1
General introduction
25
13. Lenze EJ, Munin MC, Skidmore ER, Amanda Dew M, Rogers JC, Whyte EM et al. Onset of depression in elderly persons after hip fracture: implications for prevention and early intervention of late-life depression. J Am Geriatr Soc 2007;55(1):81-6. 14. Hardy SE, Gill TM. Factors associated with recovery of independence among newly disabled older persons. Arch Intern Med 2005;165(1):106-12. 15. Rikli R, Jones J. Senior Fitness Test Manual. Champaign: Human Kinetics; 2001. 16. Brach JS, VanSwearingen JM. Physical impairment and disability: relationship to performance of activities of daily living in community-dwelling older men. Phys Ther 2002;82(8):752-61. 17. Larrieu S, Peres K, Letenneur L, Berr C, Dartigues JF, Ritchie K et al. Relationship between body mass index and different domains of disability in older persons: the 3C study. Int J Obes Relat Metab Disord 2004;28(12):1555-60. 18. Stessman J, Hammerman-Rozenberg R, Maaravi Y, Azoulai D, Cohen A. Strategies to enhance longevity and independent function: the Jerusalem Longitudinal Study. Mech Ageing Dev 2005;126(2):327-31. 19. Jung SH, Ostbye T, Park KO. A longitudinal study of the relationship between health behavior risk factors and dependence in activities of daily living. J Prev Med Public Health 2006;39(3):221-8. 20. Paterson DH, Warburton DE. Physical activity and functional limitations in older adults: a systematic review related to Canada's Physical Activity Guidelines. Int J Behav Nutr Phys Act 2010;7:38. 21. Sherrington C, Whitney JC, Lord SR, Herbert RD, Cumming RG, Close JC. Effective exercise for the prevention of falls: a systematic review and meta-analysis. J Am Geriatr Soc 2008;56(12):2234-43. 22. Hogan DB, MacDonald FA, Betts J, Bricker S, Ebly EM, Delarue B et al. A randomized controlled trial of a community-based consultation service to prevent falls. CMAJ 2001;165(5):537-43. 23. Oliver D, Britton M, Seed P, Martin F, Hopper A. Development and evaluation of evidence based risk assessment tool (stratify) to predict which elderly inpatients will fall: Case-control and cohort studies. BMJ 1997;315:1049-53. 24. Association of Emergency Medical Technicians ACoS. Injury Prevention. PHTLS, Basic and Advanced Prehospital Trauma Life Support. 5 ed. St. Louis: Mosby; 2003. p 10-25. 25. Davids K, Glazier P, Araujo D, Bartlett R. Movement systems as dynamical systems: the functional role of variability and its implications for sports medicine. Sports Med 2003;33(4):245-60. 26. Glazier PS, Davids K. Constraints on the complete optimization of human motion. Sports Med 2009;39(1):15-28. 27. Rikli R, Jones CJ. Functional fitness normative scores for community-residing older adults. . J Aging Phys Act 1999;7:160-79.

Chapter 1
General introduction
26
28. de Rekeneire N, Visser M, Peila R, Nevitt MC, Cauley JA, Tylavsky FA et al. Is a fall just a fall: correlates of falling in healthy older persons. The Health, Aging and Body Composition Study. J Am Geriatr Soc 2003;51(6):841-6. 29. Gitlin LN, Winter L, Dennis MP, Corcoran M, Schinfeld S, Hauck WW. A randomized trial of a multicomponent home intervention to reduce functional difficulties in older adults. J Am Geriatr Soc 2006;54(5):809-16. 30. Hundrup YA, Ekholm O, Hoidrup S, Davidsen M, Obel EB. Risk factors for hip fracture and a possible effect modification by hormone replacement therapy. The Danish nurse cohort study. Eur J Epidemiol 2005;20(10):871-7. 31. Stewart K, Bacher A, Hees P, Tayback M, Ouyang P, Beur S. Exercise effects on bone mineral density. Relationships to change in fitness and fatness. Am J Prev Med 2005;28(5):453-60. 32. Tinetti M, Baker D, MacAvay G, Claus E, Garrett P, Gottschalk M et al. A multifactorial intervention to reduce the risk of falling among elderly people living in the community. N Engl J Med 1994;331(13):821-7. 33. Tinetti ME. Clinical practice. Preventing falls in elderly persons. N Engl J Med 2003;348(1):42-9. 34. Bath P, Morgan K. Differential risk profiles for indoor and outdoor falls in older people living in home in Nottingham, UK. Eur J Epidemiol 1999;15:65-73. 35. van Heuvelen MJ, Hochstenbach J, de Greef MH, Brouwer WH, Mulder T, Scherder E. [Is the Activities-specific Balance Confidence Scale suitable for Dutch older persons living in the community?]. Tijdschr Gerontol Geriatr 2005;36(4):146-54. 36. Bateni H, Zecevic A, MacIlroy W, Maki E. Resolving conflicts in task demands during balance recovery: does holding an object inhibit compensatory grasping? Exp Brain Res 2004;157:49-58. 37. Rogers M, Rogers N, Takeshima N, Islam M. Methods to Assess and Improve the Physical Parameters Associated With Fall Risk in Older Adults. Prev Med 2003;36:255-64. 38. Vitetta L, Anton B. Lifestyle and nutrition, caloric restriction, mitochondrial health and hormones: scientific interventions for anti-aging. Clin Interv Aging 2007;2(4):537-43. 39. Nelson ME, Rejeski WJ, Blair SN, Duncan PW, Judge JO, King AC et al. Physical activity and public health in older adults: recommendation from the American College of Sports Medicine and the American Heart Association. Circulation 2007;116(9):1094-105. 40. Carter ND, Khan KM, McKay HA, Petit MA, Waterman C, Heinonen A et al. Community-based exercise program reduces risk factors for falls in 65- to 75-year-old women with osteoporosis: randomised controlled trial. CMAJ 2002;167(9):997-1004. 41. Liu-Ambrose T, Kan K, Eng J, Gillies G, Lord R, McKay H. The beneficial effects of group-based exercises on fall risk profile and physical activity persist 1 year postintervention in older women with low bone mass: follow-up after withdrawal of exercise. J Am Geriatr Soc 2005;53:1767-73.
Chapter 1
General introduction
27
42. Lamontagne I, Levesque B, Gingras S, Maurice P, Verreault R. [Environmental hazards for falls in elders in low income housing]. Rev Epidemiol Sante Publique 2004;52(1):19-27. 43. Yokoya T, Demura S, Sato S. Three-year follow-up of the fall risk and physical function characteristics of the elderly participating in a community exercise class. J Physiol Anthropol 2009;28(2):55-62. 44. Vouriot A, Gauchard G, Chau N, Benamghar L, Lepori M, Mur J et al. Sensorial organization favoring higher visual contributions is a risk factor of falls in an occupational. Neurosci Res 2004;48(3):239-47. 45. Menant JC, Steele JR, Menz HB, Munro BJ, Lord SR. Optimizing footwear for older people at risk of falls. J Rehabil Res Dev 2008;45(8):1167-81. 46. Cooper JW, Burfield AH. Medication interventions for fall prevention in the older adult. J Am Pharm Assoc (2003) 2009;49(3):e70-82; quiz e3-4. 47. Coutinho ES, Fletcher A, Bloch KV, Rodrigues LC. Risk factors for falls with severe fracture in elderly people living in a middle-income country: a case control study. BMC Geriatr 2008;8:21. 48. Ojha HA, Kern RW, Lin CH, Winstein CJ. Age affects the attentional demands of stair ambulation: evidence from a dual-task approach. Phys Ther 2009;89(10):1080-8. 49. Rogers ME, Rogers NL, Chaparro BS, Stumpfhauser L, Halcomb CG. Effects of modular course training on mobility in older adults aged 79-90 years. Disabil Rehabil 2003;25(4-5):213-7. 50. Pluijm SM, Smit JH, Tromp EA, Stel VS, Deeg DJ, Bouter LM et al. A risk profile for identifying community-dwelling elderly with a high risk of recurrent falling: results of a 3-year prospective study. Osteoporos Int 2006;17(3):417-25. 51. Cornillon E, Blanchon M, Ramboatsisetraina P, Braize C, Beauchet V, Dubost V et al. Impact d`un programme de prévention multidisciplinaire de la chute chez le sujet âgé autonome vivant à domicile, avec analyse avant-après des performances physiques. Ann Readapt Med Phys 2002;45(9):493-504. 52. Rose DJ. Preventing falls among older adults: no "one size suits all" intervention strategy. J Rehabil Res Dev 2008;45(8):1153-66. 53. Chu LW, Chi I, Chiu AY. Incidence and predictors of falls in the chinese elderly. Ann Acad Med Singapore 2005;34(1):60-72. 54. Bialoszewski D, Slupik A, Lewczuk E, Gotlib J, Mosiolek A, Mierzwinska A. Incidence of falls and their effect on mobility of individuals over 65 years of age relative to their place of residence. Ortop Traumatol Rehabil 2008;10(5):441-8. 55. Yeo YY, Lee SK, Lim CY, Quek LS, Ooi SB. A review of elderly injuries seen in a Singapore emergency department. Singapore Med J 2009;50(3):278-83. 56. Douglas AY, Mehan TJ, Collins CL, Smith GA, McKenzie LB. Acute computer-related injuries treated in U.S. emergency departments, 1994-2006. Am J Prev Med 2009;37(1):24-8.
Chapter 1
General introduction
28
57. Pluijm S. Predictors and consequences of falls and fractures in the elderly. Amesterdam: Vrije Universiteit; 2001. 58. Laing AC, Robinovitch SN. Low stiffness floors can attenuate fall-related femoral impact forces by up to 50% without substantially impairing balance in older women. Accid Anal Prev 2009;41(3):642-50. 59. Stevens JA, Thomas K, Teh L, Greenspan AI. Unintentional Fall Injuries Associated with Walkers and Canes in Older Adults Treated in U.S. Emergency Departments. J Am Geriatr Soc 2009. 60. Ojo P, O'Connor J, Kim D, Ciardiello K, Bonadies J. Patterns of injury in geriatric falls. Conn Med 2009;73(3):139-45. 61. Gillespie LD, Gillespie WJ, Robertson MC, Lamb SE, Cumming RG, Rowe BH. WITHDRAWN: Interventions for preventing falls in elderly people. Cochrane Database Syst Rev 2009(2):CD000340. 62. Cadarette S, Jaglal S, Kreiger N, McIsaac W, Darlington G, Tu J. Development and validation of the Osteoporosis Risk Assessment Instrument to facilitate selection of women for bone densitometry. CMAJ 2000;162(9):1289-94. 63. Wang X, Li X, Shen X, Agrawal CM. Age-related changes of noncalcified collagen in human cortical bone. Ann Biomed Eng 2003;31(11):1365-71. 64. Kanis J. Osteoporosis III: diagnostic of osteoporosis and assessment of fracture risk. Lancet 2002;359(9321):1929-36. 65. Brown J, Josse R. 2002 clinical practice guidelines for the diagnosis and management of osteoporosis in Canada. CMAJ 2002;12(167):S1-S34. 66. Kannus P, Sievanen H, Palvanen M, Jarvinen T, Parkkari J. Prevention of falls and consequent injuries in elderly people. Lancet 2005;366(9500):1885-93. 67. Karinkanta S, Heinonen A, Sievanen H, Uusi-Rasi K, Fogelholm M, Kannus P. Maintenance of exercise-induced benefits in physical functioning and bone among elderly women. Osteoporos Int 2009;20(4):665-74. 68. Kannus P. [How to prevent fractures due to accidental falls among elderly population]. Duodecim 2006;122(2):135-7. 69. Lloyd BD, Williamson DA, Singh NA, Hansen RD, Diamond TH, Finnegan TP et al. Recurrent and injurious falls in the year following hip fracture: a prospective study of incidence and risk factors from the Sarcopenia and Hip Fracture study. J Gerontol A Biol Sci Med Sci 2009;64(5):599-609. 70. Cumming RG, Salkeld G, Thomas M, Szonyi G. Prospective study of the impact of fear of falling on activities of daily living, SF-36 scores, and nursing home admission. J Gerontol A Biol Sci Med Sci 2000;55(5):M299-305. 71. Murphy S, Tickle-Degnen L. Participation in daily living tasks among older adults with fear of falling. Am J Occup Ther 2001;55(5):538-44. 72. Chodzko-Zajko WJ, Proctor DN, Fiatarone Singh MA, Minson CT, Nigg CR, Salem GJ et al. American College of Sports Medicine position stand. Exercise and physical activity for older adults. Med Sci Sports Exerc 2009;41(7):1510-30.
Chapter 2
Role of physical activity in the prevention of falls and their consequences in the elderly
29
CHAPTER 2 ROLE OF PHYSICAL ACTIVITY IN THE PREVENTION OF FALL S AND THEIR CONSEQUENCES IN THE ELDERLY 1
_______________________________ 1 Pereira C. Vogelaere P. Baptista F. Role of physical activity in the prevention of falls and their
consequences in the elderly. Eur Rev Aging Phys Act 2008; 5:51-58.

Chapter 2
Role of physical activity in the prevention of falls and their consequences in the elderly
30
ABSTRACT
This work aims to provide an inventory of the risk factors and consequences of falling
in the elderly, namely fractures, and to identify strategies to prevent falls and minimise
their effects. Falls in elderly people are a major cause of injuries leading to a general
fear of falling, poorer quality of life and even death. The increase in life expectancy
brought by developments in the medical and health sciences has not always brought
enhanced quality of life. More elderly people live with reduced functional capacities
resulting in a higher prevalence of falls and associated problems, for themselves and for
society. Risk factors for falling, commonly resulting from normal aging processes, have
already been identified through multiple studies. Exercise may play an important role in
fall prevention and their consequences. Although, effective strategies are usually
multidisciplinary and focus simultaneously on several risk factors. However, only large
scale prevention programmes can have significant effective social impact. To minimize
occurrence and consequences of falls, policies to systematically implement prevention
programmes should be established.
Key words: Falls; Risk factors for falling; Elderly Fractures; Physical activity.
Chapter 2
Role of physical activity in the prevention of falls and their consequences in the elderly
31
Problems of falls
Falls are a major health problem among the elderly. Thirty percent of people aged 65
and older living in community fall at least once a year 1 and this rate increases with
age 2.
As life expectancy increases, there are a higher number of less healthy and less fit
elderly people living longer with their infirmities 3-5. Consequently, the risk of falls and
their consequences is now greater than before 6, 7, as is illustrated by statistics from
Finland 8.
Falls are the major cause of death related to mechanical injuries in the elderly, and the
mortality rate increases when the individual fall rate increases 9-11. According to
Rubenstein 12, about 4% of falls result in fractures and about 11% result in other serious
injuries such as head trauma, soft-tissue injuries, and severe lacerations. Those who
survive falling commonly restrict their activities due to soft tissue injuries and
fractures 13, 14. Besides injuries and more evident physical consequences, psychological
consequences must also be considered: the fear of falling leads to a large percentage of
the elderly restricting their activities 15-18. Both these reasons for loss of functionality
can result in the "post-fall anxiety syndrome". Less confidence in the ability to walk
safely can lead to further functional decline, depression, feelings of helplessness, social
isolation 12, 19, 20 and consequently a loss of quality of life 21. Inevitably, also, falls and
fear of falling are among the major reasons for the institutionalisation of elderly
people 11, 22.
According to these factors, falls in the elderly and the resulting injuries have to be
considered a social concern, not only because of health care costs, but also due to
psychological problems associated with behavioural modifications, which restrict
functional mobility, thus promoting physical dependence and potential changes in
lifestyle 23.
Chapter 2
Role of physical activity in the prevention of falls and their consequences in the elderly
32
Risk factors for falling and fractures
Falls are defined as any incident in which a person “suddenly and involuntary come to
rest upon the ground or a surface lower than the original station” 24, 25. Fall
consequences, such as fractures, depend fundamentally on three factors:
• Risk factors related to fall occurrences, such as health problems, activity and physical
environment.
• Risk factors referring to bone strength, namely bone mineral density (BMD), bone
structure or the spatial arrangement of the bone trabecular and bone quality or the
mechanical properties of the bone tissue.
• Risk factors associated to the impact of the fall, i.e. fall severity, floor material, soft
tissue surrounding the impacted bone, etc. 26-31.
Fractures may occur in any bone of the skeleton. Humeral, fist, pelvis and hip fractures
are positively correlated with age and usually result from the combined effects of
osteoporosis and the fall proper 14, 32-36. Fractures of the vertebrae, also common, are
generally associated with osteoporosis 37 and produce a high rate of morbidity and
mortality 38. However, falls may not be the determinant factor of this occurrence in
spine.
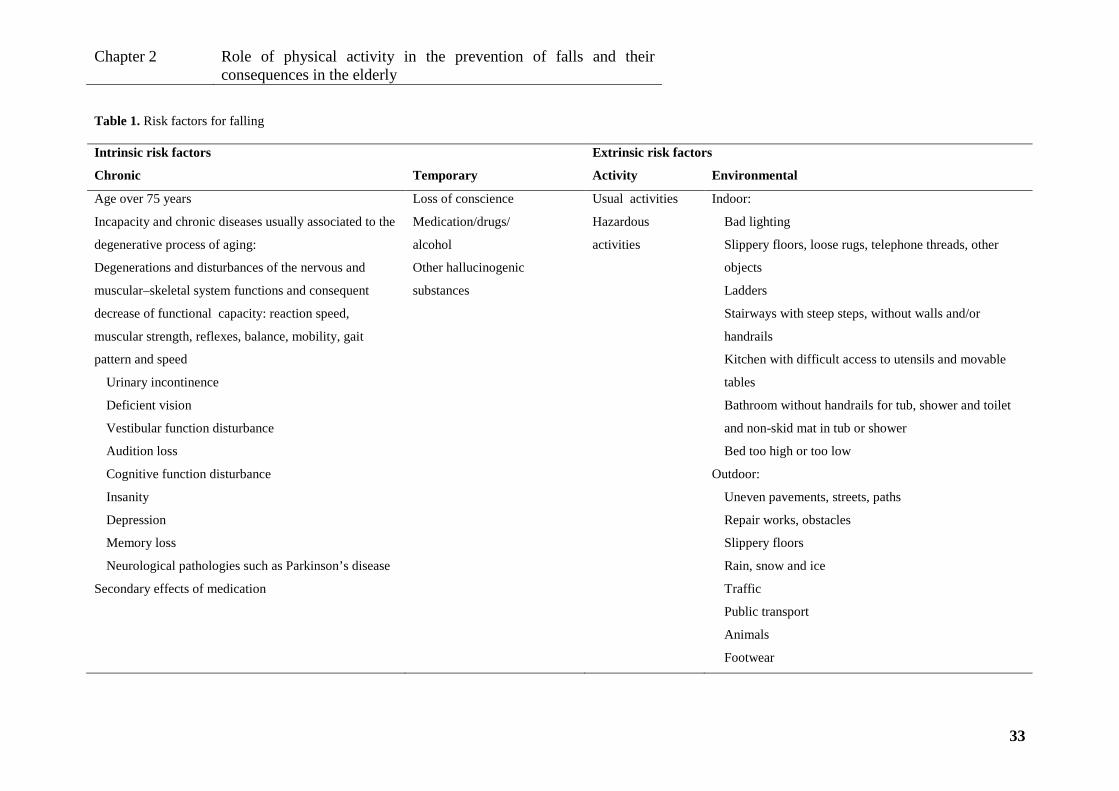
Table 1 present the most cited risk factors for falling according to several authors 12, 20-22,
26, 28, 30, 31, 35, 36, 39-53. In the elderly living in communities, the majority of falls occur
during usual activities, such as walking or changing position 7, 16. They happen mostly at
home, so that a “safe home” is fundamental 7, 54. Only 5% of the falls are the
consequence of clearly hazardous activities, such as climbing on a chair or a ladder or
participating in sport activities. About 10% of the falls occur on stairs. It has been
shown that going down stairs is more hazardous than climbing 7, 16. Environmental
factors are responsible for most of the falls, although they are not the main cause for
falling. However, few falls result from unpredictable events 7.
Chapter 2
Role of physical activity in the prevention of falls and their consequences in the elderly
33
Table 1. Risk factors for falling
Intrinsic risk factors Extrinsic risk factors
Chronic Temporary Activity Environmental
Age over 75 years
Incapacity and chronic diseases usually associated to the
degenerative process of aging:
Degenerations and disturbances of the nervous and
muscular–skeletal system functions and consequent
decrease of functional capacity: reaction speed,
muscular strength, reflexes, balance, mobility, gait
pattern and speed
Urinary incontinence
Deficient vision
Vestibular function disturbance
Audition loss
Cognitive function disturbance
Insanity
Depression
Memory loss
Neurological pathologies such as Parkinson’s disease
Secondary effects of medication
Loss of conscience
Medication/drugs/
alcohol
Other hallucinogenic
substances
Usual activities
Hazardous
activities
Indoor:
Bad lighting
Slippery floors, loose rugs, telephone threads, other
objects
Ladders
Stairways with steep steps, without walls and/or
handrails
Kitchen with difficult access to utensils and movable
tables
Bathroom without handrails for tub, shower and toilet
and non-skid mat in tub or shower
Bed too high or too low
Outdoor:
Uneven pavements, streets, paths
Repair works, obstacles
Slippery floors
Rain, snow and ice
Traffic
Public transport
Animals
Footwear
Chapter 2
Role of physical activity in the prevention of falls and their consequences in the elderly
34
According to Bath and Morgan 55, falls in outdoor and indoor environments present
different risk profiles. Risk factors associated with outdoor falls are both intrinsic and
extrinsic. Intrinsic risk factors include decreased functional capacities such as reduced
strength, and/or reduced gait velocity, while extrinsic factors are related to hazardous
environments and performance outside habitual activities. Risk factors associated with
indoor falls are mainly intrinsic and their occurrence increases when the elderly are
housebound, due to poor health, frailty or to the use of high levels of prescribed
medications. It is important to note that people falling at home present a higher
mortality rate, although the relationship between causality and effect is still unclear.
Table 2 provides a review of the risk factors for fractures due to falling 29, 30, 33, 43, 46, 48,
56-60. Bone strength is determined 65-80% by BMD (quantity of bone mineral per square
or cubic centimetre) and 20-35% by bone structure (spatial arrangement of the bone
trabecular), as well as by bone quality (the material properties of bone tissue) 30, 44.
BMD, in turn, is determined by genetic and hormonal factors, body composition,
nutrition, physical activity, chronic diseases and the use of medication 30, 44, 51, 61-65.
Evaluation of BMD may be performed by dual-energy X-ray absorptiometry 66.
Osteoporosis is diagnosed in postmenopausal women and in men aged 50 and older if
BMD expressed as T-score is -2.5 or less at the lumbar spine, total hip of femoral
neck 67. The T-score indicates how many standard deviations (SD), above or below the
average value, the result in question actually lies. The reference standard from which
the T-score is calculated is the BMD of the young adult age 20-29 years. A T-score
between –1.0 and –2.5 SD indicates low bone density or mass, also usually referred as
osteopenia. Contrary to osteoporosis, people with low bone mass are not necessarily at
high fracture risk 46, 68.
The risk of falling and fracture is related to the number of existing risk factors and is
potentiated by the interaction and cumulative effect of multiple risks 16, 29, 69, 70.
However many of those risk factors can be avoided 56, 70 or reduced when some
contributing factors are modified by intervention programmes 16, 53, 60, particularly,
when these programmes are multifactorial 54, 71, 72.
Chapter 2
Role of physical activity in the prevention of falls and their consequences in the elderly
35
Table 2. Risk factors for fractures due to falling.
Risk factors
Risk factors inherent to the individual:
Age (specially over 75 years)
Female (vs. male)
Family history of fractures due to osteoporosis (maternal hip fracture)
Recurrent falls in previous year
Previous fracture caused by a low energy impact
Osteopenia, osteoporosis and associated disorders
Low body weight (body mass index <19 kg/m2)
Bone structure: geometry and length
Corticosteroids treatments
Hormonal factors
Behaviour risk factors:
Nutritional factors
Low consumption of calcium (<700 mg/d)
Vitamin D deficit (low exposition to sun light)
Physical inactivity
Tobacco
Alcohol
Factors that potentiate falls impact:
Height (the taller the person the greater the impact)
Decreased muscular and fat mass
Lateral falls
Point of impact on the bone (for instance the femoral neck)
Loss of defence reflexes
Floor surface
No use of artificial shock absorber (reduction of the occurrence of
fractures by 40%)
Chapter 2
Role of physical activity in the prevention of falls and their consequences in the elderly
36
Prevention strategies for falls and fractures
Most elderly people are not aware of their predisposition to fall, or identify their
inherent risk factors and thus they cannot express their limitations to physician or other
healthcare personnel. Consequently, as prevention is often overlooked, the risk becomes
evident only after a lesion or incapacity due to a fall 73, 74.
The correct diagnosis of this reality is fundamental. The use of proficient instruments to
recognize the predisposed risk factors responsible for the occurrence of serious lesions,
and the evaluation of behavioural risk factors, allow the identification of populations
and individuals at risk 25, 72, 75-77. This knowledge leads to the setting up and
implementation of efficient intervention programmes – focussed on the existing risk
factors and providing answers to the needs of the individual or specific population
groups (age, gender, functional competence, clinical condition, type of performed
activities, etc.) 1, 24, 25, 76.
Physical exercise programmes
Independently of individual differences, fragilities or pathologies, light to moderate
intensity exercise programmes revealed to be effective in the prevention of falls and
their consequences. Tai-chi, step, strength, agility, stretching, and multi modal training,
or adhesion to specific programs of exercise directed to prevent falls have reduced fall
events, falls injuries and also fear of falling 1, 41, 47, 50, 78-85. Exercise may prevent falls
and their consequences either in healthy old people or in elderly people with medical
conditions like osteoporosis, Parkinson, diabetes, physical or visual impairment and
even after a stroke 37, 82, 86-91.
Maintenance or recovery of the elderly physical functionality through such exercise
programmes 57, 83, 85, 92-96, besides decreasing falls rate and its consequences 97-100,
contribute to improving the quality of life 101. To be effective, these programmes,
performed on a daily basis, have to be focussed on functional capacities, such as
coordination, agility, balance, mobility, muscular strength and flexibility 23, 52, 53, 72, 77,
102-105. They should also include multi-sensorial training 50, 106, as well as exercises like
walking, stepping up or downstairs carrying objects 41, 50, 95. Training programmes

Chapter 2
Role of physical activity in the prevention of falls and their consequences in the elderly
37
aiming to improve weight-bearing bones and muscles, can also improve functionality,
reduce fall severity and even lower the mortality rate 107-111.
Regarding the bone health, increase of bone strength during pre-puberty and adolescent
years is fundamental for the prevention of osteoporosis and related fractures in older
people 45, 112. Mechanical loading such as high-impact and resistance exercise enhances
peak bone mass during growing years and prevents bone loss during aging throughout
bone formation stimulation 35, 40, 108, 109. Recently, the use of high-frequency vibratory
platforms has showed significant increase of bone mineral at hip level associated with
an improvement of balance 113. These exercise programmes need to be long-term
projects as any interruption will induce a reversibility of the benefits in health and
function, especially at muscle and skeleton level 98, 108, 114, 115. Moreover, decreases in
physical performance associated with the lack of activity in the elderly are associated
with dependence and the incapacity to perform daily tasks 116.
As it has been exposed, studies suggest that moderate level of physical activity can
reduce the risk of falls and prevent their consequences like fractures and other
injuries 117, 118. Even light or vigorous exercise can produce health benefits 95, 98.
However there are no guidelines for exercise prescription, namely the optimal intensity
and amount of activity necessary to prevent falls. “ Staying Active - Staying Safe” 119
does not mean the grater the amount of physical activity the better. In fact, several
authors exposed that either inactivity or excessive physical activity may conduce to the
occurrence of falls events, particularly when heavy tasks are involved 120, 121. The higher
rate of falls associated to inactivity seems to be due to the usual function decline of
sedentary elderly people 40, 82, 122, 123. The higher rate of falls associated to excessive
physical activity may be due to the fact that people falls when they are moving,
especially performing heavy tasks in a non-controlled environment, and then the
probability of the occurrence of an accidental fall is amplified 124
Multi-disciplinary programmes
In addition to the evidence that interventions centred on physical exercise are beneficial,
literature also reveals the importance of multifaceted intervention in the prevention of
falls and consequent fractures 1, 24, 54, 125. Besides exercise, prevention programmes must
include strategies to improve cognition, especially the capacity to perform dual task
Chapter 2
Role of physical activity in the prevention of falls and their consequences in the elderly
38
walking, to ensure appropriate nutrition, particularly ingestion of calcium and vitamin
D, and when appropriate, to change prescription of drugs with possible negative
secondary effects. Home assessment performed by specialized personnel and continuous
counselling about safety conditions in the house and its accesses are also recommended.
Such work has to be performed in close consultation with the subjects and in their local
environment 39, 42, 125-130.
It is not yet clear, which is the most valuable component in a multifactorial intervention
programme. However, prevention programmes have already been implemented and are
providing effective results 48, 53, 85, 131-134. Despite, a universally successful prevention
strategy is not applicable because falling and consequent fractures depend on each
faller 24, preventive measures need to be implemented systematically and performed on
a large scale 135-137.
CONCLUSION
For the elderly, falls and fear of falling induce loss of autonomy and reduce the quality
of life. Aside from the financial costs, falls cause both physical and psychological
suffering. Risk factors for falling are multiple and well documented, as are their
consequences. Most risk factors are due to normal aging processes and can be
attenuated or eliminated. Others are intractable which means that the elderly must
simply learn to live with them.
Physical exercise should be part of a multidisciplinary strategy to prevent falls and their
consequences to maximize intervention benefits. Although risk factors for falling have
been accurately defined and some management strategies studied and, in some cases,
implemented, most approaches lack continuity. What remains are the policies to raise
awareness and promote the widespread, systematic implementation of comprehensive
prevention programmes.
Chapter 2
Role of physical activity in the prevention of falls and their consequences in the elderly
39
REFERENCES
1. Tinetti M, Baker D, MacAvay G, Claus E, Garrett P, Gottschalk M et al. A multifactorial intervention to reduce the risk of falling among elderly people living in the community. N Engl J Med 1994;331(13):821-7. 2. Prudham D, Evans JG. Factors associated with falls in the elderly: a community study. Age Ageing 1981;10(3):141-6. 3. Friedenberg R. Longevity. Radiology 2002;223:597-601. 4. INE. Dia internacional do idoso. Destaque Informação à Comunicação Social 2005:1-6. 5. Lubitz J, Cai L, Kramarow E, Lentzner H. Health, life expectancy and health care spending among the elderly. N Engl J Med. 2003;349(11):1048-55. 6. Kannus P, Parkkari J, Koskimen S, Niemi S, Palvanem M, Jarvinem M et al. Fall-induced injuries and deaths among older adults. JAMA 1999;281:1895-9. 7. Tinetti M, Speechley M. Prevention of falls among elderly. N Engl J Med 1989;320(16):1055-9. 8. Kannus P, Niemi S, Palvanem M, Parkkari J. Rising incidence of fall-induced injuries among elderly adults. J Public Health 2005;13:212-5. 9. Fried LF, Biggs ML, Shlipak MG, Seliger S, Kestenbaum B, Stehman-Breen C et al. Association of kidney function with incident hip fracture in older adults. J Am Soc Nephrol 2007;18(1):282-6. 10. Robbins JA, Biggs ML, Cauley J. Adjusted mortality after hip fracture: From the cardiovascular health study. J Am Geriatr Soc 2006;54(12):1885-91. 11. Donald I, Bulpitt C. The prognosis of falls in elderly people living at home. Age Ageing 1999;28:121-5. 12. Rubenstein LZ, Josephson KR, Robbins AS. Falls in the nursing home. Ann Intern Med 1994;121(6):442-51. 13. Kempen G, Ormel J, Scaf-Klomp W, Sonderen E, Ranchor A, Sanderman R. The role of perceived control in the process of older people recovery of physical functions after fall-related injuries: a prospective study. J Gerontol B Psychol Sci Soc Sci 2003;58B(1):P35-P41. 14. Bell A, Talbot-Stern J, Hennessy A. Characteristics and outcomes of older patients presenting to the emergency department after a fall: a retrospective analysis. Med J Aust 2000;173:179-82. 15. Bruce DG, Devine A, Prince RL. Recreational physical activity levels in healthy older women: the importance of fear of falling. J Am Geriatr Soc 2002;50(1):84-9. 16. Tinetti M, Speechley M, Ginter S. Risk factor for falls among elderly living in the community. N Engl J Med 1988;319(26):1701-7. 17. Zijlstra G, Haastregt J, Eijk J, Kempen G. Evaluating an intervention to reduce fear of falling and associated activity restriction in elderly persons: design of a randomised controlled trial. BMC Public Health 2005;5(26):1-9.
Chapter 2
Role of physical activity in the prevention of falls and their consequences in the elderly
40
18. Fuzhong L, Fisher KJ, Harmer P, MacAuley E, Wilson NL. Fear of falling in elderly persons: association with falls, functional ability and quality of life. J Gerontol B Psychol Sci Soc Sci 2003;58B(5):P283-P90. 19. Lenze EJ, Munin MC, Skidmore ER, Amanda Dew M, Rogers JC, Whyte EM et al. Onset of depression in elderly persons after hip fracture: implications for prevention and early intervention of late-life depression. J Am Geriatr Soc 2007;55(1):81-6. 20. Oude Voshaar RC, Banerjee S, Horan M, Baldwin R, Pendleton N, Proctor R et al. Fear of falling more important than pain and depression for functional recovery after surgery for hip fracture in older people. Psychol Med 2006;36(11):1635-45. 21. Arfken CL, Lach HW, Birge SJ, Miller JP. The prevalence and correlates of fear of falling in elderly persons living in the community. Am J Public Health 1994;84(4):565-70. 22. Fuzhong L, McAuley E, Fisher KJ, Harmer P, Chaumeton N, Wilson NL. Self-efficacy as a mediator between fear of falling and functional ability in the elderly. J Aging Health 2002;14(4):452-66. 23. Woolley SM, Czaja SJ, Drury CG. An assessment of falls in elderly men and women. J Gerontol A Biol Sci Med Sci 1997;52(2):M80-7. 24. Hogan DB, MacDonald FA, Betts J, Bricker S, Ebly EM, Delarue B et al. A randomized controlled trial of a community-based consultation service to prevent falls. CMAJ 2001;165(5):537-43. 25. Oliver D, Britton M, Seed P, Martin F, Hopper A. Development and evaluation of evidence based risk assessment tool (stratify) to predict which elderly inpatients will fall: Case-control and cohort studies. BMJ 1997;315:1049-53. 26. Geraets WG, Van der Stelt PF, Lips P, Van Ginkel FC. The radiographic trabecular pattern of hips in patients with hip fractures and in elderly control subjects. Bone 1998;22(2):165-73. 27. Lips P. Prevention of hip fractures: drug therapy. Bone 1996;18(3 Suppl):159S-63S. 28. Lips P, Obrant KJ. The pathogenesis and treatment of hip fractures. Osteoporos Int 1991;1(4):218-31. 29. Cooper C, Barker D. Risk factors for hip fracture. N Engl J Med 1995;332(12):814-5. 30. Pluijm S. Predictors and consequences of falls and fractures in the elderly. Amsterdam: Vrije Universiteit; 2001. 31. Augat P, Schorlemmer S. The role of cortical bone and its microstructure in bone strength. Age Ageing 2006;35 Suppl 2:ii27-ii31. 32. Melton L, Riggs B. Risk Factors for Injury After a Fall. Clin Geriatr Med 1985;1:525-39. 33. Pickett W, Hartling L, Brison RJ. A population-based study of hospitalised injuries in Kingston, Ontario, identified via the Canadian Hospitals Injury Reporting and Prevention Program. Chronic Dis Can 1997;18(2):61-9. 34. Palvanem M, Kannus P, Parkkari J, Pitkajarvi T, Pasanen M, Vuori I et al. The injury mechanisms of osteoporotic upper extremity fractures among older adults: a
Chapter 2
Role of physical activity in the prevention of falls and their consequences in the elderly
41
controlled study of 287 consecutive patients and their 108 controls. Osteoporos Int 2000;11:822-31. 35. Kannus P, Palvanem M, Niemi S, Parkkari J, Jarvinem M. Epidemiology of osteoporotic pelvic fractures in elderly people in Finland: Sharp Increase in 1970-1997 and alarming projections for the new millennium. Osteoporos Int 2000;11:443-8. 36. Kannus P, Palvanem M, Niemi S, Parkkari J, Jarvinem M. Increasing number and incidence of low-trauma ankle factures in elderly people: finish statistics during 1970-2000 and projections for the future. Bone 2002;31:430-3. 37. O’Neill T, Lunt M, Silman A, Felsenberg D, Benevolenskaya L, Bhalla A et al. The relationship between bone density and incident vertebral fracture in men and women. J Bone Miner Res 2002;17(12):2214-21. 38. Peel NM, Kassulke DJ, McClure RJ. Population based study of hospitalised fall related injuries in older people. Inj Prev 2002;8(4):280-3. 39. Bae JM, Koo HW, Jung KO, Park BJ. A cohort study on the association between psychotropics and hip fracture in Korean elderly women. J Korean Med Sci 2002;17(1):65-70. 40. Neville C, Murray L, Boreham C, Gallagher A, Twisk J, Robson P et al. Relationship between physical activity and bone mineral status in young adults: the Northern Ireland Young Hearts Project. Bone 2002;30(5):792-8. 41. Alexander NB, Goldberg A. Clinical gait and stepping performance measures in older adults. Eur Rev Aging Phys Act 2006;3:20-8. 42. Hollman JH, Kovash FM, Kubik JJ, Linbo RA. Age-related differences in spatiotemporal markers of gait stability during dual task walking. Gait Posture 2007;26(1):113-9. 43. Hundrup YA, Ekholm O, Hoidrup S, Davidsen M, Obel EB. Risk factors for hip fracture and a possible effect modification by hormone replacement therapy. The Danish nurse cohort study. Eur J Epidemiol 2005;20(10):871-7. 44. Johnston CC, Jr., Slemenda CW. Determinants of peak bone mass. Osteoporos Int 1993;3 Suppl 1:54-5. 45. Johnston CC, Jr., Slemenda CW. Peak bone mass, bone loss and risk of fracture. Osteoporos Int 1994;4 Suppl 1:43-5. 46. Kanis J. Osteoporosis III: diagnostic of osteoporosis and assessment of fracture risk. Lancet 2002;359(9321):1929-36. 47. Madureira MM, Takayama L, Gallinaro AL, Caparbo VF, Costa RA, Pereira RM. Balance training program is highly effective in improving functional status and reducing the risk of falls in elderly women with osteoporosis: a randomized controlled trial. Osteoporos Int 2007;18(4):419-25. 48. Peel NM, McClure RJ, Hendrikz JK. Health-protective behaviours and risk of fall-related hip fractures: a population-based case-control study. Age Ageing 2006;35(5):491-7. 49. Riggs B, Khosla S, Melton L. Sex steroids and the construction and conservation of the adult skeleton. Endocr Rev 2002;23(3):279-302.

Chapter 2
Role of physical activity in the prevention of falls and their consequences in the elderly
42
50. Rose D. Promoting functional independence among "at risk" and physical frail older adults through community-based fall-risk-reduction programs. J Aging Phys Act 2002;10:207-25. 51. Sato Y, Honda Y, Kunoh K, Oizumi K. Long-term oral anticoagulation reduces bone mass in patients with previous hemispheric infarction and nonrheumatic atrial fibrillation. Stroke 1997;28:2390-4. 52. Rogers ME, Fernandez JE, Bohlken RM. Training to reduce postural sway and increase functional reach in the elderly. J Occup Rehabil 2001;11(4):291-8. 53. Rogers ME, Rogers NL, Chaparro BS, Stumpfhauser L, Halcomb CG. Effects of modular course training on mobility in older adults aged 79-90 years. Disabil Rehabil 2003;25(4-5):213-7. 54. Lundebjerg N. Guideline for the prevention of falls in older persons. J Am Geriatr Soc 2001;49(5):664-72. 55. Bath P, Morgan K. Differential risk profiles for indoor and outdoor falls in older people living in home in Nottingham, UK. Eur J Epidemiol 1999;15:65-73. 56. Woolf AD, Akesson K. Preventing fractures in elderly people. Bmj 2003;327(7406):89-95. 57. Herala M, Kivela SL, Honkanen R, Koski K, Laippala P, Luukinen H. Recent decline in heavy outdoor work activity predicts occurrence of fractures among the home-dwelling elderly. Osteoporos Int 2002;13(1):42-7. 58. Marks R, Allegrante J, MacKenzie C, Lane J. Hip fractures among the elderly: causes consequences and control. Ageing Res Rev 2003;2(2):57-93. 59. Marshall D, Johnell O, Wedel H. Mata-analysis of how well measures of bone mineral density predict occurrence of osteoporotic fractures. BMJ 1996;312:1254-9. 60. Slemenda C. Prevention of hip fractures- risk factor modification. Am J Med 1997;103(2A):65S-71S. 61. Bell N. RANK ligand and regulation of skeletal remodelling. J Clin Invest 2003;111:1120-2. 62. Center J, Nguyen T, Sambrook P, Eisman J-. Hormonal and biochemical parameters in the determination of osteoporosis in elderly men. J Clin Endocrinol Metab 1999;84(10):3626-35. 63. Cummings S, Black D, Thompson D, Applegate W, Barrett-Connor E, Musliner T et al. Effect of alendronate on risk of fracture in women with low bone density but without vertebral fractures. JAMA 1998;280:2077-82. 64. Dempster P, Aitkens S. A new air displacement method for the determination of human body composition. Med Sci Sports Exerc 1995;27(12):1692-7. 65. Riggs BL, Khosla S, Melton LJ, 3rd. Sex steroids and the construction and conservation of the adult skeleton. Endocr Rev 2002;23(3):279-302. 66. Cadarette S, Jaglal S, Kreiger N, McIsaac W, Darlington G, Tu J. Development and validation of the Osteoporosis Risk Assessment Instrument to facilitate selection of women for bone densitometry. CMAJ 2000;162(9):1289-94.

Chapter 2
Role of physical activity in the prevention of falls and their consequences in the elderly
43
67. International Society for Clinical Densitometry. Official positions of the International Society for Clinical Densitometry 2007 [25 July 2007]. Available from URL: http://www.ISCD.org. 68. Brown J, Josse R. 2002 clinical practice guidelines for the diagnosis and management of osteoporosis in Canada. CMAJ 2002;12(167):S1-S34. 69. Cummings S, M.D., Nevitt M, Browner W, Stone K, Fox K, Ensrud K et al. Research Group Risk Factors for Hip Fracture in White Women. N Engl J Med 1995;332(12):767-74. 70. Tinetti M, Doucette H, Claus E. The contributions of predisposing and situational risk factors serious fall injuries. J Am Geriatr Soc 1995;43(11):1207-13. 71. Day L, Fildes B, Gordon I, Fitzharris M, Flamer H, Lord S. Randomised Factorial Trial of Falls Prevention Among Older People Living in Their Own Homes. BMJ 2002;325:1-6. 72. Rogers ME, Rogers NL, Takeshima N, Islam MM. Methods to assess and improve the physical parameters associated with fall risk in older adults. Prev Med 2003;36(3):255-64. 73. Braun B. Knowledge and perception of fall-related risk factors and fall-reduction techniques among community-dwelling elderly individuals. Phys Ther 1998;78(12):1262-76. 74. Cavanillas A, Ruiz F, Alonso C, Garcia M, Vargas R. : Factores de riesgo de caídas en una población institucionalizada. Estudio de cohortes prospectivo. Med Clin 1999;112(1):10-5. 75. Ferrucci L, Bandinelli S, Cavazzini C, Lauretani F, Corsi A, Bartali B et al. Neurological examination findings to predict limitations in mobility and falls in older persons without a history of neurological disease. Am J Med 2004;116(12):807-15. 76. Perell KL, Nelson A, Goldman RL, Luther SL, Prieto-Lewis N, Rubenstein LZ. Fall risk assessment measures: an analytic review. J Gerontol A Biol Sci Med Sci 2001;56(12):M761-6. 77. Stel VS, Smit JH, Pluijm SM, Lips P. Balance and mobility performance as treatable risk factors for recurrent falling in older persons. J Clin Epidemiol 2003;56(7):659-68. 78. Cumming RG. Intervention strategies and risk-factor modification for falls prevention. A review of recent intervention studies. Clin Geriatr Med 2002;18(2):175-89. 79. Bateni H, Maki BE. Assistive devices for balance and mobility: benefits, demands, and adverse consequences. Arch Phys Med Rehabil 2005;86(1):134-45. 80. Brouwer BJ, Walker C, Rydahl SJ, Culham EG. Reducing fear of falling in seniors through education and activity programs: a randomized trial. J Am Geriatr Soc 2003;51(6):829-34. 81. Cao ZB, Maeda A, Shima N, Kurata H, Nishizono H. The effect of a 12-week combined exercise intervention program on physical performance and gait kinematics in community-dwelling elderly women. J Physiol Anthropol 2007;26(3):325-32.
Chapter 2
Role of physical activity in the prevention of falls and their consequences in the elderly
44
82. Delbaere K, Bourgois J, Van Den Noortgate N, Vanderstraeten G, Willems T, Cambier D. A home-based multidimensional exercise program reduced physical impairment and fear of falling. Acta Clin Belg 2006;61(6):340-50. 83. Carter ND, Khan KM, McKay HA, Petit MA, Waterman C, Heinonen A et al. Community-based exercise program reduces risk factors for falls in 65- to 75-year-old women with osteoporosis: randomised controlled trial. CMAJ 2002;167(9):997-1004. 84. Donat H, Ozcan A. Comparison of the effectiveness of two programmes on older adults at risk of falling: unsupervised home exercise and supervised group exercise. Clin Rehabil 2007;21(3):273-83. 85. Liu-Ambrose T, Kan K, Eng J, Gillies G, Lord R, McKay H. The beneficial effects of group-based exercises on fall risk profile and physical activity persist 1 year postintervention in older women with low bone mass: follow-up after withdrawal of exercise. J Am Geriatr Soc 2005;53:1767-73. 86. La Grow SJ, Robertson MC, Campbell AJ, Clarke GA, Kerse NM. Reducing hazard related falls in people 75 years and older with significant visual impairment: how did a successful program work? Inj Prev 2006;12(5):296-301. 87. Bast BA, Greenwald BD. Preventing hip fracture after stroke. Top Stroke Rehabil 2007;14(4):67-79. 88. Richerson S, Rosendale K. Does Tai Chi improve plantar sensory ability? A pilot study. Diabetes Technol Ther 2007;9(3):276-86. 89. Beaudreuil J. [Nonpharmacological treatments for osteoporosis]. Ann Readapt Med Phys 2006;49(8):581-8. 90. Ashburn A, Fazakarley L, Ballinger C, Pickering R, McLellan LD, Fitton C. A randomised controlled trial of a home based exercise programme to reduce the risk of falling among people with Parkinson's disease. J Neurol Neurosurg Psychiatry 2007;78(7):678-84. 91. Hofbauer LC, Brueck CC, Singh SK, Dobnig H. Osteoporosis in patients with diabetes mellitus. J Bone Miner Res 2007;22(9):1317-28. 92. Ahacic K, Parker M, Thorslund M. Mobility limitations 1974-1991: period changes explaining improvement in the population. Soc Sci Med 2003;57(12):2411-22. 93. Cornillon E, Blanchon M, Ramboatsisetraina P, Braize C, Beauchet V, Dubost V et al. Impact d`un programme de prévention multidisciplinaire de la chute chez le sujet âgé autonome vivant à domicile, avec analyse avant-après des performances physiques. Ann Readapt Med Phys 2002;45(9):493-504. 94. Jones J, Rikli R. The application of Fullerton's Functional Fitness Test for older adults in a group setting. Sci Sports 2000;15:194-7. 95. Lord SR, Castell S, Corcoran J, Dayhew J, Matters B, Shan A et al. The effect of group exercise on physical functioning and falls in frail older people living in retirement villages: a randomised, controlled trial. J Am Geriatr Soc 2003;51(12):1685-92. 96. Westerterp K, Meijer E. Physical activity and parameters of aging: a physiological perspective. . J Gerontol A Bio Sci Med Sci 2001;56A:7-12. 97. Nelson ME, Rejeski WJ, Blair SN, Duncan PW, Judge JO, King AC et al. Physical activity and public health in older adults: recommendation from the American
Chapter 2
Role of physical activity in the prevention of falls and their consequences in the elderly
45
College of Sports Medicine and the American Heart Association. Circulation 2007;116(9):1094-105. 98. Boyle PA, Buchman AS, Wilson RS, Bienias JL, Bennett DA. Physical activity is associated with incident disability in community-based older persons. J Am Geriatr Soc 2007;55(2):195-201. 99. Mancini C, Williamson D, Binkin N, Michieletto F, De Giacomi GV. [Epidemiology of falls among the elderly]. Ig Sanita Pubbl 2005;61(2):117-32. 100. Fuzhong L, Fisher KJ, Harmer P, MacAuley E. Falls self-efficacy as a mediator of fear of falling in an exercise intervention for older adults. J Gerontol B Psychol Sci Soc Sci 2005;60:P34-P40. 101. Rejeski W, Mihalko S. Physical activity and quality of life in older adults. J Gerontol A Biol Sci Med Sci 2001;56A(Special Issue II):23-35. 102. Bateni H, Zecevic A, McIlroy WE, Maki BE. Resolving conflicts in task demands during balance recovery: does holding an object inhibit compensatory grasping? Exp Brain Res 2004;157(1):49-58. 103. Galvão A, Taaffe D. Resistance exercise dosage in older adults: single - versus multiset effects on physical performance and body composition. JAGS 2005;53:2090-7. 104. Holland G, Tanaka K, Shigematsu R, Nakagaichi M. Flexibility and Physical Functions of Older Adults: A Review. J Aging Phys Act 2002;10:169-206. 105. Sinaki M, Itoi E, Wahner H, Wollan P, Gelzcer R, Mullan B et al. Stronger back muscles reduce the incidence of vertebral fractures: a prospective 10 years follow-up of postmenopausal women. Bone 2002;30(6):836-41. 106. Islam M, Nasu E, Rogers M, Koizumi D, Rogers N, Takeshima N. Effects of combined sensory and muscular training on balance in Japanese older adults. Prev Med 2004. 107. Goodpaster BH, Park SW, Harris TB, Kritchevsky SB, Nevitt M, Schwartz AV et al. The loss of skeletal muscle strength, mass, and quality in older adults: the health, aging and body composition study. J Gerontol A Biol Sci Med Sci 2006;61(10):1059-64. 108. Kontulainen S, Heinonen A, Kannus P, Pasanen M, Sievanen H, Vuori I. Former exercisers of an 18-month intervention display residual a BMD benefits compared with control women 3,5 years post-intervention: a follow-up of a randomised controlled high-impact trial. Osteoporos Int 2004;15. 109. Stewart K, Bacher A, Hees P, Tayback M, Ouyang P, Beur S. Exercise effects on bone mineral density. Relationships to change in fitness and fatness. Am J Prev Med 2005;28(5):453-60. 110. Janssen I, Baumgartner RN, Ross R, Rosenberg IH, Roubenoff R. Skeletal muscle cutpoints associated with elevated physical disability risk in older men and women. Am J Epidemiol 2004;159(4):413-21. 111. Buchman AS, Wilson RS, Boyle PA, Bienias JL, Bennett DA. Change in motor function and risk of mortality in older persons. J Am Geriatr Soc 2007;55(1):11-9.
Chapter 2
Role of physical activity in the prevention of falls and their consequences in the elderly
46
112. Haapasalo H, Kannus P, Sievanen H. Development of mass density and estimated mechanical characteristics of bones in Caucasian females. J Bone Miner Res 1996;11:1751-60. 113. Gusi N, Raimundo A, Leal A. Low-frequency vibratory exercise reduces the risk of bone fracture more than walking: a randomized controlled trial. BMC Musculoskelet Disord 2006;7:92. 114. Buchman AS, Boyle PA, Wilson RS, Bienias JL, Bennett DA. Physical activity and motor decline in older persons. Muscle Nerve 2006. 115. Dipietro L. Physical activity in aging: changes in patterns and their relationship to health and function. J Gerontol A Bio Sci Med Sci 2001;56A(Special Issue II):13-22. 116. Gill T, Williams C, Leon C, Tinetti M. The role of Change in physical performance in determining risk for dependence in activities of daily living among nondisabled community-living elderly persons. J Clin Epidemiol 1997;50(7):765-72. 117. Gregg EW, Pereira MA, Caspersen CJ. Physical activity, falls, and fractures among older adults: a review of the epidemiologic evidence. J Am Geriatr Soc 2000;48(8):883-93. 118. Borer KT. Physical activity in the prevention and amelioration of osteoporosis in women: interaction of mechanical, hormonal and dietary factors. Sports Med 2005;35(9):779-830. 119. Armstrong M, Bates A, Castell S, Krolik P. Staying Active -- Staying Safe: development of a physical activity and falls prevention resource for older people who dwell in the community. N S W Public Health Bull 2002;13(1-2):13-4. 120. Chan BK, Marshall LM, Winters KM, Faulkner KA, Schwartz AV, Orwoll ES. Incident fall risk and physical activity and physical performance among older men: the Osteoporotic Fractures in Men Study. Am J Epidemiol 2007;165(6):696-703. 121. Gregg EW, Cauley JA, Seeley DG, Ensrud KE, Bauer DC. Physical activity and osteoporotic fracture risk in older women. Study of Osteoporotic Fractures Research Group. Ann Intern Med 1998;129(2):81-8. 122. Suzuki T, Kim H, Yoshida H, Ishizaki T. Randomized controlled trial of exercise intervention for the prevention of falls in community-dwelling elderly Japanese women. J Bone Miner Metab 2004;22(6):602-11. 123. Hauer K, Becker C, Lindemann U, Beyer N. Effectiveness of physical training on motor performance and fall prevention in cognitively impaired older persons: a systematic review. Am J Phys Med Rehabil 2006;85(10):847-57. 124. Association of Emergency Medical Technicians ACoS. Injury Prevention. PHTLS, Basic and Advanced Prehospital Trauma Life Support. 5 ed. St. Louis, Mosby; 2003. p 10-25. 125. Feder G, Cryer C, Donovan S, Carter Y. Guidelines for the prevention of falls in people over 65. The Guidelines' Development Group. Bmj 2000;321(7267):1007-11. 126. Jackson R, Fantom J. A pilot scheme for an integrated falls prevention service. J Orthop Nurs 2002;6(4):204-10.
Chapter 2
Role of physical activity in the prevention of falls and their consequences in the elderly
47
127. Rossouw J. Risks and benefits of estrogen plus progestin in healthy postmenopausal women: principal results from the women's health initiative randomised controlled trial. JAMA 2002;288(3):321-33. 128. Yoshida K, Oida H, Kobayashi T, Maruyama T, Tanaka M, Katayama T et al. Stimulation of bone formation and prevention of bone loss by prostaglandin E EP4 receptor activation. Proc Natl Acad Sci 2002;99(7):4580-5. 129. Jensen J, Nyberg L, Gustafson Y, Lundin-Olsson L. Fall and injury prevention in residential care--effects in residents with higher and lower levels of cognition. J Am Geriatr Soc 2003;51(5):627-35. 130. Asakawa Y, Takahashi R, Endo F. [Fall prevention strategy for elderly women wishing to attend community fall prevention programs]. Nippon Ronen Igakkai Zasshi 2006;43(1):117-21. 131. Chang J, Morton S, Rubenstein L. Interventions for the prevention of falls in older adults: systematic review and meta-analysis of randomised clinical trials. BMJ 2004;326:680-3. 132. Grenier-Sennelier C, Lombard I, Jeny-Loeper C, Maillet-Gouret M, Minvielle E. Designing adverse event prevention programs using quality management methods: the case of falls I hospital. Int J Qual Health Care 2002;14:419-26. 133. Tinetti M. Preventing falls in elderly persons. N Engl J Med 2003;348(1):42-9. 134. Weir E, Culmer L. Fall prevention in the elderly population. Can Med Assoc J 2004. 135. Rubenstein LZ. Falls in older people: epidemiology, risk factors and strategies for prevention. Age Ageing 2006;35 Suppl 2:ii37-ii41. 136. Kannus P, Sievanen H, Palvanen M, Jarvinen T, Parkkari J. Prevention of falls and consequent injuries in elderly people. Lancet 2005;366(9500):1885-93. 137. Vance DE, Ball KK, Roenker DL, Wadley VG, Edwards JD, Cissell GM. Predictors of falling in older Maryland drivers: a structural-equation model. J Aging Phys Act 2006;14(3):254-69.
Chapter 3
Variation of the different attributes that support the physical function in community-dwelling older adults
48
CHAPTER 3 VARIATION OF THE DIFFERENT ATTRIBUTES THAT SUPPORT THE
PHYSICAL FUNCTION IN COMMUNITY-DWELLING OLDER ADULT S 2
_______________________________ 2 Pereira C. Baptista F. Variation of the different attributes that support the physical function in
community-dwelling older adults. J Sports Med Phys Fitness; September 2011 (in Press)
Chapter 3
Variation of the different attributes that support the physical function in community-dwelling older adults
49
ABSTRACT
Aim. This study investigated the variation with age of different attributes that support
the physical functioning in community-dwelling older adults having as reference scores
from young adults.
Methods. The study was a cross-sectional study. Participants were 559 older adults and
79 young adults grouped according to gender and age (Y:20-29, A:60-64, B:65-69,
C:70-74, D:75-79 and E:≥80 years). Strength, flexibility, agility, aerobic endurance, and
balance were evaluated by Fullerton tests.
Results. ANOVA and Bonferroni post-hoc test showed that compared to young, the 60-
64 years group showed decreased values in almost all attributes of physical function. In
older adults, additional differences were observed in females mainly between the 60-64
years group and the 70-74 years, 75-79 years, and:≥80 years groups, and in males
between the 60-64 years group and the ≥80 years group (P<0.05). Comparisons between
standardized physical function attributes (T-scores) done by repeated measures and
contrasts demonstrated that, across age groups, agility and dynamic balance showed the
highest rate loss in both genders, and lower body flexibility showed the lowest
(P<0.01).
Conclusion. Physical function reduction seems to occur earlier in women than in men
and abilities involving multiple structures such as balance, agility, and aerobic
endurance showed the most loss.
Key Words: physical function; older adults; reference scores
Running title: Physical function in old adults

Chapter 3
Variation of the different attributes that support the physical function in community-dwelling older adults
50
INTRODUCTION
Like other western countries 1, Portugal faces an aging population. In 2008, 17% of the
Portuguese population was over 65 and 4% over 80. Projections suggest that in 2060,
the corresponding numbers will be 32% and 13%, respectively 2. If this population does
not age successfully, the country will face a rapidly increasing number of people who
are less healthy and have reduced physical functioning 3, 4. Successful aging means
maintaining high physical and cognitive function, and low health risk thereby enabling
subjects to live independently and participate actively in society 5, 6.
Normal aging (also called primary aging) is characterized, even in the absence of
disease, by structural and functional change (deterioration) in most physiological
systems. These processes are cumulative and inevitably have a direct impact on the
daily activities of older adults. More generally, normal aging involves complex
processes combining the primary factors just mentioned, as well as secondary and
genetic factors. Secondary factors involve chronic disease and lifestyle 7. Healthy
lifestyles may limit the development and progression of chronic diseases and
incapacitating conditions — whether physical, psychological or mental — and in so
doing, increase life expectancy and improve quality of life 8-10. While decline dominates
the clinical picture of aging, the lifestyles adopted by different population groups
determinate the variability of their aging processes. Recent European Union guidelines
promoting increased physical activity for older adults are an attempt to respond to this
problem 11.
Older adults undergoing physical function evaluation are typically told that they should
increase their level of physical activity or do specific exercises on a regular basis.
Evaluation enables health professionals to predict functional independence 12 and
diagnose disabilities, particularly subclinical functional incapacities leading to loss of
ability to perform daily tasks. Evaluation is, therefore, a critical step towards the
definition of targets and strategies for reducing and delaying physical incapacity and
associated problems 12-14.
Fullerton tests (Senior Fitness Test and Fullerton Advanced Balance Scale) can be
conducted almost anywhere to quickly determinate a person’s ability to perform daily
tasks safely and independently. Because these tests are easy to perform and inexpensive,
they are among the most popular physical function evaluation tests 15-17. The results of
Chapter 3
Variation of the different attributes that support the physical function in community-dwelling older adults
51
Senior Fitness Test are usually compared with normative scores for US residents of the
same age group and gender 17, 18. On this basis, a reasonable result for a specific
attribute — for example a lower-limb strength score for a 70-year-old woman that is in
the 50th percentile — may nevertheless compromise her ability to perform daily tasks.
Compared with values for young adults, this same result, probably, will be associated
with a high loss of lower-limb strength. It may be more useful to standardize the results
of tests performed by older adults using reference scores for young adults aged 20-29
years, i.e., the age range corresponding to peak physical function 19. Using this
approach, one can identify, quantify, and compare possible losses of different attributes
to predict physical functioning. Evaluation of the risk of loss of physical functioning is
determined by the distance in standard deviations between each attribute score and the
corresponding mean value for young adults. This method of analysis has been used in
clinical research and practice to diagnose osteoporosis in postmenopausal women and
men over 50 on the basis of bone densitometry 20-22. The aim of this study is to compare
the variation of physical attributes used to determinate physical functioning in active
community-residing older women and men as a function of age with scores for young
adults as reference.
MATERIALS AND METHODS
Participants
The participants were 559 community-dwelling elderly, showing autonomy levels that
allow them to live independently in their own home, and 79 young adults. The elderly
group consisted of 422 women (69.2±5.8 years) and 137 men (70.2±6.0 years) aged 60
to 87 years who participated at least twice a week in a supervised exercise program (tai-
chi, hydrogymnastics, step, weight resistance and aerobics) in the previous year. The
young adult group consisted of 50 women and 29 men aged 20 to 28 years, 61% of
whom exercised regularly. The elderly participants were recruited in community
institutions that promote supervised exercise programs. The young participants were
university students majoring in sport sciences, veterinary medicine, and literature
college, or recent former students. All participation was voluntary and all provided
informed consent. No one had suffered a recent episode of illness that would have
Chapter 3
Variation of the different attributes that support the physical function in community-dwelling older adults
52
caused a temporary decrease of physical function. Sixteen volunteers were excluded
because they did not meet these criteria. Participants were separated into the following
six age groups: 20 to 29 (Y), 60 to 64 (A), 65 to 69 (B), 70 to 74 (C), 74 to 79 (D) and
≥80 (E). This grouping followed similar age organization used to describe normative
values of physical function in the elderly population in the United States 17. The
University’s Ethics Committee approved this study.
Measures and data collection
Physical function and body composition
Lower and upper body strength, lower and upper body flexibility, agility and dynamic
balance, and aerobic endurance were evaluated by the Fullerton Senior Fitness Tests.
These six attributes were assessed, respectively, by the following item tests: 1) 30-s
chair stand (rep); 2) arm curl (rep); 3) chair sit-and-reach (cm); 4) back scratch (cm); 5)
8 ft up-and-go (sec); and 6) 6-min walk (m). This battery of tests has been validated for
the evaluation of community-dwelling older adults 14, 15.
Multidimensional balance was assessed by the Fullerton Advanced Balance Scale,
which consists of 10 item tests designed to measure higher-functioning older adults.
These 10 item tests include a combination of static and dynamic balance activities
performed in different sensory environments. The tests are the following: 1) stand with
feet together, eyes closed; 2) reach forward to object; 3) turn in a full circle; 4) step up
and over; 5) tandem walk; 6) stand on one leg; 7) stand on foam, eyes closed; 8) two-
footed jump; 9) walk with head turns; and 10) reactive postural control. The 10 tests
were scored according to an ordinal scale going from 0 (worst) to 4 (best). The final
score is the sum of the points obtained in each one of the item tests and goes from 0 to
40 16.
The results of the lower and upper body strength and flexibility, agility and dynamic
balance and aerobic endurance were expressed in absolute and standardized values.
Standardized values, designated as T-scores, were calculated for each gender separately.
The T-score indicates the number of SD above or below the young adult average value
(male or female) for each elderly participant 20. The agility T-score was multiplied by
(-1) because, contrary to the other attributes, a higher result is associated with a poor
Chapter 3
Variation of the different attributes that support the physical function in community-dwelling older adults
53
performance. A multidimensional balance T-score was not calculated because there is a
reference value (maximum:40).
Additionally, body fat mass (%) was evaluated by bioimpedance using a HBF-306C,
waist circumference (cm) was measured at the navel level using a measuring tape, body
weight was measured on an electronic scale (Secca Bella 840), and standing height was
measured on a stadiometer (Secca 770). The body mass index (BMI) was calculated as
body weight in kilograms divided by the square of the height in meters (kg.m-2).
Physical function and body composition measurements were performed by a team of
qualified technical personnel, who received common training in order to standardize
procedures and assessment protocols.
Health, physical impairments, education and physical activity
Level of education, number of prescribed medications drug and physical impairments
were evaluated by questionnaires administered by an interviewer. Physical impairments
included the following: urinary incontinence, habitual dizziness, feet problems (e.g.,
sores, corns, skewed toes, amputation of toes or foot, insufficient muscle function), poor
vision (not recognizing someone’s face at a distance of four meters with glasses or
contact lenses), hearing problems (not able to follow a conversation in a group of four
people with a hearing aid), and balance problems (occasional loss of balance) 23.
Physical activity was assessed by using the short form of the International Physical
Activity Questionnaire (IPAQ) 24. Physical activity was expressed as the sum of
metabolic expenditure (MET-min/wk) spent on walking moderate and vigorous-
intensity activity, for periods of at least 10 minutes.
Statistical analysis
Statistical analysis was performed with SPSS version 16.0. ANOVA and Bonferroni
post hoc test were used to compare general characteristics (age, body composition,
health, education, and physical activity) and physical function attributes among age
groups (or Kruskal Wallis and Dunnett C post-hoc test in the case of no
homoscedasticity). The comparisons of these variables between genders in all age
groups were analyzed by independent sample t-tests. Comparisons between

Chapter 3
Variation of the different attributes that support the physical function in community-dwelling older adults
54
standardized physical function attributes (T-scores) in each gender and age group were
done by repeated measures and contrasts. Data were expressed as mean ± standard
deviations. Statistical significance was considered for a P<0.05.
RESULTS
Characteristics of the sample are presented in Table 1. Compared with young adults,
older adults had less education and higher body weight, BMI, body fat mass, and waist
circumference. They also had more physical impairments and took more medication.
Regarding body composition, at 60-64 years old, an increase in BMI was observed in
women (+6.4 kg/m2, P<0.001) and in men (+5.8 kg/m2, P<0.001), in waist
circumference in women (+ 18.4 cm, P<0.001) and in men (+ 22.3 cm, P<0.001) and in
body fat mass in women (+ 17.0%, P<0.001) and in men (+ 15.4%, P<0.001). After this
age, no BMI or waist circumference difference was observed between older groups;
body fat mass percentage was higher for women after 65 years old than from 60-64
years old. In the older age categories, only physical impairments and education reported
differences between genders (women have +0.6 physical impairments than men in the
65-69 group and +0.8 in the 75-79 group, and were -2.8 years of education than men in
the 60-64 group, P<0.05). Physical activity was similar among age and genders groups.
The exception were young and older men, where the young group reported to be more
active than the 75-79 group (+2287 MET-min/wk) and the ≥ 80 group (+2239 MET-
min/wk), and, in age of 75-79 years, where women reported to be more active than men
(+914 MET-min/wk), P<0.05. Furthermore, there were no differences between age
groups in the number of prescribed medication drugs, physical impairments, and
education level.
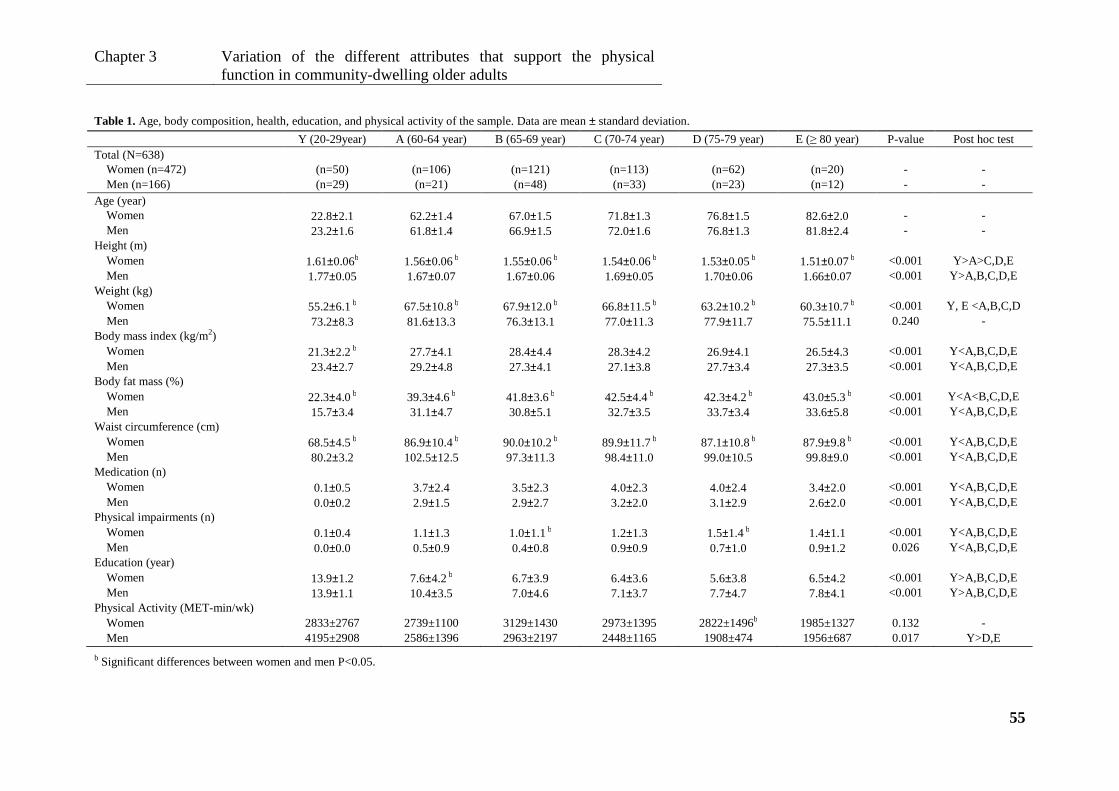
Chapter 3
Variation of the different attributes that support the physical function in community-dwelling older adults
55
Table 1. Age, body composition, health, education, and physical activity of the sample. Data are mean ± standard deviation.
Y (20-29year) A (60-64 year) B (65-69 year) C (70-74 year) D (75-79 year) E (≥ 80 year) P-value Post hoc test Total (N=638)
Women (n=472) (n=50) (n=106) (n=121) (n=113) (n=62) (n=20) - - Men (n=166) (n=29) (n=21) (n=48) (n=33) (n=23) (n=12) - -
Age (year) Women 22.8±2.1 62.2±1.4 67.0±1.5 71.8±1.3 76.8±1.5 82.6±2.0 - - Men 23.2±1.6 61.8±1.4 66.9±1.5 72.0±1.6 76.8±1.3 81.8±2.4 - -
Height (m) Women 1.61±0.06b 1.56±0.06 b 1.55±0.06 b 1.54±0.06 b 1.53±0.05 b 1.51±0.07 b <0.001 Y>A>C,D,E Men 1.77±0.05 1.67±0.07 1.67±0.06 1.69±0.05 1.70±0.06 1.66±0.07 <0.001 Y>A,B,C,D,E
Weight (kg) Women 55.2±6.1 b 67.5±10.8 b 67.9±12.0 b 66.8±11.5 b 63.2±10.2 b 60.3±10.7 b <0.001 Y, E <A,B,C,D Men 73.2±8.3 81.6±13.3 76.3±13.1 77.0±11.3 77.9±11.7 75.5±11.1 0.240 -
Body mass index (kg/m2) Women 21.3±2.2 b 27.7±4.1 28.4±4.4 28.3±4.2 26.9±4.1 26.5±4.3 <0.001 Y<A,B,C,D,E Men 23.4±2.7 29.2±4.8 27.3±4.1 27.1±3.8 27.7±3.4 27.3±3.5 <0.001 Y<A,B,C,D,E
Body fat mass (%) Women 22.3±4.0 b 39.3±4.6 b 41.8±3.6 b 42.5±4.4 b 42.3±4.2 b 43.0±5.3 b <0.001 Y<A<B,C,D,E Men 15.7±3.4 31.1±4.7 30.8±5.1 32.7±3.5 33.7±3.4 33.6±5.8 <0.001 Y<A,B,C,D,E
Waist circumference (cm) Women 68.5±4.5 b 86.9±10.4 b 90.0±10.2 b 89.9±11.7 b 87.1±10.8 b 87.9±9.8 b <0.001 Y<A,B,C,D,E Men 80.2±3.2 102.5±12.5 97.3±11.3 98.4±11.0 99.0±10.5 99.8±9.0 <0.001 Y<A,B,C,D,E
Medication (n) Women 0.1±0.5 3.7±2.4 3.5±2.3 4.0±2.3 4.0±2.4 3.4±2.0 <0.001 Y<A,B,C,D,E Men 0.0±0.2 2.9±1.5 2.9±2.7 3.2±2.0 3.1±2.9 2.6±2.0 <0.001 Y<A,B,C,D,E
Physical impairments (n) Women 0.1±0.4 1.1±1.3 1.0±1.1 b 1.2±1.3 1.5±1.4 b 1.4±1.1 <0.001 Y<A,B,C,D,E Men 0.0±0.0 0.5±0.9 0.4±0.8 0.9±0.9 0.7±1.0 0.9±1.2 0.026 Y<A,B,C,D,E
Education (year) Women 13.9±1.2 7.6±4.2 b 6.7±3.9 6.4±3.6 5.6±3.8 6.5±4.2 <0.001 Y>A,B,C,D,E Men 13.9±1.1 10.4±3.5 7.0±4.6 7.1±3.7 7.7±4.7 7.8±4.1 <0.001 Y>A,B,C,D,E
Physical Activity (MET-min/wk) Women 2833±2767 2739±1100 3129±1430 2973±1395 2822±1496b 1985±1327 0.132 - Men 4195±2908 2586±1396 2963±2197 2448±1165 1908±474 1956±687 0.017 Y>D,E
b Significant differences between women and men P<0.05.
Chapter 3
Variation of the different attributes that support the physical function in community-dwelling older adults
56
Table 2 shows the comparison of the physical function attributes among age groups
with descriptive data expressed in absolute scores. The same data expressed in
standardized scores (having young adult as reference group) is presented in Figure 1.
Considering absolute and standardized scores, it was verified that at the 60-64 age
group, all physical attributes decreased, except aerobic endurance in men, which was
only significantly reduced at 65-69 year old (-121 m, P<0.001, -2.0±1.3 SD). After that,
an additional decrease was observed in women at the 70-74 year age group in lower
body flexibility (-12.0 cm, -1.2±0.9 SD, P<0.001), agility and dynamic balance (2.1 sec,
-7.1±5.8 SD, P<0.001), aerobic endurance (-151.4 m, -3.1±1.6 SD, P<0.001), and
multidimensional balance (-8.2 points, p <0.001) and after the age of 79 in lower body
strength (-11.3 rep, -2.7±0.9 SD, P<0.001) and upper body flexibility (-19.5 cm, -
3.6±2.3 SD, P=0.002). In men, an additional reduction only occurred after 79 year old
in lower body strength (-12.8 rep,-3.6 SD, P=0.025), agility and dynamic balance (2.8
sec, -9.2±3.8 SD, P=0.004), aerobic endurance (-226.8 m, -4.3±1.6 SD, P=0.005), and
multidimensional balance (-8.0 points, P=0.005). There were no differences among
groups of elderly women in upper body strength, and among groups of elderly men in
upper body strength, and lower and upper body flexibility.
Comparison between women and men in the 20-29 age group showed differences in all
physical attributes except in multidimensional balance, in which both genders obtained
the maximum score (40). Women presented higher values in flexibility, while men
presented higher values in all other physical attributes. Physical function differences
between women and men progressively diminished with age. After the age of 79, only
multidimensional balance was 5.2 points higher in men than in women (P=0.006).
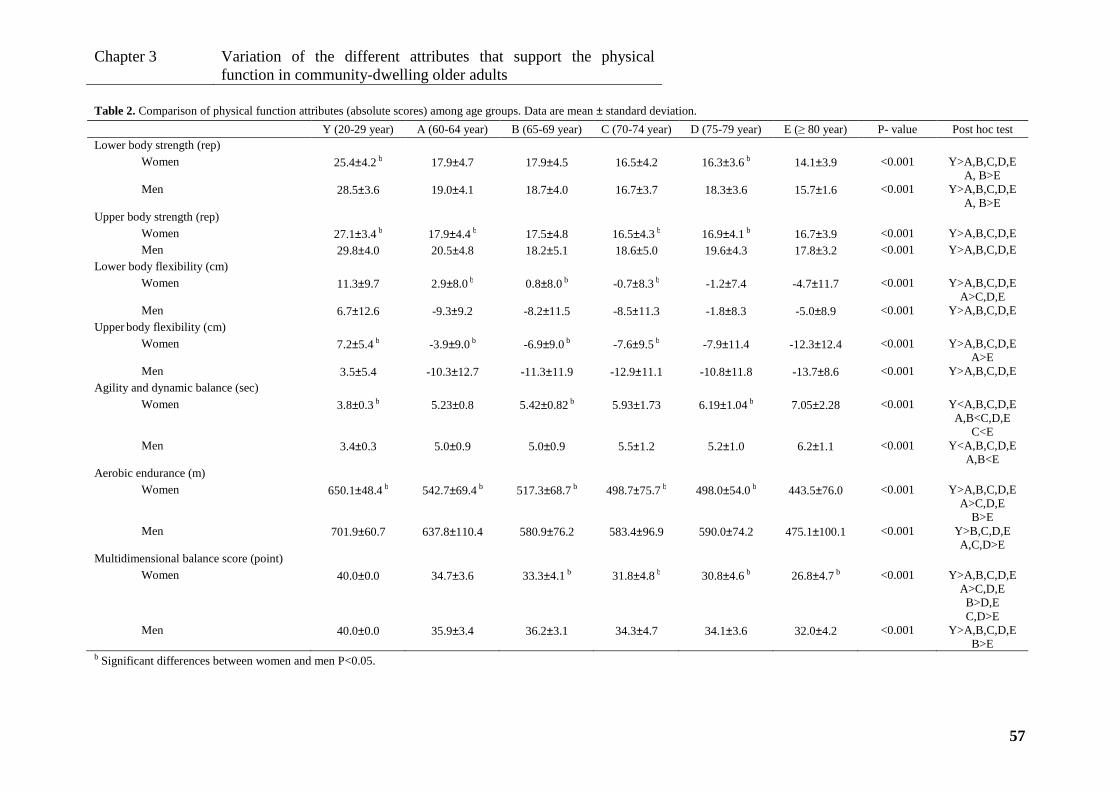
Chapter 3
Variation of the different attributes that support the physical function in community-dwelling older adults
57
Table 2. Comparison of physical function attributes (absolute scores) among age groups. Data are mean ± standard deviation.
Y (20-29 year) A (60-64 year) B (65-69 year) C (70-74 year) D (75-79 year) E (≥ 80 year) P- value Post hoc test Lower body strength (rep)
Women 25.4±4.2 b 17.9±4.7 17.9±4.5 16.5±4.2 16.3±3.6 b 14.1±3.9 <0.001 Y>A,B,C,D,E A, B>E
Men 28.5±3.6 19.0±4.1 18.7±4.0 16.7±3.7 18.3±3.6 15.7±1.6 <0.001 Y>A,B,C,D,E A, B>E
Upper body strength (rep) Women 27.1±3.4 b 17.9±4.4 b 17.5±4.8 16.5±4.3 b 16.9±4.1 b 16.7±3.9 <0.001 Y>A,B,C,D,E Men 29.8±4.0 20.5±4.8 18.2±5.1 18.6±5.0 19.6±4.3 17.8±3.2 <0.001 Y>A,B,C,D,E
Lower body flexibility (cm) Women 11.3±9.7 2.9±8.0 b 0.8±8.0 b -0.7±8.3 b -1.2±7.4 -4.7±11.7 <0.001 Y>A,B,C,D,E
A>C,D,E Men 6.7±12.6 -9.3±9.2 -8.2±11.5 -8.5±11.3 -1.8±8.3 -5.0±8.9 <0.001 Y>A,B,C,D,E
Upper body flexibility (cm) Women 7.2±5.4 b -3.9±9.0 b -6.9±9.0 b -7.6±9.5 b -7.9±11.4 -12.3±12.4 <0.001 Y>A,B,C,D,E
A>E Men 3.5±5.4 -10.3±12.7 -11.3±11.9 -12.9±11.1 -10.8±11.8 -13.7±8.6 <0.001 Y>A,B,C,D,E
Agility and dynamic balance (sec) Women 3.8±0.3 b 5.23±0.8 5.42±0.82 b 5.93±1.73 6.19±1.04 b 7.05±2.28 <0.001 Y<A,B,C,D,E
A,B<C,D,E C<E
Men 3.4±0.3 5.0±0.9 5.0±0.9 5.5±1.2 5.2±1.0 6.2±1.1 <0.001 Y<A,B,C,D,E A,B<E
Aerobic endurance (m) Women 650.1±48.4 b 542.7±69.4 b 517.3±68.7 b 498.7±75.7 b 498.0±54.0 b 443.5±76.0 <0.001 Y>A,B,C,D,E
A>C,D,E B>E
Men 701.9±60.7 637.8±110.4 580.9±76.2 583.4±96.9 590.0±74.2 475.1±100.1 <0.001 Y>B,C,D,E A,C,D>E
Multidimensional balance score (point) Women 40.0±0.0 34.7±3.6 33.3±4.1 b 31.8±4.8 b 30.8±4.6 b 26.8±4.7 b <0.001 Y>A,B,C,D,E
A>C,D,E B>D,E C,D>E
Men 40.0±0.0 35.9±3.4 36.2±3.1 34.3±4.7 34.1±3.6 32.0±4.2 <0.001 Y>A,B,C,D,E B>E
b Significant differences between women and men P<0.05.

Chapter 3
Variation of the different attributes that support the physical function in community-dwelling older adults
58
Comparisons between physical attributes (T-score) according to age group in elderly
women and men are presented in Figure 1. In women aged 60-64, lower body flexibility
presented the highest T-score (-1.1±0.9 SD), followed by lower body strength (-2.0±1.0
SD), upper body flexibility (-2.6±1.8 SD), upper body strength (-2.9±1.3 SD), aerobic
endurance (-2.9±1.5 SD), and finally agility and dynamic balance (-6.3±4.4 SD), which
presented the lowest T-score and the highest rate loss (P<0.001). The same physical
attributes sequence was observed for the other female age groups. In men aged 60-64,
aerobic endurance (-1.1±1.8 SD) and lower body flexibility (-1.3±0.7 SD) presented the
highest T-scores, followed by a similar decline in upper body strength (-2.3±1.2 SD),
upper body flexibility (-2.6±2.4 SD), lower body strength (-2.6±1.1 SD), and finally
agility and dynamic balance (-5.2±3.0 SD), which presented the lowest T-score
(P<0.001). The same sequence was observed in the other male age groups, with the
exception of aerobic endurance.
DISCUSSION
The main purpose of this investigation was to analyze physical function variation in
active, community-residing older people, using scores from young adults as reference.
Multidimensional balance was the physical attribute that declined the most in old age,
particularly in women. Participants over 60 years of age showed balance losses
approaching 1.5 % in men and 3.3 % in women for every 5-year period; after 79 year of
age, losses approximated 5.3 % in men and 10 % in women. Beyond multidimensional
balance, agility and aerobic endurance also demonstrated pronounced losses across age.
Between 60 and 79 years of age, there was an agility reduction near 1 SD for each 5-
year period and near 3 SD after the age of 79 in both genders. In women, aerobic
endurance was reduced almost 0.5 SD for each 5-year period before 80, and near 1 SD
after this age. In men, the reduction only became serious after 80, with values near
2 SD.
Agility is closely associated with balance, and these abilities are usually trained and
evaluated together 25, 26. These complex functions require the central processing of
inferences from the visual, vestibular and somatosensory systems and imply the
organization of motor responses 27-29. Loss of agility and balance are linked to the
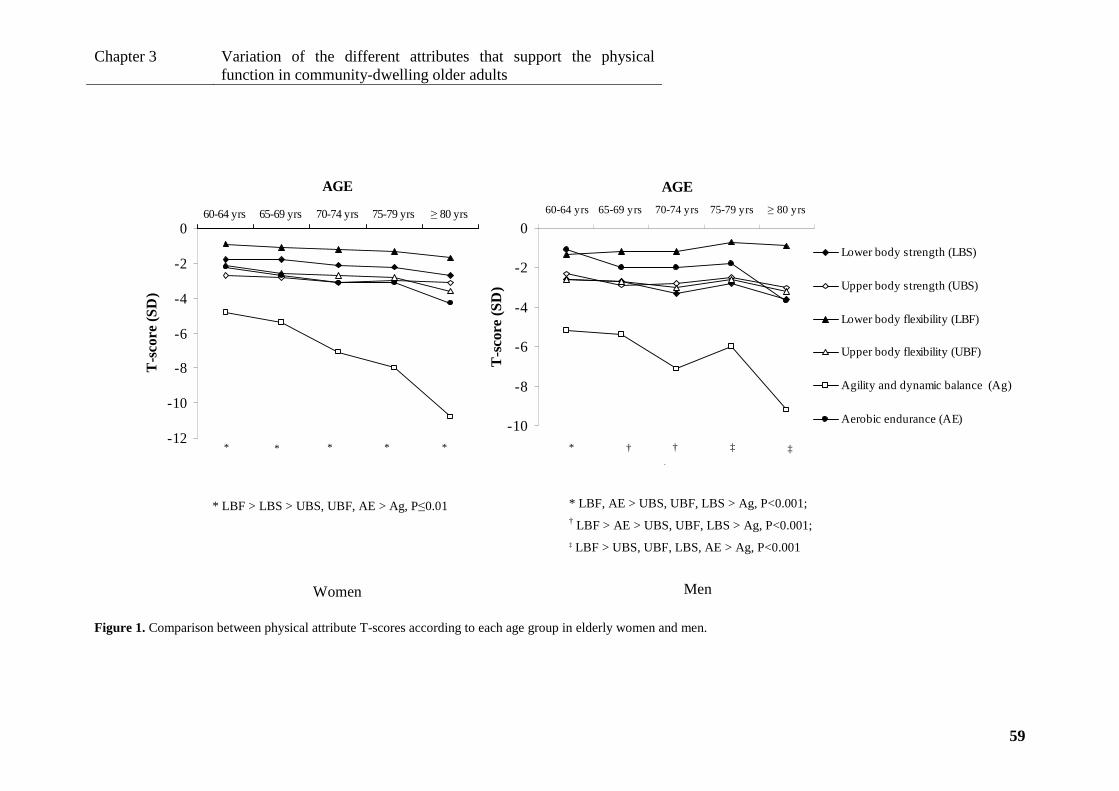
Chapter 3
Variation of the different attributes that support the physical function in community-dwelling older adults
59
-12
-10
-8
-6
-4
-2
060-64 yrs 65-69 yrs 70-74 yrs 75-79 yrs ≥ 80 yrs
AGE
T-s
core
(S
D)
Lower body strength(LBS)
Upper body strength(UBS)
Lower body flexibility(LBF)
Upper body flexibility(UBF)
Agility and dynamicbalance (Ag)
Aerobic endurance (AE)
.
* * * *†
*
-10
-8
-6
-4
-2
060-64 yrs 65-69 yrs 70-74 yrs 75-79 yrs≥ 80 yrs
AGE
T-s
core
(S
D)
Lower body strength (LBS)
Upper body strength (UBS)
Lower body flexibility (LBF)
Upper body flexibility (UBF)
Agility and dynamic balance (Ag)
Aerobic endurance (AE)
* †
† † ‡
‡
* LBF > LBS > UBS, UBF, AE > Ag, P≤0.01
Women
* LBF, AE > UBS, UBF, LBS > Ag, P<0.001; † LBF > AE > UBS, UBF, LBS > Ag, P<0.001; ‡ LBF > UBS, UBF, LBS, AE > Ag, P<0.001
Men
Figure 1. Comparison between physical attribute T-scores according to each age group in elderly women and men.
Chapter 3
Variation of the different attributes that support the physical function in community-dwelling older adults
60
deterioration of these structures, as well to the normal loss of muscular and skeletal
system function with age, 29, 30. The faster decrease reported by this study in the capacity
to perform tasks that require balance, agility, and aerobic capacity may be attributed to
the multiple structures that begin to function more poorly. Aerobic endurance decline
caused by ageing also reflects functional deterioration, ranging from the lungs to
skeletal muscle to mitochondria 31, 32.
In general, at the 60-64 year age range, flexibility and strength of the lower limbs were
the attributes that presented the lowest rate of loss. It was further observed that after this
age, the rate of loss in the lower limbs was slightly faster to that of the upper limbs.
Several studies reported increasing disability, fall occurrences, and loss of autonomy
when extremity impairment or strength losses are diagnosed, particularly in the lower
limbs 33-35. Maintaining the capacity to get out of a chair and walk is fundamental for
the maintenance of aerobic endurance, which in turn correlates with self-reported
functional ability 36, cardiovascular disease, mobility limitation, disability and
mortality 37.
Despite the analogous pattern of physical function decline seen in the Rikli and Jones
study 17, in the present investigation physical function declined earlier in women (aged
70-74) compared to men (after 79), possibly due to the combined effect of a poor body
composition and health status 10, 21. A lower education level (~7 years) in this study
compared with others with a higher level of education (~15 years), may partially explain
a less favorable score in some physical attributes of the study participants, particularly
aerobic endurance and BMI 17, 38, 39.
As already reported by others in young adults 19, flexibility was higher in women and
the remaining attributes were higher in men. Differences were also observed in all
physical function attributes between women and men until 79 year of age. After that,
there were no differences between genders, except in multidimensional balance, due to
an age-related attenuation of physical function differences and possibly also to the
sample size of the oldest groups and thus to limited statistical power. The small number
of participants in the last age group may also reflect lack of access to supervised
exercise for unhealthier and older people who are more prone to falls, more afraid of
falling, more likely to restrict their activities, less autonomous, and more dependent on
social support services 17, 38, 40.
Chapter 3
Variation of the different attributes that support the physical function in community-dwelling older adults
61
By age 60, all physical attributes were reduced significantly, except aerobic endurance
in men. During the interviews, older men reported that they walked extensively more
frequently than younger men. These results agree with several studies 16-18 that also
found a progressive loss of physical function across age. In the elderly, the most
accentuated losses occurred after the age of 79. While all these losses have been
interpreted as naturally attributable to ageing 17, 21, 31, 33, complementary linear
regression analysis suggested a limited importance of age, since the variation of
physical attributes explained by chronologic age ranged just from 3% (in upper body
flexibility) to 13% (in multidimensional balance) (P<0.05). By its turn, medication
explained 2-18% of physical function variation and physical activity explained 1-5% of
this variation (P<0.05)
The main limitation of this study was its cross-sectional nature. In order to minimize
this limitation, we tried to delineate homogeneous groups concerning variables that
potentially might influence physical function, namely medication and physical
impairments (as surrogates of health), body composition, school years, and physical
activity. However, it was a study with a large sample and with a physical activity level
that may be higher than general population from the same age, since participants were
involved in exercise programs and reports a high house/yard and transportation-related
physical activity41. Young reference group included participants with a varied physical
activity level, in order to be representative of general young from this range age. In this
context, it is estimated that losses of physical function in general population across
aging may be slightly higher than those observed in the present work.
CONCLUSIONS
By the age of 60, all physical attributes decreased significantly, except aerobic
endurance in men. The most pronounced losses occurred after 79 years of age in both
genders. Physical function decreased earlier in women than in men, with fewer
differences between genders after the age of 79. Chronologic age was, however, a weak
predictor of physical function variance, suggesting that other factors need to be
considered. Abilities involving multiple structures, specifically agility, balance and
aerobic endurance, presented more significant losses across age than strength and
flexibility, which depend primarily on the muscle-skeletal structure. Furthermore, small
losses affecting the lower limbs were greater than those of the upper limbs in older age.
Chapter 3
Variation of the different attributes that support the physical function in community-dwelling older adults
62
Thus, intervention for similar groups should be designed, taking into account training
priorities, namely: balance, agility, and aerobic endurance. Lower limb exercises should
be emphasized.
Acknowledgments
The authors thank all the volunteers who participated in this study.
Conflict of interest statement
The authors declare that there is no conflict of interest.
Portuguese Science and Technology Foundation (PhD grant SFRH/BD/31450/2006)
provided financial support to conduct this study.
The sponsors had no role in the design, analysis, or preparation of this manuscript.
REFERENCES
1. INE;IP. Projections of Resident Population - Portugal - 2008 - 2060. Lisbon: INE ed; 2009. 2. WHO, Ageing and the lifecourse. [16 October 2010] Available from: URL: http://www.who.int/ageing/en/. 3. Friedenberg RM. Longevity. Radiology 2002;223(3):597-601. 4. Lubitz J, Cai L, Kramarow E, Lentzner H. Health, life expectancy, and health care spending among the elderly. N Engl J Med 2003;349(11):1048-55. 5. Britton A, Shipley M, Singh-Manoux A, Marmot MG. Successful aging: the contribution of early-life and midlife risk factors. J Am Geriatr Soc 2008;56(6):1098-105. 6. Rowe JW, Kahn RL. Successful aging. Gerontologist 1997;37(4):433-40. 7. Masoro. Aging. In: Handbook of Physiology. Edited by E. M.; New York: Oxford University Press; 1995. p 3-21. 8. Chodzko-Zajko WJ, Proctor DN, Fiatarone Singh MA, Minson CT, Nigg CR, Salem GJ et al. American College of Sports Medicine position stand. Exercise and physical activity for older adults. Med Sci Sports Exerc 2009;41(7):1510-30. 9. Santoriello C, Fiorenzano G, Musella V, De Rosa C, Polverino M. Long-term physical training allows high exercise performance in moderate chronic obstructive pulmonary disease (COPD). J Sports Med Phys Fitness 2009;49(2):184-6. 10. Holloszy JO. The biology of aging. Mayo Clin Proc 2000;75 Suppl:S3-8; discussion S-9. 11. WHO. Steps to Health - A European Framework to Promote Physical Activity for Health. WHO ed. Copenhagen; 2007.
Chapter 3
Variation of the different attributes that support the physical function in community-dwelling older adults
63
12. Rolland Y, Lauwers-Cances V, Cesari M, Vellas B, Pahor M, Grandjean H. Physical performance measures as predictors of mortality in a cohort of community-dwelling older French women. Eur J Epidemiol 2006;21(2):113-22. 13. Penninx BW, Ferrucci L, Leveille SG, Rantanen T, Pahor M, Guralnik JM. Lower extremity performance in nondisabled older persons as a predictor of subsequent hospitalization. J Gerontol A Biol Sci Med Sci 2000;55(11):M691-7. 14. Rikli R, Jones J. Senior Fitness Test Manual. Champaign: Human Kinetics; 2001. 15. Jones CJ, Rikli RE, Beam WC. A 30-s chair-stand test as a measure of lower body strength in community-residing older adults. Res Q Exerc Sport 1999;70(2):113-9. 16. Rose DJ, Lucchese N, Wiersma LD. Development of a multidimensional balance scale for use with functionally independent older adults. Arch Phys Med Rehabil 2006;87(11):1478-85. 17. Rikli R, Jones CJ. Functional fitness normative scores for community-residing older adults. J Aging Phys Act 1999;7:160-79. 18. Wang CY, Sheu CF, Protas E. Construct validity and physical performance of older adults in different hierarchical physical-disability level. J Aging Phys Act 2007;15(1):75-89. 19. Haywood K, Getchell N. Life span motor development. 4ed. Champaign: Human Kinetics; 2005. 20. Pedrazzoni M, Girasole G, Bertoldo F, Bianchi G, Cepollaro C, Del Puente A et al. Definition of a population-specific DXA reference standard in Italian women: the Densitometric Italian Normative Study (DINS). Osteoporos Int 2003;14(12):978-82. 21. Atkinson HH, Rosano C, Simonsick EM, Williamson JD, Davis C, Ambrosius WT et al. Cognitive function, gait speed decline, and comorbidities: the health, aging and body composition study. J Gerontol A Biol Sci Med Sci 2007;62(8):844-50. 22. Salaffi F, Stancati A, Neri R, Grassi W, Bombardieri S. Measuring functional disability in early rheumatoid arthritis: the validity, reliability and responsiveness of the Recent-Onset Arthritis Disability (ROAD) index. Clin Exp Rheumatol 2005;23(5 Suppl 39):S31-42. 23. Pluijm S. Predictors and consequences of falls and fractures in the elderly. Amesterdam: Vrije Universiteit; 2001. 24. Craig CL, Marshall AL, Sjostrom M, Bauman AE, Booth ML, Ainsworth BE et al. International physical activity questionnaire: 12-country reliability and validity. Med Sci Sports Exerc 2003;35(8):1381-95. 25. Davis JC, Donaldson MG, Ashe MC, Khan KM. The role of balance and agility training in fall reduction. A comprehensive review. Eura Medicophys 2004;40(3):211-21. 26. DiBrezzo R, Shadden BB, Raybon BH, Powers M. Exercise intervention designed to improve strength and dynamic balance among community-dwelling older adults. J Aging Phys Act 2005;13(2):198-209. 27. Hayashi R, Miyake A, Watanabe S. The functional role of sensory inputs from the foot: stabilizing human standing posture during voluntary and vibration-induced body sway. Neurosci Res 1988;5(3):203-13.

Chapter 3
Variation of the different attributes that support the physical function in community-dwelling older adults
64
28. Hoshiyama M, Kakigi R, Takeshima Y, Miki K, Watanabe S. Priority of face perception during subliminal stimulation using a new color-opponent flicker stimulation. Neurosci Lett 2006;402(1-2):57-61. 29. Kuo AD, Speers RA, Peterka RJ, Horak FB. Effect of altered sensory conditions on multivariate descriptors of human postural sway. Exp Brain Res 1998;122(2):185-95. 30. Simmons RW. Sensory organization determinants of postural stability in trained ballet dancers. Int J Neurosci 2005;115(1):87-97. 31. Hepple RT. Skeletal muscle: microcirculatory adaptation to metabolic demand. Med Sci Sports Exerc 2000;32(1):117-23. 32. Figueiredo PA, Powers SK, Ferreira RM, Appell HJ, Duarte JA. Aging impairs skeletal muscle mitochondrial bioenergetic function. J Gerontol A Biol Sci Med Sci 2009;64(1):21-33. 33. Ferrucci L, Guralnik JM, Buchner D, Kasper J, Lamb SE, Simonsick EM et al. Departures from linearity in the relationship between measures of muscular strength and physical performance of the lower extremities: the Women's Health and Aging Study. J Gerontol A Biol Sci Med Sci 1997;52(5):M275-85. 34. Guralnik JM, Ferrucci L, Pieper CF, Leveille SG, Markides KS, Ostir GV et al. Lower extremity function and subsequent disability: consistency across studies, predictive models, and value of gait speed alone compared with the short physical performance battery. J Gerontol A Biol Sci Med Sci 2000;55(4):M221-31. 35. de Rekeneire N, Visser M, Peila R, Nevitt MC, Cauley JA, Tylavsky FA et al. Is a fall just a fall: correlates of falling in healthy older persons. The Health, Aging and Body Composition Study. J Am Geriatr Soc 2003;51(6):841-6. 36. Rikli R, Jones CJ. The reliability and validity of a 6-minute walk test as a measure of physical endurance in older adults. J Aging and Phys Act 1998;6:363-75. 37. Newman AB, Simonsick EM, Naydeck BL, Boudreau RM, Kritchevsky SB, Nevitt MC et al. Association of long-distance corridor walk performance with mortality, cardiovascular disease, mobility limitation, and disability. Jama 2006;295(17):2018-26. 38. Buchman AS, Wilson RS, Boyle PA, Bienias JL, Bennett DA. Change in motor function and risk of mortality in older persons. J Am Geriatr Soc 2007;55(1):11-9. 39. Buchman AS, Boyle PA, Wilson RS, Bienias JL, Bennett DA. Physical activity and motor decline in older persons. Muscle Nerve 2007;35(3):354-62. 40. Bruce DG, Devine A, Prince RL. Recreational physical activity levels in healthy older women: the importance of fear of falling. J Am Geriatr Soc 2002;50(1):84-9. 41. Haskell WL, Lee IM, Pate RR, Powell KE, Blair SN, Franklin BA et al. Physical activity and public health: updated recommendation for adults from the American College of Sports Medicine and the American Heart Association. Med Sci Sports Exerc 2007;39(8):1423-34.
Chapter 4
Over 50 years old men are more likely to fall than women under similar conditions of health, body composition and balance
65
CHAPTER 4 OVER 50 YEARS OLD MEN ARE MORE LIKELY TO FALL THAN WOMEN
UNDER SIMILAR CONDITIONS OF HEALTH, BODY COMPOSITIO N AND
BALANCE 3
_______________________________ 3 Pereira C, Baptista F, Infante P. Over 50 years old men are more likely to fall than women under similar
conditions of health, body composition and balance. 2011 (in review)
Chapter 4
Over 50 years old men are more likely to fall than women under similar conditions of health, body composition and balance
66
ABSTRACT
Women are more prone to fall than men. However, the reasons for this higher incidence
of falls in old women are not well known. This study aimed to analyze cross-sectionally
the contribution of gender in falls occurrence, after accounting for co-morbidities, body
composition and physical function differences. Participants were 587 community-
dwelling old adults of both genders. Falls occurrence, co-morbidities (number of
diseases and physical impairments), body composition (body height, weight, lean mass,
and fat mass), and physical function (lower and upper body strength and flexibility,
agility, aerobic endurance, balance) were evaluated by questionnaires, bioimpedance
and Fullerton batteries, respectively. Compared with men, women revealed a 10%
higher fall prevalence, 1.7 more diseases/impairments, 10% more body fat, 26% less
lean body mass, and a lower physical function (p<0.05). Multivariate logistic regression
showed that male gender (OR:2.723, 95% CI:1.190-6.230) increased the likelihood of
falling, after adjusted for co-morbidities (OR:1.213, 95% CI:1.109-1.328), lean mass
(OR:0.958, 95% CI:0.927-0.989), fat mass (OR:1.053, 95% CI:1.021-1.086), and
balance (OR:0.942, 95% CI:0.914-0.971), that were the most important predictors of
falls. In conclusion, women were more susceptible to falling because they have, at least,
poorer health, body composition and physical function than men. However, considering
similar values for these risk factors in both genders, men demonstrated a higher fall
probability. Age was not a significant risk factor for falls in a favorable condition of
health, body composition and balance.
Key words: falls; gender; co-morbidities; physical function; body composition
Short Title: Falls and gender
Chapter 4
Over 50 years old men are more likely to fall than women under similar conditions of health, body composition and balance
67
INTRODUCTION
Falls are the major cause of death related to mechanical injuries in the elderly 1,
especially in women since they are more prone to fall and have a higher predisposition
to osteoporotic fractures than men 2-4. Although some authors cite gender differences in
the mechanical properties of tendons to explain discrepancies in the risk of falling 5, the
reasons for a higher incidence of falls in women are not well known.
Falls can be a problem before age 60 years 6. However, their occurrence increases with
age and is estimated that at least 30% of people aged 65 or older living in community
fall at least once a year 7, 8. Apart from health status, the progressive loss of physical
function and mobility with age seems to contribute to a fall event 9. Moreover, these
losses showed contribute differentially to the occurrence of diverse types of falls (e.g.
indoor and outdoor falls) 10. Exercise, as a single or a multifactorial intervention to
prevent falls is one of the most effective and frequent strategy with an overall 17%
reduction in risk of falls 11, particularly if it includes skill-related (coordination, agility,
balance, mobility), and/or health-related components of physical function as muscular
strength, flexibility and aerobic capacity/endurance 12, 13. However, for the success of a
fall prevention intervention, it is important to weight the influence and associated risk of
each factor in both men and women.
Recent research to predict falls and to distinguish fallers from non-fallers has been
focused in the lifestyle, health status, and physical function, particularly, in balance and
mobility 2, 3, 14-16. Nevertheless, despite being seen as risk factors for falls 3, 9, 12, 13 the
influence of parameters such, muscle strength, flexibility, agility, body composition or
other personal characteristics as gender remains unclear. Study the effect of gender is
pointed as fundamental in current research on aging 17. Thus, the main purpose of this
study was to investigate the influence of gender in the occurrence of falls in community-
residing persons aged 50 and older after accounting for co-morbidities, body
composition and physical function differences.
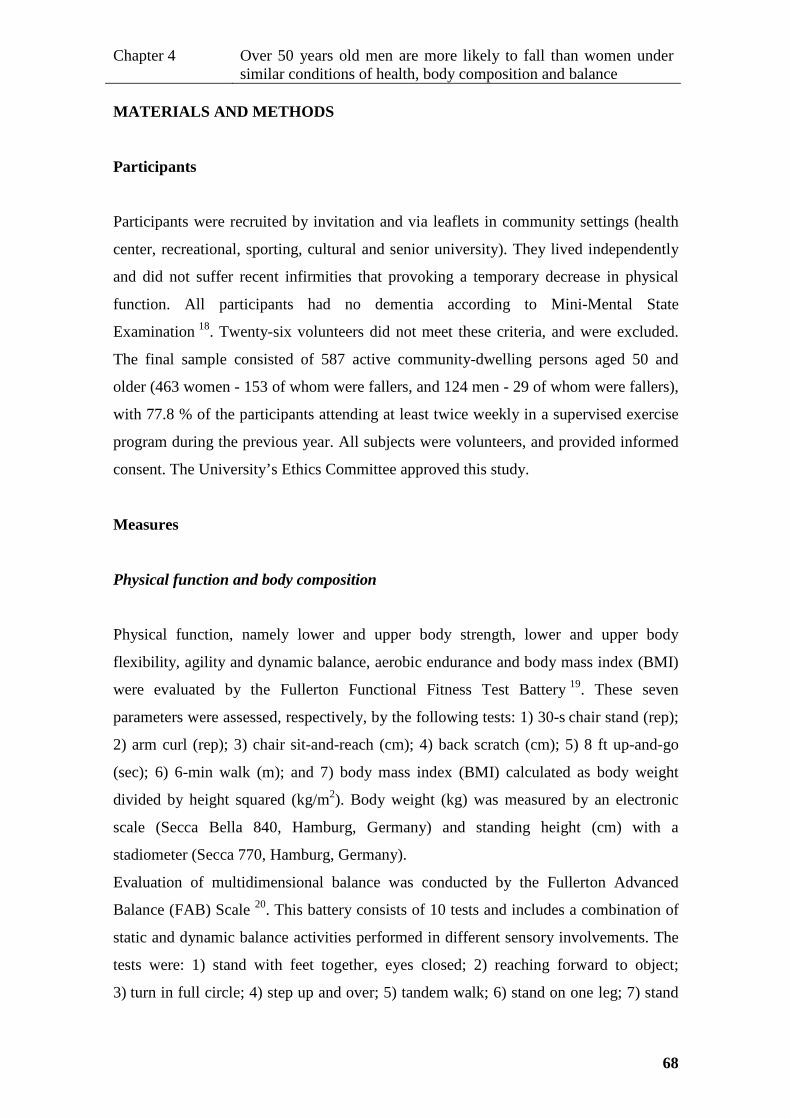
Chapter 4
Over 50 years old men are more likely to fall than women under similar conditions of health, body composition and balance
68
MATERIALS AND METHODS
Participants
Participants were recruited by invitation and via leaflets in community settings (health
center, recreational, sporting, cultural and senior university). They lived independently
and did not suffer recent infirmities that provoking a temporary decrease in physical
function. All participants had no dementia according to Mini-Mental State
Examination 18. Twenty-six volunteers did not meet these criteria, and were excluded.
The final sample consisted of 587 active community-dwelling persons aged 50 and
older (463 women - 153 of whom were fallers, and 124 men - 29 of whom were fallers),
with 77.8 % of the participants attending at least twice weekly in a supervised exercise
program during the previous year. All subjects were volunteers, and provided informed
consent. The University’s Ethics Committee approved this study.
Measures
Physical function and body composition
Physical function, namely lower and upper body strength, lower and upper body
flexibility, agility and dynamic balance, aerobic endurance and body mass index (BMI)
were evaluated by the Fullerton Functional Fitness Test Battery 19. These seven
parameters were assessed, respectively, by the following tests: 1) 30-s chair stand (rep);
2) arm curl (rep); 3) chair sit-and-reach (cm); 4) back scratch (cm); 5) 8 ft up-and-go
(sec); 6) 6-min walk (m); and 7) body mass index (BMI) calculated as body weight
divided by height squared (kg/m2). Body weight (kg) was measured by an electronic
scale (Secca Bella 840, Hamburg, Germany) and standing height (cm) with a
stadiometer (Secca 770, Hamburg, Germany).
Evaluation of multidimensional balance was conducted by the Fullerton Advanced
Balance (FAB) Scale 20. This battery consists of 10 tests and includes a combination of
static and dynamic balance activities performed in different sensory involvements. The
tests were: 1) stand with feet together, eyes closed; 2) reaching forward to object;
3) turn in full circle; 4) step up and over; 5) tandem walk; 6) stand on one leg; 7) stand

Chapter 4
Over 50 years old men are more likely to fall than women under similar conditions of health, body composition and balance
69
on foam, eyes closed; 8) two-footed jump; 9) walk with head turns; and 10) reactive
postural control. The 10 tests are scored according to an ordinal scale going from
0 (worst) to 4 (best) points. The final score is the sum, from 0 to 40, of the points
obtained in each of the tests.
Fat body mass percentage was assessed by bioimpedance (HBF-306C, Schaumburg,
USA) 21. Lean body mass (kg) was calculated as: body weight (kg)–[(body weight
(kg)× fat body mass (%))/100].
Falls, co-morbidities, and socio-demographic characteristics.
History of falls, health, and socio-demographic characteristics were assessed by a
questionnaire. Participants were interviewed and a questionnaire filled in, indicating the
number of falls in the last 12 months, diseases and physical impairments, time spent in
supervised exercise (hr/wk), age, educational level, and other socio-demographic
characteristics, besides describing the circumstances surrounding falls (e.g., habitual,
exceptional or high difficulty tasks; indoor or outdoor). A fall was operationally defined
as “a subject unintentionally coming to rest on the ground or another lower level, except
those that result from a major intrinsic event (e.g. stroke or syncope) or overwhelming
hazard” 8. A faller was defined as a subject who fell at least once in the previous12
months. Diseases reported by all participants were listed in a total of 24 diseases.
Physical impairments included involuntary loss of urine, regular dizziness, feet
problems (e.g. sores, corns, skewed toes, amputation of toes or foot, insufficient muscle
function), poor vision (not recognizing someone’s face at a distance of 4 meters with
glasses or contact lenses), hearing problems (not able to follow a conversation in a
group of four people with a hearing aid), and occasional loss of balance 14. The presence
or absence of each disease and physical impairment were checked for each participant.
The number of diseases and physical impairment defined co-morbidities.
Statistical analysis
Subject´s characteristics, namely potential predictors of falling (age, education, co-
morbidities, and body composition and physical function parameters), were compared
between fallers and non-fallers and between males and females by t-test for independent

Chapter 4
Over 50 years old men are more likely to fall than women under similar conditions of health, body composition and balance
70
samples in case of normality and homoscedasticity of the variables, or by the Wilcoxon-
Mann-Whitney test, when these conditions were not met. Complementary analyses were
performed by chi-squared independent test and Mantel – Haenszel test.
The influence of gender, co-morbidities, physical function, body composition, exercise
and age in the occurrence of falls (yes/no) were analyzed by binary logistic regression 22
using the traditional approach, seeking the most parsimonious model. The selection
process started with the univariate analysis of each variable. Variables that presented a
p-value <0.20 were candidates for the multivariable model. At first, a model was
created containing all variables of reported importance and the significance of each
variable was tested by the Wald statistic (p<0.05). Variables that did not meet these
criteria were eliminated, and a new model was fitted. Each new model was compared
with the previous one, using the likelihood ratio test. This process of deleting, refitting,
and verifying continued until all significant variables examined were included in the
model. For continuous variables, the assumption of linearity was checked by the logit.
The main effects model was refined, and the possible interactions among the variables
were tested until a final model was established. A Hosmer-Lemeshow test evaluated the
overall fit measures. Discriminative ability of potential predictors was examined by the
Receiver Operating Characteristic (ROC) analysis, which computed the area under the
ROC curve (AUC). Established sensitivity and specificity relied on a cut-point that
maximized both 23. Finally an analysis of the individual components of the summary
statistics was performed, looking for outliers and influential points. The final model-
equation with the significant predictor variables for falling and its weight was
determined.
Internal validation of the model was performed by a resampling or cross-validation
procedure 24. Participants were divided into 10 equal groups by sampling randomly
without replacement. For each one of the randomized groups, it was generated the
predicted probabilities for fall occurrence by using parameters that were estimated from
a logistic regression model that used data from the other nine groups. These 10 logistic
regressions had identical specification; each one used 90% of the data. Finally it was
calculated the AUC for the probabilities generated by the cross-validation.
Statistical analyses were performed with SPSS version 17.0, considering statistical
significance to be p <0.05.
Chapter 4
Over 50 years old men are more likely to fall than women under similar conditions of health, body composition and balance
71
RESULTS
Of the 587 volunteers, 182 reported at least one fall in the previous 12 months
(Table 1). Regarding falls occurrence, fallers had poorer body composition than non-
fallers. Lean body mass was lower among fallers (-2.2 kg, p=0.004), and fat body mass
percentage was higher among fallers (+2.5%, p<0.001). Regarding height, non-fallers
were 2.3 cm shorter (p=0.001). Non-fallers showed better values in all parameters of
physical function (from +2 points in multidimensional balance to +26 m in aerobic
endurance, p<0.05), except in upper body strength and in lower body flexibility. Non-
fallers also were younger (-1.36 yrs, p=0.014), healthier (-1.3 diseases or impairments,
p<0.001) and more educated (+1.53 yrs, p<0.001).
Table 1. Characteristics of subjects (N=587). Data are mean ± Standard Deviation.
Non-fallers
(n =405)
Fallers
(n =182) p
Women
(n =463)
Men
(n =124) p
Age (yrs) 67.8±6.9 69.1±6.7 0.012 67.8±6.9 69.6±6.5 0.011
Co-morbidities (n) 3.0±2.1 4.3±2.6 <0.001 3.7±2.4 2.2±1.6 <0.001
Education (yrs) 6.8±4.3 5.3±3.9 <0.001 5.9±4.0 8.0±4.4 <0.001
Exercise (hr/wk) 2.1±1.2 1.9±1.3 0.215 2.0±1.2 2.3±1.4 0.015
Height (cm) 157.1±8.4 154.8±7.8 0.001 153.5±6.3 167.1±5.9 <0.001
Weight (kg) 69.5±12.5 69.4±12.7 0.979 67.1±11.6 78.1±12.3 <0.001
Body mass index (kg/m2) 28.1±4.3 29.0±4.8 0.115 28.5±4.6 28.0±4.1 0.216
Lean body mass (kg) 42.8±8.3 40.6±8.0 0.004 38.9 ±5.7 52.7±6.5 <0.001
Fat body mass (%) 38.7±6.2 41.2±5.7 <0.001 41.7±4.6 32.2±4.8 <0.001
Lower body strength (rep) 16.9±4.6 15.6 ±4.4 0.002 16.3±4.7 17.4±4.2 0.005
Upper body strength (rep) 17.6±4.6 16.7±4.4 0.063 17.1±4.4 18.3±4.7 0.010
Lower body flexibility (cm) -1.4±9.7 -1.3±8.6 0.987 0.3±8.1 -7.5±11.0 <0.001
Upper body flexibility (cm) -8.6±10.5 -11.6±11.3 0.002 -8.9±10.5 -11.8±11.7 0.010
Agility and dynamic
balance (sec) 5.7±2.0 6.0±1.7 0.001 6.0±2.0 5.3±1.1 <0.001
Aerobic endurance (m) 519.4±96.3 493.7±94.2 0.004 495.3±90.1 579.1±92.6 <0.001
Multidimensional balance
(points) 33.2±5.5 31.1±5.9 <0.001 31.9±5.8 34.9±4.5 <0.001
Regarding gender, fall prevalence and annual rate was higher among women (women:
33.0 vs. men: 23.4%, p=0.039; women: 0.64 fall/year vs. men: 0.31 fall/year, p<0.001).

Chapter 4
Over 50 years old men are more likely to fall than women under similar conditions of health, body composition and balance
72
In both genders ~40% of the falls occurred indoor, and ~60 occurred outdoor. Body
composition and physical function were also better in men than in women: from -9.5%
in fat body mass to +13.8 kg (+9.4%) in lean body mass, p<0.01; and from +1.1 rep
(6.5 %) in lower body strength to + 82.8m (16.9 %) in aerobic endurance p<0.05).
Nonetheless, women demonstrated a better body flexibility (upper and lower) than men
(+7.8 cm and +2.9 cm, respectively) (p<0.01). Although older (+1.7 yrs, p=0.011), men
were healthier (with 1.74 less disease or impairments, p<0.001) and had more years of
education (+2.11 yrs, p<0.001).
Complementary analysis done by chi-squared independent test showed that the
percentage of women who fall was significantly higher than that in men (33.0 vs. 23.4%,
p=0.039). It also showed that men reported a higher percentage of falls than women
when performing exceptional or high difficulty tasks (17% vs. 4%, p=0.017) but a lower
falls percentage when performing habitual tasks (83% vs. 96%, p=0.017). Mantel –
Haenszel test showed that there were no significant differences between the percentage
of men and women who fall, or did not fall, when controlled for each health, body
composition or physical function variables (categorized by quartiles and used as layer).
Multivariate binary logistic regression analysis was performed in order to compute a
model with an improved ability to predict falls occurrence, with the inclusion of the
significant variables. This analysis (Table 2) showed that the predictor variables to falls
occurrence were gender (male OR: 2.723 CI 95%: 1.190-6.230), co-morbidities (OR:
1.213 CI 95%: 1.109-1.328), lean body mass (OR: 0.958 CI 95%: 0.927-0.989), fat
body mass percentage (OR: 1.053 CI 95%: 1.021-1.086), and multidimensional balance
(OR: 0.942 CI 95%: 0.914-0.971). In the multivariate model, male gender increased the
likelihood of falling. Chronologic age was not a significant predictor of falls
Table 2. Predictors of falling. Data are Multivariate Odds Ratios (OR), 95% Confidence Intervals (CI),
Area Under the ROC Curve (AUC), 95% Confidence Intervals (CI), Specificity and Sensibility (Cut-off
Point: 0.336).
Predictor OR (95%CI) AUC (95%CI) Specificity (%) Sensibility (%)
Gender 2.723 (1.190-6.230)
0.710 (0.661-0.758) 72.0 60.2
Co-morbidities 1.213 (1.109-1.328)
Lean body mass 0.958 (0.927-0.989)
Fat body mass 1.053 (1.021-1.086)
Multidimensional
balance 0.942 (0.914-0.971)

Chapter 4
Over 50 years old men are more likely to fall than women under similar conditions of health, body composition and balance
73
The ROC analysis showed that the multivariate model discriminated fallers from non-
fallers, with an AUC of 0.710 (CI 95%: 0.661-0.758). The optimal cut-off point was
established at 0.336, corresponding to the maximum sum of sensitivity (60.0%) and
specificity (72.0%). The multivariate logistic regression and was defined by the follow
equation:
{ }{ }MBFBMLBMCGender
MBFBMLBMCGenderx
060.0052.0043.0193.0002.1exp1
060.0052.0043.0193.0002.1exp)(
−×+×−×+×+−×+×−×+×=π
Where π(x) is falling probability; exp is exponential; Gender is 0 for female and 1 for
male; LBM is lean body mass (kg); C is co-morbidities (number of diseases and
impairments); FBM is fat body mass (%), and MB is multidimensional balance (point).
In order to define cut-off values that distinguish fallers from non-fallers depending on
co-morbidities, lean body mass, fat body mass percentage and multidimensional
balance, the equation of the multivariate model of logistic regression was solved for
each of these four predictors. To this end, it was considered in each calculation (in a
total of four) a cut-off value of 0.336 for the probability of falling (π) and the value
corresponding to the 50th percentile in the remaining variables (except in the variable
on which the calculation was being processed). In men, the 50th percentile
corresponded respectively to the following values: 2 diseases or incapacities in co-
morbidities; 51.5 kg in lean body mass; 32.2% in fat body mass; and 36 points in
multidimensional balance. In women, the 50th percentile corresponded to 3 diseases or
incapacities in co-morbidities; 38.9 kg in lean body mass; 42.1% in fat body mass; and
33 points in multidimensional balance.
Figure 1 shows, separately for men and women, the change in the probability of falling
due to the variation of each one of these variables, indicating the value at which the
participant moves from the non-faller to the faller category.
Concerning the multivariate equation, men who fall will be the ones that show more
than 5 diseases/incapacities, or a lean body mass below 36.7 kg, or a fat body mass
above 44.4 %, or a multidimensional balance under 26 points. The fallers women will
be the ones that show more than 4 disease/incapacities, or a lean body mass below
34.2 kg, or a fat body mass above 46.0 %, or a multidimensional balance under 30
points.
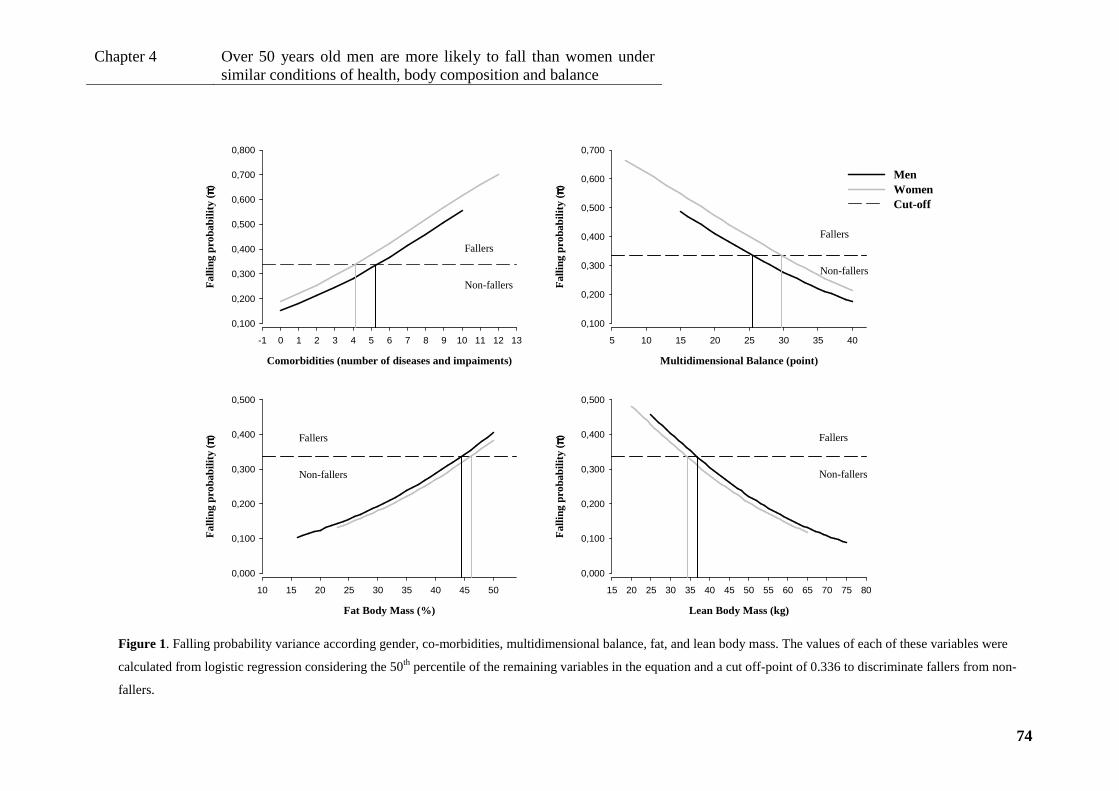
Chapter 4
Over 50 years old men are more likely to fall than women under similar conditions of health, body composition and balance
74
Multidimensional Balance (point)
5 10 15 20 25 30 35 40
Fal
ling
prob
abili
ty (
ππ ππ)
0,100
0,200
0,300
0,400
0,500
0,600
0,700
Comorbidities (number of diseases and impaiments)
-1 0 1 2 3 4 5 6 7 8 9 10 11 12 13
Fal
ling
prob
abili
ty (
ππ ππ)
0,100
0,200
0,300
0,400
0,500
0,600
0,700
0,800
MenWomenCut-off
Fat Body Mass (%)
10 15 20 25 30 35 40 45 50
Fal
ling
prob
abili
ty (
ππ ππ)
0,000
0,100
0,200
0,300
0,400
0,500
Lean Body Mass (kg)
15 20 25 30 35 40 45 50 55 60 65 70 75 80
Fal
ling
prob
abili
ty (
ππ ππ)0,000
0,100
0,200
0,300
0,400
0,500
Figure 1. Falling probability variance according gender, co-morbidities, multidimensional balance, fat, and lean body mass. The values of each of these variables were
calculated from logistic regression considering the 50th percentile of the remaining variables in the equation and a cut off-point of 0.336 to discriminate fallers from non-
fallers.
Fallers Non-fallers
Fallers Non-fallers
Fallers Non-fallers
Fallers Non-fallers
Chapter 4
Over 50 years old men are more likely to fall than women under similar conditions of health, body composition and balance
75
DISCUSSION
The main goal of this work was to study the influence of gender in falls occurrence in
community-residing persons aged 50 and older.
This investigation reported that women were more susceptible to falling than men, a
result that is consistent with other studies 2, 3, 25. However, when similar conditions of
health, body composition and physical function were considered for both men and
women, men were more than twice prone to fall than women. As also mentioned by
some researchers 26, 27, fallers demonstrated worst values in co-morbidities and in
almost all physical function and body composition variables. Multivariate logistic
regression results showed that the most important predictors of falls were co-
morbidities, lean and fat body mass, and multidimensional balance, in both genders.
As noted earlier 3, 28, men had better values than women in almost all body composition
and physical function parameters, and, apart from being older, men also presented
improved values in health status and fell less than women. The poorer results for
women, suggest the reasons for women to be more susceptible to falling than men.
Thus, consistent with other authors 3, 29, the risk probability for falling in women was
~10% higher than in men, when a single analysis was conducted. However, when the
risk of falling was adjusted for co-morbidities, lean and fat body mass, and
multidimensional balance, men showed a higher predisposition to fall than women. For
example, for similar conditions in both gender (e.g. 2 diseases or impairments, 40 kg of
body lean mass, 40% of body fat mass, and 30 points on multidimensional balance), the
probability of falling for the man will be 48.7%, and for the women will be 25.8%. This
reversal occurred only when equating the cumulative effect of the variables, since the
study of the effect of each single variable analyzed by the Mantel – Haenszel test
revealed not to be significant.
Results from the complementary analysis were consistent with the hypothesis that men
put themselves in more hazardous situations than women. In this study, men reported a
higher percentage of falls than women when performing exceptional or high difficulty
tasks, but a lower percentage of falls when performing habitual tasks. This is consistent
with the observations reported by other researchers that male gender is a higher risk for
Chapter 4
Over 50 years old men are more likely to fall than women under similar conditions of health, body composition and balance
76
falling than female gender in a hospital setting 30, and that a higher risk of falls is
associated with the performance of high demanding activities 31.
As already observed, co-morbidities was the most important predictor of falls in both
genders 6, 14, 32, with a 21% increase of falling likelihood for each additional
disease/incapacity. This finding means for example, that a successful cataract surgery, a
significant risk factor for falls and for related-injuries since visual impairments leads to
inaccurate assessment of environmental obstacles 33, decreases the likelihood of falling
by 21%, besides other evident benefits. This percentage is consistent with the results of
Nitz and Choy 6 who revealed that for each additional co-morbidity, depending on age,
the likelihood of falls increases from 8% to 35%.
Regarding body composition, this study estimated that for an additional 1% in fat body
mass (~0.7 kg in men and ~0.8 kg in women), the likelihood of falling increases 5%,
and for each additional kg in lean body mass, it decreases 4%. This finding reinforces
the importance of lean mass, namely muscle mass, in falls prevention 9, 34.
Balance evaluated by FAB Scale battery, has revealed to be a strong predictor for
recurrent falling. Hernadez and Rose study 15 found that for every point increased in the
total balance score, there was ~10% decrease in the older adult’s likelihood of falling.
The present study reported that, among all physical function parameters,
multidimensional balance was the most important predictor of falls occurrence, showing
a decrease of 6% in the likelihood of falling for each additional point. This fact may be
principally relevant for women because in this test they obtained ~ 3 points less than
men. Moreover, balance evaluated by FAB battery was a stronger predictor of falling
than balance evaluated by the up-and-go test, which has also been used to predict falls
with contentious results 35-37. As each item test of the FAB battery has the ability to
detect failures and handicaps in the different sensory and locomotors systems and
mechanisms 20, its use as an evaluation tool also allows outlining recommendations for
preventive interventions.
Health, body composition and physical function variables were the ones that allowed
estimation of falling risk. This study estimated the risk associated with the change of
each one of these predictor variables, and estimate values (different for men and
women) from which the individual modifies the condition of faller for non-faller and
vice-versa. For example, if a woman increase the lean body mass of 33 kg to 35 kg,
maintaining the other variables constant (i.e. median values), the likelihood of falling
Chapter 4
Over 50 years old men are more likely to fall than women under similar conditions of health, body composition and balance
77
would decrease 8.4%, and change from a faller to a non-faller status. Within limits, a
more favourable score in one variable seems to compensate a less favourable score in
other variable.
Age per se loses its importance as risk factor for falling if health, body composition and
physical function are maintained across aging. Age emerged as a risk factor for falling
in pair wise comparisons 3, 8, but lost significance in multivariate regression analysis.
Therefore, younger people in poorer health, body composition or physical function
condition have a higher probability of falling than older people in better condition.
Thus, the results of this study emphasize the importance of promoting a healthy body
composition and physical function particularly multidimensional balance; avoiding
perform risky tasks, especially in hazard environments. They underlines special
attention to women because their conditions tend to be more fragile and to men because
they tend to expose themselves to situations of greater risk.
A major difficulty in this investigation was the recruitment of male participants.
Consequently, the sample was composed mainly by women (78.9%), with a
participation percentage exceeding that reported in last Portuguese census 38 for the
population aged 50 and older (~58% women). However, the sample reflects the higher
number of women involved in community initiatives and physical exercise programs. In
addition, most of the participants were physically and socially active, maintaining
average levels of capacities and independence 28. Even so, in accordance with other
studies 7, 8, 31 % of them fell at least once in the previous year. However, the real
dimension of the problem is likely to be underestimated, because, the most frail
individuals are unlikely to volunteer for this type of studies.
Another possible limitation of this study may be the inclusion of one-time faller persons
in the multivariate model, since Gill et al. 39 recommend to analyse the risk of falls
using regression models for recurrent events. Nevertheless, the inclusion of one-time
fallers, beyond to deliver similar results to those found when considering recurrent
fallers in the model, showed to be more explanatory in data analysis. On the other hand,
the final multivariate model presented a discriminate capacity (AUC: 0.710) with
analogous values to those found in other studies focussing on recurrent fallers (AUC:
0.60-0.79) 29, 32, 36, and the predicted probabilities that were generated with the cross-
validation procedure had a similar AUC (0.693, 95% CI: 0.643-742). Furthermore, the
Chapter 4
Over 50 years old men are more likely to fall than women under similar conditions of health, body composition and balance
78
model included all discordant observations from the sample and the results were similar
when Poison regression was used.
Finally, in a cross-sectional study, the relationship between variables can be interpreted
bi-directionally. That is, health, body composition and physical functioning may
influence the occurrence of falls, but the reverse can also occur. Nevertheless, mostly
co-morbidities, particularly chronic diseases such as diabetes, or physical impairments
such as poor vision are very unlike to result from falls, and all volunteer who suffered
recent infirmities with temporary decrease in physical function were excluded from the
study.
CONCLUSIONS
This study found that women were more susceptible to falling than men because they
have, at least, poorer health, body composition and physical function. However, in
similar conditions, men were more than twice as prone to fall. Reduced co-morbidities
and a good multidimensional balance decreased falling probability, as did a high lean
body mass and a low body fat percentage, in both genders. The importance of
chronologic age as a risk factor for falling appears to be minimal if these conditions are
maintained across the ageing process.
Acknowledgments
The authors thank all the volunteers who participated in this study.
Conflict of interest statement
The authors declare that there is no conflict of interest.
Portuguese Science and Technology Foundation (PhD grant SFRH/BD/31450/2006)
provided financial support to conduct this study.
The sponsors had no role in the design, analysis, or preparation of this manuscript.

Chapter 4
Over 50 years old men are more likely to fall than women under similar conditions of health, body composition and balance
79
REFERENCES
1. Robbins JA, Biggs ML, Cauley J. Adjusted mortality after hip fracture: From the cardiovascular health study. J Am Geriatr Soc 2006;54(12):1885-91. 2. Swanenburg J, de Bruin ED, Uebelhart D, Mulder T. Falls prediction in elderly people: a 1-year prospective study. Gait Posture 2010;31(3):317-21. 3. Chu LW, Chi I, Chiu AY. Incidence and predictors of falls in the chinese elderly. Ann Acad Med Singapore 2005;34(1):60-72. 4. Kannus P, Sievanen H, Palvanen M, Jarvinen T, Parkkari J. Prevention of falls and consequent injuries in elderly people. Lancet 2005;366(9500):1885-93. 5. Burgess KE, Pearson SJ, Breen L, Onambele GN. Tendon structural and mechanical properties do not differ between genders in a healthy community-dwelling elderly population. J Orthop Res 2009;27(6):820-5. 6. Nitz JC, Choy NL. Falling is not just for older women: support for pre-emptive prevention intervention before 60. Climacteric 2008;11(6):461-6. 7. Norton R, Galgali G, Campbell AJ, Reid IR, Robinson E, Butler M et al. Is physical activity protective against hip fracture in frail older people? Age Ageing 2001;30(3):262-4. 8. Tinetti ME, Speechley M, Ginter SF. Risk factors for falls among elderly persons living in the community. N Engl J Med 1988;319(26):1701-7. 9. de Rekeneire N, Visser M, Peila R, Nevitt MC, Cauley JA, Tylavsky FA et al. Is a fall just a fall: correlates of falling in healthy older persons. The Health, Aging and Body Composition Study. J Am Geriatr Soc 2003;51(6):841-6. 10. Kelsey JL, Berry SD, Procter-Gray E, Quach L, Nguyen US, Li W et al. Indoor and outdoor falls in older adults are different: the maintenance of balance, independent living, intellect, and Zest in the Elderly of Boston Study. J Am Geriatr Soc 2010;58(11):2135-41. 11. Sherrington C, Whitney JC, Lord SR, Herbert RD, Cumming RG, Close JC. Effective exercise for the prevention of falls: a systematic review and meta-analysis. J Am Geriatr Soc 2008;56(12):2234-43. 12. Chodzko-Zajko WJ, Proctor DN, Fiatarone Singh MA, Minson CT, Nigg CR, Salem GJ et al. American College of Sports Medicine position stand. Exercise and physical activity for older adults. Med Sci Sports Exerc 2009;41(7):1510-30. 13. Carter ND, Khan KM, McKay HA, Petit MA, Waterman C, Heinonen A et al. Community-based exercise program reduces risk factors for falls in 65- to 75-year-old women with osteoporosis: randomized controlled trial. CMAJ 2002;167(9):997-1004. 14. Pluijm SM, Smit JH, Tromp EA, Stel VS, Deeg DJ, Bouter LM et al. A risk profile for identifying community-dwelling elderly with a high risk of recurrent falling: results of a 3-year prospective study. Osteoporos Int 2006;17(3):417-25. 15. Hernandez D, Rose DJ. Predicting which older adults will or will not fall using the Fullerton Advanced Balance scale. Arch Phys Med Rehabil 2008;89(12):2309-15.
Chapter 4
Over 50 years old men are more likely to fall than women under similar conditions of health, body composition and balance
80
16. Callisaya ML, Blizzard L, Schmidt MD, McGinley JL, Srikanth VK. Ageing and gait variability--a population-based study of older people. Age Ageing 2010;39(2):191-7. 17. Calasanti T. Gender relations and applied research on aging. Gerontologist 2010;50(6):720-34. 18. Folstein MF, Folstein SE, McHugh PR. "Mini-mental state". A practical method for grading the cognitive state of patients for the clinician. J Psychiatr Res 1975;12(3):189-98. 19. Rikli R, Jones C. Development and validation of a functional fitness test for community-residing older adults. J Aging Phys Act 1999;7:129-61. 20. Rose DJ, Lucchese N, Wiersma LD. Development of a multidimensional balance scale for use with functionally independent older adults. Arch Phys Med Rehabil 2006;87(11):1478-85. 21. Zaluska W, Malecka T, Mozul S, Ksiazek A. [Whole body versus segmental bioimpedance measurements (BIS) of electrical resistance (Re) and extracellular volume (ECV) for assessment of dry weight in end-stage renal patients treated by hemodialysis]. Przegl Lek 2004;61(2):70-3. 22. Hosmer D, Lemeshow S. Applied Logistic Regression. 2 ed. New York: Wiley; 2000. 23. Scholtissen S, Guillemin F, Bruyere O, Collette J, Dousset B, Kemmer C et al. Assessment of determinants for osteoporosis in elderly men. Osteoporos Int 2008; 20(7): 1157-1166. 24. Efron B, Tibshirani R. An introduction to the bootstrap. Chapman and Hall: Boca Raton; 1993. 25. Coimbra AM, Ricci NA, Coimbra IB, Costallat LT. Falls in the elderly of the Family Health Program. Arch Gerontol Geriatr 2010;51(3):317-22. 26. Rogers ME, Rogers NL, Takeshima N, Islam MM. Methods to assess and improve the physical parameters associated with fall risk in older adults. Prev Med 2003;36(3):255-64. 27. Lloyd BD, Williamson DA, Singh NA, Hansen RD, Diamond TH, Finnegan TP et al. Recurrent and injurious falls in the year following hip fracture: a prospective study of incidence and risk factors from the Sarcopenia and Hip Fracture study. J Gerontol A Biol Sci Med Sci 2009;64(5):599-609. 28. Rikli R, Jones CJ. Functional fitness normative scores for community-residing older adults. . J Aging Phys Act 1999;7:160-79. 29. Stalenhoef PA, Diederiks JP, Knottnerus JA, Kester AD, Crebolder HF. A risk model for the prediction of recurrent falls in community-dwelling elderly: a prospective cohort study. J Clin Epidemiol 2002;55(11):1088-94. 30. Haines TP, Hill AM. Inconsistent results in meta-analyses for the prevention of falls are found between study-level data and patient-level data. J Clin Epidemiol 2011;64(2):154-62.
Chapter 4
Over 50 years old men are more likely to fall than women under similar conditions of health, body composition and balance
81
31. Peeters GM, Verweij LM, van Schoor NM, Pijnappels M, Pluijm SM, Visser M et al. Which types of activities are associated with risk of recurrent falling in older persons? J Gerontol A Biol Sci Med Sci 2010;65(7):743-50. 32. Russell MA, Hill KD, Day LM, Blackberry I, Gurrin LC, Dharmage SC. Development of the Falls Risk for Older People in the Community (FROP-Com) screening tool. Age Ageing 2009;38(1):40-6. 33. Chang NT, Yang NP, Chou P. Incidence, risk factors and consequences of falling injuries among the community-dwelling elderly in Shihpai, Taiwan. Aging Clin Exp Res;22(1):70-7. 34. Otaka Y. [Muscle and bone health as a risk factor of fall among the elderly. Sarcopenia and falls in older people]. Clin Calcium 2008;18(6):761-6. 35. Wilson RS, Buchman AS, Arnold SE, Shah RC, Tang Y, Bennett DA. Harm avoidance and disability in old age. Exp Aging Res 2006;32(3):243-61. 36. Morris R, Harwood RH, Baker R, Sahota O, Armstrong S, Masud T. A comparison of different balance tests in the prediction of falls in older women with vertebral fractures: a cohort study. Age Ageing 2007;36(1):78-83. 37. Buatois S, Gueguen R, Gauchard GC, Benetos A, Perrin PP. Posturography and risk of recurrent falls in healthy non-institutionalized persons aged over 65. Gerontology 2006;52(6):345-52. 38. INE;IP (May, 31, 2007). Census 2001: Resident population (number) by place of residence, sex and age group (by life cycles). [1 January 2011] Available from URL: http://www.ine.pt 39. Gill DP, Zou GY, Jones GR, Speechley M. Comparison of regression models for the analysis of fall risk factors in older veterans. Ann Epidemiol 2009;19(8):523-30.
Chapter 5
Role of physical activity in the occurrence of falls and injuries in community-dwelling adults over 50 years old
82
CHAPTER 5
ROLE OF PHYSICAL ACTIVITY IN THE OCCURENCE OF FALLS AND
INJURIES IN COMMUNITY-DWELLING ADULTS OVER 50 YEARS OLD 4
_______________________________ 4 Pereira C, Baptista F, Infante P. Role of physical activity in the occurrence of falls and injuries in
community-dwelling adults over 50 years old. 2011 (in review)
Chapter 5
Role of physical activity in the occurrence of falls and injuries in community-dwelling adults over 50 years old
83
ABSTRACT
Objective This study examined the effect of the amount and intensity of physical
activity in falls and fall-related injuries in 505 adults aged over 50 years.
Methods Participants were 505 adults aged over 50 years (390 women: 67.7±6.8 years,
and 116 men: 69.6±6.6 years). Falls, fall-related injuries, physical activity, and potential
confounders, namely, co-morbidities, fear of falling, environmental hazards, physical
function and body composition were evaluated by Composite Physical Function, Falls
Efficacy Scale, and International Physical Activity questionnaires, and by Fullerton
batteries and bioimpedance.
Results After adjustment for confounders, logistic analysis revealed that the likelihood
of falling decreased 2% for each 100 MET-min/wk of total physical activity and
increased 5% for each 100 MET-min/wk of vigorous intensity physical activity.
Increased physical activity levels diminished the likelihood of severe fall-related
injuries occurrence on 76% (moderate level) and 58%, (high level) (p<.05).
Conclusion Physical activity did not promote the occurrence of falls in old people and
reduced the severity of injuries in case of fall when the total expenditure was at least
1,125 MET-min/wk if vigorous intensity did not exceed 500 MET-min/wk.
Key words: Falls; Injuries; Physical activity; Physical function; Environmental hazards;
Elderly
Running Title: Role of physical activity in falls and injuries
Chapter 5
Role of physical activity in the occurrence of falls and injuries in community-dwelling adults over 50 years old
84
INTRODUCTION
A fall is an accident in which a person suddenly and involuntary comes to the ground or
to a surface lower than the original position1 that usually occurs when the demands of a
given task exceed the person’s ability. The demands of a task are determined by its
difficulty and by the environmental conditions2-4. The ability to perform daily tasks
without falling declines with age due to diminishing physical, sensorial, and mental
functions regardless a weak health status that intensifies this process5, 6. These facts
combined with increasing life expectancy 7 have led to an increase in the incidence of
falls and their consequences in older populations 8. However, falls may be a problem
before the 60s years 9. The main immediate consequence of a fall is the injury or
injuries, which may sometimes be fatal. Another possible short-term consequence is an
increased fear of falling that often leads to a loss of functional independence while
performing daily tasks 10, 11.
Physical activity is a key factor for the maintenance of health-related quality of life,
including functional competence 12. However, the performance of any physical task,
including daily tasks, is inevitably associated with a certain risk of falling and injury.
For this reason, many community-dwelling older people and some carers might believe
that inactivity is the best way to avoid or reduce the risk of falling.
Physical activity/exercise reduces the rate of falling in older people by 17% 13. On the
other hand, both low and high levels of physical activity have been associated with an
increased fall risk 14, 15. Besides, it is known that the risk of falling varies according to
the types of activities 16, as do the risk of fall-related injuries 17. It is not clear, however,
what amount or intensity of physical activity/exercise is needed to reduce falls and
related injuries or how physical activity interacts with other risk factors for falls. The
successful completion of daily tasks (without falling) is dependent on intrinsic factors
such as age, health, physical function, body composition and fear of falling but also on
extrinsic factors such as the demands of each task and environmental hazards 4, 18, 19.
Thus, the main purpose of this study was to analyze the role of physical activity in falls
and related injuries in community-dwelling adults aged over 50 years, with adjustment
for these intrinsic and extrinsic risks factors.
Chapter 5
Role of physical activity in the occurrence of falls and injuries in community-dwelling adults over 50 years old
85
METHODS
Subjects
Participants were 506 community-residing adults aged over 50 years (390 women:
67.7±6.8 years and 116 men: 69.6±6.6 years) from which 31.2% fell at least once in the
previous 12 months. They were recruited by invitation and via leaflets and posters
distributed in community settings (health center, recreational, sporting, cultural and
senior university, etc.). All subjects lived independently and did not suffer from recent
illnesses or disabilities resulting in a temporary loss of physical function. Inclusion in
the study required the absence of dementia according to the criteria established by the
Folstein Mini-Mental State Examination 20. People who were not sure about the number
of falls or with comprehension problems (i.e., did not understand the questions of the
evaluation questionnaires) were excluded. A single interviewer filled out the
questionnaires and verified whether people understood the questions or not. Forty-one
volunteers did not meet these criteria and were excluded, including two subjects that
experienced hip fractures due to a fall in the previous months. The University’s Ethics
Committee approved this study.
Measures and data collection
Physical activity
Physical (in)activity was assessed using the short form of the International Physical
Activity Questionnaire (IPAQ) 21. This questionnaire covers metabolic expenditure
(MET-min/wk) on walking (3.3 MET), moderate (4.0 MET) and vigorous-intensity
activity (8.0 MET). Total metabolic expenditure was calculated by determining the time
(minutes/day) and frequency (days/week) spent in each one of these
activities/intensities. Individuals were also categorized as “low”, “moderate” or “high
active” according to the IPAQ criteria 21. In order to ensure a representative measure of
habitual physical activity, the interviewer asked every participant to relate an ordinary
week.

Chapter 5
Role of physical activity in the occurrence of falls and injuries in community-dwelling adults over 50 years old
86
Physical function and body composition
Lower and upper body strength and flexibility, agility and dynamic balance, aerobic
endurance and body mass index (BMI) were evaluated by the Fullerton functional
fitness test battery22 namely 30-s chair stand (repetitions or reps in 30 sec); arm curl
(reps in 30sec); chair sit-and-reach (cm); back scratch (cm); 8-ft up-and-go (sec); 6-min
walk (m). Standing height (cm) was measured with a stadiometer (Secca 770, Hamburg,
Germany) and BMI (kg/m2) using electronic scales (Secca Bella 840, Hamburg,
Germany). The mean of the standardized scores of the physical fitness (fitness test
battery without BMI), was calculated 23.
Balance was also evaluated by the Fullerton advanced balance (FAB) scale 24. This
includes the following tests: stand with feet together, eyes closed; reach forward to
object; turn full circle; step up and over; tandem walk; stand on one leg; stand on foam,
eyes closed; two-footed jump; walk with head turns; and reactive postural control. The
final score was calculated as the sum of points obtained in each of the ten tests, from 0
(worst) to 4 (best) for a range from 0 to 40 points.
Fat body mass (%) was evaluated by bioimpedance 25 (HBF-306C, Schaumburg, USA),
and lean body mass index (kg/m2) was calculated as [total body mass (kg) - fat body
mass (kg)] / [body height 2 (m2)].
Fear of falling
Fear of falling was assessed using the modified version of the Falls Efficacy Scale
(FES) 26, 27. All persons reported how concerned they felt about falling while performing
each of the ten daily activities listed in FES. Each item was rated on a points scale from
0 (not concerned) to 3 (very concerned). Total score was the sum of the points obtained
in each one of the tests for a range from 0 to 30.
Falls, fall-related injuries, environmental hazards, co-morbidities and education
The number of falls in the previous 12 months, the circumstances surrounding each fall
and their consequences, the quantification of environmental hazards, chronic diseases,
Chapter 5
Role of physical activity in the occurrence of falls and injuries in community-dwelling adults over 50 years old
87
chronic physical impairments and educational level were assessed by questionnaire
administered by an interviewer.
A faller was defined as a subject who fell at least once in the previous 12 months. The
number of falls was also categorized as no falls, one fall, two falls, three falls and four
or more falls.
All diseases reported by participants were listed (totaling 24). Physical impairments
included involuntary loss of urine, frequent dizziness, feet problems (e.g. sores, corns,
skewed toes, amputation of toes or foot, insufficient muscle function), poor vision (not
recognizing someone’s face at a distance of four meters with glasses or contact lenses),
hearing problems (not able to follow a conversation in a group of four people with a
hearing aid) and balance problems (occasional loss of balance) 27. The presence or
absence of each chronic disease and physical impairment was checked for each
participant. The number of diseases and physical impairments defined co-morbidities.
Environmental hazards include: indoor hazards (bad lighting, slippery floors, loose rugs,
telephone cables, other objects, ladders, stairways with steep steps, without walls and/or
handrails, kitchens with difficult access to utensils and movable tables, bathrooms
without tub handrails, shower and toilet and non-skid mat in tub or shower, bed too high
or too low); outdoor hazards (bad lighting, uneven pavements, streets, paths, repair
works, obstacles, slippery floors) and the presence of animals and footwear (minimum:
0, maximum: 34) 28.
Statistical analysis
Subjects’ characteristics, (age, co-morbidities, fear of falling, hazard environments,
physical activity/inactivity, body composition, and physical function parameters) were
compared between groups (fallers vs. non-fallers and fallers with vs. fallers without
severe injuries) by t-tests. Comparisons of the prevalence of physical activity level and
gender between these groups were done using Chi-Square Test or Fisher's Test. Injury
severity was classified as light (no injury, light scratches and edema) and severe (serious
abrasion, strained muscles, torn muscles, sprains, dislocations and fractures). For
injuries statistical analysis, it was decided to consider each person’s most severe fall
(the fall that resulted in the most severe injury).
Binary logistic regressions29 were used to identify predictor variables of falls and related
severe injuries. In order to include all significant variables in the multivariate analysis,

Chapter 5
Role of physical activity in the occurrence of falls and injuries in community-dwelling adults over 50 years old
88
the most parsimonious model was determined. The Wald statistic was used to test the
significance of each variable and the Likelihood Ratio to compare each new model with
the previous one. The assumption of linearity in continuous variables was checked using
the logit function and the overall fit evaluated using the Hosmer-Lemeshow Goodness-
of-Fit Test. When correlations between variables were above 0.8, only the most
explanatory variable remained in the model. Outliers and influential points were
identified. Receiver operating characteristic (ROC) analysis was used to examine the
discriminative ability of the models used to predict falls and injuries. A cut-off point for
falls probability was established by maximizing both sensitivity and specificity 30.
Internal validation of the model was performed by resampling or cross-validation
procedure 31. For cross-validation participants were divided into 10 equal groups by
sampling randomly without replacement.
In order to identify possible cut-off values, age and the number of falls were categorized
in different forms. It was studied the significance of each of these new variables in the
regression models. Physical activity values were presented as 100 MET-min/wk in
order to interpret the data from regression analysis.
Complementary analysis was performed using either the Pearson test or the Spearman
Correlation tests. Statistical analyses were performed with SPSS version 17.0,
considering statistical significance to be p <.05.
RESULTS
Falls occurrence
One hundred and fifty-eight subjects (31.2%) fell in the previous 12 months, for 298
falls. Sixty-three of the falls had no consequences. The other falls resulted in 25
fractures, 10 dislocations, 14 sprains, 3 torn muscles, 5 strains, 15 serious abrasions, 93
edemas, and 128 light scratches. Of the 158 fallers, 108 were classified as light and 50
as severe fallers, considering each participant’s most severe fall-related injury.
Fallers had poorer values than non-fallers participants for almost all variables (Tables 1
and 2). The exceptions were some physical activity (moderate, vigorous and total),
body composition (body mass, BMI, waist circumference), and flexibility (lower body)
variables.

Chapter 5
Role of physical activity in the occurrence of falls and injuries in community-dwelling adults over 50 years old
89
Table 1. Subjects characteristics: age, education, health, fear of falling, environment hazards, and physical activity according falls and severe injuries occurrence.
Participants
p-value
Fallers
p-value
Non-fallers
(n = 348)
Fallers
(n =158)
No/light injury
(n =108)
Severe injury
(n =50)
Age (yrs) 67.5±6.8 69.6±6.6 .001 69.5±6.9 69.8±6.2 .787
Education (yrs) 7.0 ±4.2 5.3±4.0 <.001 5.2±3.7 5.5±4.7 .764
Co-morbidities (n) 2.9±2.1 4.3±2.6 <.001 4.2±2.6 4.5±2.6 .553
Fear of falling (point) 1.6±2.4 4.0±4.5 <.001 3.4±3.8 5.2±5.6 .050
Environmental hazards (n) 5.3±2.6 6.3±2.8 <.001 6.0±2.7 7.0±3.1 .035
Walking (MET-min/wk) 778±573 669±508 .039 635±438 741±633 .225
Moderate-PA ( MET-min/wk) 2009±1308 1818±1131 .114 1767±1107 1928±1187 .407
Vigorous PA ( MET-min/wk) 192±637 225±931 .636 226±1011 224±739 .990
Total PA (MET-min/wk) 2979±1628 2712±1815 .100 2628±1816 2893±1817 .395
PA level (% of participants)
Low
Moderate
High
52.0
65.6
71.0
48.0
34.4
29.0
.095
50.0
81.0
65.4
50.0
19.0
34.6
.068
Falls (n) --- 1.89 ±1.63 --- 1.7±1.5 2.3±1.9 .074
Gender (% of participants)
Females
Males
66.2
77.6
33.8
22.4
.020
68.9
65.4
31.1
34.6
.722
Data are mean ± standard deviation or percentage of participants in each physical activity or gender categories. PA: Physical activity.
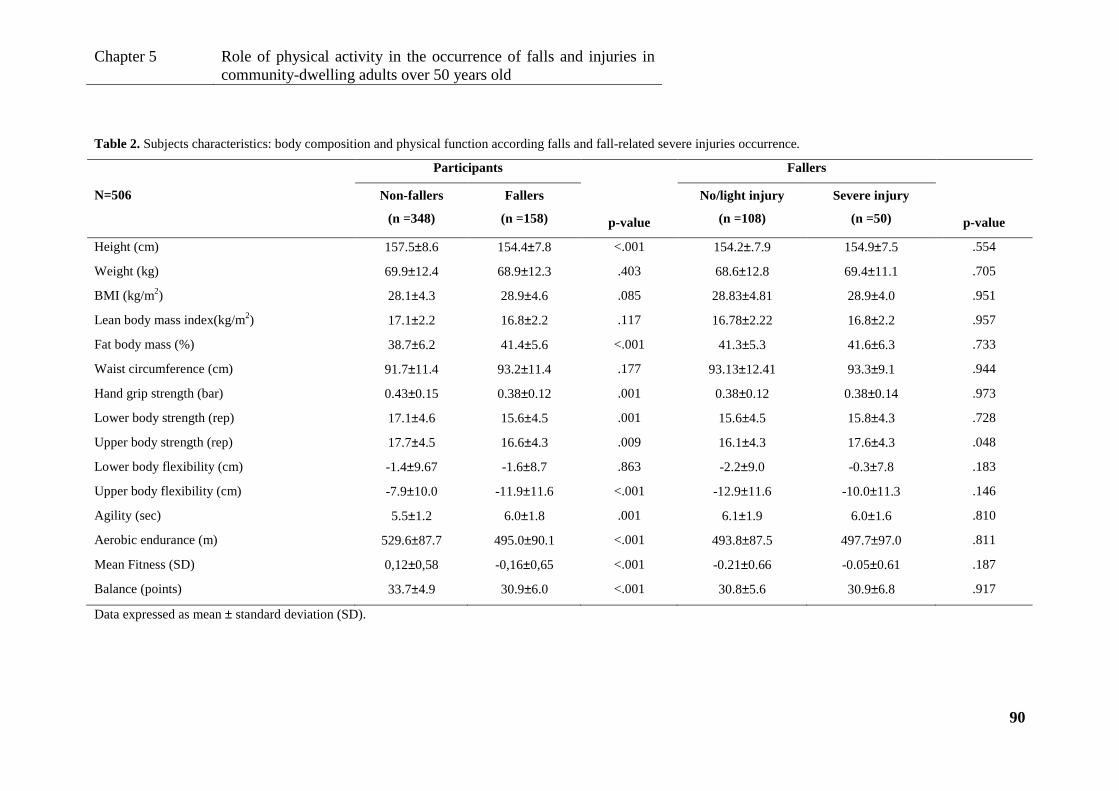
Chapter 5
Role of physical activity in the occurrence of falls and injuries in community-dwelling adults over 50 years old
90
Table 2. Subjects characteristics: body composition and physical function according falls and fall-related severe injuries occurrence.
N=506
Participants Fallers
p-value
Non-fallers
(n =348)
Fallers
(n =158) p-value
No/light injury
(n =108)
Severe injury
(n =50)
Height (cm) 157.5±8.6 154.4±7.8 <.001 154.2±.7.9 154.9±7.5 .554
Weight (kg) 69.9±12.4 68.9±12.3 .403 68.6±12.8 69.4±11.1 .705
BMI (kg/m2) 28.1±4.3 28.9±4.6 .085 28.83±4.81 28.9±4.0 .951
Lean body mass index(kg/m2) 17.1±2.2 16.8±2.2 .117 16.78±2.22 16.8±2.2 .957
Fat body mass (%) 38.7±6.2 41.4±5.6 <.001 41.3±5.3 41.6±6.3 .733
Waist circumference (cm) 91.7±11.4 93.2±11.4 .177 93.13±12.41 93.3±9.1 .944
Hand grip strength (bar) 0.43±0.15 0.38±0.12 .001 0.38±0.12 0.38±0.14 .973
Lower body strength (rep) 17.1±4.6 15.6±4.5 .001 15.6±4.5 15.8±4.3 .728
Upper body strength (rep) 17.7±4.5 16.6±4.3 .009 16.1±4.3 17.6±4.3 .048
Lower body flexibility (cm) -1.4±9.67 -1.6±8.7 .863 -2.2±9.0 -0.3±7.8 .183
Upper body flexibility (cm) -7.9±10.0 -11.9±11.6 <.001 -12.9±11.6 -10.0±11.3 .146
Agility (sec) 5.5±1.2 6.0±1.8 .001 6.1±1.9 6.0±1.6 .810
Aerobic endurance (m) 529.6±87.7 495.0±90.1 <.001 493.8±87.5 497.7±97.0 .811
Mean Fitness (SD) 0,12±0,58 -0,16±0,65 <.001 -0.21±0.66 -0.05±0.61 .187
Balance (points) 33.7±4.9 30.9±6.0 <.001 30.8±5.6 30.9±6.8 .917
Data expressed as mean ± standard deviation (SD).
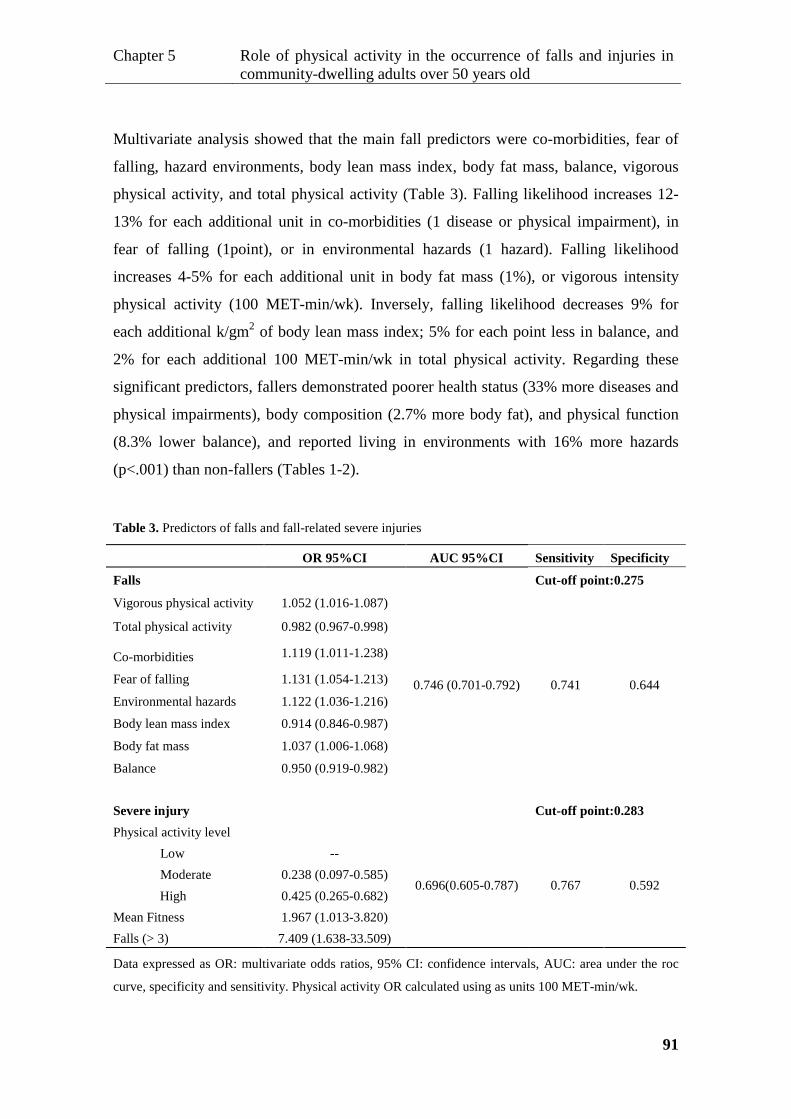
Chapter 5
Role of physical activity in the occurrence of falls and injuries in community-dwelling adults over 50 years old
91
Multivariate analysis showed that the main fall predictors were co-morbidities, fear of
falling, hazard environments, body lean mass index, body fat mass, balance, vigorous
physical activity, and total physical activity (Table 3). Falling likelihood increases 12-
13% for each additional unit in co-morbidities (1 disease or physical impairment), in
fear of falling (1point), or in environmental hazards (1 hazard). Falling likelihood
increases 4-5% for each additional unit in body fat mass (1%), or vigorous intensity
physical activity (100 MET-min/wk). Inversely, falling likelihood decreases 9% for
each additional k/gm2 of body lean mass index; 5% for each point less in balance, and
2% for each additional 100 MET-min/wk in total physical activity. Regarding these
significant predictors, fallers demonstrated poorer health status (33% more diseases and
physical impairments), body composition (2.7% more body fat), and physical function
(8.3% lower balance), and reported living in environments with 16% more hazards
(p<.001) than non-fallers (Tables 1-2).
Table 3. Predictors of falls and fall-related severe injuries
OR 95%CI AUC 95%CI Sensitivity Specificity
Falls Cut-off point:0.275
Vigorous physical activity 1.052 (1.016-1.087)
0.746 (0.701-0.792) 0.741 0.644
Total physical activity 0.982 (0.967-0.998)
Co-morbidities 1.119 (1.011-1.238)
Fear of falling 1.131 (1.054-1.213)
Environmental hazards 1.122 (1.036-1.216)
Body lean mass index 0.914 (0.846-0.987)
Body fat mass 1.037 (1.006-1.068)
Balance 0.950 (0.919-0.982)
Severe injury Cut-off point:0.283
Physical activity level
Low
Moderate
High
--
0.238 (0.097-0.585)
0.425 (0.265-0.682) 0.696(0.605-0.787) 0.767 0.592
Mean Fitness 1.967 (1.013-3.820)
Falls (> 3) 7.409 (1.638-33.509)
Data expressed as OR: multivariate odds ratios, 95% CI: confidence intervals, AUC: area under the roc
curve, specificity and sensitivity. Physical activity OR calculated using as units 100 MET-min/wk.
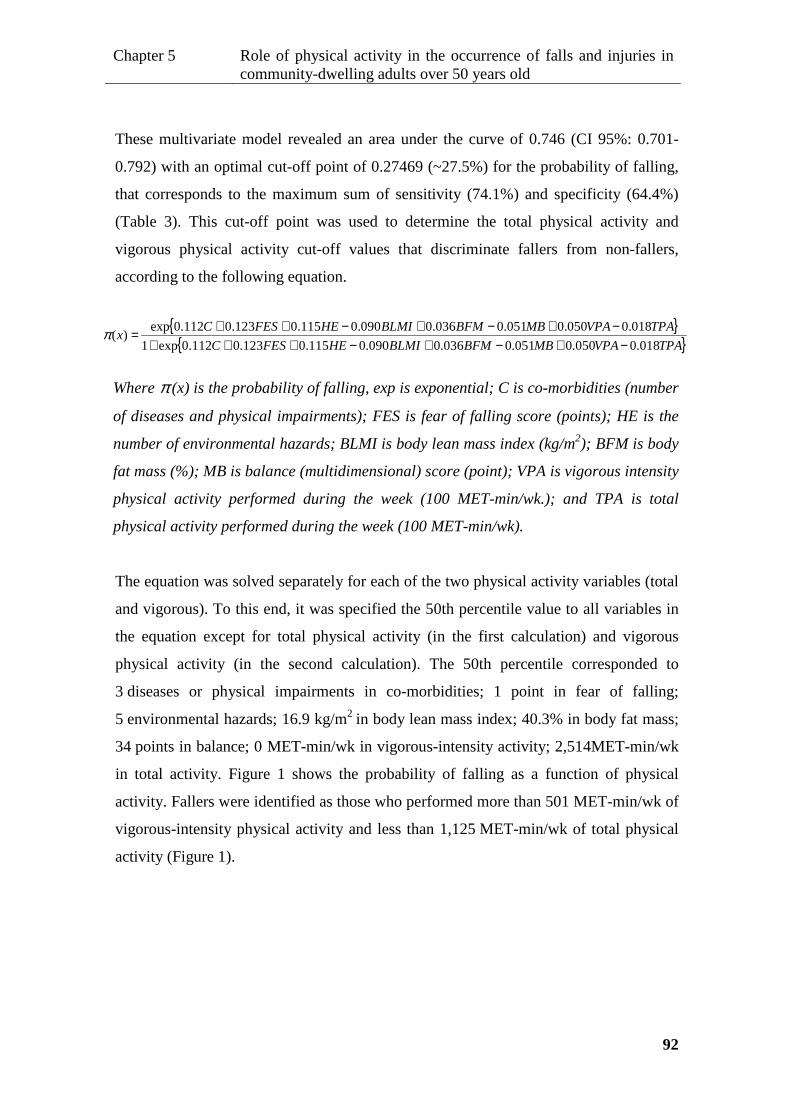
Chapter 5
Role of physical activity in the occurrence of falls and injuries in community-dwelling adults over 50 years old
92
These multivariate model revealed an area under the curve of 0.746 (CI 95%: 0.701-
0.792) with an optimal cut-off point of 0.27469 (~27.5%) for the probability of falling,
that corresponds to the maximum sum of sensitivity (74.1%) and specificity (64.4%)
(Table 3). This cut-off point was used to determine the total physical activity and
vigorous physical activity cut-off values that discriminate fallers from non-fallers,
according to the following equation.
Where π (x) is the probability of falling, exp is exponential; C is co-morbidities (number
of diseases and physical impairments); FES is fear of falling score (points); HE is the
number of environmental hazards; BLMI is body lean mass index (kg/m2); BFM is body
fat mass (%); MB is balance (multidimensional) score (point); VPA is vigorous intensity
physical activity performed during the week (100 MET-min/wk.); and TPA is total
physical activity performed during the week (100 MET-min/wk).
The equation was solved separately for each of the two physical activity variables (total
and vigorous). To this end, it was specified the 50th percentile value to all variables in
the equation except for total physical activity (in the first calculation) and vigorous
physical activity (in the second calculation). The 50th percentile corresponded to
3 diseases or physical impairments in co-morbidities; 1 point in fear of falling;
5 environmental hazards; 16.9 kg/m2 in body lean mass index; 40.3% in body fat mass;
34 points in balance; 0 MET-min/wk in vigorous-intensity activity; 2,514MET-min/wk
in total activity. Figure 1 shows the probability of falling as a function of physical
activity. Fallers were identified as those who performed more than 501 MET-min/wk of
vigorous-intensity physical activity and less than 1,125 MET-min/wk of total physical
activity (Figure 1).
{ }{ }TPAVPAMBBFMBLMIHEFESC
TPAVPAMBBFMBLMIHEFESCx
018.0050.0051.0036.0090.0115.0123.0112.0exp1
018.0050.0051.0036.0090.0115.0123.0112.0exp)(
−+−+−+++−+−+−++=π

Chapter 5
Role of physical activity in the occurrence of falls and injuries in community-dwelling adults over 50 years old
93
Physical activity (MET-min/wk)
0 500 1000 1500 2000 2500
Fal
ling
prob
abili
ty (
ππ ππ)
Vigorous intensity physical activityTotal physical activityCut-off
Figure 1. Fall probability as a function of habitual total, and vigorous-intensity physical activity
performed during the week. This graph shows cut-off values for total and for vigorous-intensity physical
activity (1,125 MET-min/wk and 501MET-min/wk, respectively) that discriminate fallers from non-
fallers.
Fall-related injuries
Fallers participants with severe injuries reported 26.9% more fear of falling, 14.3%
more hazards in indoor and outdoor environment, and to be 8.5% stronger in upper
body than fallers participants without severe injuries (Tables 1 and 2). Additionally,
those who fell more than three times suffered severe injuries 46.9% more frequently
than those who fell three or less times (p<.05).
Multivariate regression analyses showed that the significant predictor for fall-related
severe injuries were fitness, falling more than three times, and physical activity level
(Table 3). The likelihood of occurrence of severe fall-related injuries increased 96.8%
for each additional standard deviation of mean fitness. For those who fell more than
three times, the likelihood of severe injury was almost 7.5 times higher. Finally,
multivariate regression analyses showed that the likelihood of the occurrence of severe
fall-related injuries for moderate physical activity level decreases 76.2% relative to
those classified as low level in physical activity level, and 57.5% for those classified as
high in physical activity level relative to those classified as low level (Figure 2).
Fallers Non-fallers 0.2
0.4
0.6
0.8
Chapter 5
Role of physical activity in the occurrence of falls and injuries in community-dwelling adults over 50 years old
94
Moderate PA level High PA level
Sev
ere
Inju
ry P
ossi
bilit
y (
%)
-100
-80
-60
-40
-20
0
Figure. 2. Severe injury likelihood according to physical activity (PA) level. This graph quantifies the
decrease in the likelihood of fall-related severe injuries in people with moderate (less 76%) and high (less
58%) physical activity levels relative to people with low physical activity level (considered as reference).
DISCUSSION
The main purpose of this study was to analyze the role of physical activity (amount and
intensity) in falls and related injuries, after adjustment for physical function, body
composition, fear of falling, and environmental hazards. The results showed that the
total amount of physical activity did not promote falls occurrence. However, the
probability of fall increased with vigorous physical activity. Total physical activity of at
least 1,125 MET-min/wk with no more than 501 MET-min/wk (i.e., less than ~1 hr/wk)
of vigorous intensity significantly reduced falls. This total physical activity amount is
more than double the lowest value recommended for older people for general health
benefits (i.e., 150 min/wk × 3 MET: 450 MET-min/wk) of moderate intensity 12, 21, 32.
Furthermore, physical activity also seems to influence fall-related injuries. Being active,
particularly moderately active, decreased severe fall-related injuries, possibly because
fall occurred less often (i.e., the opportunity for injury is reduced), and/or, the resistance
to fall impact might be improved when fall occurs 33. In this study, falling more than
three times a year increases exponentially the risk for severe injury. Old people that are

Chapter 5
Role of physical activity in the occurrence of falls and injuries in community-dwelling adults over 50 years old
95
highly active are less prone to fall-related injury than those who are most inactive.
However, the moderately active participants had the lowest risk. Most of the studies
about falls related injuries focus on fractures and points bone mineral density as a major
risk factor, recommending regular exercise as preventive measure 34. Only a few
researches begun to focusing on other fall-related injuries and physical activity, such as
the study of Gill et al. 17 that founded a positive association between injurious falls and
lower subsequent household physical activity but a negative association between
injurious falls and higher recreational physical activity.
Total physical activity reduces fall probability because it improves the individual’s
capacity to perform tasks 35, even in more frailty people - with low levels of health (high
co-morbidities), body composition and balance, and with a high fear of falling score.
Total physical activity implies the inclusion of different types of activity, namely
walking, moderate and vigorous. In this study, an increase of 100 MET-min/wk on total
physical activity, measured by IPAQ, led to 2% decrease in the risk of one or more falls.
Peeters et al. 36 reported a 4% decrease in the risk of recurrent falling for each 100
MET-min/wk on total physical activity measured by LASA Physical Activity
Questionnaire. Moreover, vigorous physical activity reduced the risk of falls only up to
the threshold defined above, by increasing total activity. Nevertheless, vigorous
physical activity increased the risk of falls (5% for each 100 MET-min/wk), most likely
because at higher physical activity levels (e.g. farming), the tasks are more demanding 4.
This may help to understand why either inactivity or excessive physical activity
promoted the increase of reported falls in other studies, 14, 15 particularly when heavy
tasks were involved, like sports 16.
The main intrinsic fall risk factors affecting an individual’s ability to perform physical
tasks successfully (without falling) were the fear of falling (OR:13.1%), co-morbidities
(OR:11.9%), body fat (OR:3.7%) and lean mass (OR:8.6%), and balance (OR:5.0%).
Fear of falling has been considered a risk factor for falling and consequent injuries 27, 37.
However, in this study, it was observed that people with more fear of falling avoid more
risk-prone daily tasks, like going up and down stairs or getting objects out of cupboards
and wardrobes. Moreover, they also performed less total physical activity, had reduced
physical function and had more diseases and physical impairments (p<.001), besides
falling more and suffering more severe injuries as also noted by others 10, 11. These
results suggest that, mostly, fear of falling works as a self-perceived risk of falling due
Chapter 5
Role of physical activity in the occurrence of falls and injuries in community-dwelling adults over 50 years old
96
to frailty and previous experience of falling and injury (a protective device) and less as a
real risk factor for falling and consequent injury.
As the number of hazard conditions increases, the possibility of falling usually
augments 27, 28. Data from multivariate regression analysis revealed, nevertheless, that
fall probability is reduced when older people are healthier and fitter and they do not fall
as often as younger unhealthier and unfitted persons, even when living in environments
that are more hazardous. This reinforces recommendation of Nitz & Choy 9 for
prevention interventions in middle-age as well in older ages. In fact, extrinsic risk
factors (environment) appear to contribute to falls particularly in the presence of
intrinsic risk factors (co-morbidities, decreased balance, and poor body composition). In
general, good fitness appears to reduce the severity of fall-related injuries 38, probably
because fit subjects react during the fall, thereby reducing the impact. On the other
hand, for fallers, higher fitness may contribute to more severe fall-related injuries since
it has been observed that high-fitness participants were more confident and put
themselves in situations that are more dangerous. It was observed a positive correlation
between fitness score and number of falls when performing high-difficulty tasks
(r=0.179; p=.033, n=158).
Limitations of this study include the sample size regarding those who fell and suffered
injuries (and therefore the sample’s statistical power to predict the severity of fall-
related injuries), and the relatively small number of men compared to women since
some authors points gender as a moderator of falls and consequent injuries 39. The use
of the number of diseases and physical impairment to analyses health status influence
may be questionable because a disease as epilepsy obviously predisposes to falls more
than asthma. However, the significance of each disease and physical impairment in the
regression analysis was tested and “co-morbidities” was the variable that best explained
the occurrence of falls. This methodology has already been used in similar studies 9.
Additionally it was considered acceptable to use a retrospective recall to assess the falls
and injuries in the last 12 months, given that it was required a normal cognitive function
to all participants and the circumstances surrounding each fall and their consequences
were described in detail. Still, it is possible an underestimation of the number of falls
that occurred in this period. Unlike other works that focused exclusively in recurrent
fallers 27 the present study integrates one-time fallers showing yet a similar
discrimination capacity for falls (AUC: 0.746, CI 95%: 0.701-0.792). Further, the

Chapter 5
Role of physical activity in the occurrence of falls and injuries in community-dwelling adults over 50 years old
97
predicted probabilities that were generated with the cross-validation procedure had a
similar AUC (0.723, 95% CI: 0.675 - 0.771). A major limitation of this investigation
was the evaluation of physical activity by questionnaire because the use of this method
tends to overestimate the amounts of physical activity 40. Moreover, the relationship
between current physical activity and the retrospective reports of fall and injuries was
explored cross-sectional. However, the inherent error associated with this design has
been minimized because participants reported maintaining their physical activity over
the previous year, as well as their health status, weight and environmental hazards.
Furthermore, subjects that suffer from recent illnesses or disabilities resulting in a
temporary loss of physical function were excluded from the study.
CONCLUSION
Increasing total physical activity do not promote falls whereas vigorous physical
activity exceeding 500 MET-min/wk seems to increases the occurrence of falls.
Physical activity appears to be especially important in reducing the consequences of
falls. Being sufficiently active reduces falls and provides protection against severe
injuries when falls occur. Reduced co-morbidities, a good body composition and
physical function, principally balance, improve the ability to perform physical task
without falling, even in environments that are more hazardous. Nevertheless, a good
physical function may not provide protection against severe fall-related injuries. Thus,
at least 1,125 MET-min/wk of total physical activity with no more than 500 MET-
min/wk of vigorous-intensity activity appears to reduce falls and fall-related injuries.
Acknowledgments
The authors thank all the volunteers who participated in this study.
Conflict of interest statement
The authors declare that there is no conflict of interest.
Portuguese Science and Technology Foundation (PhD grant SFRH/BD/31450/2006)
provided financial support to conduct this study.
The sponsors had no role in the design, analysis, or preparation of this manuscript.
Chapter 5
Role of physical activity in the occurrence of falls and injuries in community-dwelling adults over 50 years old
98
REFERENCES
1. Hogan DB, MacDonald FA, Betts J, Bricker S, Ebly EM, Delarue B et al. A
randomized controlled trial of a community-based consultation service to prevent falls.
CMAJ 2001;165(5):537-43.
2. Tucker MG, Kavanagh JJ, Morrison S, Barrett RS. What are the relations
between voluntary postural sway measures and falls-history status in community-
dwelling older adults? Arch Phys Med Rehabil 2010;91(5):750-8.
3. St George RJ, Fitzpatrick RC, Rogers MW, Lord SR. Choice stepping response
and transfer times: effects of age, fall risk, and secondary tasks. J Gerontol A Biol Sci
Med Sci 2007;62(5):537-42.
4. Glazier PS, Davids K. Constraints on the complete optimization of human
motion. Sports Med 2009;39(1):15-28.
5. Rikli R, Jones CJ. Functional fitness normative scores for community-residing
older adults. J Aging Phys Act 1999;7:160-79.
6. de Rekeneire N, Visser M, Peila R, Nevitt MC, Cauley JA, Tylavsky FA et al. Is
a fall just a fall: correlates of falling in healthy older persons. The Health, Aging and
Body Composition Study. J Am Geriatr Soc 2003;51(6):841-6.
7. WHO. World Health Statistics 2011. [25 August 2011] Available from:
http://www.who.int/whosis/whostat/EN_WHS2011_Full.pdf.
8. Kannus P, Niemi S, Palvanem M, Parkkari J. Rising incidence of fall-induced
injuries among elderly adults. J Public Health 2005;13:212-5.
9. Nitz JC, Choy NL. Falling is not just for older women: support for pre-emptive
prevention intervention before 60. Climacteric 2008;11(6):461-6.
10. Boyd R, Stevens JA. Falls and fear of falling: burden, beliefs and behaviours.
Age Ageing 2009;38(4):423-8.
11. Gaxatte C, Nguyen T, Chourabi F, Salleron J, Pardessus V, Delabriere I et al.
Fear of falling as seen in the Multidisciplinary falls consultation. Ann Phys Rehabil
Med 2011;54(4):248-58.
12. Chodzko-Zajko WJ, Proctor DN, Fiatarone Singh MA, Minson CT, Nigg CR,
Salem GJ et al. American College of Sports Medicine position stand. Exercise and
physical activity for older adults. Med Sci Sports Exerc 2009;41(7):1510-30.
Chapter 5
Role of physical activity in the occurrence of falls and injuries in community-dwelling adults over 50 years old
99
13. Sherrington C, Whitney JC, Lord SR, Herbert RD, Cumming RG, Close JC.
Effective exercise for the prevention of falls: a systematic review and meta-analysis. J
Am Geriatr Soc 2008;56(12):2234-43.
14. Chan BK, Marshall LM, Winters KM, Faulkner KA, Schwartz AV, Orwoll ES.
Incident fall risk and physical activity and physical performance among older men: the
Osteoporotic Fractures in Men Study. Am J Epidemiol 2007;165(6):696-703.
15. Gregg EW, Cauley JA, Seeley DG, Ensrud KE, Bauer DC. Physical activity and
osteoporotic fracture risk in older women. Study of Osteoporotic Fractures Research
Group. Ann Intern Med 1998;129(2):81-8.
16. Peeters GM, Verweij LM, van Schoor NM, Pijnappels M, Pluijm SM, Visser M
et al. Which types of activities are associated with risk of recurrent falling in older
persons? J Gerontol A Biol Sci Med Sci 2010;65(7):743-50.
17. Gill DP, Zou GY, Jones GR, Speechley M. Injurious falls are associated with
lower household but higher recreational physical activities in community-dwelling older
male veterans. Gerontology 2008;54(2):106-15.
18. Choi YS, Lawler E, Boenecke CA, Ponatoski ER, Zimring CM. Developing a
multi-systemic fall prevention model, incorporating the physical environment, the care
process and technology: a systematic review. J Adv Nurs (in press).
19. Michael YL, Whitlock EP, Lin JS, Fu R, O'Connor EA, Gold R. Primary care-
relevant interventions to prevent falling in older adults: a systematic evidence review for
the U.S. Preventive Services Task Force. Ann Intern Med 2010;153(12):815-25.
20. Folstein MF, Folstein SE, McHugh PR. "Mini-mental state". A practical method
for grading the cognitive state of patients for the clinician. J Psychiatr Res
1975;12(3):189-98.
21. Craig CL, Marshall AL, Sjostrom M, Bauman AE, Booth ML, Ainsworth BE et
al. International physical activity questionnaire: 12-country reliability and validity. Med
Sci Sports Exerc 2003;35(8):1381-95.
22. Rikli R, Jones CJ. Development and validation of a functional fitness test for
community-residing older adults. J Aging Phys Act 1999;7(2):129-61.
23. Owsley C, Sloane M, McGwin G, Jr., Ball K. Timed instrumental activities of
daily living tasks: relationship to cognitive function and everyday performance
assessments in older adults. Gerontology 2002;48(4):254-65.
Chapter 5
Role of physical activity in the occurrence of falls and injuries in community-dwelling adults over 50 years old
100
24. Rose DJ, Lucchese N, Wiersma LD. Development of a multidimensional
balance scale for use with functionally independent older adults. Arch Phys Med
Rehabil 2006;87(11):1478-85.
25. Zaluska W, Malecka T, Mozul S, Ksiazek A. [Whole body versus segmental
bioimpedance measurements (BIS) of electrical resistance (Re) and extracellular
volume (ECV) for assessment of dry weight in end-stage renal patients treated by
hemodialysis]. Przegl Lek 2004;61(2):70-3.
26. Tinetti M, Richman D, Powell L. Falls efficacy as a measure of fear of falling. J
Gerontol 1990;45(6):P239-43.
27. Pluijm SM, Smit JH, Tromp EA, Stel VS, Deeg DJ, Bouter LM et al. A risk
profile for identifying community-dwelling elderly with a high risk of recurrent falling:
results of a 3-year prospective study. Osteoporos Int 2006;17(3):417-25.
28. Tinetti ME, Speechley M, Ginter SF. Risk factors for falls among elderly
persons living in the community. N Engl J Med 1988;319(26):1701-7.
29. Hosmer D, Lemeshow S. Applied Logistic Regression. 2nd Ed. New York:
Wiley 2000.
30. Scholtissen S, Guillemin F, Bruyere O, Collette J, Dousset B, Kemmer C et al.
Assessment of determinants for osteoporosis in elderly men. Osteoporos Int 2008;
20(7): 1157-1166.
31. Efron B, Tibshirani R. An introduction to the bootstrap. Chapman and Hall:
Boca Raton; 1993.
32. Kesaniemi A, Riddoch CJ, Reeder B, Blair SN, Sorensen T. Advancing the
future of physical activity guidelines in Canada: an independent expert panel
interpretation of the evidence. Int J Behav Nutr Phys Act 2010;7:41.
33. Rose DJ. Preventing falls among older adults: no "one size suits all" intervention
strategy. J Rehabil Res Dev 2008;45(8):1153-66.
34. Kannus P, Sievanen H, Palvanen M, Jarvinen T, Parkkari J. Prevention of falls
and consequent injuries in elderly people. Lancet 2005;366(9500):1885-93.
35. Wijlhuizen GJ, Chorus AM, Hopman-Rock M. The FARE: a new way to
express FAlls Risk among older persons including physical activity as a measure of
exposure. Prev Med 2010;50(3):143-7.
Chapter 5
Role of physical activity in the occurrence of falls and injuries in community-dwelling adults over 50 years old
101
36. Peeters GM, van Schoor NM, Pluijm SM, Deeg DJ, Lips P. Is there a U-shaped
association between physical activity and falling in older persons? Osteoporos Int
2010;21(7):1189-95.
37. Lloyd BD, Williamson DA, Singh NA, Hansen RD, Diamond TH, Finnegan TP
et al. Recurrent and injurious falls in the year following hip fracture: a prospective study
of incidence and risk factors from the Sarcopenia and Hip Fracture study. J Gerontol A
Biol Sci Med Sci 2009;64(5):599-609.
38. Bergland A, Wyller TB. Risk factors for serious fall related injury in elderly
women living at home. Inj Prev 2004;10(5):308-13.
39. Yeo YY, Lee SK, Lim CY, Quek LS, Ooi SB. A review of elderly injuries seen
in a Singapore emergency department. Singapore Med J 2009;50(3):278-83.
40. Welk G. Physical Activity Assessments for Health-Related Research.
Champaign: Human Kinetics; 2002.
Chapter 6 Associations between falls, fall-related injuries, fear of falling and disability in activities of daily living in adults over 55 years old
102
CHAPTER 6
ASSOCIATIONS BETWEEN FALLS, FALL-RELATED INJURIES, FEAR OF
FALLING AND DISABILITY IN ACTIVITIES OF DAILY LIVIN G IN ADULTS
OVER 55 YEARS OLD 5
_______________________________ 5 Pereira C, Baptista F. Associations between falls, fall-related injuries, fear of falling and disability in
activities of daily living in adults over 55 years old.2011 (in submission)
Chapter 6 Associations between falls, fall-related injuries, fear of falling and disability in activities of daily living in adults over 55 years old
103
ABSTRACT
Objective: To analyze associations between falls, injuries, fear of falling (FF) and
disability in activities of daily living (ADL).
Design: Cross-sectional
Setting: Community
Participants: Community-dwelling persons (N=506, aged 68.2±6.9).
Main outcome measures: Falls, injuries, FF, and ADLs disability evaluated by using
questionnaires adjusted for potential confounders - co-morbidities, physical activity,
fitness and body composition, evaluated by the International Physical Activity
Questionnaire, the Senior Fitness Test, and bioimpedance, respectively.
Results: Multinomial regression showed that fall-related severe injuries and FF
increased by 6 to 7 times, respectively, the likelihood of ADLs disability (P<.05).
Binary logistic regression revealed that the likelihood of disability increased with FF,
particularly in advanced and instrumental ADLs (OR: 2-3, P<.05), and with the
occurrence of fall-related severe injuries in some instrumental ADLs (OR: 3-4, P<.05).
Conclusions: FF was shown to be a higher risk factor for disability than falls, even with
serious injuries, restricting the performance of ADLs. Regarding these risk factors,
disability seems to occur mainly in advanced and more demanding instrumental ADLs
than basic ADLs. Consequently, the implementation of prevention programs should
increase subjects' self-confidence through the successful accomplishment of functional
exercises that mimic ADLs and are not just focused on fitness (aerobic, muscular or
neuro-motor) exercises.
Key words: Activities of daily living; Falls; Injuries; Fear of falling; Elderly
Chapter 6 Associations between falls, fall-related injuries, fear of falling and disability in activities of daily living in adults over 55 years old
104
INTRODUCTION
Falls and fall-related injuries have been reported as a major restrictive factor for
autonomy, and, where death does not occur, may become the main reason for the
institutionalization of elderly people 1, 2. Not only the physical but also the
psychological consequences of falls, namely fear of falling, restrict activities of daily
living (ADLs) which result in loss of autonomy and dependence 3, 4. ADLs include
basic activities (BADLs) of hygiene, personal care, and getting around inside;
instrumental activities (IADLS) cover activities necessary for residing in the community
such as using transportation, shopping, preparing meals, and paying bills; and advanced
activities (AADLs) comprise more demanding and non-survival type activities that
enrich life, namely social, religious or leisure activities 5, 6.
For old people that live independently in the community, besides the maintenance of
BADLs that allow them to remain non-institutionalized, it is also important to maintain
those activities that enable enjoyment of life independently with a degree of quality7,
especially if life expectancy is high 8. Thus, performing IADLs and AADLs is a
determining issue for successful aging 9.
Some factors affecting the ability to perform ADLs are similar to those that are
considered to be risk factors for falls and fall-related injuries 10-12. Most of them are
associated with the subject's intrinsic factors, such as age, co-morbidities, physical
fitness, body composition, fear of falling, and, among frailer and institutionalized
individuals, cognition status 13, 14. Habitual physical activity has also been pointed to as
a key element in the ability to perform ADLs 15, 16, as well as in the occurrence of falls
and fall-related injuries 17-19, probably mediated by body composition and physical
fitness improvement. However, it is essential to determine the relative contribution of
falls, fall-related injuries and fear of falling in overall physical functioning or
disability 20 and, therefore, in the loss of autonomy and, particularly, in the disability of
the ADLs category (AADLs vs. IADLs vs. BADLs). Mainly because the majority of the
studies did not control for potential confounders, in particular to intrinsic and extrinsic
risk factors. This approach will allow more appropriate measures either to prevent or to
reverse loss of autonomy. Thus, the aim of this study is to analyze associations between
falls and their consequences (injuries and fear of falling) and the disability of
Chapter 6 Associations between falls, fall-related injuries, fear of falling and disability in activities of daily living in adults over 55 years old
105
community-dwelling adults over 50 years old in the performance of ADLs, adjusted for
potential physical activity/fitness confounders.
METHODS
Participants
The participants were 588 community-dwelling persons, aged 55 years and over (464
women: 67.8±6.8 years and 124 men: 69.6±6.5 years), of which 31% had fallen in the
previous 12 months, 9% had suffered fall-related severe injuries, and 76% had exercised
at least twice a week in the previous year. Participants were recruited by invitation and
in response to leaflets and posters distributed in community settings (health centers,
recreational, sports and cultural associations, universities for seniors, etc.). Participation
in the study required the absence of dementia, in accordance with the Folstein Mini-
Mental State Examination 21. Subjects that had suffered recent illnesses resulting in a
temporary loss of physical fitness or dependence were excluded. Forty-nine respondents
were excluded because they did not meet these criteria. Since many participants could
not read and write because have never attended school, an interviewer filled out the
questionnaires for all participants. All subjects were volunteers and provided informed
consent. The study was approved by the University’s Ethics Committee.
Outcome measures
ADL disability
Physical functioning level was determined by responses to the 12 items on the
Composite Physical Function (CPF) scale 20: Item 1. Take care of own personal needs -
like dressing yourself; Item 2. Bathe yourself, using tub or shower; Item 3. Climb up
and down a flight of stairs (like a second story in a house); Item 4. Walk outside (one or
two blocks); Item 5. Do light household chores – like cooking, dusting, washing dishes,
sweeping a walkway; Item 6. Shop for groceries or clothes; Item 7. Walk ½ mile (6-7
blocks); Item 8. Walk 1 mile (12-14 blocks); Item 9. Lift and carry 10 lb (full bag of
groceries); Item 10. Lift and carry 25 lb (medium to large suitcase); Item 11. Do heavy

Chapter 6 Associations between falls, fall-related injuries, fear of falling and disability in activities of daily living in adults over 55 years old
106
household activities – like scrubbing floors, vacuuming, raking leaves; Item 12. Do
strenuous activities – like hiking, digging in the garden, moving heavy objects, cycling,
aerobic dance activities, strenuous calisthenics, etc. Participants were asked to indicate
whether they could do the activity (score of 2), could do it with difficulty or with help
(score of 1), or could not perform the activity at all (score of 0). The total score ranges
from 0 to 24.
Respondents were categorized as having high functioning – with no disability (24
points); moderate functioning – moderate disability (18 to 23 points); or low
functioning – severe disability (less than 18 points). Functioning with regard to each of
the 12 itemized activities was also categorized dichotomously as follows: 'with no
disability' (can do) versus 'with disability' (cannot do or can do with difficulty or help).
Physical fitness and body composition
Lower and upper body strength (rep) and flexibility (cm), agility and dynamic balance
(sec), aerobic endurance (m) and body mass index (kg/m2) were evaluated by using the
Fullerton functional fitness test battery 22. Standing height (cm) was measured with a
stadiometer (Secca 770, Hamburg, Germany) and weight (kg) using an electronic scale
(Secca Bella 840, Hamburg, Germany). Multidimensional balance was evaluated by
conducting the ten tests associated with the Fullerton advanced balance (FAB) scale 23.
The final score, ranging from 0 to 40 points, was the sum of points obtained in each of
these ten tests, ranging from 0 (worst) to 4 (best). Fat body mass (%) was evaluated by
bioimpedance 24 (HBF-306C, Schaumburg, USA), and lean body mass index (kg/m2)
was calculated as [total body mass (kg) – fat body mass (kg)] / [body height 2 (m2)].
Physical activity
Habitual physical activity was assessed using the short version of the International
Physical Activity Questionnaire (IPAQ) 25. This questionnaire covers metabolic
expenditure (MET min/wk) on walking (3.3 MET), moderate (4.0 MET) and vigorous-
intensity activity (8.0 MET). Total metabolic expenditure (MET min/wk) was
calculated by determining the time (minutes/day) and frequency (days/week) spent on

Chapter 6 Associations between falls, fall-related injuries, fear of falling and disability in activities of daily living in adults over 55 years old
107
each of these activities. Physical exercise (hour/wk) was also assessed by means of a
questionnaire.
Fear of falling
Fear of falling was assessed by using the modified version of the Falls Efficacy Scale
(FES) 26, 27. Participants were asked how concerned they felt about falling while
performing each of ten everyday activities listed in FES. Each Item was rated on a
points scale from 0 (not concerned) to 3 (very concerned). The total score was the sum
of the points obtained in each of the tests for a range from 0 to 30. Fear of falling was
classified according to three categories (no fear of falling: FES score 0-1; vs. fear of
falling ±: FES score 2-3; vs. fear of falling +: FES score ≥4).
Falls, fall-related injuries, co-morbidities and education
Diseases, physical impairments, falls during the previous 12 months, fall-related injuries
and age were assessed by using a questionnaire. Participants listed a total of 24 chronic
diseases. Physical impairments included involuntary loss of urine, frequent dizziness,
foot problems, poor vision, hearing problems, and occasional loss of balance 27. The
presence or absence of each disease or physical impairment was checked for each
participant. The number of chronic diseases and physical impairments defined co-
morbidities. Injury severity was classified as light (no injury, light scratches and edema)
or severe (serious abrasion, strained muscles, torn muscles, sprains, dislocations and
fractures). The occurrence of falls and injuries was expressed by a dichotomy variable
(no fall/fall without injury or with light injury: injury − vs. fall with severe injury:
injury +).
Statistical analysis
Comparison of subjects’ characteristics between groups according to functioning level
in ADL (a – severe disability vs. b – moderate disability vs. c – no disability) was
performed by ANOVA followed by Bonferroni post hoc test to identify pairwise
differences. In the case of no homoscedasticity, comparisons between groups were

Chapter 6 Associations between falls, fall-related injuries, fear of falling and disability in activities of daily living in adults over 55 years old
108
carried out by conducting the Kruskal-Wallis test, followed by multiple simultaneous
examinations using the Mann-Whitney test. Comparisons of percentages (male/female;
low/moderate/high active; no fall/fall-related light injury/fall-related severe injury)
among groups were carried out using the Chi-Square test or Fisher's test. Multinomial
logistic regression was used to quantify the relative effect of fear of falling, falls, and
fall-related injuries (light and severe) on physical functioning disability (able vs.
moderately disabled vs. severely disabled). Analyses were adjusted for potential
confounders. Binary logistic regressions using the forward stepwise conditional method
were used to quantify the relative risk of fear of falling, falls, and fall-related injuries
(light and severe injuries) for disability for each of the 12 activities reported in the CPF
(able vs. disable). Adjustments were made for respective potential confounders.
Statistical analyses were performed by using SPSS version 17.0, and statistical
significance was set at P ≤ .05 for all tests.
RESULTS
The percentage of participants who could or could not do each of the 12 itemized
activities of the CPF is illustrated in Figure 1. Over 95% of subjects had no difficulty in
performing BADLs, and only ~1.5% reported difficulty in performing Item 1 and
Item 2. With regard to IADLs, the percentage of disabled subjects ranged from 4% in
relation to less demanding activities to 59% for more demanding activities. Disability in
performing advanced activities of daily living was reported by 39% of participants for
Item 11 and by 59% of participants for Item12.
The group of participants with severe disability was older and less healthy than the
group with moderate disability or with no disability (Table 1). In general, these
participants also had worse body composition and physical fitness, were more afraid of
falling, more likely to fall and to suffer injury, and were also less active. The group of
participants with no disability showed the best results for these variables (P<.05).
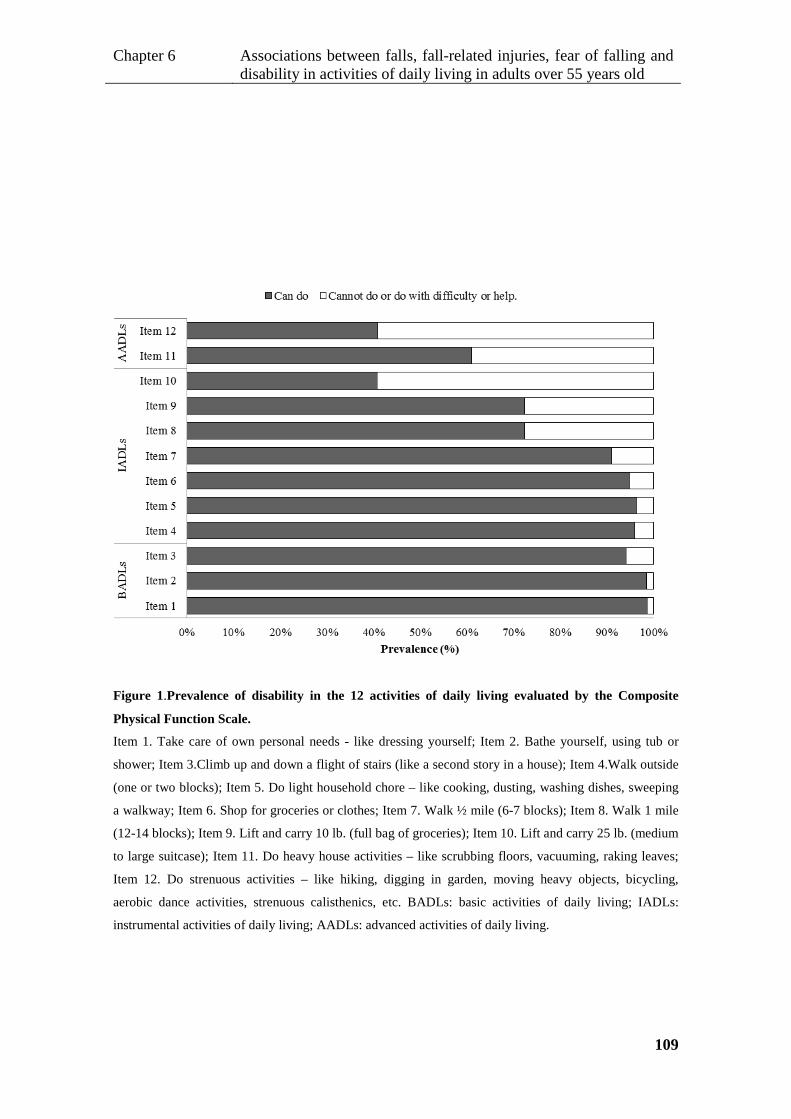
Chapter 6 Associations between falls, fall-related injuries, fear of falling and disability in activities of daily living in adults over 55 years old
109
Figure 1.Prevalence of disability in the 12 activities of daily living evaluated by the Composite
Physical Function Scale.
Item 1. Take care of own personal needs - like dressing yourself; Item 2. Bathe yourself, using tub or
shower; Item 3.Climb up and down a flight of stairs (like a second story in a house); Item 4.Walk outside
(one or two blocks); Item 5. Do light household chore – like cooking, dusting, washing dishes, sweeping
a walkway; Item 6. Shop for groceries or clothes; Item 7. Walk ½ mile (6-7 blocks); Item 8. Walk 1 mile
(12-14 blocks); Item 9. Lift and carry 10 lb. (full bag of groceries); Item 10. Lift and carry 25 lb. (medium
to large suitcase); Item 11. Do heavy house activities – like scrubbing floors, vacuuming, raking leaves;
Item 12. Do strenuous activities – like hiking, digging in garden, moving heavy objects, bicycling,
aerobic dance activities, strenuous calisthenics, etc. BADLs: basic activities of daily living; IADLs:
instrumental activities of daily living; AADLs: advanced activities of daily living.
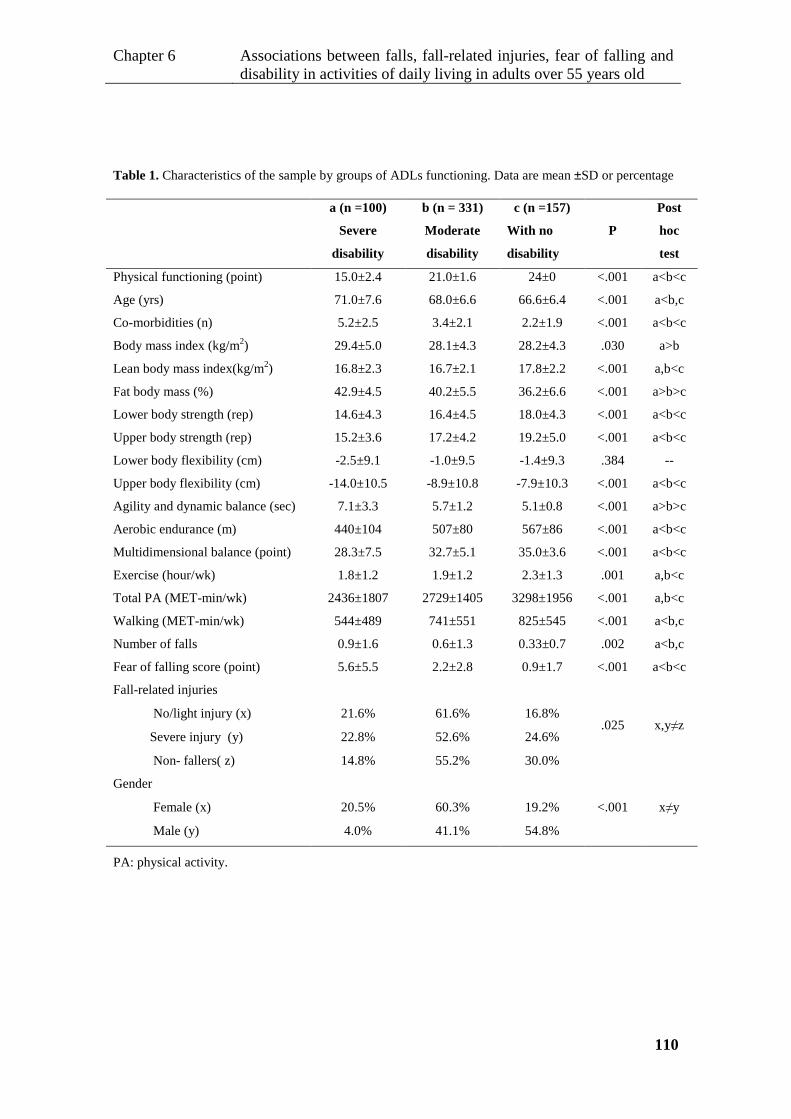
Chapter 6 Associations between falls, fall-related injuries, fear of falling and disability in activities of daily living in adults over 55 years old
110
Table 1. Characteristics of the sample by groups of ADLs functioning. Data are mean ±SD or percentage
a (n =100)
Severe
disability
b (n = 331)
Moderate
disability
c (n =157)
With no
disability
P
Post
hoc
test
Physical functioning (point) 15.0±2.4 21.0±1.6 24±0 <.001 a<b<c
Age (yrs) 71.0±7.6 68.0±6.6 66.6±6.4 <.001 a<b,c
Co-morbidities (n) 5.2±2.5 3.4±2.1 2.2±1.9 <.001 a<b<c
Body mass index (kg/m2) 29.4±5.0 28.1±4.3 28.2±4.3 .030 a>b
Lean body mass index(kg/m2) 16.8±2.3 16.7±2.1 17.8±2.2 <.001 a,b<c
Fat body mass (%) 42.9±4.5 40.2±5.5 36.2±6.6 <.001 a>b>c
Lower body strength (rep) 14.6±4.3 16.4±4.5 18.0±4.3 <.001 a<b<c
Upper body strength (rep) 15.2±3.6 17.2±4.2 19.2±5.0 <.001 a<b<c
Lower body flexibility (cm) -2.5±9.1 -1.0±9.5 -1.4±9.3 .384 --
Upper body flexibility (cm) -14.0±10.5 -8.9±10.8 -7.9±10.3 <.001 a<b<c
Agility and dynamic balance (sec) 7.1±3.3 5.7±1.2 5.1±0.8 <.001 a>b>c
Aerobic endurance (m) 440±104 507±80 567±86 <.001 a<b<c
Multidimensional balance (point) 28.3±7.5 32.7±5.1 35.0±3.6 <.001 a<b<c
Exercise (hour/wk) 1.8±1.2 1.9±1.2 2.3±1.3 .001 a,b<c
Total PA (MET-min/wk) 2436±1807 2729±1405 3298±1956 <.001 a,b<c
Walking (MET-min/wk) 544±489 741±551 825±545 <.001 a<b,c
Number of falls 0.9±1.6 0.6±1.3 0.33±0.7 .002 a<b,c
Fear of falling score (point) 5.6±5.5 2.2±2.8 0.9±1.7 <.001 a<b<c
Fall-related injuries
.025 x,y≠z No/light injury (x) 21.6% 61.6% 16.8%
Severe injury (y) 22.8% 52.6% 24.6%
Non- fallers( z) 14.8% 55.2% 30.0%
Gender
<.001 x≠y Female (x) 20.5% 60.3% 19.2%
Male (y) 4.0% 41.1% 54.8%
PA: physical activity.
Chapter 6 Associations between falls, fall-related injuries, fear of falling and disability in activities of daily living in adults over 55 years old
111
Considering the three categories of physical functioning score, multinomial logistic
regression was used to quantify the risk of becoming disabled (moderately or severely)
due to the occurrence of falls, with and without severe injuries, and due to fear of
falling, assessed by using the FES (Figure 2). Values were adjusted for co-morbidities,
aerobic endurance, balance, and lean body mass index, which were revealed to be
significant predictors of physical functioning in the exploratory analyses. Subjects who
had a fall-related severe injury were 2.5 times more likely to be moderately disabled
(OR: 2.50, 95% CI: 1.05-5.95), and 5.6 times more likely to be severely disabled (OR:
5.55, 95% CI: 1.52-20.24) than subjects without severe injuries (who had not fallen, or
had fallen but had suffered no injury, or had fallen and had suffered light injuries). As
long as fear increased, the likelihood of a person becoming moderately disabled doubled
or virtually tripled (OR: 2.08, 95% CI: 1.09-3.98 for FES ±; OR: 2.71, 95% CI: 1.22-
6.05 for FES +) but the likelihood of a person becoming severely disabled could be
almost seven times higher (OR: 3.11, 95% CI: 1.20-8.01 for FES ±; OR: 6.62, 95% CI:
2.44-17.91 for FES +) than a person with no fear of falling.
The risk of disability in each advanced, instrumental and basic ADL due to falls/injuries
and due to fear of falling was quantified by means of binary logistic regression
(Figure 3). Results were adjusted for potential confounders. For AADLs and more
demanding IADLs, adjustments were made for co-morbidities, aerobic endurance, lean
body mass index, and balance. For less demanding IADLs and BADLs adjustments
were made for co-morbidities, balance, strength, flexibility, and body fat mass.
Analyses were also adjusted for physical activity in three ADLs (Items 3, 8, 12). All
these covariates were revealed to be significant predictors of ADLs in the exploratory
analyses (P<.05).
The occurrence of falls with severe injuries increased by ~3 to 4 times the likelihood of
disability in two ADLs (OR: 2.665, 95% CI: 1.091- 6.512; OR: 3.777, 95% CI: 1.678 -
8.501). Reporting a fear of falling score of 2-3 (FES ±), in contrast with no fear of
falling category, increased the chance of disability in Item 9 (lift and carry 10 lb) by 2
times (OR: 2.195, 95% CI: 1.140 - 4.223), while reporting a fear of falling score ≥4
(FES +) increased by 2 to 3 times the likelihood of disability in six ADLS (from OR:
1.994, 95% CI: 1.069 - 3.720 in item 10 to OR: 3.296, 95% CI: 1.071 -10.140 in
item 3).
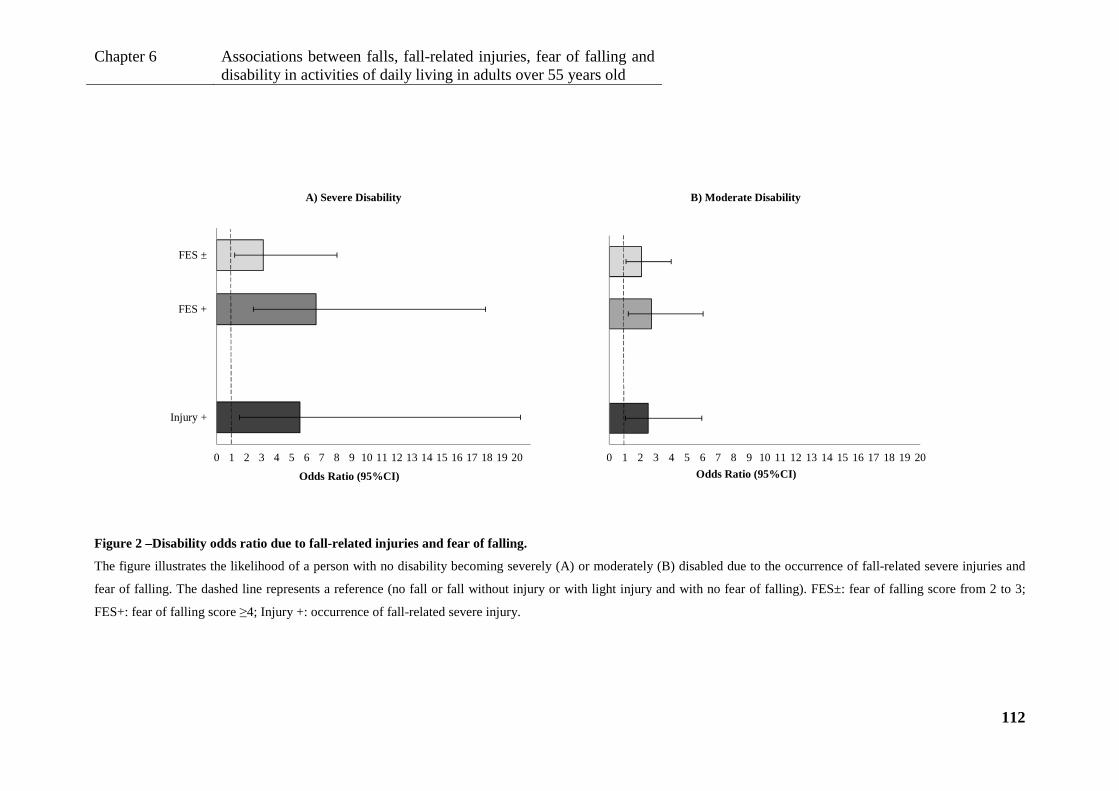
Chapter 6 Associations between falls, fall-related injuries, fear of falling and disability in activities of daily living in adults over 55 years old
112
0 1 2 3 4 5 6 7 8 9 10 11 12 13 14 15 16 17 18 19 20
Injury +
FES +
FES ±
Odds Ratio (95%CI)
A) Severe Disability
0 1 2 3 4 5 6 7 8 9 10 11 12 13 14 15 16 17 18 19 20
Odds Ratio (95%CI)
B) Moderate Disability
Figure 2 –Disability odds ratio due to fall-related injuries and fear of falling.
The figure illustrates the likelihood of a person with no disability becoming severely (A) or moderately (B) disabled due to the occurrence of fall-related severe injuries and
fear of falling. The dashed line represents a reference (no fall or fall without injury or with light injury and with no fear of falling). FES±: fear of falling score from 2 to 3;
FES+: fear of falling score ≥4; Injury +: occurrence of fall-related severe injury.
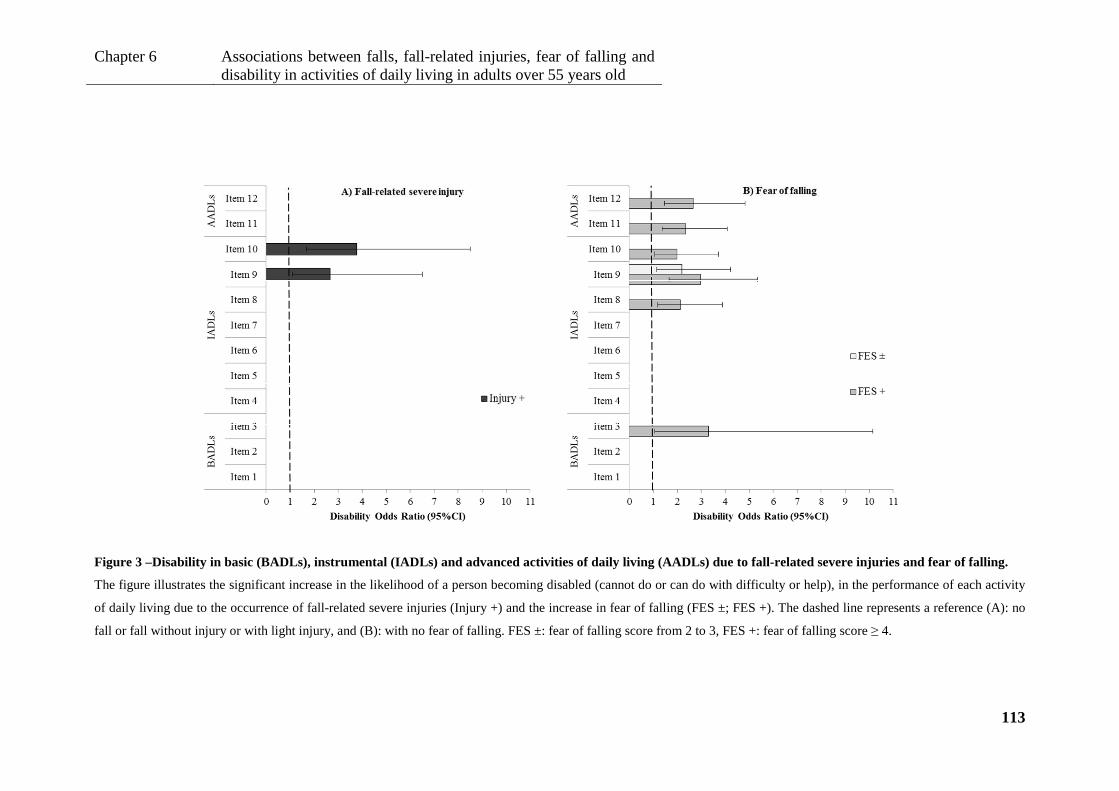
Chapter 6 Associations between falls, fall-related injuries, fear of falling and disability in activities of daily living in adults over 55 years old
113
Figure 3 –Disability in basic (BADLs), instrumental (IADLs) and advanced activities of daily living (AADLs) due to fall-related severe injuries and fear of falling.
The figure illustrates the significant increase in the likelihood of a person becoming disabled (cannot do or can do with difficulty or help), in the performance of each activity
of daily living due to the occurrence of fall-related severe injuries (Injury +) and the increase in fear of falling (FES ±; FES +). The dashed line represents a reference (A): no
fall or fall without injury or with light injury, and (B): with no fear of falling. FES ±: fear of falling score from 2 to 3, FES +: fear of falling score ≥ 4.
Chapter 6 Associations between falls, fall-related injuries, fear of falling and disability in activities of daily living in old adults over 55 years old
114
DISCUSSION
The main objective of this study was to analyze associations between falls and their
consequences (injuries and fear of falling) and disability in the performance of
advanced, instrumental and basic ADLs. The results showed that fear of falling
promotes disability and represents a constraint for the performance of general ADLs,
while the occurrence of falls, even with serious injuries, seems to interfere to a lesser
degree than fear of falling with the ability to carry out ADLs, regardless of chronologic
age, comorbidities, body composition and physical fitness.
Increasing fear of falling increased the risk of a person changing from high to moderate
and especially to low or disabled functioning. Moreover, as long as the fear score
increased, the likelihood of disability in advanced, instrumental or basic ADLs could be
2 to 3 times higher than in cases of no fear. Nevertheless, fear of falling is usually
associated with the occurrence of falls and injuries, and may also be caused by frailty 28.
Subjects with the poorest physical activity, fitness or health, even in the absence of falls,
reported a high fear of falling (P<.05, data not shown). The self-perception of fragility
inhibits the performance of ADLs. However, in present study results were adjusted for
these potential confounders, thus concern about falling showed to leads able-bodied
subjects to avoid activities that they can perform 26. Moreover, the restriction of activity
due to fear of falling leads to a further deterioration in ADL disability 29.
The occurrence of falls causing light injuries or no injuries was not shown to be a
significant predictor of ADLs disability while fall-related severe injuries were revealed
as increasing by 3 to 4 times the likelihood of disability in more demanding
instrumental ADLs. Besides this, severe injuries also increased the likelihood of a
person becoming moderately or, especially, severely disabled. Candel-Parra et al. 30
observed that 6 months after a fall-related hip fracture, only 33% of patients recover
their independence in activities of daily living.
In accordance with the findings reported by other researchers, the present study revealed
that risk factors for ADLs disability 31, in particular poor health, were common for falls
and fall-related injuries 10, 12, 19, 27. Thus, preventive strategies for these both negative
outcomes may also be common. Co-morbidities explained 16% of physical functioning
variance in this study and were the main predictor of fear of falling (R2= 22%, P<.001).
Chapter 6 Associations between falls, fall-related injuries, fear of falling and disability in activities of daily living in old adults over 55 years old
115
This data suggests a more complex relationship between ADLs disability and the
occurrence of falls than previously found 17, 32.
Our findings showed that fear of falling and severe injuries appear to limit to a greater
degree more demanding ADLs than basic ADLs and, in accordance with Seidel et al. 33,
recovery from disability is less frequent with regard to more demanding activities than
for basic ADLs. In keeping with the findings of Sato et al. 34 for preventing disability
with regard to less demanding ADLs may be important maintain or recover health
status, muscle strength and flexibility, balance, and confidence (data not shown).
Physical activity promotes quality of life (health status and independent functioning) in
elderly people and is pointed to as an effective strategy for preventing falls and fall-
related injuries 15, 35-37. Also in our analyses, physical activity contributed significantly
to low scores of fear of falling, regardless of physical fitness level, body composition,
and the occurrence of severe injuries (P=.025, data not shown).
Limitations of this study include the reduced ability of cross-sectional studies for the
establishment of cause-effect relationships. Additionally, only a few participants show
disability in performing less demanding ADLs, diminishing the statistical power of
analyses that comprised these activities. Another difficulty was the accuracy of the
questionnaires used for measuring physical activity and ADL disability, since many
participants could not read or write. This was minimized by the use of an interviewer
who filled out a questionnaire for each participant and the inclusion of criteria for the
absence of dementia.
CONCLUSIONS
Fear of falling was shown to be a higher risk factor for disability than falls, even when
subjects suffered serious injuries, restricting the performance of AADLs, IADLs and
BADLs. Regarding these risk factors, disability seems to occur mainly in advanced and
more demanding instrumental ADLs than basic ADLs. Consequently the
implementation of prevention programs should increase the self-confidence of
individuals through the successful accomplishment of functional exercises that mimic
ADLs and not just fitness (aerobic, muscular or neuro-motor) exercises.

Chapter 6 Associations between falls, fall-related injuries, fear of falling and disability in activities of daily living in old adults over 55 years old
116
Acknowledgments
The authors thank all the volunteers who participated in this study.
Conflict of interest
The authors declare that there is no conflict of interest.
Portuguese Science and Technology Foundation (PhD grant SFRH/BD/31450/2006)
provided financial support to conduct this study.
The sponsors had no role in the design, analysis, or preparation of this manuscript.
REFERENCES
1. Nitz JC, Choy NL. Falling is not just for older women: support for pre-emptive
prevention intervention before 60. Climacteric 2008;11(6):461-6.
2. Scheffer AC, Schuurmans MJ, van Dijk N, van der Hooft T, de Rooij SE. Fear
of falling: measurement strategy, prevalence, risk factors and consequences among
older persons. Age Ageing 2008;37(1):19-24.
3. Landrot Mde R, Perrot C, Blanc P, Beauchet O, Blanchon MA, Gonthier R.
[Does the care for the fear of falling bring a profit to community living elderly people
who had experienced falls?]. Psychol Neuropsychiatr Vieil 2007;5(3):225-34.
4. Tinetti ME, Mendes de Leon CF, Doucette JT, Baker DI. Fear of falling and fall-
related efficacy in relationship to functioning among community-living elders. J
Gerontol 1994;49(3):M140-7.
5. Reuben DB, Solomon DH. Assessment in geriatrics. Of caveats and names. J
Am Geriatr Soc 1989;37(6):570-2.
6. Spector WD, Fleishman JA. Combining activities of daily living with
instrumental activities of daily living to measure functional disability. J Gerontol B
Psychol Sci Soc Sci 1998;53(1):S46-57.
7. Rubio E, Lazaro A, Sanchez-Sanchez A. Social participation and independence
in activities of daily living: a cross sectional study. BMC Geriatr 2009;9:26.

Chapter 6 Associations between falls, fall-related injuries, fear of falling and disability in activities of daily living in old adults over 55 years old
117
8. Eurostat. EU27 population is expected to peak by around 2040. 2011 [26 July
2011]. Available from URL: http://epp.eurostat.ec.europa.eu/cache/ITY_PUBLIC/3-
08062011-BP/EN/3-08062011-BP-EN.PDF.
9. Bowling A, Iliffe S. Which model of successful ageing should be used? Baseline
findings from a British longitudinal survey of ageing. Age Ageing 2006;35(6):607-14.
10. Barrett-Connor E, Weiss TW, McHorney CA, Miller PD, Siris ES. Predictors of
falls among postmenopausal women: results from the National Osteoporosis Risk
Assessment (NORA). Osteoporos Int 2009;20(5):715-22.
11. Finlayson ML, Peterson EW. Falls, aging, and disability. Phys Med Rehabil Clin
N Am 2010;21(2):357-73.
12. Lloyd BD, Williamson DA, Singh NA, Hansen RD, Diamond TH, Finnegan TP
et al. Recurrent and injurious falls in the year following hip fracture: a prospective study
of incidence and risk factors from the Sarcopenia and Hip Fracture study. J Gerontol A
Biol Sci Med Sci 2009;64(5):599-609.
13. Fujiwara Y, Chaves PH, Yoshida H, Amano H, Fukaya T, Watanabe N et al.
Intellectual activity and likelihood of subsequently improving or maintaining
instrumental activities of daily living functioning in community-dwelling older
Japanese: a longitudinal study. Int J Geriatr Psychiatry 2009;24(6):547-55.
14. Cahn-Weiner DA, Farias ST, Julian L, Harvey DJ, Kramer JH, Reed BR et al.
Cognitive and neuroimaging predictors of instrumental activities of daily living. J Int
Neuropsychol Soc 2007;13(5):747-57.
15. Paterson DH, Warburton DE. Physical activity and functional limitations in
older adults: a systematic review related to Canada's Physical Activity Guidelines. Int J
Behav Nutr Phys Act 2010;7:38.
16. Izawa S, Enoki H, Hirakawa Y, Iwata M, Hasegawa J, Iguchi A et al. The
longitudinal change in anthropometric measurements and the association with physical
function decline in Japanese community-dwelling frail elderly. Br J Nutr
2010;103(2):289-94.
17. Kelsey JL, Berry SD, Procter-Gray E, Quach L, Nguyen US, Li W et al. Indoor
and outdoor falls in older adults are different: the maintenance of balance, independent
living, intellect, and Zest in the Elderly of Boston Study. J Am Geriatr Soc
2010;58(11):2135-41.

Chapter 6 Associations between falls, fall-related injuries, fear of falling and disability in activities of daily living in old adults over 55 years old
118
18. Sherrington C, Whitney JC, Lord SR, Herbert RD, Cumming RG, Close JC.
Effective exercise for the prevention of falls: a systematic review and meta-analysis. J
Am Geriatr Soc 2008;56(12):2234-43.
19. Tinetti ME, Kumar C. The patient who falls: "It's always a trade-off". JAMA
2010;303(3):258-66.
20. Rikli R, Jones CJ. The reliability and validity of a 6-minute walk test as a
measure of physical endurance in older adults. J Aging Phys Act 1998;6:363-75.
21. Folstein MF, Folstein SE, McHugh PR. "Mini-mental state". A practical method
for grading the cognitive state of patients for the clinician. J Psychiatr Res
1975;12(3):189-98.
22. Rikli R, Jones CJ. Development and validation of a functional fitness test for
community-residing older adults. J Aging Phys Act 1999;7(2):129-61.
23. Rose DJ, Lucchese N, Wiersma LD. Development of a multidimensional
balance scale for use with functionally independent older adults. Arch Phys Med
Rehabil 2006;87(11):1478-85.
24. Zaluska W, Malecka T, Mozul S, Ksiazek A. [Whole body versus segmental
bioimpedance measurements (BIS) of electrical resistance (Re) and extracellular
volume (ECV) for assessment of dry weight in end-stage renal patients treated by
hemodialysis]. Przegl Lek 2004;61(2):70-3.
25. Craig CL, Marshall AL, Sjostrom M, Bauman AE, Booth ML, Ainsworth BE et
al. International physical activity questionnaire: 12-country reliability and validity. Med
Sci Sports Exerc 2003;35(8):1381-95.
26. Tinetti M, Richman D, Powell L. Falls efficacy as a measure of fear of falling. J
Gerontol 1990;45(6):P239-43.
27. Pluijm SM, Smit JH, Tromp EA, Stel VS, Deeg DJ, Bouter LM et al. A risk
profile for identifying community-dwelling elderly with a high risk of recurrent falling:
results of a 3-year prospective study. Osteoporos Int 2006;17(3):417-25.
28. Chu CL, Liang CK, Chow PC, Lin YT, Tang KY, Chou MY et al. Fear of falling
(FF): Psychosocial and physical factors among institutionalized older Chinese men in
Taiwan. Arch Gerontol Geriatr 2011;53(2): e232-e236
29. Deshpande N, Metter EJ, Bandinelli S, Lauretani F, Windham BG, Ferrucci L.
Psychological, physical, and sensory correlates of fear of falling and consequent activity
Chapter 6 Associations between falls, fall-related injuries, fear of falling and disability in activities of daily living in old adults over 55 years old
119
restriction in the elderly: the InCHIANTI study. Am J Phys Med Rehabil
2008;87(5):354-62.
30. Candel-Parra E, Corcoles-Jimenez MP, Del Egido-Fernandez MA, Villada-
Munera A, Jimenez-Sanchez MD, Moreno-Moreno M et al. [Independence in activities
of daily living 6 months after surgery in previously independent elderly patients with
hip fracture caused by a fall]. Enferm Clin 2008;18(6):309-16.
31. Fujiwara Y, Yoshida H, Amano H, Fukaya T, Liang J, Uchida H et al. Predictors
of improvement or decline in instrumental activities of daily living among community-
dwelling older Japanese. Gerontology 2008;54(6):373-80.
32. Aoyama M, Suzuki Y, Onishi J, Kuzuya M. Physical and functional factors in
activities of daily living that predict falls in community-dwelling older women. Geriatr
Gerontol Int (in press)
33. Seidel D, Jagger C, Brayne C, Matthews FE, Cfas M. Recovery in instrumental
activities of daily living (IADLs): findings from the Medical Research Council
Cognitive Function and Ageing Study (MRC CFAS). Age Ageing 2009;38(6):663-8.
34. Sato D, Kaneda K, Wakabayashi H, Shimoyama Y, Baba Y, Nomura T.
Comparison of once and twice weekly water exercise on various bodily functions in
community-dwelling frail elderly requiring nursing care. Arch Gerontol Geriatr
2011;52(3):331-5.
35. Balzi D, Lauretani F, Barchielli A, Ferrucci L, Bandinelli S, Buiatti E et al. Risk
factors for disability in older persons over 3-year follow-up. Age Ageing;39(1):92-8.
36. Heesch KC, Byles JE, Brown WJ. Prospective association between physical
activity and falls in community-dwelling older women. J Epidemiol Community Health
2008;62(5):421-6.
37. Guralnik JM, Simonsick EM. Physical disability in older Americans. J Gerontol
1993;48 Spec No:3-10.
Chapter 7 Influence of health status, physical activity and fitness in autonomy of community-dwelling old adults over a five year period
120
CHAPTER 7
INFLUENCE OF HEALTH STATUS, PHYSICAL ACTIVITY AND F ITNESS IN
AUTONOMY OF COMMUNITY-DWELLING OLD ADULTS OVER A FI VE
YEAR PERIOD 6
_______________________________ 6 Pereira C, Baptista F. Influence of health status, physical activity and fitness in autonomy of
community-dwelling old adults over a five year period. 2011 (in submission)
Chapter 7 Influence of health status, physical activity and fitness in autonomy of community-dwelling old adults over a five year period
121
ABSTRACT
Objective: To analyze the influence of health status, physical activity and fitness on the
autonomy of community-dwelling old adults over a five year period.
Design: 5-year follow-up study.
Setting: Community.
Participants: Community-dwelling persons (N=85) aged 60 years and older at baseline.
Main outcome measures: autonomy/physical functioning, co-morbidities, physical
activity, physical fitness including body composition, evaluated by using the Composite
Physical Function scale, International Physical Activity Questionnaire, Fullerton
batteries and bioimpedance, respectively.
Results: Linear regression revealed that the main predictors of change in autonomy
over a 5-year period were initial autonomy (β=0.032, R2=9.8%); health status (initial
number of co-morbidities: β=-0.191, R2=6.3%; and change in the number of co-
morbidities: β=-0.244, R2=10.8%); and changes in agility (β=-0.288, R2=6.7%), aerobic
endurance (β =0.007, R2=3.2%), and walking expenditure (β =0.001, R2=5.1%), P<.05).
Conclusions: Initial autonomy level and health status seems to moderate autonomy
change in community-dwelling old adults over a 5-year period, however physical
activity (walking) and fitness (agility and aerobic endurance) also account for autonomy
loss variability, justifying the promotion of intervention programs for the maintenance
or improvement of these factors.
Key words: Autonomy; Physical activity; Physical fitness; Elderly; Variability
Chapter 7 Influence of health status, physical activity and fitness in autonomy of community-dwelling old adults over a five year period
122
INTRODUCTION
Life expectancy among the elderly has increased 1. Current projections indicate that the
population of the European Union will continue to grow older, with the proportion of
people aged 65 years and over rising from 17% in 2010 to 30% in 2060, and those aged
80 years and over rising from 5% to 12% over the same period 2. As life expectancy
increases, a significant number of people are likely to live longer while subject to
infirmities 3-5 and disabilities, and thus loss of autonomy 6. However increased life
expectancy could be disability-free 6-8 particularly if diseases are diagnosed earlier and
become less disabling over time 6, if levels of education rise 9, and if rehabilitation and
physical activity/exercise programs are promoted to prevent physiological and
functional deterioration, and, thus, to decrease loss of autonomy in activities of daily
living (ADLs) 10, 11.
Most factors affecting the level of ability to perform ADLs involve disease and
impairments, physical activity and fitness and, in frail, institutionalized populations,
cognition status 11-16. However, studies focusing on disability and autonomy have been
mainly based on cross-sectional results and few studies have analyzed longitudinally
predictors of health and physical functioning variables 17-20. Therefore, this study is
aimed to analyze the influence of health status, physical activity and fitness on the
autonomy of community-dwelling old adults over a five year period.
METHODS
Design
This study involves a follow-up over a 5-year period (2006-2011). Participants were
evaluated twice. The first evaluation was carried out in 2006 and the second one in
2011. The sample was split according to autonomy (physical functioning): Group A was
characterized by maintained or improved autonomy over the 5-year period and Group B
by decreased autonomy over the same period.
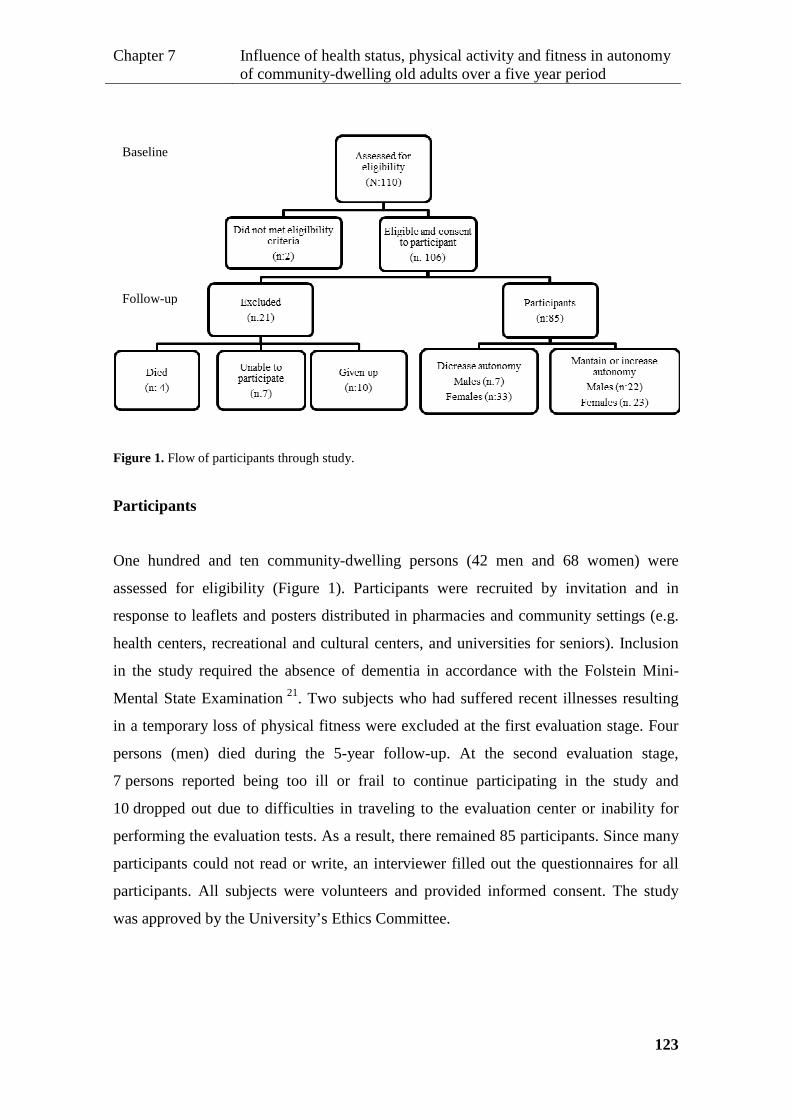
Chapter 7 Influence of health status, physical activity and fitness in autonomy of community-dwelling old adults over a five year period
123
Figure 1. Flow of participants through study.
Participants
One hundred and ten community-dwelling persons (42 men and 68 women) were
assessed for eligibility (Figure 1). Participants were recruited by invitation and in
response to leaflets and posters distributed in pharmacies and community settings (e.g.
health centers, recreational and cultural centers, and universities for seniors). Inclusion
in the study required the absence of dementia in accordance with the Folstein Mini-
Mental State Examination 21. Two subjects who had suffered recent illnesses resulting
in a temporary loss of physical fitness were excluded at the first evaluation stage. Four
persons (men) died during the 5-year follow-up. At the second evaluation stage,
7 persons reported being too ill or frail to continue participating in the study and
10 dropped out due to difficulties in traveling to the evaluation center or inability for
performing the evaluation tests. As a result, there remained 85 participants. Since many
participants could not read or write, an interviewer filled out the questionnaires for all
participants. All subjects were volunteers and provided informed consent. The study
was approved by the University’s Ethics Committee.
Baseline
Follow-up

Chapter 7 Influence of health status, physical activity and fitness in autonomy of community-dwelling old adults over a five year period
124
Outcome measures
Autonomy
Autonomy as regards physical functioning was determined by responses to the 12-item
Composite Physical Function (CPF) scale 22: Item 1. Take care of own personal needs –
like dressing yourself. Item 2. Bathe yourself, using tub or shower. Item 3. Climb up
and down a flight of stairs (like a second story in a house). Item 4. Walk outside (one or
two blocks). Item 5. Do light household chores – like cooking, dusting, washing dishes,
sweeping a walkway. Item 6. Shop for groceries or clothes. Item 7. Walk ½ mile (6-7
blocks). Item 8. Walk 1 mile (12-14 blocks). Item 9. Lift and carry 10 lb. (full bag of
groceries). Item 10. Lift and carry 25 lb. (medium to large suitcase). Item 11. Do heavy
household activities – like scrubbing floors, vacuuming, raking leaves. Item 12. Do
strenuous activities – like hiking, digging in the garden, moving heavy objects, cycling,
aerobic dance activities, strenuous calisthenics, etc. Participants were asked to indicate
whether they could do the activity (score of 2), could do it with difficulty or with help
(score of 1), or could not perform the activity at all (score of 0). Total scores range from
0 to 24.
Physical activity
Habitual physical activity was assessed using the short version of the International
Physical Activity Questionnaire (IPAQ) 23. This covers metabolic expenditure
(METmin/wk) when walking (3.3 MET) or when performing moderate-to-vigorous
activities (4.0 to 8.0 MET). Total metabolic expenditure was calculated by determining
the time (minutes/day) spent doing each activity and the frequency of activity
(days/week).
Fitness and body composition
Lower and upper body strength, agility, aerobic endurance and body mass index [BMI
(kg/m2)] were evaluated using the Fullerton functional fitness test battery 24, namely by
30-s chair stand (repetitions or reps in 30 sec); arm curls (reps in 30 sec); 8-ft up-and-go
Chapter 7 Influence of health status, physical activity and fitness in autonomy of community-dwelling old adults over a five year period
125
(sec); and 6-min walk (m). Standing height (cm) was measured with a stadiometer
(Secca 770, Hamburg, Germany) and weight (kg) using electronic scales (Secca Bella
840, Hamburg, Germany). Balance was evaluated using a reduced version of the
Fullerton advanced balance (FAB) scale 25, 26 comprising the following four tests:
stepping up and over a bench; walking along a line with feet in tandem position;
standing on one leg; and standing on foam with the eyes closed. The final balance score
was calculated by summing the partial scores of each of the four tests. Each test was
scored from 0 (worst) to 4 (best). Fat body mass (%) was evaluated by bioimpedance 27
(HBF-306C, Schaumburg, USA). Lean mass index (kg/m2) was calculated as [total
body mass (kg) - fat body mass (kg)] / [body height 2 (m)].
Health status
Chronic disease and physical impairments were assessed by using a questionnaire.
Participants listed a total of 24 diseases. Physical impairments included involuntary loss
of urine, frequent dizziness, foot problems, poor vision, hearing problems, and
occasional loss of balance 28. The presence or absence of each disease or physical
impairment was checked for each participant. Co-morbidities referred to the number of
diseases and physical impairments.
All variables were evaluated in 2006 and again in 2011.
Statistical analysis
The main effect of time (year 1 vs. year 5) on autonomy groups (Group A and Group B)
regarding health status, physical activity and fitness including body composition were
analyzed by repeated measures and the Bonferroni post hoc test. Group A included
participants who maintained or increased autonomy and Group B comprised
participants who decreased autonomy over time. In the case of no homoscedasticity,
comparisons between the two moments in time and between groups were carried out
using t-tests. Gender prevalence comparisons between groups (e.g. male vs. female)
were performed using the Chi-Square or Fisher’s test and between moments using
McNamar’s test. Analyses performed with multiple simultaneous tests were carried out
using the Bonferroni correction for P-value.
Chapter 7 Influence of health status, physical activity and fitness in autonomy of community-dwelling old adults over a five year period
126
Multiple linear regression using the backward elimination was employed to identify
significant predictors for change in autonomy and to determine the variance accounted
for by each predictor. Since in this analysis gender and age were not significant
predictors of the change in autonomy, all statistical analysis included both genders and
were not adjusted for age.
Assumptions underlying statistical techniques, such as homoscedasticity, linearity and
the independence of error terms, were duly tested. Normality was assumed, based on the
central limit theorem. Statistical analyses were performed using SPSS version 17.0,
considering statistical significance to be P<.05.
RESULTS
At the end of the 5-year follow-up, only 80.8% of the eligible participants remained in
the study. The majority of them presented the best results in health status, physical
activity and fitness at the start of the study. The other 19.2 %, were who dropped out
(9.4%), were too ill (6.6%), or died (3.8%). Of the remaining 85 participants, 29 were
male and 56 female. More females than males lost autonomy over the follow-up period
(59% of females vs. 24% of males decreased autonomy P=.003).
Tables 1 and 2 present the characteristics of the participants at baseline and after 5 years
by group. Over the follow-up period, most of the characteristics changed unfavorably.
Compared to Group A, Group B increased one more disease or physical impairment in
co-morbidities, 1 more second in agility, decreased more 356 METs-min/wk in walking
expenditure and more 748 METs-min/wk in total physical activity expenditure, and
performed 27 fewer meters in the distance covered in the aerobic 6-min walk test. No
difference was observed in fat body mass, balance, or upper body strength between year
1 and year 5.

Chapter 7 Influence of health status, physical activity and fitness in autonomy of community-dwelling old adults over a five year period
127
Table 1. Initial and final chronological age, autonomy, health status and physical activity of the
participants.
Year 1
Mean± SD
Year 5
Mean± SD
Change
Mean (95%CI)
P-value
Moment*Group
Age (year) Group A 66.9±5.2 71.8±5.0 5
- Group B 67.9±5.6 73.2±5.8 5
Total 67.4±5.4 72.5±5.4 5
Autonomy
(point)
Group A 22.0±2.2 22.7±1.7 0.7 (0.4 - 1.0)*
- Group B 21.8±2.8 19.7±3.4 -2.1 (- 2.6 - -1.6)*
Total 21.9±2.5 21.3±3.0 -0.6 (-1.0 - -0.2)*
Co-morbidities
(n)
Group A 2.5±2.0 2.9± 1.8 0.4 (-0.1-0.9)
.005 Group B 3.2±2.0 4.7±2.2 1.5 (0.9-2.0)*
Total 2.9±2.0 3.7±2.2 0.9 (0.5-1.3)*
Vigorous PA
(MET-min/wk)
Group A 236±569 53±255 -182 (-307- -58)*
.860 Group B 255±579 54± 240 -201 (-381 - -20.9)*
Total 245±570 54±247 -191 (-296 - -86)*
Moderate PA
(MET-min/wk)
Group A 1663±1038 914±583 -748 (-1075- -422)*
.084 Group B 2008±1247 850±833 -1291 (-1500- -817)*
Total 1825±1147 884±708 -1004 (-1177- -706)*
Walking
(MET-min/wk)
Group A 789±441 593±492 -196 (-334- -58)*
- Group B 980±866 466±326 -552 (-779- -249)*
Total 879±678 533±425 -363 (-491- -200)*
Total PA
(MET-min/wk)
Group A 2687±1231 1561±725 -1126 (-1487- -766)*
.007 Group B 3243±1469 1369±1032 -1874 (-2284- -1464)*
Total 2949±1369 1470±883 -1478 (-1756- -1200)*
*Significant pre-post difference, P<.05; PA: physical activity; Group A: maintained or increased
autonomy over 5-years; Group B: decreased autonomy over 5-years; SD: standard deviation; CI:
confidence interval.
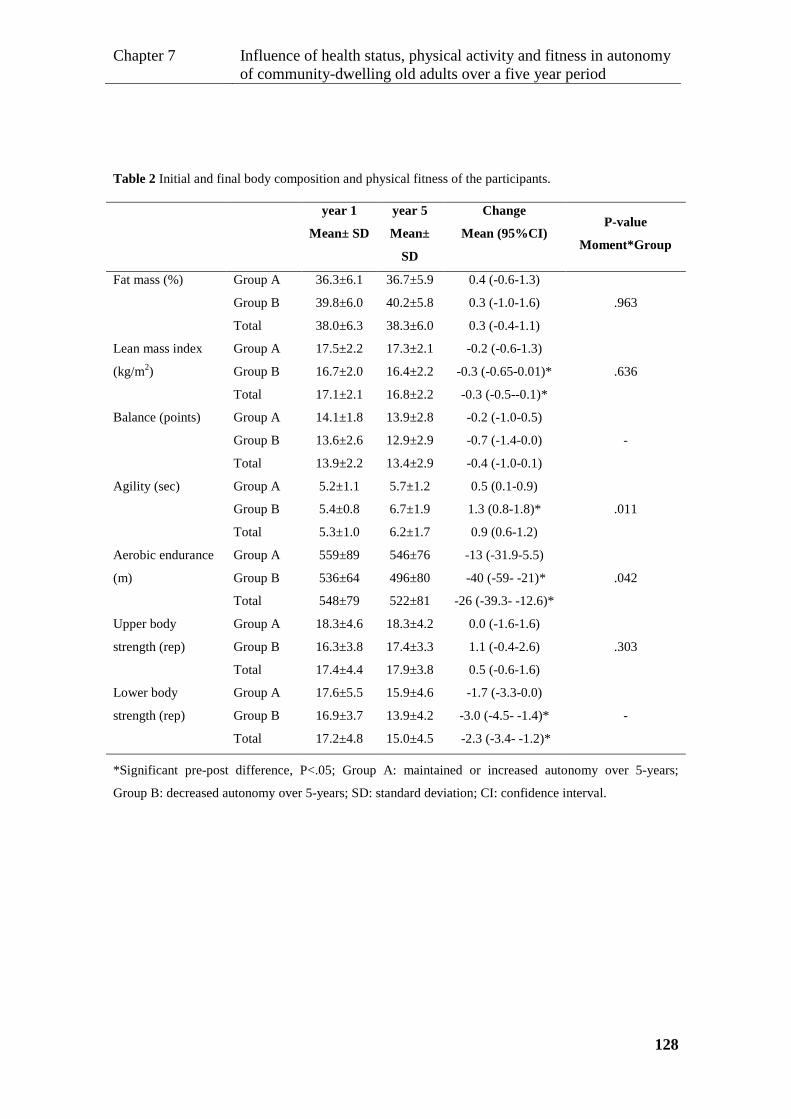
Chapter 7 Influence of health status, physical activity and fitness in autonomy of community-dwelling old adults over a five year period
128
Table 2 Initial and final body composition and physical fitness of the participants.
year 1
Mean± SD
year 5
Mean±
SD
Change
Mean (95%CI) P-value
Moment*Group
Fat mass (%) Group A 36.3±6.1 36.7±5.9 0.4 (-0.6-1.3)
.963 Group B 39.8±6.0 40.2±5.8 0.3 (-1.0-1.6)
Total 38.0±6.3 38.3±6.0 0.3 (-0.4-1.1)
Lean mass index
(kg/m2)
Group A 17.5±2.2 17.3±2.1 -0.2 (-0.6-1.3)
.636 Group B 16.7±2.0 16.4±2.2 -0.3 (-0.65-0.01)*
Total 17.1±2.1 16.8±2.2 -0.3 (-0.5--0.1)*
Balance (points) Group A 14.1±1.8 13.9±2.8 -0.2 (-1.0-0.5)
- Group B 13.6±2.6 12.9±2.9 -0.7 (-1.4-0.0)
Total 13.9±2.2 13.4±2.9 -0.4 (-1.0-0.1)
Agility (sec) Group A 5.2±1.1 5.7±1.2 0.5 (0.1-0.9)
.011 Group B 5.4±0.8 6.7±1.9 1.3 (0.8-1.8)*
Total 5.3±1.0 6.2±1.7 0.9 (0.6-1.2)
Aerobic endurance
(m)
Group A 559±89 546±76 -13 (-31.9-5.5)
.042 Group B 536±64 496±80 -40 (-59- -21)*
Total 548±79 522±81 -26 (-39.3- -12.6)*
Upper body
strength (rep)
Group A 18.3±4.6 18.3±4.2 0.0 (-1.6-1.6)
.303 Group B 16.3±3.8 17.4±3.3 1.1 (-0.4-2.6)
Total 17.4±4.4 17.9±3.8 0.5 (-0.6-1.6)
Lower body
strength (rep)
Group A 17.6±5.5 15.9±4.6 -1.7 (-3.3-0.0)
- Group B 16.9±3.7 13.9±4.2 -3.0 (-4.5- -1.4)*
Total 17.2±4.8 15.0±4.5 -2.3 (-3.4- -1.2)*
*Significant pre-post difference, P<.05; Group A: maintained or increased autonomy over 5-years;
Group B: decreased autonomy over 5-years; SD: standard deviation; CI: confidence interval.
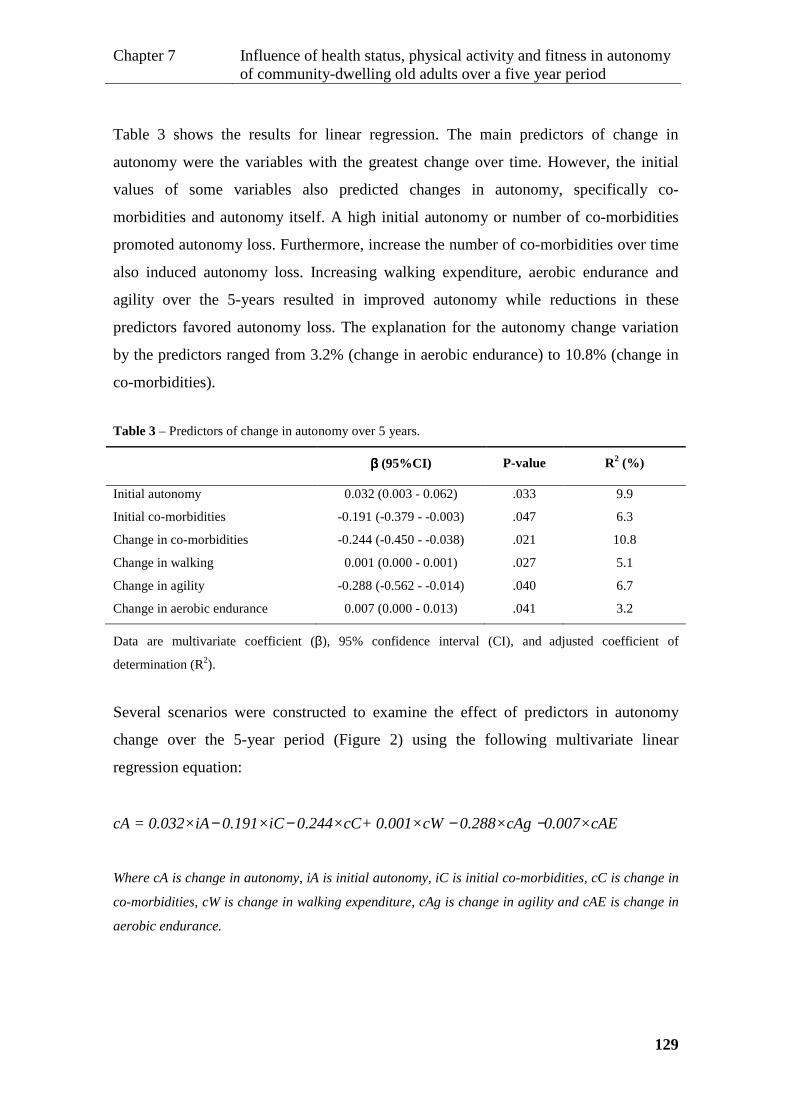
Chapter 7 Influence of health status, physical activity and fitness in autonomy of community-dwelling old adults over a five year period
129
Table 3 shows the results for linear regression. The main predictors of change in
autonomy were the variables with the greatest change over time. However, the initial
values of some variables also predicted changes in autonomy, specifically co-
morbidities and autonomy itself. A high initial autonomy or number of co-morbidities
promoted autonomy loss. Furthermore, increase the number of co-morbidities over time
also induced autonomy loss. Increasing walking expenditure, aerobic endurance and
agility over the 5-years resulted in improved autonomy while reductions in these
predictors favored autonomy loss. The explanation for the autonomy change variation
by the predictors ranged from 3.2% (change in aerobic endurance) to 10.8% (change in
co-morbidities).
Table 3 – Predictors of change in autonomy over 5 years.
ββββ (95%CI) P-value R2 (%)
Initial autonomy 0.032 (0.003 - 0.062) .033 9.9
Initial co-morbidities -0.191 (-0.379 - -0.003) .047 6.3
Change in co-morbidities -0.244 (-0.450 - -0.038) .021 10.8
Change in walking 0.001 (0.000 - 0.001) .027 5.1
Change in agility -0.288 (-0.562 - -0.014) .040 6.7
Change in aerobic endurance 0.007 (0.000 - 0.013) .041 3.2
Data are multivariate coefficient (β), 95% confidence interval (CI), and adjusted coefficient of
determination (R2).
Several scenarios were constructed to examine the effect of predictors in autonomy
change over the 5-year period (Figure 2) using the following multivariate linear
regression equation:
cA = 0.032×iA− 0.191×iC− 0.244×cC+ 0.001×cW − 0.288×cAg −0.007×cAE
Where cA is change in autonomy, iA is initial autonomy, iC is initial co-morbidities, cC is change in
co-morbidities, cW is change in walking expenditure, cAg is change in agility and cAE is change in
aerobic endurance.
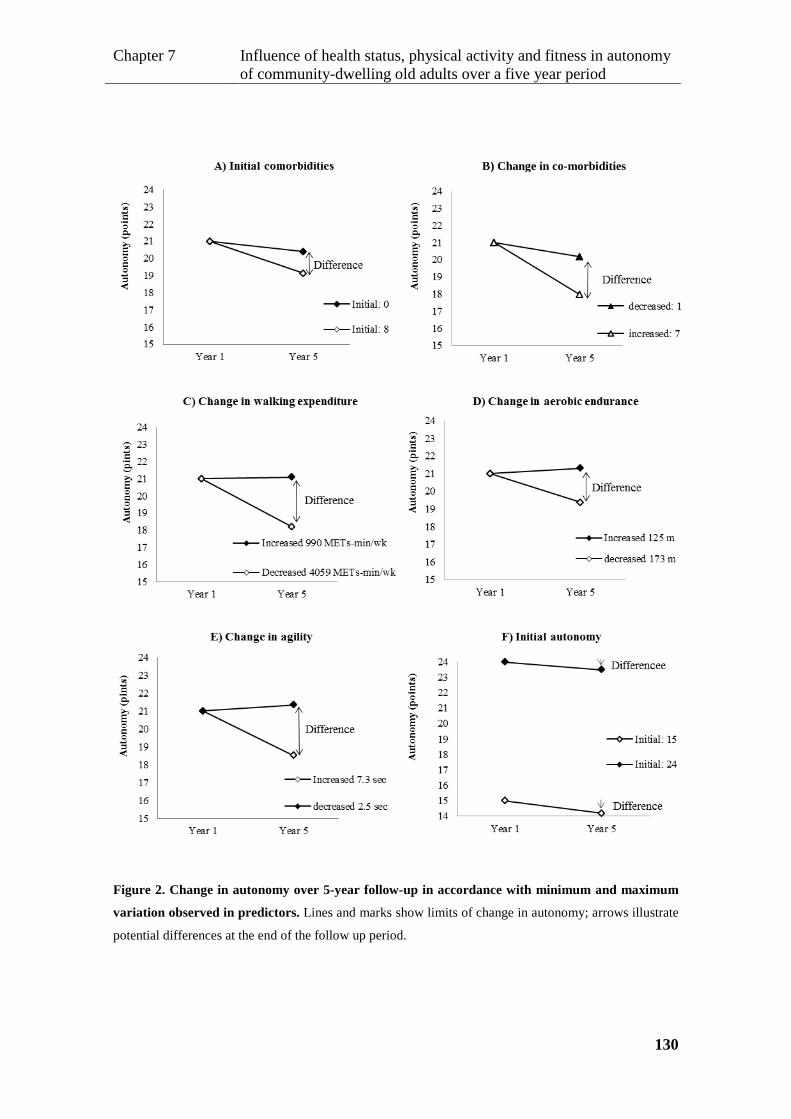
Chapter 7 Influence of health status, physical activity and fitness in autonomy of community-dwelling old adults over a five year period
130
Figure 2. Change in autonomy over 5-year follow-up in accordance with minimum and maximum
variation observed in predictors. Lines and marks show limits of change in autonomy; arrows illustrate
potential differences at the end of the follow up period.
B) Change in co-morbidities
Chapter 7 Influence of health status, physical activity and fitness in autonomy of community-dwelling old adults over a five year period
131
The medians of each predictor were used to solve the equation, except for the predictor
that illustrates the scenario where the minimum and maximum values were used. An
autonomy figure of 21 was considered in year 1 as the reference for variations observed
over the 5-year period. The median values of predictors of change in autonomy were: 3
diseases or physical impairments in initial co-morbidities; 1 disease or physical
impairment in change in co-morbidities; - 247.5 METs-min/wk in change in walking
expenditure; 0.75 sec in change in agility; and -17 m change in change in aerobic
endurance. The different scenarios showed that, over the 5-year period, each predictor
potentially induced different changes in autonomy. Variability in agility change had the
greatest impact on the variability of autonomy over time (a range from -2.48 to 0.34).
DISCUSSION
This study analyzed the influence of health status, physical activity and fitness on the
autonomy of community-dwelling old adults over a five year period. Among predictor
variables, five factors emerged as significant for change in autonomy over this period,
namely: co-morbidities, agility, aerobic endurance, walking expenditure, and autonomy
itself. The study revealed that poor autonomy is itself a risk for loss of autonomy and
that the larger the number of co-morbidities, the greater the loss of autonomy over time.
The principal effect of agility, aerobic endurance and walking expenditure on changes
in autonomy derives from the change in these factors over the 5-year period. Variability
in agility change had the greatest impact on the variability of autonomy over time.
In agreement with the findings of other studies29, 30, it was observed that older people,
and women in particular, suffer from higher levels of ADL performance loss than
younger (old) people and men, respectively. However, after statistical adjustment for the
main factors affecting autonomy, gender lost its significance and thus its ability to
predict ADL disability. The same applies to age.
The observation that higher initial autonomy or lower co-morbidities protect against
autonomy losses over time is a strong indicator of how useful it is to build up a reserve
of health and functionality. This reserve protects against dependence because poor
autonomy and health have been associated with faster decline and even premature
death 12, 30.

Chapter 7 Influence of health status, physical activity and fitness in autonomy of community-dwelling old adults over a five year period
132
As expected 12-14, complementary analysis identified correlations between almost all the
variables studied and autonomy. The only exception was vigorous physical activity.
Low values for any physical fitness or body composition variable were associated with
low autonomy as well as a high number of co-morbidities. Furthermore, decreased total
and moderate physical activity and decreased walking expenditure were associated with
low autonomy. Curiously, there was a general increase in the correlations strength
between autonomy and the other variables in year 5 (r: 0.242-0.706, P<.05) compared
with year 1 (r: 0.333-0.477, P<.05). This may be due to a general decline in results over
the 5-year period. Indeed, some findings of previous studies suggest that the longer
people live and the frailer they become, the greater the influence these variables have on
ADL disability 31.
Fortunately, participants were able to maintain their balance, upper body strength and
fat body mass over the follow-up period (and the number of falls also remained constant
– data not shown). This was unexpected, since data from previous studies suggests that
these variables normally decline over time 32. These results may be interpreted in two
ways. First, if there is no significant change in an independent variable, there will be no
resulting change in the dependent variable. Second, the good news is that these people –
probably because they have kept active in order to remain autonomous 33 – did not feel
that their autonomy was negatively impacted by losses in these variables. However,
people who suffered significant health problems or loss of independence did not remain
as participants in the study. Besides this, in present study, the percentage of those who
fell (23%) was lower than that found in other studies (30% and over) 28. This fact, allied
to the high activity reported by participants, indicates that they were above-average
condition compared with typical populations of the same age 34. Other variables that
decreased from year 1 to year 5, including lower body strength and lean body mass
index, did not predict changes in autonomy.
Thus, among all potential predictors, only the changes in four independent variables
predicted variations in autonomy, namely changes in co-morbidities, agility, aerobic
endurance and walking expenditure. These were the variables in which there was the
greatest change over the five years. There were, however, individuals who contradicted
this central tendency. In keeping with studies that have found increased disability-free
life expectancy 6-8, the scores of independent variables studied improved in some people
and, consequently, autonomy increased.

Chapter 7 Influence of health status, physical activity and fitness in autonomy of community-dwelling old adults over a five year period
133
According to literature 18, 19 the results of this study emphasize the need for
interventions programs to promote agility and aerobic endurance. We also recommend
that subjects be encouraged to walk regularly as this healthy habit safeguards against
disease and impairments 35, and has shown to directly affect autonomy. Given the
importance of population variability, we recommend that each intervention be tailored
to the needs of each subject, since population variability must always be fully taken into
account. Physical frailty indicators must be monitored to identify old people who may
benefit from specific preventive disability initiatives 31. This recommendation applies
specifically to persons presenting values that deviate significantly from the median
values or change markedly over time.
The main limitation of this study was sample size and consequently the statistical
power. The high percentage of persons who dropped out of the study aggravated this
problem. To minimize errors in the scenarios used to predict changes in autonomy,
missing data were not replaced. Any attempt to replace data for frail and dependent
people would obviously introduce errors. Another limitation may be the reliability of
the questionnaires used to measure physical activity and autonomy, since many
participants could not read or write. To minimize negative impact, the absence-of-
dementia criterion was included and an interviewer undertook to fill out questionnaires
for all participants. Even so, IPAQ may overestimate amounts of physical activity 36.
Finally, it should also be noted that the observed decreases in the number of co-
morbidities were due mainly to surgery, in many cases for cataracts.
CONCLUSIONS
The initial level of autonomy and health status seem to moderate the autonomy change
of community-dwelling old adults over a 5-year period; however physical activity
(walking) and fitness (agility and aerobic endurance) also account for autonomy loss
variability, justifying the promotion of intervention programs for the maintenance or
improvement of these factors.
Chapter 7 Influence of health status, physical activity and fitness in autonomy of community-dwelling old adults over a five year period
134
Acknowledgments
The authors would like to thank all the volunteers who participated in this study and
Steve Dyson for reviewing the text in English.
Conflict of interest statement
The authors declare that there is no conflict of interest.
Portuguese Science and Technology Foundation (PhD grant SFRH/BD/31450/2006)
provided financial support to conduct this study.
The sponsors had no role in the design, analysis, or preparation of this manuscript.
REFERENCES 1. WHO. World Health Statistics 2011. 2011 [26 July 2011] Available from URL: http://www.who.int/whosis/whostat/EN_WHS2011_Full.pdf. 2. Eurostat. EU27 population is expected to peak by around 2040. 2011 [26 July 2011]. Available from URL: http://epp.eurostat.ec.europa.eu/cache/ITY_PUBLIC/3-08062011-BP/EN/3-08062011-BP-EN.PDF 3. Friedenberg R. Longevity. Radiology 2002;223:597-601. 4. Lubitz J, Cai L, Kramarow E, Lentzner H. Health, life expectancy and health care spending among the elderly. N Engl J Med. 2003;349(11):1048-55. 5. Seeman TE, Merkin SS, Crimmins EM, Karlamangla AS. Disability trends among older Americans: National Health And Nutrition Examination Surveys, 1988-1994 and 1999-2004. Am J Public Health 2010;100(1):100-7. 6. Crimmins EM, Hayward MD, Hagedorn A, Saito Y, Brouard N. Change in disability-free life expectancy for Americans 70-years-old and older. Demography 2009;46(3):627-46. 7. Hashimoto S, Kawado M, Seko R, Murakami Y, Hayashi M, Kato M et al. Trends in disability-free life expectancy in Japan, 1995-2004. J Epidemiol 2010;20(4):308-12. 8. Donald IP, Foy C, Jagger C. Trends in disability prevalence over 10 years in older people living in Gloucestershire. Age Ageing 2010;39(3):337-42. 9. Van Oyen H, Charafeddine R, Deboosere P, Cox B, Lorant V, Nusselder W et al. Contribution of mortality and disability to the secular trend in health inequality at the turn of century in Belgium. Eur J Public Health 2011 (in press). 10. Abbott AD, Tyni-Lenne R, Hedlund R. Early rehabilitation targeting cognition, behavior, and motor function after lumbar fusion: a randomized controlled trial. Spine (Phila Pa 1976) 2010;35(8):848-57.

Chapter 7 Influence of health status, physical activity and fitness in autonomy of community-dwelling old adults over a five year period
135
11. Paterson DH, Warburton DE. Physical activity and functional limitations in older adults: a systematic review related to Canada's Physical Activity Guidelines. Int J Behav Nutr Phys Act 2010;7:38. 12. Fujiwara Y, Yoshida H, Amano H, Fukaya T, Liang J, Uchida H et al. Predictors of improvement or decline in instrumental activities of daily living among community-dwelling older Japanese. Gerontology 2008;54(6):373-80. 13. Izawa S, Enoki H, Hirakawa Y, Iwata M, Hasegawa J, Iguchi A et al. The longitudinal change in anthropometric measurements and the association with physical function decline in Japanese community-dwelling frail elderly. Br J Nutr 2010;103(2):289-94. 14. Tinetti ME, Mendes de Leon CF, Doucette JT, Baker DI. Fear of falling and fall-related efficacy in relationship to functioning among community-living elders. J Gerontol 1994;49(3):M140-7. 15. Tinetti ME, Kumar C. The patient who falls: "It's always a trade-off". JAMA 2010;303(3):258-66. 16. Cahn-Weiner DA, Farias ST, Julian L, Harvey DJ, Kramer JH, Reed BR et al. Cognitive and neuroimaging predictors of instrumental activities of daily living. J Int Neuropsychol Soc 2007;13(5):747-57. 17. Leon AS, Gaskill SE, Rice T, Bergeron J, Gagnon J, Rao DC et al. Variability in the response of HDL cholesterol to exercise training in the HERITAGE Family Study. Int J Sports Med 2002;23(1):1-9. 18. Rankinen T, Church TS, Rice T, Bouchard C, Blair SN. Cardiorespiratory fitness, BMI, and risk of hypertension: the HYPGENE study. Med Sci Sports Exerc 2007;39(10):1687-92. 19. Dato S, Montesanto A, Lagani V, Jeune B, Christensen K, Passarino G. Frailty phenotypes in the elderly based on cluster analysis: a longitudinal study of two Danish cohorts. Evidence for a genetic influence on frailty. Age (Dordr) 2011. 20. Cieza A, Bostan C, Oberhauser C, Bickenbach JE. Explaining functioning outcomes across musculoskeletal conditions: a multilevel modelling approach. Disabil Rehabil 2010;32 Suppl 1:S85-93. 21. Folstein MF, Folstein SE, McHugh PR. "Mini-mental state". A practical method for grading the cognitive state of patients for the clinician. J Psychiatr Res 1975;12(3):189-98. 22. Rikli R, Jones CJ. The reliability and validity of a 6-minute walk test as a measure of physical endurance in older adults. J Aging Phys Act 1998;6:363-75. 23. Craig CL, Marshall AL, Sjostrom M, Bauman AE, Booth ML, Ainsworth BE et al. International physical activity questionnaire: 12-country reliability and validity. Med Sci Sports Exerc 2003;35(8):1381-95. 24. Rikli R, Jones CJ. Development and validation of a functional fitness test for community-residing older adults. J Aging Phys Act. 1999;7(2):129-61. 25. Rose DJ, Lucchese N, Wiersma LD. Development of a multidimensional balance scale for use with functionally independent older adults. Arch Phys Med Rehabil 2006;87(11):1478-85.
Chapter 7 Influence of health status, physical activity and fitness in autonomy of community-dwelling old adults over a five year period
136
26. Hernandez D, Rose DJ. Predicting which older adults will or will not fall using the Fullerton Advanced Balance scale. Arch Phys Med Rehabil 2008;89(12):2309-15. 27. Zaluska W, Malecka T, Mozul S, Ksiazek A. [Whole body versus segmental bioimpedance measurements (BIS) of electrical resistance (Re) and extracellular volume (ECV) for assessment of dry weight in end-stage renal patients treated by hemodialysis]. Przegl Lek 2004;61(2):70-3. 28. Pluijm SM, Smit JH, Tromp EA, Stel VS, Deeg DJ, Bouter LM et al. A risk profile for identifying community-dwelling elderly with a high risk of recurrent falling: results of a 3-year prospective study. Osteoporos Int 2006;17(3):417-25. 29. Minicuci N, Noale M, Leon Diaz EM, Gomez Leon M, Andreotti A, Mutafova M. Disability-free life expectancy: a cross-national comparison among bulgarian, italian, and latin american older population. J Aging Health 2011;23(4):629-81. 30. Keeler E, Guralnik JM, Tian H, Wallace RB, Reuben DB. The impact of functional status on life expectancy in older persons. J Gerontol A Biol Sci Med Sci 2010;65(7):727-33. 31. Vermeulen J, Neyens JC, van Rossum E, Spreeuwenberg MD, de Witte LP. Predicting ADL disability in community-dwelling elderly people using physical frailty indicators: a systematic review. BMC Geriatr 2011;11:33. 32. Rikli R, Jones CJ. Functional fitness normative scores for community-residing older adults. J Aging Phys Act. 1999;7:160-79. 33. Lee Y, Park KH. Health practices that predict recovery from functional limitations in older adults. Am J Prev Med 2006;31(1):25-31. 34. Silva A, F. B, Marques E, Mota J, R S, Vale S et al. Observatório Nacional da Actividade Física e do Desporto. Livro verde da aptidão física. Lisboa, Instituto do Desporto de Portugal; 2011. 35. Aoyagi Y, Shephard RJ. Habitual physical activity and health in the elderly: the Nakanojo Study. Geriatr Gerontol Int;2010;10 Suppl 1:S236-43. 36. Hagstromer M, Troiano RP, Sjostrom M, Berrigan D. Levels and patterns of objectively assessed physical activity--a comparison between Sweden and the United States. Am J Epidemiol 2010;171(10):1055-64.

Chapter 8 General discussion and recommendations
137
CHAPTER 8 GENERAL DISCUSSION AND RECOMENDATIONS

Chapter 8 General discussion and recommendations
138
DISCUSSION
The main objective of this investigation was to analyze the role of physical activity,
physical fitness, health status and environmental hazards in the occurrence of falls and
injuries, fear of falling and loss of autonomy in community-dwelling adults over 50
years of age. The results indicate that the key element causing a rupture of the system
(the occurrence of falls and injuries, fear of falling and loss of autonomy) in old age,
considering normal circumstances of daily living, is conditions of frailty associated with
the individual. It was also found that, as the individual becomes more fragile, that is, as
increase the risk of intrinsic factors, their susceptibility to extrinsic risk factors rises,
especially with regard to environmental hazards, and the greater their difficulty in
successfully meeting the demands of tasks (without falls, injuries, fear of falling or
disability). Furthermore, performance of activities of daily living is restricted due to
lack of confidence. However, a good level of physical fitness can also increase the risk
of falls and injuries because, as has also been observed by others 1,2, the fittest people
were those who demonstrated most confidence in performing more demanding tasks,
and in more hazardous environments, thereby exposing themselves to more dangerous
situations. According to Braun 3, elderly people are not usually aware of their
predisposition to falls and injuries, and consequently are not able to identify inherent
risk factors with regard to falls; the risk becomes obvious only after the occurrence of
injury or disability.
Similar to other studies 4-6 analyzing risk factors for falls, health status expressed by the
number of diseases and physical impairments reported by the subject was the most
important predictor for the occurrence of falls, and, consequently, for fall-related
injuries, leading to an increase from 12% to 21% in the likelihood of falls for each
additional disease/impairments (dependent on other predictors). Health status was also
the most reliable indicator for explain loss of autonomy in physical functioning.
Moreover, poor health status was shown to drastically limit the ability to perform either
advanced, instrumental or basic activities of daily living. Fujiwara et al.7 also observed
that good or excellent self-assessed health was associated with a decrease in the
likelihood of disability in instrumental and basic activities of daily living from 40.2% to
61%. The study carried out as part of this thesis quantified the increase in the likelihood
of disability associated with each additional co-morbidity from 12% to 33%, depending
on ADL. Moreover, the alteration of the number of co-morbidities over time (5 years)
Chapter 8 General discussion and recommendations
139
also proved to be a significant predictor of changes in physical functioning, accounting
for ~11% of the variance of this issue. Additionally, co-morbidities also seem to
contribute to individual fragility by inducing a fear of falling, since the number of co-
morbidities accounted for 22% the fear of falling variance.
Fear of falling was the second most significant variable in explaining loss of autonomy
(12%), and thus a more important factor than falls and severe injuries. Moreover, in
contrast with previous studies that point to fear of falling as a serious risk factor for falls
and consequent injuries 5, 8, our findings suggest that fear of falling acts mainly as a
self-perception of risk of falling and/or injury resulting from frailty and/or previous
experience of falling or injury. People with greatest fear of falling performed less
physical activity, especially vigorous physical activity and avoided some riskier
everyday tasks like going up and down stairs or getting objects from closets, which may
lead to fewer falls and injuries. However, fear of falling was also the cause for the
individual to avoid not only the riskier activities of daily living but also activities which
could be performed safely 9. Thus, our findings emphasized the importance of
confidence in the maintenance of autonomy in activities of daily living.
As reported in this and other studies 10 11, there is an inverse relationship between the
number of fall-related injuries and autonomy, which is determined by factors that affect
both injuries and autonomy. Still, these common factors seem to demonstrate a higher
propensity for predicting loss of autonomy (a larger area under the ROC curve) than the
occurrence of falls (a smaller area under the ROC curve), as was observed in the present
study and also by other investigators 5, 12-14.
Age is found to be one of the main risk factors for falls, injuries, and loss of
autonomy 15, 16. Nonetheless, it was found that there are old people who do not fall and
have a high level of physical functioning. In contrast, some younger people are frail,
experience fall-related injuries and demonstrate a low level of physical functioning in
activities of daily living. However, age was not found to be a significant predictor of
falls, injuries and loss of autonomy when health status and physical fitness, including
body composition, were also considered in the analysis. Moreover, chronological age
only accounted for 3% to 13% of the variation in physical fitness.
Balance was the physical attribute that most varied with age and contributed to fall
occurrence, while aerobic endurance estimated by means of the 6-min walk test was the
parameter that most contributed to disability in activities of daily living. However, in
order for the prevention of disability in frail and less fit individuals to carry out basic
Chapter 8 General discussion and recommendations
140
activities of daily living, it seems that maintaining body strength and flexibility is
important. Balance and aerobic endurance were found to be the physical attributes
accounting for the greatest differences between adults over 50 years of age and young
adults.
Regarding body composition, increased lean body mass and decreased fat body mass
was found to provide protection against falls, injuries, and disability, besides being
associated with a low level of fear of falling. This work estimate that the likelihood of
falling decreases on 4% and 5% for each additional kg in lean body mass, and for each
1% decrease in fat body mass (~0.7 kg in men and ~0.8 kg in women), respectively.
Furthermore, physical activity was found to prevent falls and consequent injuries.
Probably because physical activity is positively associated with the ability for
successfully performing tasks and also the capacity for avoiding collision in the case of
a fall 17-19. Several previous studies have showed that physical activity decreases the
negative effects of illness and induces a good body composition 20, increasing self-
resistance to injuries by reinforcing locomotion structures, namely bone and muscle 21-
23. In the present study, it was also found that physical activity was positively associated
with a favorable body composition and physical fitness. The accumulation of at least
1,150 MET-min.wk-1 of total physical activity, maintaining vigorous-intensity activity
expenditure below 500 MET-min.wk-1, seems to prevent falls and fall-related injuries.
On the other hand, physical activity helps in the recovery of and/or the delay in the
reduction of some physical functional abilities 24. In this study, the likelihood of
disability in the performance of activities of daily living decreased 3% to 8%
(depending on the activity), for each additional 100 MET-min/wk. Therefore, increasing
walking expenditure over time (5 years), for example, leaded to reduced loss of physical
autonomy or even to an increase, besides decreasing fear of falling.
The practice of vigorous physical activity, especially in less controlled and more
hazardous environments may increase falls and fall-related injuries and contribute to a
loss of autonomy, since fall-related severe injury (e.g. fracture) is a main reason for
disability and dependence. Therefore, a balance must be found between the potential
positive and negative effects of physical activity. The findings of this research may
provide an understanding of why on the one hand some studies have concluded that the
occurrence of falls is associated with inactivity while on the other hand other studies
have shown that it is a high level of activity which accounts for the occurrence of falls,

Chapter 8 General discussion and recommendations
141
particularly when extremely demanding tasks and or hazardous environments are
involved 2, 25, 26.
In agreement with the findings of Tinetti et al. 27, in the present work, an analysis of fall
circumstances demonstrates that most falls occur in the performance of usual or
everyday tasks (96.5%), few falls occur in the performance of unusual and hazardous
tasks (3.3%), and only 0.3% of fall occur during exercise programs. Additionally, it was
found that subjects who fell during the performance of hazardous tasks were mostly
fitter and typically male. In contrast with the findings of other studies showing a higher
number of falls occurring at home28, 29, in this study only 41.4% of falls were found to
occur indoors; while the remaining percentage occurred outdoors (50.6% occurred in
the street, 4.4% on public transport, and 3.6% in other places). However, participants
demonstrated a good level of physical functioning, in accordance with the Composite
Physical Function scale (with a maximum of 24, the mean value was 20.8 ±
3.3 points) 30. Even participants classified as demonstrating a low level of functioning in
this study recorded a mean score of 15±2.4 points and may be considered as showing a
moderate level of functioning 31. Nevertheless, similar to the findings of other studies 27,
30% of subjects fell at least once during the course of one year.
Frail people were not included in this study and consequently old people over 80 years
were poorly represented in the analysis as a whole. At the same time, subjects
demonstrating a lower level of physical functioning were those showing a tendency to
drop out of the follow-up study. As with other studies 32, 33, women were also found to
demonstrate an increased susceptibility to falls and disability in activities of daily
living 12, 34. Females were found to be 38% more likely to fall than males, and gender
(analyzed single) accounted for 10% of the variation in physical functioning. A higher
susceptibility to falls and disability in women as compared with men seems to be caused
by poorer health, body composition and physical fitness. Nevertheless, under similar
conditions of health status (expressed by the number of co-morbidities), body
composition and physical fitness (mainly balance), the probability of falling in men
increases to a level which is approximately twice that of women (due to the fact that
men classically expose themselves to more hazardous situations).
The findings of the 5-year follow-up study seem to support the most relevant results of
cross-sectional studies. Similar predictors for autonomy loss over the 5-year period
were identified and it was found that the major losses of physical attributes over time
occurred in agility/dynamic balance and also aerobic endurance. Moreover, a tendency
Chapter 8 General discussion and recommendations
142
was found for decreased physical activity and fitness, including body composition, and
thus to reduce autonomy over the time; however, there was marked variability across
individuals. The requirement for differentiating intervention programs in accordance
with differences in physical functioning has recently been reported 35-37. Vermeulen et
al. 38 pointed to the importance of monitoring physical frailty indicators in the
community-dwelling elderly in order to allow them to benefit from disability prevention
programs. In the present research it was verified that there are people who deviate
significantly from the average, or whose profile changes markedly over time. In order to
achieve optimal results from prevention programs, these differences should be taken
into account.
The limitations of the present research include the reliability of mathematical models
used to predict falls, fall-related injuries and disability in activities of daily living.
Across participants, there were people showing a high probability of falling but who did
not fall; and the opposite also occurred, with people showing a low probability of falling
who nevertheless had fallen. Consequently, the capacity for discriminating fallers
(AUC) ranged just between 0.71 and 0.75, a range that was no different from the AUCs
reported in other fall studies 5, 6, 13, 32, 33, 39. Furthermore, significant predictors identified
in this study accounted for only ~40% of the variation in physical functioning, revealing
that other factors are involved.
RECOMMENDATIONS
The findings of this research suggest:
• A healthy lifestyle, in order to avoid co-morbidities or, at least, to minimize their
effects.
• The reduction of environmental hazards, principally when fitness decreases and
frailty increases (regardless of the difficulty of tasks), and the restraint of
difficult tasks in hazardous environments.
• The practice at least 1,150 MET-min.wk-1 of total physical activity, with no
more than 500 MET-min.wk-1 of vigorous physical activity.
• The implementation of exercise programs to prevent loss of balance and aerobic
endurance. Further, muscle strength and flexibility exercises may be particularly
relevant for less fit and frail people in order to preserve the ability to perform
basic activities of daily living.
Chapter 8 General discussion and recommendations
143
• The performance of functional exercises that mimic everyday life tasks and
promote confidence.
• Special attention for women, who tend to be more fragile, and for men, who tend
to expose themselves to more hazardous situations.
• Differentiated interventions in accordance with individual needs, especially in
the case of those presenting profiles which deviate significantly from the
average or change markedly over time.
REFERENCES
1. Gill DP, Zou GY, Jones GR, Speechley M. Injurious falls are associated with
lower household but higher recreational physical activities in community-dwelling older
male veterans. Gerontology 2008;54(2):106-15.
2. Peeters GM, Verweij LM, van Schoor NM, Pijnappels M, Pluijm SM, Visser M
et al. Which types of activities are associated with risk of recurrent falling in older
persons? J Gerontol A Biol Sci Med Sci 2010;65(7):743-50.
3. Braun B. Knowledge and perception of fall-related risk factors and fall-reduction
techniques among community-dwelling elderly individuals. Phys Ther
1998;78(12):1262-76.
4. Nitz JC, Choy NL. Falling is not just for older women: support for pre-emptive
prevention intervention before 60. Climacteric 2008;11(6):461-6.
5. Pluijm SM, Smit JH, Tromp EA, Stel VS, Deeg DJ, Bouter LM et al. A risk
profile for identifying community-dwelling elderly with a high risk of recurrent falling:
results of a 3-year prospective study. Osteoporos Int 2006;17(3):417-25.
6. Russell MA, Hill KD, Day LM, Blackberry I, Gurrin LC, Dharmage SC.
Development of the Falls Risk for Older People in the Community (FROP-Com)
screening tool. Age Ageing 2009;38(1):40-6.
7. Fujiwara Y, Yoshida H, Amano H, Fukaya T, Liang J, Uchida H et al. Predictors
of improvement or decline in instrumental activities of daily living among community-
dwelling older Japanese. Gerontology 2008;54(6):373-80.
8. Lloyd BD, Williamson DA, Singh NA, Hansen RD, Diamond TH, Finnegan TP
et al. Recurrent and injurious falls in the year following hip fracture: a prospective study
of incidence and risk factors from the Sarcopenia and Hip Fracture study. J Gerontol A
Biol Sci Med Sci 2009;64(5):599-609.

Chapter 8 General discussion and recommendations
144
9. Tinetti M, Richman D, Powell L. Falls efficacy as a measure of fear of falling. J
Gerontol 1990;45(6):P239-43.
10. Kelsey JL, Berry SD, Procter-Gray E, Quach L, Nguyen US, Li W et al. Indoor
and outdoor falls in older adults are different: the maintenance of balance, independent
living, intellect, and Zest in the Elderly of Boston Study. J Am Geriatr Soc
2010;58(11):2135-41.
11. Aoyama M, Suzuki Y, Onishi J, Kuzuya M. Physical and functional factors in
activities of daily living that predict falls in community-dwelling older women. Geriatr
Gerontol Int.2011;11(3):348-57.
12. Rubio E, Lazaro A, Sanchez-Sanchez A. Social participation and independence
in activities of daily living: a cross sectional study. BMC Geriatr 2009;9:26.
13. Morris R, Harwood RH, Baker R, Sahota O, Armstrong S, Masud T. A
comparison of different balance tests in the prediction of falls in older women with
vertebral fractures: a cohort study. Age Ageing 2007;36(1):78-83.
14. Barrett-Connor E, Weiss TW, McHorney CA, Miller PD, Siris ES. Predictors of
falls among postmenopausal women: results from the National Osteoporosis Risk
Assessment (NORA). Osteoporos Int 2009;20(5):715-22.
15. Gregg EW, Pereira MA, Caspersen CJ. Physical activity, falls, and fractures
among older adults: a review of the epidemiologic evidence. J Am Geriatr Soc
2000;48(8):883-93.
16. de Rekeneire N, Visser M, Peila R, Nevitt MC, Cauley JA, Tylavsky FA et al. Is
a fall just a fall: correlates of falling in healthy older persons. The Health, Aging and
Body Composition Study. J Am Geriatr Soc 2003;51(6):841-6.
17. Chodzko-Zajko WJ, Proctor DN, Fiatarone Singh MA, Minson CT, Nigg CR,
Salem GJ et al. American College of Sports Medicine position stand. Exercise and
physical activity for older adults. Med Sci Sports Exerc 2009;41(7):1510-30.
18. Karinkanta S, Heinonen A, Sievanen H, Uusi-Rasi K, Fogelholm M, Kannus P.
Maintenance of exercise-induced benefits in physical functioning and bone among
elderly women. Osteoporos Int 2009;20(4):665-74.
19. Kannus P. [How to prevent fractures due to accidental falls among elderly
population]. Duodecim 2006;122(2):135-7.
20. Rose DJ. Preventing falls among older adults: no "one size suits all" intervention
strategy. J Rehabil Res Dev 2008;45(8):1153-66.

Chapter 8 General discussion and recommendations
145
21. Kontulainen S, Heinonen A, Kannus P, Pasanen M, Sievanen H, Vuori I. Former
exercisers of an 18-month intervention display residual a BMD benefits compared with
control women 3,5 years post-intervention: a follow-up of a randomised controlled
high-impact trial. Osteoporos Int 2004;15.
22. Stewart K, Bacher A, Hees P, Tayback M, Ouyang P, Beur S. Exercise effects
on bone mineral density. Relationships to change in fitness and fatness. Am J Prev Med
2005;28(5):453-60.
23. Ross R, Berentzen T, Bradshaw AJ, Janssen I, Kahn HS, Katzmarzyk PT et al.
Does the relationship between waist circumference, morbidity and mortality depend on
measurement protocol for waist circumference? Obes Rev 2008;9(4):312-25.
24. Yokoya T, Demura S, Sato S. Three-year follow-up of the fall risk and physical
function characteristics of the elderly participating in a community exercise class. J
Physiol Anthropol 2009;28(2):55-62.
25. Chan BK, Marshall LM, Winters KM, Faulkner KA, Schwartz AV, Orwoll ES.
Incident fall risk and physical activity and physical performance among older men: the
Osteoporotic Fractures in Men Study. Am J Epidemiol 2007;165(6):696-703.
26. Gregg EW, Cauley JA, Seeley DG, Ensrud KE, Bauer DC. Physical activity and
osteoporotic fracture risk in older women. Study of Osteoporotic Fractures Research
Group. Ann Intern Med 1998;129(2):81-8.
27. Tinetti ME, Speechley M, Ginter SF. Risk factors for falls among elderly
persons living in the community. N Engl J Med 1988;319(26):1701-7.
28. Lundebjerg N. Guideline for the prevention of falls in older persons. J Am
Geriatr Soc. 2001;49(5):664-72.
29. Tinetti ME, Speechley M. Prevention of falls among the elderly. N Engl J Med
1989;320(16):1055-9.
30. Rikli R, Jones CJ. Functional fitness normative scores for community-residing
older adults. J Aging Phys Act 1999;7:160-79.
31. Rose DJ, Lucchese N, Wiersma LD. Development of a multidimensional
balance scale for use with functionally independent older adults. Arch Phys Med
Rehabil 2006;87(11):1478-85.
32. Chu LW, Chi I, Chiu AY. Incidence and predictors of falls in the chinese
elderly. Ann Acad Med Singapore 2005;34(1):60-72.
Chapter 8 General discussion and recommendations
146
33. Stalenhoef PA, Diederiks JP, Knottnerus JA, Kester AD, Crebolder HF. A risk
model for the prediction of recurrent falls in community-dwelling elderly: a prospective
cohort study. J Clin Epidemiol 2002;55(11):1088-94.
34. Hardy SE, Allore HG, Guo Z, Gill TM. Explaining the effect of gender on
functional transitions in older persons. Gerontology 2008;54(2):79-86.
35. Leon AS, Gaskill SE, Rice T, Bergeron J, Gagnon J, Rao DC et al. Variability in
the response of HDL cholesterol to exercise training in the HERITAGE Family Study.
Int J Sports Med 2002;23(1):1-9.
36. Rankinen T, Church TS, Rice T, Bouchard C, Blair SN. Cardiorespiratory
fitness, BMI, and risk of hypertension: the HYPGENE study. Med Sci Sports Exerc
2007;39(10):1687-92.
37. Cieza A, Bostan C, Oberhauser C, Bickenbach JE. Explaining functioning
outcomes across musculoskeletal conditions: a multilevel modelling approach. Disabil
Rehabil 2010;32 Suppl 1:S85-93.
38. Vermeulen J, Neyens JC, van Rossum E, Spreeuwenberg MD, de Witte LP.
Predicting ADL disability in community-dwelling elderly people using physical frailty
indicators: a systematic review. BMC Geriatr 2011;11:33.
39. Hernandez D, Rose DJ. Predicting which older adults will or will not fall using
the Fullerton Advanced Balance scale. Arch Phys Med Rehabil 2008;89(12):2309-15.