Embed Size (px)
Citation preview
RESEARCH ARTICLE
Discovery of urinary biomarkers to
discriminate between exogenous and semi-
endogenous thiouracil in cattle: A parallel-like
randomized design
Lieven Van Meulebroek1*, Jella Wauters1, Beata Pomian1, Julie Vanden Bussche1,
Philippe Delahaut2, Eric Fichant2, Lynn Vanhaecke1
1 Laboratory of Chemical Analysis, Department of Veterinary Public Health and Food Safety, Faculty of
Veterinary Medicine, Ghent University, Salisburylaan, Merelbeke, Belgium, 2 Health Department, CER
Groupe, Rue Point du Jour, Marloie, Belgium
Abstract
In the European Union, the use of thyreostats for animal fattening purposes has been
banned and monitoring plans have been established to detect potential abuse. However, this
is not always straightforward as thyreostats such as thiouracil may also have a semi-endoge-
nous origin. Therefore, this study aimed at defining urinary metabolites, which may aid in
defining the origin of detected thiouracil. Hereto, a parallel-like randomized in vivo study was
conducted in which calves (n = 8) and cows (n = 8) were subjected to either a control treat-
ment, rapeseed-enriched diet to induce semi-endogenous formation, or thiouracil treatment.
Urine samples (n = 330) were assessed through metabolic fingerprinting, employing liquid-
chromatography and Q-ExactiveTM Orbitrap mass spectrometry. Urinary fingerprints com-
prised up to 40,000 features whereby multivariate discriminant analysis was able to point out
significant metabolome differences between treatments (Q2(Y)� 0.873). Using the validated
models, a total of twelve metabolites (including thiouracil) were assigned marker potential.
Combining these markers into age-dependent biomarker panels rendered a tool by which
sample classification could be improved in comparison with thiouracil-based thresholds, and
this during on-going thiouracil treatment (specificities� 95.2% and sensitivities� 85.7%),
post-treatment (sensitivities� 80% for� 24 h after last administration), and simulated low-
dose thiouracil treatment (exogenous thiouracil below 30 ng μL-1). Moreover, the metabolic
relevance of revealed markers was supported by the suggested identities, for which a struc-
tural link with thiouracil could be determined in most cases. The proposed biomarker panels
may contribute to a more justified decision-making in monitoring thiouracil abuse.
Introduction
In livestock, the administration of thyreostats has been associated with a significant weight
gain, which is primarily due to an increased water retention by the edible tissues and filling of
PLOS ONE | https://doi.org/10.1371/journal.pone.0195351 April 12, 2018 1 / 22
a1111111111
a1111111111
a1111111111
a1111111111
a1111111111
OPENACCESS
Citation: Van Meulebroek L, Wauters J, Pomian B,
Vanden Bussche J, Delahaut P, Fichant E, et al.
(2018) Discovery of urinary biomarkers to
discriminate between exogenous and semi-
endogenous thiouracil in cattle: A parallel-like
randomized design. PLoS ONE 13(4): e0195351.
https://doi.org/10.1371/journal.pone.0195351
Editor: Juan J Loor, University of Illinois, UNITED
STATES
Received: December 8, 2017
Accepted: March 20, 2018
Published: April 12, 2018
Copyright: © 2018 Van Meulebroek et al. This is an
open access article distributed under the terms of
the Creative Commons Attribution License, which
permits unrestricted use, distribution, and
reproduction in any medium, provided the original
author and source are credited.
Data Availability Statement: Raw data files from
mass spectrometric experiments (in vivo study)
have been made available in the MetaboLights
repository and can be consulted by MTBLS554 and
MTBLS561.
Funding: This work was supported by Federal
Public Service Health (RF 12/6260); URL https://
www.health.belgium.be/en. LVM, JW, and JVB
received the funding. The funders contributed to
this project with regard to the study design and
the gastrointestinal tract. As such, these growth-promoting agents exert a negative effect on
the quality of meat [1]. Moreover, xenobiotic thyreostats have been assigned teratogenic and
carcinogenic properties (group 2b, IARC) [2], implicating that any residues in consumable
matrices may connote a possible risk for human health. Therefore, the use of thyreostats for
animal fattening purposes has been banned in the European Union since 1981 [3]. This ban
implied a strict zero-tolerance policy with respect to the use of thyreostatic drugs and the pres-
ence of their residues in derived animal matrices (i.e. milk, urine, muscle and organ tissue).
This resulted in a constant monitoring by the European Union member states in order to dis-
courage thyreostat abuse, being at risk of severe penalties. In this context, it may be noted that
administration of thyreostats has become rather uncommon because of the fast elimination
kinetics and inefficient growth-promoting actions [4,5]. As such, the use of growth promotors
at very low doses in combination with other drugs, aiming at additional or synergistic effects,
has become more popular in the last decade [6,7].
In recent years, a semi-endogenous origin of the thyreostat thiouracil (TU) has been
reported in urine of livestock upon ingestion of glucosinolate-rich crops, belonging to the
Brassicaceae family [8,9,10]. The discovery of this semi-endogenous origin was a startling find-
ing as the rigid link between detection of urinary TU and its prior use was no longer binding.
Moreover, this finding was able to explain the presence of low TU levels in urine from live-
stock, for which there were no direct indications of illegal administration [11]. Although the
exact mechanisms of endogenous TU formation and the (dietary) triggers have not been fully
uncovered yet [12], it may be clear that the existence of a semi-endogenous origin strongly
impedes the decision-making process concerning a potential illegal use of TU upon its detec-
tion. In this regard, the community of the European Reference Laboratories has suggested uri-
nary TU concentration levels for which a semi-endogenous origin may be presumed, i.e.
below 10 μg L-1 [13]. As such, a recommended concentration of 10 μg L-1 or 10 μg kg-1 was
introduced, which was accompanied with specific analytical requirements for the measure-
ment of certain thyreostats, i.e. TU in urine and thyroid tissue [13]. Unfortunately, a system-
atic occurrence of urine samples, exceeding this recommended TU concentration, has been
observed in recent years [14,15,16]. Therefore, national and international surveys have been
conducted to set a new threshold value that is more accurate to differentiate between exoge-
nous and semi-endogenous TU [5]. More specifically, a recommended TU concentration of
30 μg L-1 was suggested, which is discussed in the latest reflection paper of the European Refer-
ence Laboratories [17]. However, even with this updated threshold, incorrect decision-making
with false compliants or non-compliants is still possible. This could for example be the case for
young male bovines (6 to 12 months) for which the international 99th percentile TU threshold
value was determined to be 35.9 μg L-1; thus exceeding the newly recommended TU concen-
tration [5]. As a consequence, an alternative strategy to discriminate between exogenous and
semi-endogenous thiouracil is highly demanded. In this regard, untargeted profiling tech-
niques may enclose significant value as these could reveal marker molecules that are descrip-
tive for the origin of detected TU. Such a biomarker approach was already proven effective to
unequivocally point out steroid treated animals, i.e. livestock being administered with prednis-
olone [18], 4-androstenedione [19], 17β-nandrolone laureate esters and 17β-estradiol 3-benzo-
ate [20], or nadrolone [21]. Hereby, adequate analytical techniques, including nuclear
magnetic resonance or full-scan mass spectrometry (time of flight, Orbitrap or Fourier trans-
form ion cyclotron resonance), are most suited to perform global metabolome analyses [22].
In this study, it was aimed to reveal a urinary biomarker or marker signature, which is
indicative for exogenous TU administration in bovines and thus able to uncover the true ori-
gin of detected TU. To this extent, a comprehensive in vivo study was carried out in which
calves and adult cows were subjected to various treatments with the intention to obtain urine
Thiouracil administration in cattle and urinary biomarkers
PLOS ONE | https://doi.org/10.1371/journal.pone.0195351 April 12, 2018 2 / 22
supervision. The funders had no role in data
collection and analysis, decision to publish, or
preparation of the manuscript.
Competing interests: The authors have declared
that no competing interests exist.
samples with either no TU (control diet), semi-endogenous TU (rapeseed-enriched diet) or
exogenous TU (control diet and oral TU administration). To map the urinary metabolomes, a
method for metabolic fingerprinting (using ultra-high performance liquid chromatography
(UHPLC) and high-resolution hybrid quadrupole Orbitrap mass spectrometry (HRMS/MS))
was developed.
Materials and methods
Experimental set-up of the in vivo trial
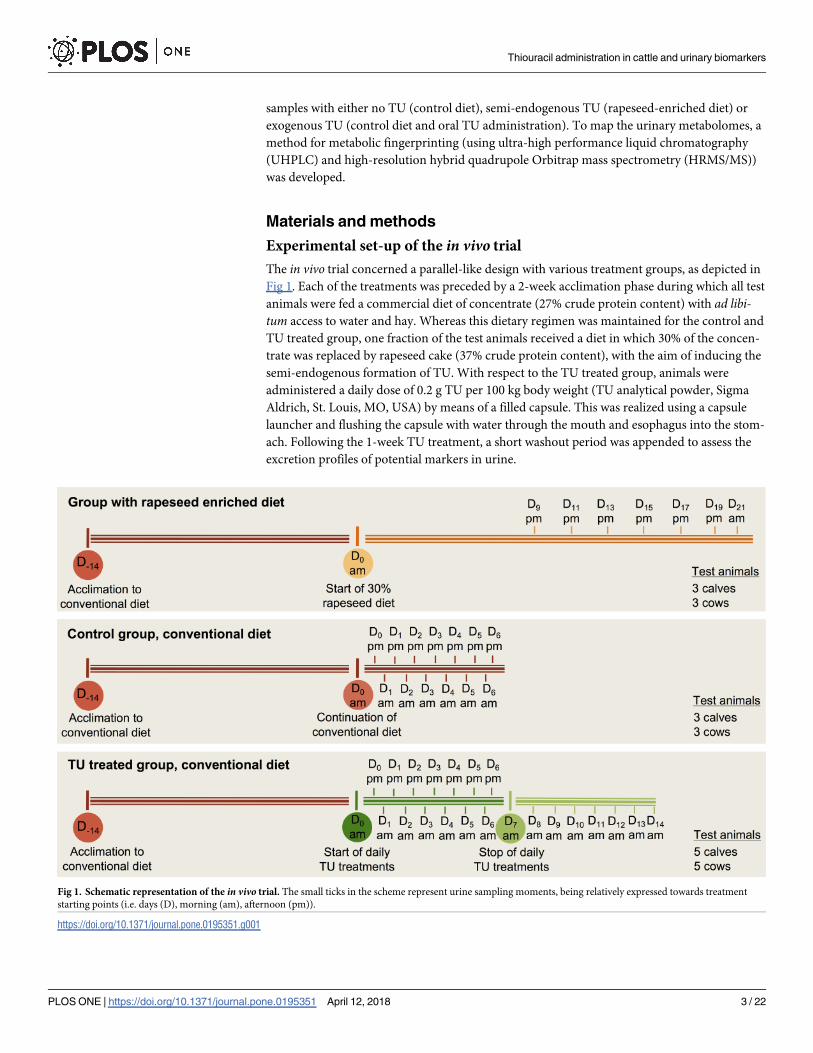
The in vivo trial concerned a parallel-like design with various treatment groups, as depicted in
Fig 1. Each of the treatments was preceded by a 2-week acclimation phase during which all test
animals were fed a commercial diet of concentrate (27% crude protein content) with ad libi-tum access to water and hay. Whereas this dietary regimen was maintained for the control and
TU treated group, one fraction of the test animals received a diet in which 30% of the concen-
trate was replaced by rapeseed cake (37% crude protein content), with the aim of inducing the
semi-endogenous formation of TU. With respect to the TU treated group, animals were
administered a daily dose of 0.2 g TU per 100 kg body weight (TU analytical powder, Sigma
Aldrich, St. Louis, MO, USA) by means of a filled capsule. This was realized using a capsule
launcher and flushing the capsule with water through the mouth and esophagus into the stom-
ach. Following the 1-week TU treatment, a short washout period was appended to assess the
excretion profiles of potential markers in urine.
Fig 1. Schematic representation of the in vivo trial. The small ticks in the scheme represent urine sampling moments, being relatively expressed towards treatment
starting points (i.e. days (D), morning (am), afternoon (pm)).
https://doi.org/10.1371/journal.pone.0195351.g001
Thiouracil administration in cattle and urinary biomarkers
PLOS ONE | https://doi.org/10.1371/journal.pone.0195351 April 12, 2018 3 / 22
Test animals were housed under controlled experimental conditions at the animal facilities
of Centre d’Economie Rurale (CER, Marloie, Belgium), whereby animals were kept in separate
half-covered pens. It was hereby opted to include both cows and calves since an age-dependent
metabolic response towards TU treatment could be expected. All calves (female, 101.6 ± 14.7 kg,
3.3 ± 0.3 months) were of a mixed breed, whereas cows (female, 587.1 ± 98.9 kg, 4.0 ± 1.5 years)
were either of a milk or meat breed. The number of animals within each treatment group is pre-
sented in Fig 1. This in vivo study was approved by CER’s Ethical Committee (CE/Sante/ET004).
Chemicals and reagents
The analytical standards 2-thiouracil (TU), 6-dimethyl-thiouracil, 6-ethyl-thiouracil,
6-methyl-2-thiouracil, 6-propyl-2-thiouracil, and 6-phenyl-thiouracil were purchased from
Sigma-Aldrich (St. Louis, MO, USA), whereas the deuterated internal standard 6-propyl-
2-thiouracil-d5 (PTU-d5) was from Toronto Research Chemicals (Toronto, Canada). Stock (1
mg mL-1) and working solutions (1 and 0.1 ng μL-1) were prepared in methanol and stored in
dark glass bottles at -20˚C.
Reagents were of analytical grade when used for extraction purposes and of LC-MS grade
for UHPLC-MS applications. They were respectively purchased from VWR International
(Merck, Darmstadt, Germany) and Fisher Scientific (Loughborough, UK). Ethylenediamine-
tetraacetic acid (EDTA) was from VWR International (Merck, Darmstadt, Germany) and
hydrogen chloride from Sigma-Aldrich (St. Louis, MO, USA). Phosphate buffer was adjusted
to a pH of 7 and saturated with 1% of DL-dithiothreitol (DTT) (Sigma-Aldrich, St. Louis, MO,
USA). Ultrapure water (0.055 μS cm-1) was obtained by means of a purified-water system (Sar-
torius AG, Gottingen, Germany).
Sample collection, preservation and extraction
Urine samples were collected during feeding upon spontaneous micturition, while carefully
avoiding fecal contamination. Urine was divided into several 5-mL aliquots and treated with
EDTA (final concentration of 0.1 M) and 0.1 M hydrogen chloride (final pH of 1) to inhibit
thyreostat degradation during urine storage [23]. Urine samples were stored at -20˚C for
about one and a half year until metabolomics analyses were performed and thereby thawed at
4˚C prior to extraction. For this relatively long storage period, changes in the metabolic profile
can be assumed as reported by Laparre et al. (2017) [24]. However, these changes were pre-
sumed to be independent of the type of urine sample, corresponding to the various treatments.
Yet, degradation of certain compounds to levels below their limits of detection may have
reduced the initial pool of candidate markers, which also implies that any markers that were
retained in this study are likely to be stable or have low limits of detection.
For development of the extraction protocol, a pool of urine from nine bovines was considered.
These bovines were not treated with TU nor received a rapeseed-enriched diet and were not part
of the experiment as described in Fig 1. Various procedures (S1 Text) were assessed for their ability
to efficiently extract the urinary metabolome, whereby the total number of detectable metabolite
features served as the main indicator of metabolome coverage. Additionally, a targeted focus on
thyreostats was included to respond to the specific research question. The final extraction protocol
was based on the methodology of Vanden Bussche et al. (2010) [25] with some minor modifica-
tions. In brief, 3 mL of urine was enriched with 50 ng PTU-d5 internal standard and supplemented
with 1 mL phosphate buffer, containing 1% of the reducing agent DDT. Hereby, denaturing con-
ditions (65˚C, 30 min) were imposed to impede protein-thyreostat interactions and avoid protein-
based interference. Next, a two-fold liquid-liquid extraction with 5 mL ethyl acetate was per-
formed, after which the pooled supernatants were evaporated to dryness at 60˚C under a gentle
Thiouracil administration in cattle and urinary biomarkers
PLOS ONE | https://doi.org/10.1371/journal.pone.0195351 April 12, 2018 4 / 22
stream of nitrogen. The remaining residue was dissolved in 200 μL ultrapure water (0.1% formic
acid) and methanol (0.1% formic acid) (90/10, v/v). The injection volume was 10 μL. This protocol
can be consulted on protocols.io (dx.doi.org/10.17504).
Liquid chromatography and mass spectrometry
Optimization of the UHPLC method was based on a selection of relevant thyreostats,
described in section “Chemicals and reagents”, whereby the achieved chromatographic resolu-
tion (Rs), peak shape (As), and peak intensity were the main evaluated performance criteria. In
first instance, the selectivity of various C18 columns was assessed, i.e. by considering the
Hypersil Gold (1.8 μm, 2.1 x 100 mm) (Thermo Fisher, San Jose, USA), Kinetex (1.7 μm, 2.1 x
150 mm) (Phenomenex, Torrence, CA, USA), and Acquity HSS T3 (1.8 μm, 2.1 x 100 mm)
(Waters, Manchester, UK) column. In addition, various organic solvents (acetonitrile and
methanol), modifiers (0.1% formic acid and 6.5 mM ammonium bicarbonate), gradient pro-
grams, flow rates and column temperatures were tested. The UHPLC system consisted of a
Dionex Ultimate 3000 XRS pump, coupled to a Dionex Ultimate 3000 RS column compart-
ment and autosampler (Dionex, Amsterdam, The Netherlands). The final methodology
achieved chromatographic separation on an Acquity HSS T3 column (1.8 μm, 2.1 x 100 mm)
(Waters, Zellik, Belgium), whereby a gradient program using 0.1% formic acid in water (sol-
vent A) and 0.1% formic acid in methanol (solvent B) was applied. Following proportions of
solvent A were used: 0–1 min at 90%, 1–3 min from 90 to 79%, 3–5 min from 79 to 20%, 5–9
min from 20 to 0%, 9–12 min at 0%, 12–12.1 from 0 to 90%, followed by 3 min of re-equilibra-
tion. A constant flow rate of 300 μL min-1 and a column oven temperature of 25˚C were set.
Mass spectrometric analysis was carried out using a high-resolution hybrid quadrupole
Q-ExactiveTM Orbitrap mass spectrometer (Thermo Fisher Scientific, San Jose, USA), which
was equipped with a heated electrospray ionization source (HESI-II), operating in polarity
switching mode. Instrumental settings for full-scan MS events were optimized based on the
thyreostats’ peak areas and signal-to-noise ratios and involved a sheath gas flow rate of 2 arbi-
trary units (au), an auxiliary gas flow rate of 10 au, a sweep gas flow rate of 2 au, a capillary
temperature of 250˚C, a heater temperature of 275˚C, a spray voltage of (-)3 kV, and an S-lens
RF level of 50 au. Mass resolution and automatic gain control (AGC) were determined by anal-
ysis of urine extracts, spiked with thyreostats to reach final concentrations of 0.05 ng μL-1.
Final settings were a mass resolution of 70,000 full width at half maximum (FWHM) and an
AGC target of 3 e6 ions. The m/z scan range was set from 100 to 800 Da. In addition, separate
MS/MS fragmentation experiments were performed for identification of revealed markers.
These experiments applied parallel reaction monitoring (PRM) with usage of an inclusion list
and an AGC target of 1 e5 ions, an m/z isolation window of 2.0 Da, a mass resolution of 17,500
FWHM, and a collision energy of 20, 35, and 60 eV. Instrumental control and data processing
were carried out with Chromeleon Express and XCalibur 3.0 software (Thermo Fisher Scien-
tific, San Jose, USA).
Urine samples that were considered for metabolic fingerprinting have previously (after
about a half year of storage) also been analyzed in a targeted fashion using a triple quadrupole
instrument, whereby TU concentrations were determined using matrix-matching calibration
curves [16]. TU concentrations, as discussed in this manuscript, were thus obtained by the
cited targeted approach.
Metabolic fingerprinting of urine samples
For discovery of candidate biomarkers, the urinary fingerprints of the control group were
compared with those of the TU treated group (excl. washout). To this end, urine samples from
Thiouracil administration in cattle and urinary biomarkers
PLOS ONE | https://doi.org/10.1371/journal.pone.0195351 April 12, 2018 5 / 22
both treatment groups were extracted and analyzed in a partly random order, keeping the
batches of the cows and calves separately. With respect to the randomization, it was opted to
alternate between samples from TU treatment and the control group, however, thereby at the
same time achieving data acquisition animal per animal (samples from an animal were, how-
ever, fully randomized). During the discovery phase, data were interpreted in a truly untar-
geted fashion, meaning that the complete metabolic fingerprint was taken into consideration
to seek for candidate markers. Following this, the classification performance of the selected
candidate markers was further evaluated by considering the samples from the rapeseed-
enriched diet and washout group. These samples were analyzed in separate batches according
to cow or calf, and rapeseed-enriched diet or washout. Hereby, samples from a particular ani-
mal were run successively. The acquired full-scan data was processed in a targeted fashion
(XCalibur 3.0 software), meaning that only the previously selected candidate markers were
considered and semi-quantified. During mass spectrometric analysis of urine extracts, quality
control measures were taken by considering external and internal quality control (QC) sam-
ples. QC samples were prepared starting from pooled urine (equal volume contributions from
at least 60 samples), which was extracted according to the standard protocol. External QC sam-
ples were used for instrument stabilization, whereas internal QC samples were included to
monitor and correct for instrumental drift.
Acquired full-scan MS data of study samples were imported into the SieveTM 2.2 software
package (Thermo Fisher Scientific, San Jose, USA) to compose metabolic fingerprints. Metab-
olite features from total ion current chromatograms were extracted, applying peak alignment
and integration. As primary parameters, a frame m/z width of 6 ppm, a frame time width of
0.75 min, and an intensity threshold of 1,000,000 were set. Each of the detected features was
characterized through its retention time (tR) and m/z-value.
Statistical analysis and data interpretation
For multivariate data analysis, SIMCA 14.1 (Umetrics, Malmo, Sweden) was used, whereby
the QC-normalized data matrices served as input data. Data were log-transformed and pareto-
scaled to induce normality and standardize the peak intensity ranges, respectively. In first
instance, unsupervised segregation was checked by principal component analysis (PCA),
allowing to evaluate clustering of QC samples and identify potential outliers. Subsequently,
orthogonal partial least squares discriminant analysis (OPLS-DA) was performed to model
variation and establish separation between investigated treatment groups [26]. Validity of
OPLS-DA models was verified by cross-validation ANOVA (p-value< 0.05), permutation
testing (n = 100), and three model characteristics (R2(X), R2(Y), and Q2(Y), calculated by
7-fold internal cross validation) [27]. With respect to the latter, a Q2(Y)> 0.5 indicated good
model predictability [28]. Validated OPLS-DA models were used to select differentiating
metabolites, thereby considering various mathematical descriptors. In first instance, the S-plot
was used, considering the contribution of an ion towards class separation (i.e. covariance p)
and the reliability of this contribution (i.e. correlation corr(p)). A fixed setting of |p|� 0.05
and varying cut-off value for corr(p) were adopted to establish a first selection or relevant ions
[29]. This strategy was supported by the Variable Importance in Projection scores (� 1) and
Jack-knifed confidence intervals (not across zero) [30,31].
Univariate statistical analyses that were performed within this research used SPSS1 Statis-
tics 23 (IBM, USA), assessing the correlation between variables (i.e. Kendall’s τ whereby a
value of 0.50 was taken as a minimum to conclude significant correlation) or the equality of
population means (i.e. Mann-Whitney nonparametric test, p-value� 0.05 to conclude signifi-
cant differences).
Thiouracil administration in cattle and urinary biomarkers
PLOS ONE | https://doi.org/10.1371/journal.pone.0195351 April 12, 2018 6 / 22
To integrate the various revealed candidate biomarkers into a single biomarker panel that
could be easily used for sample classification, a mathematical descriptor was calculated.
Hereby, the strategy and its inherent equations, as proposed by Dervilly-Pinel et al. (2015)
[32], was applied.
Results and discussion
Analytical methodology for polar metabolite screening
The method of Vanden Bussche et al. (2010) [25] proved itself as one of the better with respect
to metabolome coverage. Indeed, using the urine pool, 34,990 positively and 5,879 negatively
charged features were detected, being slightly outperformed (+10.1%) by the best-ranked
method. However, the methods that were better ranked in terms of metabolome coverage
were not suitable to detect thyreostats. Therefore, the method of Vanden Bussche et al. (2010)
[25] served as the starting point, whereby further optimization efforts were directed towards
an improved metabolome coverage. This was mainly achieved by adjusting the urine starting
volume from 1 to 3 mL. As such, the number of detectable features was increased by 7.3%.
Based on the dilution series of several thyreostats, potential instrument saturation and lack of
linearity were not observed (R2 > 0.99).
With respect to the UHPLC method, the Acquity HSS T3 (1.8 μm, 2.1 x 100 mm) stationary
phase proved most appropriate to achieve proper separation (Rs� 2.07) and symmetric peak
shape (As between 0.8 and 1.2) for all target thyreostats. Furthermore, based on the sensitivity,
peak shape, and chromatographic resolution, a definite selection of the organic solvent, modi-
fier, gradient program, flow rate and column temperature were made, with the final settings
being presented in the section “Sample collection, preservation and extraction”.
Optimal HESI working conditions, described in section “Liquid chromatography and mass
spectrometry”, were determined based on the thyreostats’ peak areas and signal-to-noise
ratios. The optimal AGC setting was 3 e6 ions, which allowed assuming maximal spectral sta-
bility from scan to scan. In addition, based on the improved signal-to-noise ratios and the veri-
fied low mass deviations (< 1.65 ppm), significant effects due to space charging were excluded.
Mass resolution was optimized by pursuing maximum mass accuracy while retaining a suffi-
cient number of data points across the chromatographic peak. A resolution of 70,000 FWHM
was found optimal, being associated with high signal-to-noise ratios and peak areas, while at
least 18 data points per peak were acquired.
Discovery of candidate biomarkers
Urinary fingerprints were established for cows and calves, thereby distinguishing between pos-
itively and negatively charged ions. Fingerprints included 39,961 ions for adult cows and
29,128 ions for calves, with the majority of ions obtained in positive ionization mode (i.e.
63.1% for cows and 69.8% for calves). Associated data matrices of peak intensities were nor-
malized based on the internal QC samples.
PCA-X modelling was performed to evaluate the instrument’s stability during analysis,
reveal the natural patterning of samples, and detect potential outliers. PCA-X score plots (Fig
2) pointed at acceptable instrument stability, sample separation in line with treatments, and
the presence of some deviating samples. A sample was effectively removed when its deviating
behavior was confirmed by the Hotelling’s T2 test (99% critical level). It may be noted that
samples are more scattered in the case of calves, which may reflect metabolic changes that are
associated with growth and maturation [33].
Subsequent to PCA-X, metabolic fingerprints were subjected to OPLS-DA modelling to dif-
ferentiate between the TU treated and control groups. In this context, information about class
Thiouracil administration in cattle and urinary biomarkers
PLOS ONE | https://doi.org/10.1371/journal.pone.0195351 April 12, 2018 7 / 22
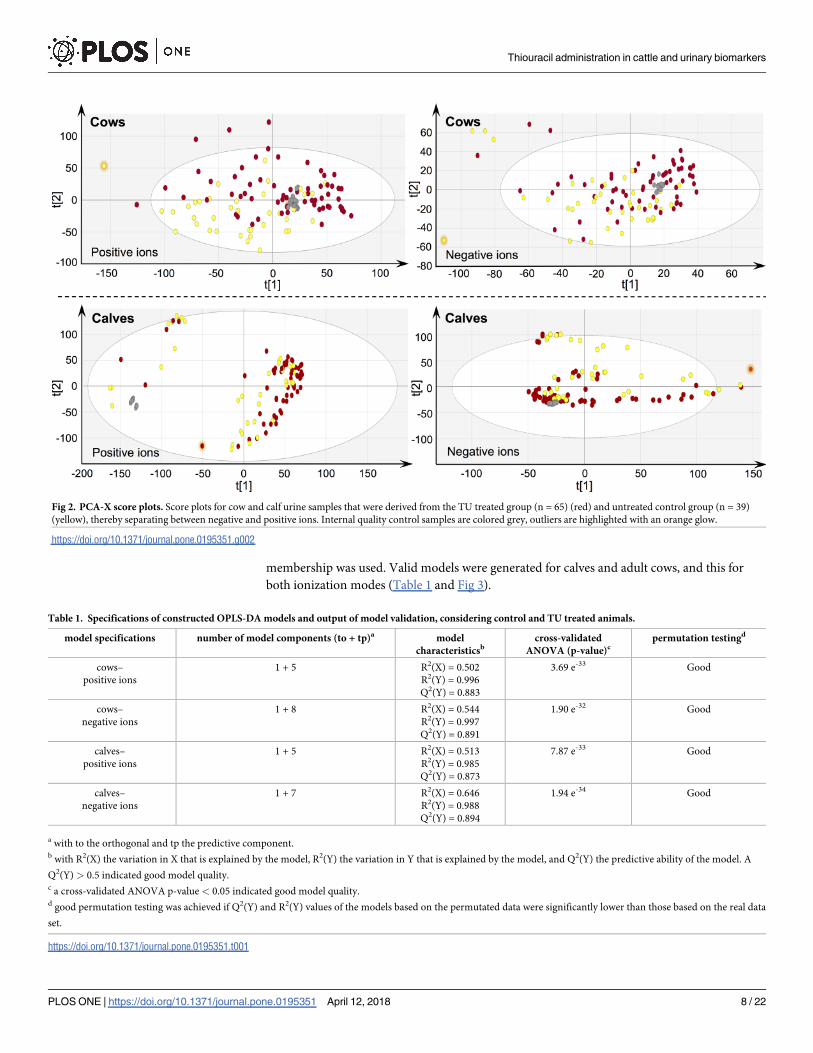
membership was used. Valid models were generated for calves and adult cows, and this for
both ionization modes (Table 1 and Fig 3).
Fig 2. PCA-X score plots. Score plots for cow and calf urine samples that were derived from the TU treated group (n = 65) (red) and untreated control group (n = 39)
(yellow), thereby separating between negative and positive ions. Internal quality control samples are colored grey, outliers are highlighted with an orange glow.
https://doi.org/10.1371/journal.pone.0195351.g002
Table 1. Specifications of constructed OPLS-DA models and output of model validation, considering control and TU treated animals.
model specifications number of model components (to + tp)a model
characteristicsbcross-validated
ANOVA (p-value)cpermutation testingd
cows–
positive ions
1 + 5 R2(X) = 0.502
R2(Y) = 0.996
Q2(Y) = 0.883
3.69 e-33 Good
cows–
negative ions
1 + 8 R2(X) = 0.544
R2(Y) = 0.997
Q2(Y) = 0.891
1.90 e-32 Good
calves–
positive ions
1 + 5 R2(X) = 0.513
R2(Y) = 0.985
Q2(Y) = 0.873
7.87 e-33 Good
calves–
negative ions
1 + 7 R2(X) = 0.646
R2(Y) = 0.988
Q2(Y) = 0.894
1.94 e-34 Good
a with to the orthogonal and tp the predictive component.b with R2(X) the variation in X that is explained by the model, R2(Y) the variation in Y that is explained by the model, and Q2(Y) the predictive ability of the model. A
Q2(Y) > 0.5 indicated good model quality.c a cross-validated ANOVA p-value < 0.05 indicated good model quality.d good permutation testing was achieved if Q2(Y) and R2(Y) values of the models based on the permutated data were significantly lower than those based on the real data
set.
https://doi.org/10.1371/journal.pone.0195351.t001
Thiouracil administration in cattle and urinary biomarkers
PLOS ONE | https://doi.org/10.1371/journal.pone.0195351 April 12, 2018 8 / 22
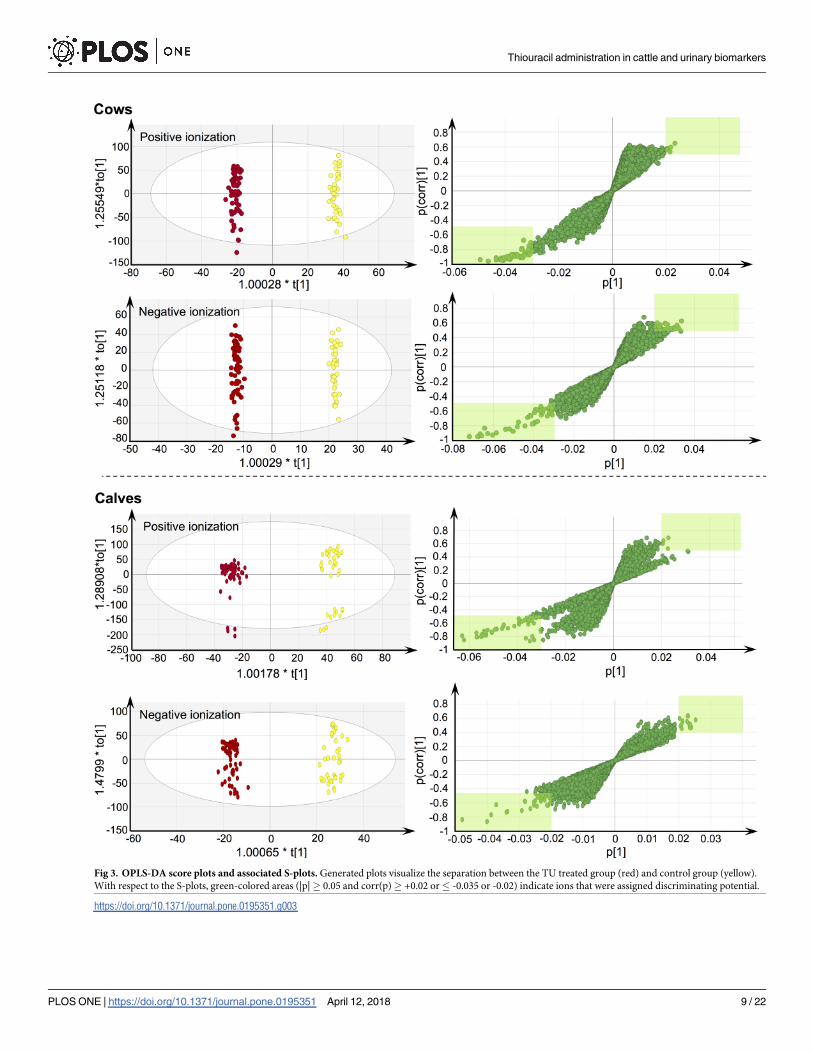
Fig 3. OPLS-DA score plots and associated S-plots. Generated plots visualize the separation between the TU treated group (red) and control group (yellow).
With respect to the S-plots, green-colored areas (|p|� 0.05 and corr(p)� +0.02 or� -0.035 or -0.02) indicate ions that were assigned discriminating potential.
https://doi.org/10.1371/journal.pone.0195351.g003
Thiouracil administration in cattle and urinary biomarkers
PLOS ONE | https://doi.org/10.1371/journal.pone.0195351 April 12, 2018 9 / 22
Using the validated OPLS-DA models, ions with discriminating power towards imposed
treatments were selected for cows and calves, thereby implementing the strategy that was
described in the section “Statistical analysis and data interpretation”. This enclosed the com-
bined use of the S-plot (Fig 3), VIP-score, and Jack-knifed confidence intervals. As such, 76
positive and 21 negative ions were retained for calves, whereas 41 positive and 51 negative ions
were selected for cows. These ions were retained as potential markers, including both indica-
tors for untreated (most abundant in the controls) and TU treated (most abundant in the TU
treated).
Following this, additional exclusions were made by considering sensitivity and specificity,
calculated for each individual candidate marker. Hereto, threshold-values for sample classifica-
tion according to TU origin were determined; i.e. a marker’s mean intensity (μ) plus or minus
three times its standard deviation (σ) [32], as determined for the control group. Based on a
minimum sensitivity and specificity of 80%, the number of candidate markers was reduced to
22 for calves and 53 for cows (S1 and S2 Tables). All of these compounds were found to be ele-
vated under TU treatment, whereby some were considered true qualitative markers, meaning
that their mere presence was able to point out the exogenous origin of detected TU, achieving
the target value for sensitivity and specificity.
Detection of candidate markers upon endogenous TU formation
Using the above-cited selection steps, candidate markers were determined that are able to differ-
entiate between TU treated and untreated animals. However, to meet the principal objective of
this study, these markers should also allow to discriminate between TU treated and untreated
animals in which endogenous TU formation occurs. Therefore, some animals were administered
a rapeseed-enriched diet in order to induce or promote endogenous formation of TU [9]. In this
context, it should be noted that for the untreated control animals, receiving a conventional diet,
low concentration levels of TU were already detected in urine; i.e. 6.1 ± 7.0 μg L-1 (n = 102;
median of 2.48 μg L-1) for calves and 10.8 ± 11.7 μg L-1 (n = 102; median of 5.67 μg L-1) for cows.
As such, the increase in urinary TU that was noted upon consumption of a rapeseed-enriched
diet was rather limited and only significant for calves; i.e. an increase to 14.5 ± 5.8 μg L-1 (n = 35;
median of 14.3 μg L-1; p-value of 8.7 e-9) for calves and to 12.7 ± 10.2 μg L-1 (n = 35; median of
9.19 μg L-1; p-value of 0.057) for cows (Mann-Whitney U, SPSS1 Statistics 23, IBM, USA).
Nevertheless, additional candidate markers (i.e. 4 for the cows and 3 for the calves) could be
excluded since sensitivity or specificity were below 80% when using thresholds (μ ± 3 σ) that
were based on the data from those animals that were fed the rapeseed-enriched diet (S3 and S4
Tables).
Metabolic linkage of candidate markers with urinary TU
To further endorse the relevance of each candidate marker, linkage between the urinary TU
concentrations and marker levels was verified. Although no conclusions about a cause-and-
effect relationship can be made, such a correlation study allowed to indicate metabolic events
that are linked to other indirect effects of oral TU administration (e.g. stress responses). To
this end, two equivalent strategies were considered; i.e. statistical correlation and OPLS
modelling.
Kendall’s τ statistical correlations are presented in S3 and S4 Tables, whereby some candi-
date markers showed low correlation with urinary TU concentration (τ ranging from 0.135 to
0.454) and were therefore considered inferior. As an alternative tool, OPLS-models were estab-
lished to describe the quantitative relationship between the urinary TU concentration and the
metabolic fingerprints. In contrast to OPLS-DA models, the Y-variable is now a quantitative
Thiouracil administration in cattle and urinary biomarkers
PLOS ONE | https://doi.org/10.1371/journal.pone.0195351 April 12, 2018 10 / 22
descriptor (TU concentration) instead of a qualitative classifier [34]. For both cows and calves,
two valid OPLS-DA models were established; one for each ion polarity. These models were
successfully validated by three model characteristics (R2(X)� 0.497, R2(Y)� 0.985, and Q2(Y)
� 0.727), permutation testing (n = 100), and CV-ANOVA (p-values� 9.04 e-10). Subse-
quently, ions that were descriptive towards TU concentration were selected based on the Jack-
knifed confidence interval (not across zero), VIP-score (� 1), and S-plot (corr(p) > 0.50, p�
-0.02 or� 0.025 for calves, p� -0.015 or� 0.020 for cows). As such, additional candidate
markers were excluded (S3 and S4 Tables). Eventually, based on this strategy, the number of
markers was 12 for calves and 27 for cows.
Tentative annotation of markers
Tentative identification of the remaining marker molecules was performed to consolidate their
metabolic involvement in the exogenous administration of TU and extract unique compounds
from isotope or adduct clusters. Hereto, the presence of 13C, 33S and S34 isotopes as well as the
occurrence of multiple ionization adducts (i.e. [M+H]+, [M-H]-, and [M-H2O+H]+) was
assorted. As such, with disregard of TU itself, in total, eleven unique compounds remained for
cows and calves (S1 Fig). Chemical formula assignment and structural elucidation of these
compounds was based on the accurate mass of the 12C structure (allowed deviations for for-
mula matching� 3 ppm), the 13C and 34S isotope profile, a number of heuristic rules [35],
and the PRM-derived fragmentation spectrum (allowed deviations for in silico fragment
matching� 60 ppm or 0.02 Da). Data interpretation was supported by XCalibur 3.0 (Thermo
Fisher Scientific, San Jose, USA), MZmine [35], CSI:FingerID [36], MetFrag [37], MAGMa,
and MZCloud.
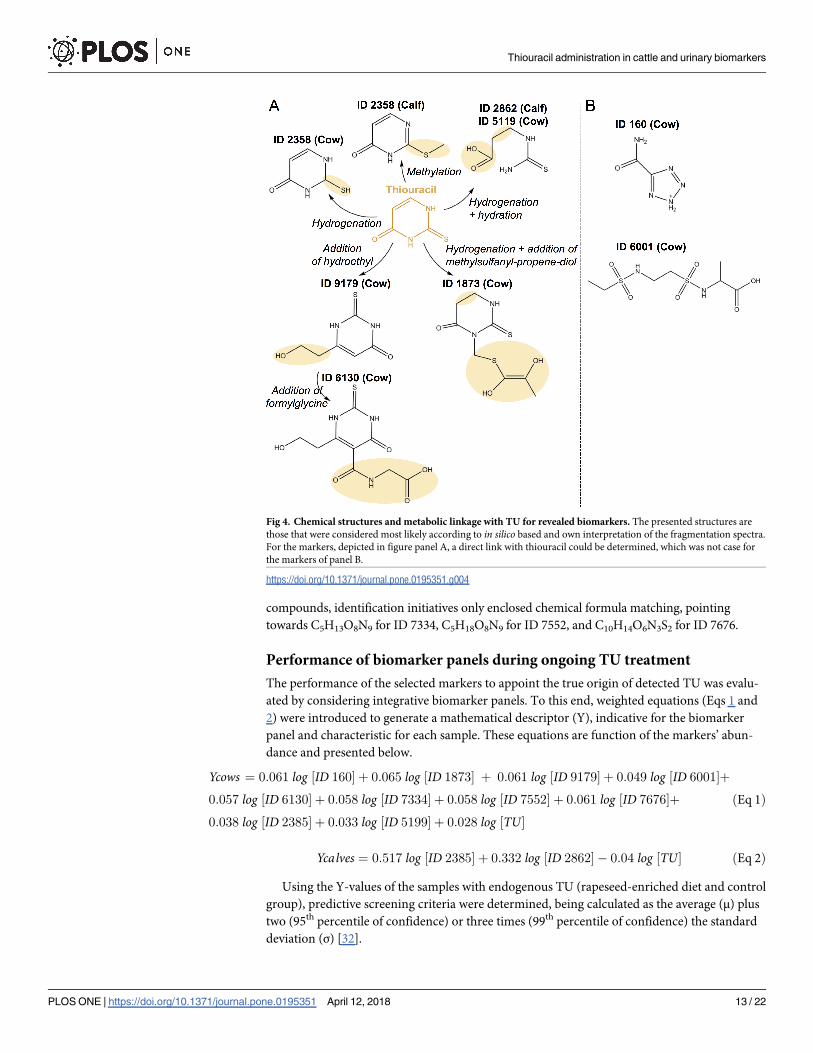
For a first set of compounds (Table 2, Fig 4), a strong structural relationship was noted
between the proposed tentative identities and TU, which of course strongly supports the meta-
bolic qualification of the respective markers. It can be assumed that the associated metaboliza-
tion reactions, as suggested by Fig 4, take place in the liver [38]. However, it is remarkable that
in case of endogenous TU, the suggested reactions were found to be less dominant or even
lacking. Indeed, the urinary excretion of endogenous TU is indicative of an earlier presence in
the blood stream and thus availability for the liver. The hypothesized explanation for this find-
ing relates to the outcome of a recent study [10], by which it was demonstrated that endoge-
nous formation of TU mainly takes place in the colonic part of the digestive system, with the
presumption of an active microbial involvement. As such, the chemical or enzymatic modifica-
tions, inherent to the considered region in the gastro-intestinal tract (pre-colonic region for
exogenous TU and colonic region in case of endogenous TU), may be decisive for the uptake
by the liver or the metabolization reactions as mediated by the liver. Eventually, it should be
noted that endogenous formation may take place in the rumen as well (although rather lim-
ited), which could explain the quantitative marker traits of ID 2385, ID 2835, ID 2862, and ID
5199.
Whereas the suggested identities for ID 2358, ID 2385, ID 2862, and ID 5199 were retrieved
by an in silico based approach (using online databases such as ChemSpider and PubChem), the
structural configuration of ID 1873 and ID 6130 were established otherwise. In silico based
interpretation of the fragmentation data of ID 6130 pointed towards a monocarboxylic acid in
which a sulphur group was present (i.e. PubChem ID 18219810, Table 2). As such, metabolic
qualification of this marker could be presumed although the linkage with TU would involve a
relatively complex metabolization pathway. However, on the basis of the matching fragments,
another chemical configuration could be proposed, whereby the ring substructure could be
substituted by a TU-related configuration (Fig 4). The strong resemblance with ID 9179
Thiouracil administration in cattle and urinary biomarkers
PLOS ONE | https://doi.org/10.1371/journal.pone.0195351 April 12, 2018 11 / 22
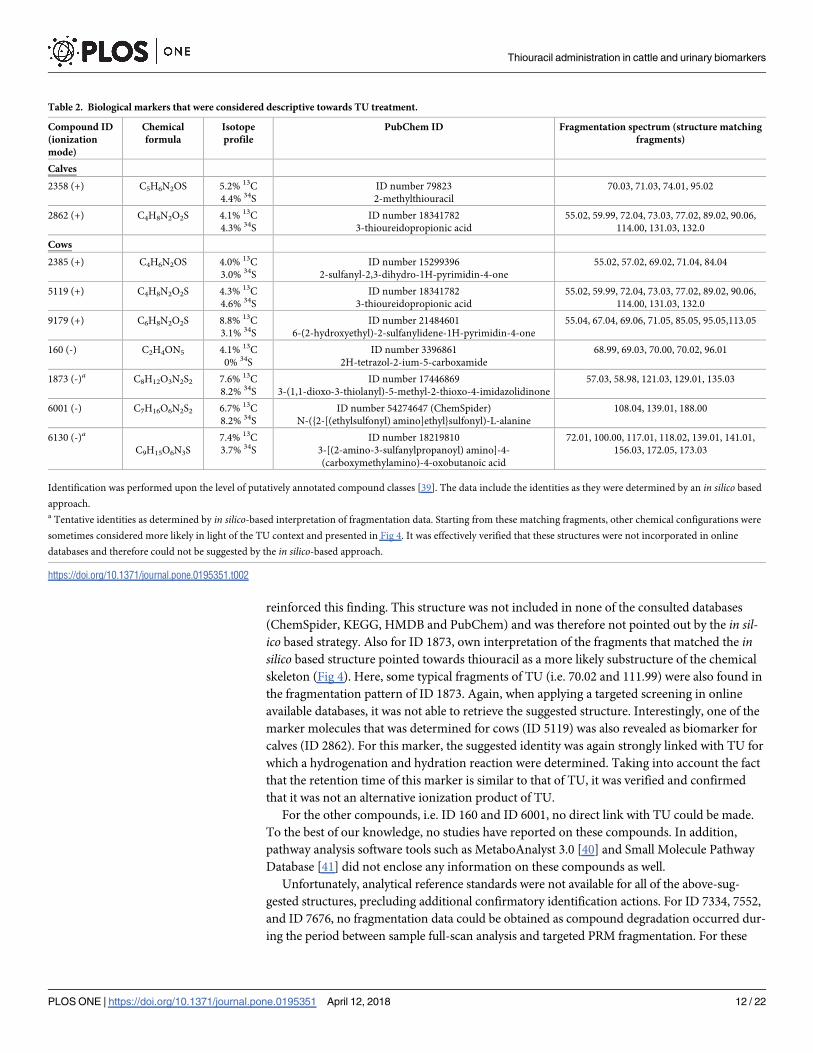
reinforced this finding. This structure was not included in none of the consulted databases
(ChemSpider, KEGG, HMDB and PubChem) and was therefore not pointed out by the in sil-ico based strategy. Also for ID 1873, own interpretation of the fragments that matched the insilico based structure pointed towards thiouracil as a more likely substructure of the chemical
skeleton (Fig 4). Here, some typical fragments of TU (i.e. 70.02 and 111.99) were also found in
the fragmentation pattern of ID 1873. Again, when applying a targeted screening in online
available databases, it was not able to retrieve the suggested structure. Interestingly, one of the
marker molecules that was determined for cows (ID 5119) was also revealed as biomarker for
calves (ID 2862). For this marker, the suggested identity was again strongly linked with TU for
which a hydrogenation and hydration reaction were determined. Taking into account the fact
that the retention time of this marker is similar to that of TU, it was verified and confirmed
that it was not an alternative ionization product of TU.
For the other compounds, i.e. ID 160 and ID 6001, no direct link with TU could be made.
To the best of our knowledge, no studies have reported on these compounds. In addition,
pathway analysis software tools such as MetaboAnalyst 3.0 [40] and Small Molecule Pathway
Database [41] did not enclose any information on these compounds as well.
Unfortunately, analytical reference standards were not available for all of the above-sug-
gested structures, precluding additional confirmatory identification actions. For ID 7334, 7552,
and ID 7676, no fragmentation data could be obtained as compound degradation occurred dur-
ing the period between sample full-scan analysis and targeted PRM fragmentation. For these
Table 2. Biological markers that were considered descriptive towards TU treatment.
Compound ID
(ionization
mode)
Chemical
formula
Isotope
profile
PubChem ID Fragmentation spectrum (structure matching
fragments)
Calves
2358 (+) C5H6N2OS 5.2% 13C
4.4% 34S
ID number 79823
2-methylthiouracil
70.03, 71.03, 74.01, 95.02
2862 (+) C4H8N2O2S 4.1% 13C
4.3% 34S
ID number 18341782
3-thioureidopropionic acid
55.02, 59.99, 72.04, 73.03, 77.02, 89.02, 90.06,
114.00, 131.03, 132.0
Cows
2385 (+) C4H6N2OS 4.0% 13C
3.0% 34S
ID number 15299396
2-sulfanyl-2,3-dihydro-1H-pyrimidin-4-one
55.02, 57.02, 69.02, 71.04, 84.04
5119 (+) C4H8N2O2S 4.3% 13C
4.6% 34S
ID number 18341782
3-thioureidopropionic acid
55.02, 59.99, 72.04, 73.03, 77.02, 89.02, 90.06,
114.00, 131.03, 132.0
9179 (+) C6H8N2O2S 8.8% 13C
3.1% 34S
ID number 21484601
6-(2-hydroxyethyl)-2-sulfanylidene-1H-pyrimidin-4-one
55.04, 67.04, 69.06, 71.05, 85.05, 95.05,113.05
160 (-) C2H4ON5 4.1% 13C
0% 34S
ID number 3396861
2H-tetrazol-2-ium-5-carboxamide
68.99, 69.03, 70.00, 70.02, 96.01
1873 (-)a C8H12O3N2S2 7.6% 13C
8.2% 34S
ID number 17446869
3-(1,1-dioxo-3-thiolanyl)-5-methyl-2-thioxo-4-imidazolidinone
57.03, 58.98, 121.03, 129.01, 135.03
6001 (-) C7H16O6N2S2 6.7% 13C
8.2% 34S
ID number 54274647 (ChemSpider)
N-({2-[(ethylsulfonyl) amino]ethyl}sulfonyl)-L-alanine
108.04, 139.01, 188.00
6130 (-)a
C9H15O6N3S
7.4% 13C
3.7% 34S
ID number 18219810
3-[(2-amino-3-sulfanylpropanoyl) amino]-4-
(carboxymethylamino)-4-oxobutanoic acid
72.01, 100.00, 117.01, 118.02, 139.01, 141.01,
156.03, 172.05, 173.03
Identification was performed upon the level of putatively annotated compound classes [39]. The data include the identities as they were determined by an in silico based
approach.a Tentative identities as determined by in silico-based interpretation of fragmentation data. Starting from these matching fragments, other chemical configurations were
sometimes considered more likely in light of the TU context and presented in Fig 4. It was effectively verified that these structures were not incorporated in online
databases and therefore could not be suggested by the in silico-based approach.
https://doi.org/10.1371/journal.pone.0195351.t002
Thiouracil administration in cattle and urinary biomarkers
PLOS ONE | https://doi.org/10.1371/journal.pone.0195351 April 12, 2018 12 / 22
compounds, identification initiatives only enclosed chemical formula matching, pointing
towards C5H13O8N9 for ID 7334, C5H18O8N9 for ID 7552, and C10H14O6N3S2 for ID 7676.
Performance of biomarker panels during ongoing TU treatment
The performance of the selected markers to appoint the true origin of detected TU was evalu-
ated by considering integrative biomarker panels. To this end, weighted equations (Eqs 1 and
2) were introduced to generate a mathematical descriptor (Y), indicative for the biomarker
panel and characteristic for each sample. These equations are function of the markers’ abun-
dance and presented below.
Ycows ¼ 0:061 log ½ID 160� þ 0:065 log ½ID 1873� þ 0:061 log ½ID 9179� þ 0:049 log ½ID 6001�þ
0:057 log ½ID 6130� þ 0:058 log ½ID 7334� þ 0:058 log ½ID 7552� þ 0:061 log ½ID 7676�þ
0:038 log ½ID 2385� þ 0:033 log ½ID 5199� þ 0:028 log ½TU�
ðEq 1Þ
Ycalves ¼ 0:517 log ½ID 2385� þ 0:332 log ½ID 2862� � 0:04 log ½TU� ðEq 2Þ
Using the Y-values of the samples with endogenous TU (rapeseed-enriched diet and control
group), predictive screening criteria were determined, being calculated as the average (μ) plus
two (95th percentile of confidence) or three times (99th percentile of confidence) the standard
deviation (σ) [32].
Fig 4. Chemical structures and metabolic linkage with TU for revealed biomarkers. The presented structures are
those that were considered most likely according to in silico based and own interpretation of the fragmentation spectra.
For the markers, depicted in figure panel A, a direct link with thiouracil could be determined, which was not case for
the markers of panel B.
https://doi.org/10.1371/journal.pone.0195351.g004
Thiouracil administration in cattle and urinary biomarkers
PLOS ONE | https://doi.org/10.1371/journal.pone.0195351 April 12, 2018 13 / 22
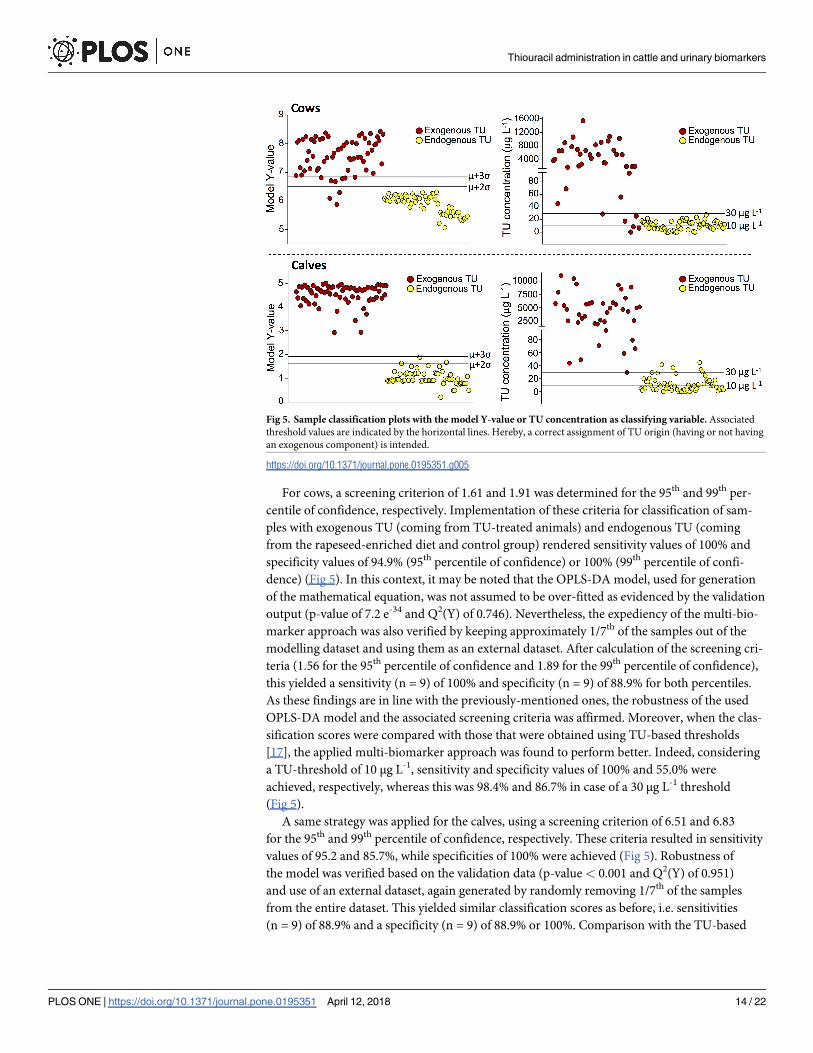
For cows, a screening criterion of 1.61 and 1.91 was determined for the 95th and 99th per-
centile of confidence, respectively. Implementation of these criteria for classification of sam-
ples with exogenous TU (coming from TU-treated animals) and endogenous TU (coming
from the rapeseed-enriched diet and control group) rendered sensitivity values of 100% and
specificity values of 94.9% (95th percentile of confidence) or 100% (99th percentile of confi-
dence) (Fig 5). In this context, it may be noted that the OPLS-DA model, used for generation
of the mathematical equation, was not assumed to be over-fitted as evidenced by the validation
output (p-value of 7.2 e-34 and Q2(Y) of 0.746). Nevertheless, the expediency of the multi-bio-
marker approach was also verified by keeping approximately 1/7th of the samples out of the
modelling dataset and using them as an external dataset. After calculation of the screening cri-
teria (1.56 for the 95th percentile of confidence and 1.89 for the 99th percentile of confidence),
this yielded a sensitivity (n = 9) of 100% and specificity (n = 9) of 88.9% for both percentiles.
As these findings are in line with the previously-mentioned ones, the robustness of the used
OPLS-DA model and the associated screening criteria was affirmed. Moreover, when the clas-
sification scores were compared with those that were obtained using TU-based thresholds
[17], the applied multi-biomarker approach was found to perform better. Indeed, considering
a TU-threshold of 10 μg L-1, sensitivity and specificity values of 100% and 55.0% were
achieved, respectively, whereas this was 98.4% and 86.7% in case of a 30 μg L-1 threshold
(Fig 5).
A same strategy was applied for the calves, using a screening criterion of 6.51 and 6.83
for the 95th and 99th percentile of confidence, respectively. These criteria resulted in sensitivity
values of 95.2 and 85.7%, while specificities of 100% were achieved (Fig 5). Robustness of
the model was verified based on the validation data (p-value < 0.001 and Q2(Y) of 0.951)
and use of an external dataset, again generated by randomly removing 1/7th of the samples
from the entire dataset. This yielded similar classification scores as before, i.e. sensitivities
(n = 9) of 88.9% and a specificity (n = 9) of 88.9% or 100%. Comparison with the TU-based
Fig 5. Sample classification plots with the model Y-value or TU concentration as classifying variable. Associated
threshold values are indicated by the horizontal lines. Hereby, a correct assignment of TU origin (having or not having
an exogenous component) is intended.
https://doi.org/10.1371/journal.pone.0195351.g005
Thiouracil administration in cattle and urinary biomarkers
PLOS ONE | https://doi.org/10.1371/journal.pone.0195351 April 12, 2018 14 / 22
classification scores (a sensitivity of 90.8% and specificity of 100%) indicated a better perfor-
mance of the multi-marker approach in case that the 95th percentile of confidence screening
criterion was implemented. Consideration of the 10 μg L-1 threshold was not of any value as
unacceptable results were obtained for sample classification (sensitivity and
specificity� 53.8%) (Fig 5).
Based on the listed classification scores, it may be concluded that the presented biomarker
panels may assist in differentiating between samples with endogenous and exogenous TU,
with the latter originating from ongoing treatment. This statement is especially true for the
cows, where the relatively high number of marker molecules contributes towards excellent
predictability.
Performance of biomarker panels at low exogenous TU levels
Next to the classification performance of the biomarker panels in case of ongoing TU treat-
ment, the markers’ performance in those situations in which low levels of exogenous TU are
more likely is also relevant, i.e. in case of a recently ended treatment or when TU is adminis-
tered as a low-dose drug cocktail.
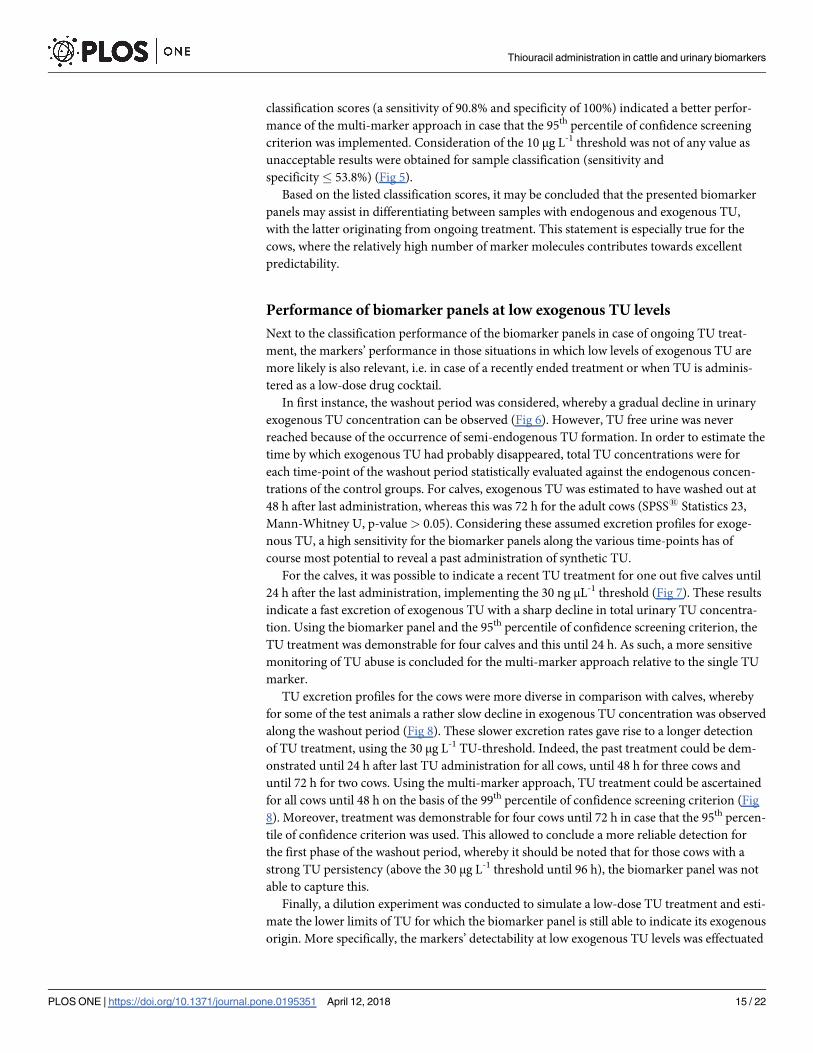
In first instance, the washout period was considered, whereby a gradual decline in urinary
exogenous TU concentration can be observed (Fig 6). However, TU free urine was never
reached because of the occurrence of semi-endogenous TU formation. In order to estimate the
time by which exogenous TU had probably disappeared, total TU concentrations were for
each time-point of the washout period statistically evaluated against the endogenous concen-
trations of the control groups. For calves, exogenous TU was estimated to have washed out at
48 h after last administration, whereas this was 72 h for the adult cows (SPSS1 Statistics 23,
Mann-Whitney U, p-value > 0.05). Considering these assumed excretion profiles for exoge-
nous TU, a high sensitivity for the biomarker panels along the various time-points has of
course most potential to reveal a past administration of synthetic TU.
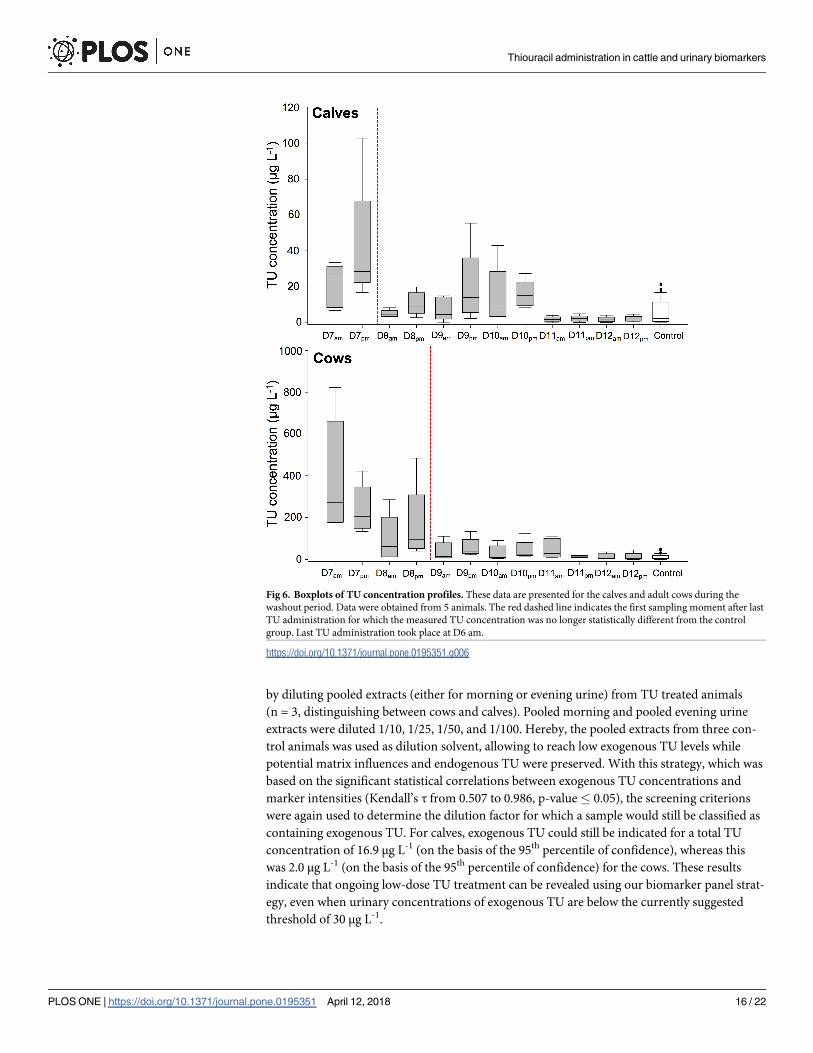
For the calves, it was possible to indicate a recent TU treatment for one out five calves until
24 h after the last administration, implementing the 30 ng μL-1 threshold (Fig 7). These results
indicate a fast excretion of exogenous TU with a sharp decline in total urinary TU concentra-
tion. Using the biomarker panel and the 95th percentile of confidence screening criterion, the
TU treatment was demonstrable for four calves and this until 24 h. As such, a more sensitive
monitoring of TU abuse is concluded for the multi-marker approach relative to the single TU
marker.
TU excretion profiles for the cows were more diverse in comparison with calves, whereby
for some of the test animals a rather slow decline in exogenous TU concentration was observed
along the washout period (Fig 8). These slower excretion rates gave rise to a longer detection
of TU treatment, using the 30 μg L-1 TU-threshold. Indeed, the past treatment could be dem-
onstrated until 24 h after last TU administration for all cows, until 48 h for three cows and
until 72 h for two cows. Using the multi-marker approach, TU treatment could be ascertained
for all cows until 48 h on the basis of the 99th percentile of confidence screening criterion (Fig
8). Moreover, treatment was demonstrable for four cows until 72 h in case that the 95th percen-
tile of confidence criterion was used. This allowed to conclude a more reliable detection for
the first phase of the washout period, whereby it should be noted that for those cows with a
strong TU persistency (above the 30 μg L-1 threshold until 96 h), the biomarker panel was not
able to capture this.
Finally, a dilution experiment was conducted to simulate a low-dose TU treatment and esti-
mate the lower limits of TU for which the biomarker panel is still able to indicate its exogenous
origin. More specifically, the markers’ detectability at low exogenous TU levels was effectuated
Thiouracil administration in cattle and urinary biomarkers
PLOS ONE | https://doi.org/10.1371/journal.pone.0195351 April 12, 2018 15 / 22
by diluting pooled extracts (either for morning or evening urine) from TU treated animals
(n = 3, distinguishing between cows and calves). Pooled morning and pooled evening urine
extracts were diluted 1/10, 1/25, 1/50, and 1/100. Hereby, the pooled extracts from three con-
trol animals was used as dilution solvent, allowing to reach low exogenous TU levels while
potential matrix influences and endogenous TU were preserved. With this strategy, which was
based on the significant statistical correlations between exogenous TU concentrations and
marker intensities (Kendall’s τ from 0.507 to 0.986, p-value� 0.05), the screening criterions
were again used to determine the dilution factor for which a sample would still be classified as
containing exogenous TU. For calves, exogenous TU could still be indicated for a total TU
concentration of 16.9 μg L-1 (on the basis of the 95th percentile of confidence), whereas this
was 2.0 μg L-1 (on the basis of the 95th percentile of confidence) for the cows. These results
indicate that ongoing low-dose TU treatment can be revealed using our biomarker panel strat-
egy, even when urinary concentrations of exogenous TU are below the currently suggested
threshold of 30 μg L-1.
Fig 6. Boxplots of TU concentration profiles. These data are presented for the calves and adult cows during the
washout period. Data were obtained from 5 animals. The red dashed line indicates the first sampling moment after last
TU administration for which the measured TU concentration was no longer statistically different from the control
group. Last TU administration took place at D6 am.
https://doi.org/10.1371/journal.pone.0195351.g006
Thiouracil administration in cattle and urinary biomarkers
PLOS ONE | https://doi.org/10.1371/journal.pone.0195351 April 12, 2018 16 / 22
Fig 7. TU excretion profiles for calves. Comparison of TU concentration levels and biomarker profiles in their capacity to indicate past TU treatment (last
administration took place at D6am). For each classification strategy, the associated threshold values are presented.
https://doi.org/10.1371/journal.pone.0195351.g007
Thiouracil administration in cattle and urinary biomarkers
PLOS ONE | https://doi.org/10.1371/journal.pone.0195351 April 12, 2018 17 / 22
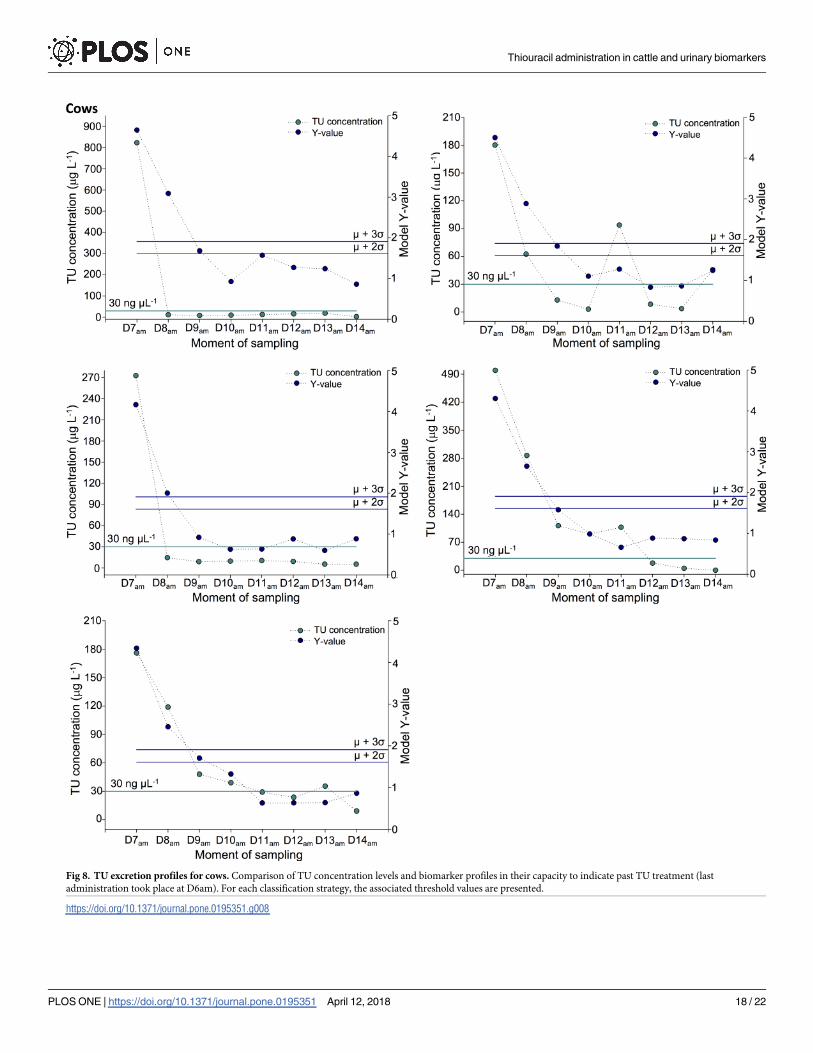
Fig 8. TU excretion profiles for cows. Comparison of TU concentration levels and biomarker profiles in their capacity to indicate past TU treatment (last
administration took place at D6am). For each classification strategy, the associated threshold values are presented.
https://doi.org/10.1371/journal.pone.0195351.g008
Thiouracil administration in cattle and urinary biomarkers
PLOS ONE | https://doi.org/10.1371/journal.pone.0195351 April 12, 2018 18 / 22
Supporting information
S1 Text. Tested extraction protocols. Protocols that were tested for the efficient extraction
and high metabolome coverage of metabolites from urine, thereby having a particular focus on
thyreostats.
(DOCX)
S1 Table. Ions that were retained as candidate markers for calves. Ions were able to discrim-
inate between TU treated and untreated calves. All ions showed the highest abundance upon
TU treatment.
(DOCX)
S2 Table. Ions that were retained as candidate markers for cows. Ions were able to discrimi-
nate between TU treated and untreated cows. All ions showed the highest abundance upon
TU treatment.
(DOCX)
S3 Table. Filtering of candidate markers for calves. Selection of candidate markers based on
the sensitivity and specificity as determined for the TU treated calves and those that received
the rapeseed-enriched diet. In addition, based on metabolic linkage (correlation coefficient
and OPLS modelling), additional certainty about the metabolic involvement of the markers
with respect to TU treatment was obtained.
(DOCX)
S4 Table. Filtering of candidate markers for cows. Selection of candidate markers based on
the sensitivity and specificity as determined for the TU treated cows and those that received
the rapeseed-enriched diet. In addition, based on metabolic linkage (correlation coefficient
and modelling), additional certainty about the metabolic involvement of the markers with
respect to TU treatment was obtained.
(DOCX)
S1 Fig. Chromatograms for the eleven metabolite markers. Chromatograms were acquired
from samples from TU treated animals, with characteristic information about the retention
time (RT), m/z-value, ionization adduct, intensity, and tentative chemical configuration.
(DOCX)
Acknowledgments
The authors would like to thank M. Naessens, D. Stockx, J. Goedgebuer and M. Dubois for
their contributions to this research, mainly relating to sample analysis and data interpretation.
Author Contributions
Conceptualization: Jella Wauters, Julie Vanden Bussche, Philippe Delahaut, Eric Fichant,
Lynn Vanhaecke.
Data curation: Jella Wauters, Beata Pomian, Philippe Delahaut, Eric Fichant.
Formal analysis: Lieven Van Meulebroek, Beata Pomian, Eric Fichant.
Funding acquisition: Julie Vanden Bussche, Lynn Vanhaecke.
Investigation: Lieven Van Meulebroek, Julie Vanden Bussche.
Methodology: Lieven Van Meulebroek, Jella Wauters, Beata Pomian.
Thiouracil administration in cattle and urinary biomarkers
PLOS ONE | https://doi.org/10.1371/journal.pone.0195351 April 12, 2018 19 / 22
Resources: Philippe Delahaut.
Supervision: Julie Vanden Bussche, Philippe Delahaut, Eric Fichant, Lynn Vanhaecke.
Validation: Lieven Van Meulebroek, Beata Pomian.
Visualization: Lieven Van Meulebroek.
Writing – original draft: Lieven Van Meulebroek.
Writing – review & editing: Jella Wauters, Lynn Vanhaecke.
References1. Batjoens P, De Brabander HF, De Wasch K. Rapid and high-performance analysis of thyreostatic drug
residues in urine using gas chromatography-mass spectrometry. J Chromatogr A. 1996; 750: 127–132.
https://doi.org/10.1016/0021-9673(96)00406-2 PMID: 8938385
2. International Agency for Research on Cancer. IARC monographs on the evaluation of carcinogenic
risks to humans. URL (http://monographs.iarc.fr/ENG/Classification/index.php/) (Accessed at June 1st
2017).
3. European Community. Official Journal of the European Community. 1981;L 222: 32–33
4. De Brabander HF, Verbeke R. Analysis of anti-hormones. 1984; 3: 162–165. https://doi.org/10.1016/
0165-9936(84)88011-5
5. Wauters J, Vanden Bussche J, Bizec B Le, Kiebooms JAL, Dervilly-Pinel G, Prevost S, et al. Toward a
new European threshold to discriminate illegally administered from naturally occurring thiouracil in live-
stock. J Agric Food Chem. 2015; 63: 1339–1346. https://doi.org/10.1021/jf504475f PMID: 25611753
6. Shanker B.P., Manjunatha Prabhu B.H., Chandan S., Ranjith D., Shivakumar V. Rapid Methods for
detection of Veterinary Drug residues in Meat. Vet World. 2009; 3(5):241–246. https://doi.org/10.5455/
vetworld.2010.241–246
7. Spornraft M., Kirchner B., Pfaffl M.W., Irmgard R. The potential of circulating extracellular small RNAs
(smexRNA) in veterinary diagnostics–Identifying biomarker signatures by multivariate data analysis.
(2015). Biomol Detect and Quantif. 2015; 5:15–22. https://doi.org/10.1016/j.bdq.2015.08.001 PMID:
27077039
8. Pinel G, Mathieu S, Cesbron N, Maume D, De Brabander HF, Andre F, et al. Evidence that urinary
excretion of thiouracil in adult bovine submitted to a cruciferous diet can give erroneous indications of
the possible illegal use of thyrostats in meat production. Food Addit Contam. 2006; 23: 974–980.
https://doi.org/10.1080/02652030600806370 PMID: 16982518
9. Vanden Bussche J, Vanhaecke L, Deceuninck Y, Wille K, Bekaert K, Le Bizec B, et al. Ultra-high perfor-
mance liquid chromatography coupled to triple quadrupole mass spectrometry detection of naturally
occurring thiouracil in urine of untreated livestock, domesticated animals and humans. Food Addit Con-
tam Part A. 2011; 28: 166–172.
10. Kiebooms JAL, Vanden Bussche J, Hemeryck LY, Fievez V, Vanhaecke L. Intestinal microbiota contrib-
ute to the endogenous formation of thiouracil in livestock. J Agric Food Chem. 2012; 60: 7769–7776.
https://doi.org/10.1021/jf3017145 PMID: 22834937
11. EFSA. Report for 2013 on the results from the monitoring of veterinary medicinal product residues and
other substances in live animals and animal products. EFSA Supporting Publications. 2015; 12(11): 1–
69.
12. Vanden Bussche J, Kiebooms JAL, De Clercq N, Deceuninck Y, Le Bizec B, De Brabander HF, et al.
Feed or food responsible for the presence of low-level thiouracil in urine of livestock and humans? J
Agric Food Chem. 2011; 59: 5786–5792. https://doi.org/10.1021/jf200556x PMID: 21504236
13. CRL guidance paper. URL (http://www.bvl.bund.de/SharedDocs/Downloads/09_Untersuchungen/
EURL_Empfehlungen_Konzentrationsauswahl_Methodenvalierungen_EN.pdf?_blob=
publicationFile&v=2) (Accessed at June 1st 2017)
14. Le Bizec B, Bichon E, Deceuninck Y, Prevost S, Monteau F, Antignac JP, et al. Toward a criterion for
suspect thiouracil administration in animal husbandry. Food Addit Contam—Part A Chem Anal Control
Expo Risk Assess. 2011; 28: 840–847. https://doi.org/10.1080/19440049.2011.565483 PMID:
21547795
15. Woźniak B, Witek S, Żmudzki J, Kłopot A. Natural Occurrence of Thiouracil in Urine of Livestock in
Poland. Bull Vet Inst Pulawy. 2012; 56: 611–615. https://doi.org/10.2478/v10213-012-0108-z
16. Wauters J, Van Meulebroek L, Fichant E, Delahaut P, Vanhaecke L. Discrimination between Syntheti-
cally Administered and Endogenous Thiouracil Based on Monitoring of Urine, Muscle, and Thyroid
Thiouracil administration in cattle and urinary biomarkers
PLOS ONE | https://doi.org/10.1371/journal.pone.0195351 April 12, 2018 20 / 22
Tissue: An in Vivo Study in Young and Adult Bovines. J Agric Food Chem. 2017; 65: 6231–6239.
https://doi.org/10.1021/acs.jafc.7b01920 PMID: 28692258
17. Sterk SS, Blokland MH, de Rijke A, van Ginkel LA. EURL reflection paper: Natural growth promoting
substances in biological samples. 2014: 1–68.
18. De Clercq N, Vanden Bussche J, Van Meulebroek L, Croubels S, Delahaut P, Buyst D, et al. Metabolic
fingerprinting reveals a novel candidate biomarker for prednisolone treatment in cattle. Metabolomics.
2016; 12: 1–14. https://doi.org/10.1007/s11306-015-0887-3
19. Anizan S, Bichon E, Duval T, Monteau F, Cesbron N, Antignac JP, et al. Gas chromatography coupled
to mass spectrometry-based metabolomic to screen for anabolic practices in cattle: Identification of 5α-
androst-2-en-17- one as new biomarker of 4-androstenedione misuse. J Mass Spectrom. 2012; 47:
131–140. https://doi.org/10.1002/jms.2035 PMID: 22282099
20. Dervilly-Pinel G, Weigel S, Lommen A, Chereau S, Rambaud L, Essers M, et al. Assessment of two
complementary liquid chromatography coupled to high resolution mass spectrometry metabolomics
strategies for the screening of anabolic steroid treatment in calves. Anal Chim Acta. Elsevier B.V.;
2011; 700: 144–154. https://doi.org/10.1016/j.aca.2011.02.008 PMID: 21742127
21. Scarth JP, Clarke A, Hands J, Teale P, Mill AC, Macarthur R, et al. Validation of an Analytical Biomarker
Approach for the Detection of Nandrolone Abuse in the Porcine. Chromatographia. 2010; 72: 297–305.
https://doi.org/10.1365/s10337-010-1652-4
22. Theodoridis GA, Gika HG, Want EJ, Wilson ID. Liquid chromatography-mass spectrometry based
global metabolite profiling: A review. Anal Chim Acta. Elsevier B.V.; 2012; 711: 7–16. https://doi.org/10.
1016/j.aca.2011.09.042 PMID: 22152789
23. Vanden Bussche J, Sterk SS, De Brabander HF, Blokland MH, Deceuninck Y, Le Bizec B, et al. Thyreo-
static drugs, stability in bovine and porcine urine. Anal Bioanal Chem. 2012; 403: 2973–2982. https://
doi.org/10.1007/s00216-012-5739-7 PMID: 22349321
24. Laparre J, Kaabia Z, Mooney M, Buckley T, Sherry M, Le Bizec B, et al. Impact of storage conditions on
the urinary metabolomics fingerprint. Anal Chim Acta. 2017; 951: 99–107. https://doi.org/10.1016/j.aca.
2016.11.055 PMID: 27998490
25. Vanden Bussche J, Vanhaecke L, Deceuninck Y, Verheyden K, Wille K, Bekaert K, et al. Development
and validation of an ultra-high performance liquid chromatography tandem mass spectrometry method
for quantifying thyreostats in urine without derivatisation. J Chromatogr A. Elsevier B.V.; 2010; 1217:
4285–4293. https://doi.org/10.1016/j.chroma.2010.04.030 PMID: 20471019
26. Xie GX, Ni Y, Su MM, Zhang YY, Zhao AH, Gao XF, et al. Application of ultra-performance LC-TOF MS
metabolite profiling techniques to the analysis of medicinal Panax herbs. Metabolomics. 2008; 4: 248–
260.
27. Eriksson L, Trygg J, Wold S. CV-ANOVA for significance testing of PLS and OPLS®models. J Che-
mom. 2008; 22: 594–600. https://doi.org/10.1007/s11306-008-0115-5
28. Hawkins DM, Basak SC, Mills D. Assessing model fit by cross-validation. J Chem Inf Comput Sci. 2003;
43: 579–586. https://doi.org/10.1021/ci025626i PMID: 12653524
29. Wiklund S, Johansson E, Sjostrom L, Mellerowicz EJ, Edlund U, Shockcor JP, et al. Visualization of GC/
TOF-MS-based metabolomics data for identification of biochemically interesting compounds using OPLS
class models. Anal Chem. 2008; 80: 115–122. https://doi.org/10.1021/ac0713510 PMID: 18027910
30. Wager S, Hastie T, Efron B. Confidence Intervals for Random Forests: The Jackknife and the Infinitesi-
mal Jackknife. 2013; 15: 1625–1651. https://doi.org/10.1016/j.surg.2006.10.010 Use
31. Cho H-W, Kim SB, Jeong MK, Park Y, Miller NG, Ziegler TR, et al. Discovery of metabolite features for
the modelling and analysis of high-resolution NMR spectra. Int J Data Min Bioinform. 2008; 2: 176–92.
PMID: 18767354
32. Dervilly-Pinel G, Chereau S, Cesbron N, Monteau F, Le Bizec B. LC-HRMS based metabolomics
screening model to detect various β-agonists treatments in bovines. Metabolomics. 2015; 11: 403–411.
33. Egli CP, Blum JW. Clinical, haematological, metabolic and endocrine traits during the first three months
of life of suckling simmentaler calves held in a cow-calf operation. Zentralbl Veterinarmed A. 1998; 45:
99–118. PMID: 9591474
34. Trygg J, Holmes E, Lundstedt T. Chemometrics in metabonomics. J Proteome Res. 2007; 6: 469–479.
https://doi.org/10.1021/pr060594q PMID: 17269704
35. Pluskal T, Uehara T, Yanagida M. Highly accurate chemical formula prediction tool utilizing high-resolu-
tion mass spectra, MS/MS fragmentation, heuristic rules, and isotope pattern matching. Anal Chem.
2012; 84: 4396–4403. https://doi.org/10.1021/ac3000418 PMID: 22497521
36. Duhrkop K, Shen H, Meusel M, Rousu J, Bocker S. Searching molecular structure databases with tan-
dem mass spectra using CSI:FingerID. Proc Natl Acad Sci. 2015; 112: 12580–12585. https://doi.org/
10.1073/pnas.1509788112 PMID: 26392543
Thiouracil administration in cattle and urinary biomarkers
PLOS ONE | https://doi.org/10.1371/journal.pone.0195351 April 12, 2018 21 / 22
37. Ridder L, Van Der Hooft JJJ, Verhoeven S, De Vos RCH, Van Schaik R, Vervoort J. Substructure-
based annotation of high-resolution multistage MSn spectral trees. Rapid Commun Mass Spectrom.
2012; 26: 2461–2471. https://doi.org/10.1002/rcm.6364 PMID: 22976213
38. Hardikar W, Suchy FJ. Hepatobiliary Function. In: Boron WF, Boulpaep EL, editors. Medical Physiol-
ogy. New York: Saunders; 2003. p. 975–1002.
39. Sumner LW, Amberg A, Barrett D, Beale MH, Beger R, Daykin CA, et al. Proposed minimum reporting
standards for chemical analysis: Chemical Analysis Working Group (CAWG) Metabolomics Standards
Initiative (MSI). Metabolomics. 2007; 3: 211–221. https://doi.org/10.1007/s11306-007-0082-2 PMID:
24039616
40. Xia J, Wishart DS. Using MetaboAnalyst 3.0 for Comprehensive Metabolomics Data Analysis. Curr Pro-
toc Bioinforma. 2016; 14.10.1–14.10.91. https://doi.org/10.1002/cpbi.11 PMID: 27603023
41. Frolkis A, Knox C, Lim E, Jewison T, Law V, Hau DD, et al. SMPDB: The small molecule pathway data-
base. Nucleic Acids Res. 2009; 38: 480–487. https://doi.org/10.1093/nar/gkp1002 PMID: 19948758
Thiouracil administration in cattle and urinary biomarkers
PLOS ONE | https://doi.org/10.1371/journal.pone.0195351 April 12, 2018 22 / 22


![Identification of Urinary Biomarkers for Exercise-Induced ...downloads.hindawi.com/journals/bmri/2020/3030793.pdf · reduce the incidence of upper respiratory tract infection (URTI)[12–14]](https://img.pdfslide.us/doc/110x75/5f771a201d33fc06fa73c456/identification-of-urinary-biomarkers-for-exercise-induced-reduce-the-incidence.jpg)