Embed Size (px)
Citation preview
1 23
Journal of Business Ethics ISSN 0167-4544 J Bus EthicsDOI 10.1007/s10551-016-3048-3
Truthfulness in Accounting: How toDiscriminate Accounting Manipulatorsfrom Non-manipulators
Alina Beattrice Vladu, Oriol Amat &Dan Dacian Cuzdriorean
1 23
Your article is protected by copyright and all
rights are held exclusively by Springer Science
+Business Media Dordrecht. This e-offprint
is for personal use only and shall not be self-
archived in electronic repositories. If you wish
to self-archive your article, please use the
accepted manuscript version for posting on
your own website. You may further deposit
the accepted manuscript version in any
repository, provided it is only made publicly
available 12 months after official publication
or later and provided acknowledgement is
given to the original source of publication
and a link is inserted to the published article
on Springer's website. The link must be
accompanied by the following text: "The final
publication is available at link.springer.com”.
Truthfulness in Accounting: How to Discriminate AccountingManipulators from Non-manipulators
Alina Beattrice Vladu1 • Oriol Amat2 • Dan Dacian Cuzdriorean1
Received: 18 August 2014 / Accepted: 28 January 2016
� Springer Science+Business Media Dordrecht 2016
Abstract Accountants preparing information are in a
position to manipulate the view of economic reality pre-
sented in such information to interested parties. These
manipulations can be regarded as morally reprehensible
because they are not fair to users, they involve in an unjust
exercise of power, and they tend to weaken the authority of
accounting regulators. This paper develops a model for
detecting earnings manipulators using financial statements’
ratios in a sample of Spanish listed companies. Our results
provide evidence that accounting data can be extremely
useful in detecting manipulators. This approach can be
used by a large category of users of accounting information
among which we can cite stock exchange supervisors or
investing professionals.
Keywords Accounting ethics � Earnings manipulation �Accounting users � Earnings management �Financial reporting
Introduction
Akerlof and Shiller (2009), giving their view on financial
corruption, asserted that accounting plays its role in this
context since it makes it appear that the firm is doing better
than its true performance. Major corporate scandals like
Enron, WorldCom or Tyco have all been linked directly or
indirectly to deception, misleading, and untruthful
accounting. Similarly, the former global crisis of the
financial system was associated with false accounting. In
the light of such evidence, the accounting profession con-
tinues to struggle with the problem of veracity of its
reports.
Over time, the users of accounting information gravi-
tated to a coherence notion of truth despite the fact that
accounting-standard setters agreed that the usefulness of
decision making is the ultimate objective of financial
reporting, and not truthfulness.
Truthfulness and pernicious earnings management (re-
garded as antithetical, in the view of Ronen and Yaari
2010) raised a host of questions that are of concern to
regulators, academics, practitioners, and press. For
instance, Briloff (1972, 1981, 1990, 2001), among other
scholars, asserted that the accounting profession is keen to
revive a moral order where the truth must be provided
along with true and fair presentations of corporate
performance.
The problem with the truthfulness of accounting
reports was examined by previous research in the con-
text of managers using discretion for both informational
and opportunistic reasons (Feltham et al. 2006; Chris-
tensen and Demski 2003; Bradshaw and Sloan 2002).
While the informative role arises from a large category
of users‘ demand for information about the underlying
economics of their firms, opportunistic motivations
appear when managers bias users‘ perspectives. There-
fore, sometimes managers use their rationality equated
with pursuing self-interest in the opportunistic sense
(Fama 1980; Fama and Jensen 1983; Hsiang-Lin et al.
2008).
& Alina Beattrice Vladu
Oriol Amat
Dan Dacian Cuzdriorean
1 Babes-Bolyai University, Cluj-Napoca, Romania
2 Universitat Pompeu Fabra, Barcelona, Spain
123
J Bus Ethics
DOI 10.1007/s10551-016-3048-3
Author's personal copy

The past few years have seen a significant increase in
the degree of empirical evidence consistent with oppor-
tunism in accounting (McVay 2006; Bowen et al. 2002;
Schrand and Walther 2000). As a result, there has also been
an increased interest in the mechanisms used to promote
truthfulness in accounting, such as harsh penalties for
violating the code of ethics; professional skepticism; and
enforcing rules, laws, and regulations or continuous efforts
conducted in order to improve the models used to assess
the existence and magnitude of opportunistic behavior.
Regarded as a problem in ‘‘need of immediate remedial
action’’ (Dechow and Skinner 2000), earnings manipula-
tion and opportunism have been linked to lax ethics (Lucas
2004). A basic cornerstone of all previous ideas regarding
the earnings manipulation conceals short- or long-term
value, affecting the earnings numbers and their interpre-
tations, with the scope to hide or distort the real financial
performance or financial condition of a firm. In the end,
what makes earnings management practices scandalous is
not only their violation of investor protection laws but their
clash with general, accepted social norms or good practices
(Ball 2009). In this respect, empirical analysis of financial
reporting is beneficial, if for no other reason than to help
increase awareness and ethical behavior.
This paper is concerned with gray earnings management
practices consisting of the ‘‘manipulation of reports within
the boundaries of compliance with bright-line standards,
which could be either opportunistic or efficiency enhanc-
ing’’ (Ronen and Yaari 2010, p. 25). The connotation of
gray earnings management is that it is immoral even when
it does not involve fraud (Bruns and Merchant 1990;
Carpenter and Reimers 2001; Shafer 2002). Therefore, our
study regards the manipulation of earnings as an obstacle
for truthfulness and a potential factor for destabilization of
companies.
Despite the large number of papers purporting to iden-
tify techniques to assess earnings management practices
used by manipulators, few studies approached simple
methods to detect such behavior and even fewer utilized
ratio analysis in this demarche. According to Altman
(1968), academics seem to move toward the elimination of
ratio analysis as an analytical technique used in assessing
the performance of the firm. Widely used by practitioners,
ratio analysis is abandoned by scholars worldwide in their
attempt to develop more and more sophisticated tools to
assess the effects of opportunistic behavior of managers.
The preferred methods used to assess the behavior of
manipulators, are based on the assumption that accruals
unexplained by a linear projection on firm-level observ-
ables (known as discretionary accruals) represent either
explicit earnings management or poor quality earnings.
Such techniques often assume that the residual from a
linear regression represents earnings management.
Despite their popularity, a major limitation of this
research is that existing techniques for measuring earnings
management lack power and are often misspecified. In this
respect, the large majority of the existing techniques suffer
from measurement error and correlated omitted variables,
which lead to Type 1 errors (i.e., rejection of a true null
hypothesis of no earnings management) and Type 2 errors
(i.e., failure to reject a false null hypothesis of no earnings
management). However, there is no systematic evidence
bearing on the relative performance of the most popular
models used at detecting earnings management practices.
Moreover, the most common techniques for measuring
earnings management have not significantly changed in
over 30 years. The main limitations are enumerated in
Dechow et al. (1995).
Since few improvements have been made since Dechow
et al. (1995), alternative techniques have been proposed for
assessing the behavior of manipulators. Concerned mainly
with the negative side of earnings manipulation practices
(Gong et al. 2008), our paper builds upon the literature
approaching the improvement of various models used for
detecting earnings manipulation and assessing its magni-
tude (Dechow et al. 1995, 2012).
Specifically, we build upon the literature by examining a
simple and cost-effective way to discriminate between the
behavior of manipulators and non-manipulators using
financial statement ratios. Similarly to Beneish (1999) we
tried to follow a more traditional path to uncover the
behavior of manipulators using ratio analysis combined
with a multiple discriminant statistical methodology. Our
investigation was motivated by the controversial interpre-
tations of previous evidence on identifying manipulators
and by the fact that this stream of research has not reached
a definite conclusion (Dechow and Skinner 2000; Healy
and Wahlen 1999; Schipper 1989). In addition, our paper is
motivated by standard-setters’ interest in financial report-
ing quality, and by theoretical debates on whether truth-
fulness has a place in business world.
The prediction of manipulative behavior of Spanish
companies is used as an illustrative case. We have con-
ducted our tests using a sample of listed companies that
manipulated their earnings and available companies listed
on the Spanish Stock Exchange that were known as fol-
lowing ‘‘good practices’’ in the period 2005–2012. There-
fore, our paper extends the literature of ratio analysis
combined with rigorous statistical technique used in the
context of earnings manipulation. Our ultimate goal is to
stimulate further research in an area that has the potential
to yield valuable insights.
The remainder of our paper is organized as follows.
Section ‘‘Truthfulness and the Ethics of Earnings Manip-
ulation in Accounting’’ reviews and evaluates existing
research on truthfulness and ethics in accounting.
A. B. Vladu et al.
123
Author's personal copy
Section ‘‘Earnings Management and the Spanish Economic
Environment’’ motivates our investigation of earnings
management practices in the Spanish environment. Sec-
tion ‘‘Research Design’’ describes the research design, and
the results are analyzed in ‘‘Analysis of Data’’ Section.
Section ‘‘Discussion’’ concludes the paper.
Truthfulness and the Ethics of EarningsManipulation in Accounting
If to be taken as objective, communication must respond to
reality. However, in the last years, the business environ-
ment has learned that communication should be treated
with caution.
Today’s business environment is trying to grapple with a
painful past of economic scandals, fraud, and abuse of rules
and principles. In the light of such events, the trust between
individuals was affected. Being an essential feature of
correct communication (as Kant argued), truth-telling and
ethics must provide the blueprint for the future. Both ethics
and truthfulness must be placed in the context of human
relationships (Mele 2009), as individuals’ thoughts about
economic reality can become norms partially linked to how
the world is.
The matter of truth and ethics in accounting is a com-
plex one. Despite the fact that it was extensively approa-
ched in philosophy, and economics, truthfulness is viewed
as an appealing concept with various nuances; depending
on the individual’s concern with ethics, morality, and the
commitment with which they perform their tasks.
Empirical studies like those conducted by Kirkham
(1997) revealed significant disputes regarding the nature of
the philosophical problem of truth. For instance, McKernan
and O’Donnell (2002) concluded that it is better not to
engage in any search for the meaning of truth in accounting.
Shapiro (1997) adds that no scientific method will permit
anyone to discover or observe absolute accounting truth.
Defined as ‘‘an understanding of truth’’ (Rescher 2007),
it is important to assess the truthfulness concept since
‘‘truth and depth, not practical usefulness, power, or con-
sensus, have the last word’’ in the social practice of
accounting (Bunge 1996). Ueno (1948) defines truthfulness
as that in which ‘‘there has to be no manipulation’’ (p. 5),
while Kurosawa (1979) regarded it as similar to being
‘‘fair.’’
Truthfulness, unlike the truth, depends on the will.
Therefore, truthfulness has to do with the agreement
between our statement and our beliefs. In the case of truth,
the emphasis is on the relationship between our statements
and the facts to which they refer, as Kant asserted.
Bayou et al. (2011) argued that the question of true
accounting created a problem that the accounting
profession considered to be largely a technical, economic
measurement matter, ignoring its ethical ramifications. In
this regard, Bayou et al. (2011), using McCumber (2005)
work on the question of truth, concluded that accounting
truth inescapably has a significant ethical dimension.
The issue of truthfulness in accounting should be a
helpful tool used for assessing social relationships or
mediating human affairs. Ethics, on the other hand, directs
human actions and provides the basis to develop profes-
sional behavior.
When manipulating accounting information, both
truthfulness and ethics concur. Moreover, when discussing
acceptance or rejection of such practices, scholars use the
argument of truthfulness or truth (Beaudoin et al. 2014;
Marsh 2013). In this respect, the emphasis is on the
rightness or wrongness of individual actions. Popularly,
scholars make reference to false, misleading or fraudulent
financial reporting as if there could exist absolute true, non-
fraudulent, non-misleading financial reporting.
Since there are many ways to describe reality, to think
appropriately about truthfulness and ethics in accounting is
a challenge. Our claim is that, accounting should faithfully
represent the economic reality, and should not mislead.
Only when the information provided by accounting is not
false, misleading or fraudulent can it be inferred that it is
somehow true. Assessed under a technical view, truthful-
ness can be defined by its qualitative characteristics such as
reliability, neutrality or representational faithfulness.
Concerning the quality of communicative relationships
between managers and shareholders in the light of con-
flicting interests (i.e., compensation, insider trading, turn-
over, and management buyouts), the ethics of accounts
manipulation provides interesting discussions regarding the
acceptance of such practices. Moreover, when considering
the ethicality or truthfulness of certain accounting prac-
tices, the importance of situating (as McCumber 2005
approached it), should be taken into consideration.
Under such view, the accounting construction of what is
considered to be the truth is based on a certain framework,
generally accepted, as a norm of good practices in society,
respecting both the spirit and the letter of the law. Doyle
et al. (2003) broke down the difference between GAAP and
non-GAAP earnings, and explained the cases where dis-
cretion is not legitimate. In this respect, Doyle et al. (2003)
associated non-GAAP earnings reporting with opportunis-
tic earnings management. As such, a perfectly legitimate
‘‘discretion can be found in firms that are telling the truth
within the framework of Generally Accepted Accounting
Principles’’ (Parfet 2000).
Defined as psychological projections onto the world,
norms have the potential to help accountants to enhance
truthfulness and ethics, as Bunge (1996) concluded: ‘‘Thou
shalt search for the truth, pursue it wherever it may lead,
Truthfulness in Accounting: How to Discriminate Accounting Manipulators from Non-manipulators
123
Author's personal copy
and communicate it to whoever may be interested in it.’’
On the other hand, both truthfulness and ethics can help
individuals and society to act in such a way as to commit to
maxim.
One particular aspect of business ethics is the high
information asymmetry between management and the users
of accounting information, where usually the former has
information that it keeps from the other side. Sometimes,
the information disclosed is simply not presented according
to economic reality.
Dye (1988) rationalizes that manipulative behavior is
possible due to external and internal demands for such
behavior. In this respect, the external demand follows from
the capital market’s need to price the company. Due to
external demand, managers often apply the type of rea-
soning expounded in utilitarian rather than in deontological
theories of ethics. Moreover, there may be circumstances in
which the utilitarian approach does not require any moral
considerations (MacIntyre 1981, pp. 14–15; Williams
1985, p. 75). On the other hand, the internal demand comes
from the principal–agent relationship (Jensen and Meck-
ling 1976).
Analyzed by Kreps (1990, p. 745), the behavior of
manipulators can be explained through the actions of such
individuals who are engaging in manipulation and ‘‘would
break their word or engage in misrepresentation under the
right circumstances.’’ Ronen and Yaari (2010), described
the manipulation of earnings as a deliberate action to
influence reported earnings and their interpretation. Also
defined as non-truth-telling, earnings management prac-
tices are marked as pernicious by Ronen and Yaari (2010)
similar to DePree and Grant (1999) or Kaplan (2001a, b).
In this respect, earnings manipulation fits in with the
general conception that such activities involve manipula-
tion, lack of ethicality, lack of truthfulness, and misrepre-
sentation (Shafer 2002; Demski 2003).
Based on the results documented by Francis et al.
(2003), reported earnings numbers are more closely asso-
ciated with prices when compared to cash flow or sales.
Therefore, when investors want to forecast future cash flow
or assess their risk, their focus is on reported earnings.
Being an important performance measure, earnings are
often found to be the object of manipulation (Healy and
Wahlen 1999; Miller and Bahnson 2002), given the fact
that: (a) Sometimes the accounting policies enable a
company to have a choice from a menu of accepted
treatments (Schipper 1989; Apellaniz and Labrador 1995;
Bowen et al. 2002). The manipulation of earnings occurs
when managers exercise opportunistic discretion over
earnings with the goal of achieving self-centered objectives
(Scott 2003), or reaching a ‘‘desired number instead of
pursuing some sort of protocol to produce a number that
gets reported regardless of what some analysts predict’’
(Miller and Bahnson 2002, p. 184); (b) Certain entries in
the accounts require an unavoidable degree of estimation,
judgment, and prediction (He and Yang 2014), discretion
that could lead to documented earnings manipulation using
items like: depreciation (Bishop and Eccher 2000); asset
write-offs (Riedl and Srinivasan 2006); separation of con-
sistent earnings from transitory ones (Lin et al. 2006) or
restructuring charges (Bens and Johnston 2009); (c) Man-
agers have the flexibility of timing the recognition of rev-
enues and expenses (i.e., timing the sales of assets in order
to manipulate earnings) (Bartov 1993; Gunny 2005);
(d) Managers have the flexibility of structuring transactions
to alter a financial report either to mislead some stake-
holders or to influence contractual outcomes (Healy and
Wahlen 1999); (e) Managers have the possibility of using
investment and production decision to manage earnings, as
documented by previous empirical studies conducted by
Roychowdhury (2006) or Zang (2012).
Ueno (1948) regards truthfulness and accounts manip-
ulation as antithetical. Further, the lack of truthfulness was
regarded as antithetical to truthfulness, referring to terms
like: false, misleading or fraudulent.
Being part of accounts manipulation, earnings manage-
ment practices are regarded by the great majority of
scholars as being unethical (i.e., Johnson et al. 2012; Huang
et al. 2008; Vinciguerra and O’Reilly-Allen 2004; Kaplan
2001a). Their main arguments are based on the fact that
earnings manipulation makes the company value unclear.
Also, earnings management activities are viewed as
eroding the trust between shareholders and managers and
harming the quality of financial reporting. Other scholars
regarded accounts manipulation as being intolerable (i.e.,
Loomis 1999; Grant et al. 2000), immoral (Solomon 1993)
or against the principle of justice (Rawls 1972).
On the other hand, there are scholars who find certain
earnings management practices as being acceptable (Arya
et al. 2003; Parfet 2000) and others who documented a
higher acceptance of such practices (Merchant and Rock-
ness 1994; Bruns and Merchant 1990). For instance, Arya
et al. (2003) argued that ‘‘earnings management and
managerial discretion are intricately linked to serve mul-
tiple functions; accounting reform that ignores these
interconnections could do more harm than good’’ (p. 111,
emphasis added). Parfet (2000) distinguishes between good
and bad earnings management practices. In this respect,
when managers generate stable financial performance
though earnings management activities, such practices are
considered as ‘‘good earnings management.’’ On the other
hand, ‘‘bad earnings management’’ practices can be found
when managers generate misleading accounting entries or
extend estimates beyond realistic limits.
Merchant and Rockness (1994) documented that earn-
ings management practices implemented for self-interested
A. B. Vladu et al.
123
Author's personal copy
purposes are perceived as being less ethical compared to
earnings management practices for the benefit of the
company. Bruns and Merchant (1990) documented empir-
ical results that they assessed as ‘‘frightening’’ based on the
high rate of acceptability of such practices in the business
context.
Prior empirical research documented that ethical issues
can limit business practices characterized by a lack of
truthfulness (i.e., Chung et al. 2005; Greenfield et al. 2008;
Kaplan 2001b). Empirical studies like those conducted by
Elias (2002), Choi and Jinhan (2011) or Shafer (2013)
characterized the relationship between ethics and earnings
manipulations as an inverse relationship. For instance,
Elias (2002) found a negative relationship between focus
on short-term gains and the ethical perception of earnings
manipulation. Choi and Jinhan (2011) documented that
commitment to business ethics has perpetuating effects on
future financial reporting quality. Shafer (2013) docu-
mented that perceptions of the organization ethical climate
were significantly associated with the beliefs over the
importance of corporate ethics responsibility, which was
also associated with ethical judgments and behavioral
intentions of accountants regarding accounting and earn-
ings manipulation.
Summarizing the above, the opinions on the accept-
ability of earnings manipulation vary, but even so, are very
often perceived as reprehensible.
Merchant and Rockness (1994) concluded that earnings
management practices raised the most important ethical
issues facing the business profession.
Earnings Management and the Spanish EconomicEnvironment
According to Leuz et al. (2003) earnings management is a
pervasive corporate phenomenon, less prominent in coun-
tries with developed equity markets, dispersed ownership
structures, strong investor rights, and legal enforcement.
The empirical study conducted by Leuz et al. (2003)
grouped countries under analysis in three clusters. Among
those, Spain was part of the insider economies with weak
legal enforcement cluster. The results documented sig-
nificant differences in the magnitude of earnings man-
agement practices across analyzed clusters. The cluster
that comprised the analysis of Spain exhibited signifi-
cantly higher earnings management compared to the other
two clusters.
Other studies documented that certain practices of
earnings management (e.g., income smoothing or payout-
driven income decreasing) are typical for code-law coun-
tries with less-developed stock markets and lower disclo-
sure levels such as Spain (Azofra et al. 2003).
Nobes (1998) previously approached the factors influ-
encing the differencing in financial reporting and argued
for both the strength of equity markets and the degree of
cultural dominance as being among the most important
ones.
La Porta et al. (1998) included Spain in the ‘‘French
family’’ within the code-law tradition and argued for
comparison with two other code-law ‘‘families’’ (e.g.,
Scandinavian and German), the ‘‘French family’’ countries
giving shareholders and creditors the weakest protection.
Confirming this trend, Hope (2003) placed Spain in the last
position among 22 countries regarding legal enforcement
and disclosure level.
Based on the view of Callao et al. (2007), Spain is a
country where the legal system is based on Roman law
with accounting rules enshrined in legislation.
Being part of the Continental European accounting
system, the Spanish accounting rules have taken the form
of companies’ legislation, the General Chart of Accounts
with its implementing regulations and also other Securities
Market and Bank of Spain legislation.
When assessing the differences between Spain and other
developed countries (e.g., USA); the institutional discrep-
ancies are among the most important ones. For instance,
while in USA, the stock market is highly developed, Spain
comprises far fewer developed stock markets, with far
fewer firms listed on the interconnected market. Banks are
the major source of business finance in Spain (Ojah and
Manrique 2005) sustaining important incentives for
opportunistic behavior of managers (DeFond and Jiam-
balvo 1994).
Important differences can be found both in legal and
judicial enforcements (La Porta et al. 1998), confirming the
central role of enforcement mechanisms over financial-re-
porting practices (Nobes 1998; Burgstahler et al. 2006).
Based on the results documented by Pindado and de la
Torre (2006), Spanish CEOs managing quoted firms face
little control by shareholders. Their evidence suggests that
managers face few restrictions to maintain their informa-
tive advantage over different creditors and shareholders.
Research shows that social norms and specific cultural
practices seem to drive the assessment about ethicality, and
morality of people and their actions (Appiah 2008; Knobe
and Nichols 2008). Building on this evidence, Lara et al.
(2006) discussed potential incentives encouraging conti-
nental European managers to engage in earnings manage-
ment, such as: existing links between reported income and
current payouts to different stakeholders; the pecking order
theory or the less-pronounced market pressure to manage
earnings upward.
All above references support the possibility of high
levels of manipulation in insider economies, with weak
legal enforcement and low levels of disclosure.
Truthfulness in Accounting: How to Discriminate Accounting Manipulators from Non-manipulators
123
Author's personal copy
In terms of incentives for engaging in earnings man-
agement practices, various differences can be found,
between countries with highly developed financial markets
and those with fewer developed stock markets. Among
them, we can summarize the following: the reluctance of
managers to make direct disclosures of private information
to shareholders based on both institutional and legal con-
straints (Schipper 1989); lack of credible channels for
appropriate disclosures (Demski and Sappington 1987);
communicating proper knowledge regarding firms’ supe-
rior earnings prospects to investors (Alissa et al. 2013);
differentiating from inferior prospects in the capital mar-
kets (Chaney and Lewis 1995); obtaining a higher valua-
tion for the shares (Barth et al. 1999; Baker et al. 2009);
obtaining a lower cost of capital (Francis et al. 2004);
meeting earnings thresholds (Daniel et al. 2008); man-
agement–compensation plans (Healy 1985; Holthausen
et al. 1995), debt contracts (DeFond and Jiambalvo 1994);
avoiding decreases and losses (Burgstahler and Eames
2003).
Research Design
Despite being the most used models to detect earnings
management, much attention has been paid to both relative
and absolute accuracies of accrual models (Dechow et al.
1995; Guay et al. 1996; Thomas and Zhang 2002; Dechow
et al. 2010; DeFond 2010). Mainly their ability to identify
Type I and II errors was and still is under scrutiny (Dechow
et al. 2012). Another important limit consists of the fact
that almost all techniques used so far are based on the
assumption that unexplained or abnormal accruals repre-
sent explicit earnings management. One can also argue that
those abnormal accruals can be poor quality earnings.
Our paper is an empirical exercise developed with the
goal to set the tools to discriminate manipulator from non-
manipulator firms for the case of the Spanish market.
Taking into account the advantages of ratio analysis, our
model comprises a simple and cost-effective way to dis-
criminate manipulators from non-manipulators, using only
two years of data. Previous research documented ratio
analysis as being useful in detecting earnings management
practices (Beneish 1999; Jansen et al. 2012).
On the other hand, ratio analysis can also be susceptible
to faulty interpretation and is potentially confusing (Alt-
man 1968). The challenge regarding ratio analysis is to
combine several measures into a meaningful predictive
model. The most important questions are which ratios
should be used and what weights should be attached to
those ratios to discriminate manipulative from non-
manipulative behavior. In order to fill this gap, we con-
ducted this empirical study. In this respect, two relevant
research questions arise:
(1) Which accounting ratios can be used as influential
ones to distinguish between manipulator versus non-
manipulator companies?
(2) What should their relative importance be?
After careful consideration of the nature of the problem
and the purpose of the paper, two different statistical
methodologies were used: (i) Linear Discriminant Analysis
(hereafter LDA), and (ii) Probit model. Both of these sta-
tistical methodologies are grounded in a multivariate
approach as encouraged by Altman (1968), implying a
natural extension for a univariate analysis.
While the Probit model deserves no additional expla-
nations, LDA was preferred based on three arguments.
First, this technique considers an entire profile of charac-
teristics common to the relevant firms and the interaction of
these properties. Second, since this study is concerned with
only two groups, LDA is useful in terms of reduction of the
space dimensionality. Finally, LDA is useful in terms of
classification problems when analyzing the entire variable
profile of the object simultaneously rather than sequentially
by examining its individual characteristics. Since financial
ratios, by their nature, have the effect of deflating statistics
by size, the size effect is eliminated.
Prior research indicates that certain variables are sig-
nificant indicators when assessing manipulative behavior
(Schilit 2010; Mulford and Comiskey 2002; Beneish 1999).
As a result, a list of 12 explanatory variables (ratios) was
compiled for evaluation. The variables were selected based
on the results documented in the literature and potential
relevance to our study.
In order to obtain the final profile of variables, we used
similar procedures to those in Altman (1968), consisting of
(a) Observation of the statistical significance of various
alternative functions comprising the determination of the
relative contributions of each independent variable;
(b) Evaluation of intercorrelations between the relevant
variables; (c) Observation of the predictive accuracy of the
various profiles; and (d) Judgment of the analyst.
Statistical Methodology
Since LDA and Probit Models are the appropriate tech-
niques to classify observations between groups, the next
subsections give a brief description of their salient features.
In addition, Multivariate Analysis of Variance (hereunder
MANOVA) was used in order to detect those independent
variables with the highest discriminant power.
A. B. Vladu et al.
123
Author's personal copy
Multivariate ANOVA (MANOVA)
Assume a sample coming out from two possible different
groups (manipulators and non-manipulators), where each
observation has different variables (accounting ratios).
The question is to what extent the two groups are dif-
ferent regarding these variables. This technique is partic-
ularly useful in identifying the group of variables
(accounting ratios) that exhibit a different performance
between manipulators and non-manipulators. Variables not
presenting different profiles between groups are of little use
to discriminate observations.
Linear Discriminant Analysis (LDA): Two-Group
Case
LDA technique attempts to derive a linear combination of
variables (accounting ratios) that maximizes the separation
between two groups. The discriminant power consists in
identifying the vector that best separates individual obser-
vations coming from manipulator versus non-manipulator
groups. When assessing the discriminant accuracy of the
model, two alternatives were proposed, consisting of the
classification matrix.
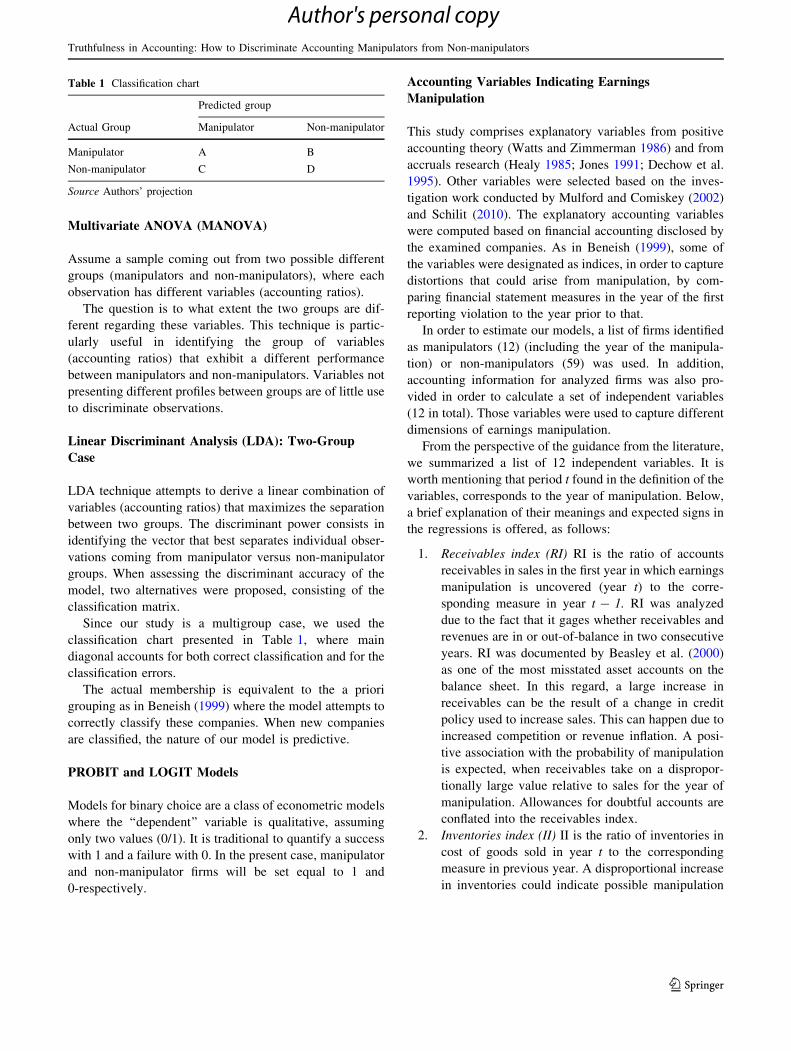
Since our study is a multigroup case, we used the
classification chart presented in Table 1, where main
diagonal accounts for both correct classification and for the
classification errors.
The actual membership is equivalent to the a priori
grouping as in Beneish (1999) where the model attempts to
correctly classify these companies. When new companies
are classified, the nature of our model is predictive.
PROBIT and LOGIT Models
Models for binary choice are a class of econometric models
where the ‘‘dependent’’ variable is qualitative, assuming
only two values (0/1). It is traditional to quantify a success
with 1 and a failure with 0. In the present case, manipulator
and non-manipulator firms will be set equal to 1 and
0-respectively.
Accounting Variables Indicating Earnings
Manipulation
This study comprises explanatory variables from positive
accounting theory (Watts and Zimmerman 1986) and from
accruals research (Healy 1985; Jones 1991; Dechow et al.
1995). Other variables were selected based on the inves-
tigation work conducted by Mulford and Comiskey (2002)
and Schilit (2010). The explanatory accounting variables
were computed based on financial accounting disclosed by
the examined companies. As in Beneish (1999), some of
the variables were designated as indices, in order to capture
distortions that could arise from manipulation, by com-
paring financial statement measures in the year of the first
reporting violation to the year prior to that.
In order to estimate our models, a list of firms identified
as manipulators (12) (including the year of the manipula-
tion) or non-manipulators (59) was used. In addition,
accounting information for analyzed firms was also pro-
vided in order to calculate a set of independent variables
(12 in total). Those variables were used to capture different
dimensions of earnings manipulation.
From the perspective of the guidance from the literature,
we summarized a list of 12 independent variables. It is
worth mentioning that period t found in the definition of the
variables, corresponds to the year of manipulation. Below,
a brief explanation of their meanings and expected signs in
the regressions is offered, as follows:
1. Receivables index (RI) RI is the ratio of accounts
receivables in sales in the first year in which earnings
manipulation is uncovered (year t) to the corre-
sponding measure in year t - 1. RI was analyzed
due to the fact that it gages whether receivables and
revenues are in or out-of-balance in two consecutive
years. RI was documented by Beasley et al. (2000)
as one of the most misstated asset accounts on the
balance sheet. In this regard, a large increase in
receivables can be the result of a change in credit
policy used to increase sales. This can happen due to
increased competition or revenue inflation. A posi-
tive association with the probability of manipulation
is expected, when receivables take on a dispropor-
tionally large value relative to sales for the year of
manipulation. Allowances for doubtful accounts are
conflated into the receivables index.
2. Inventories index (II) II is the ratio of inventories in
cost of goods sold in year t to the corresponding
measure in previous year. A disproportional increase
in inventories could indicate possible manipulation
Table 1 Classification chart
Predicted group
Actual Group Manipulator Non-manipulator
Manipulator A B
Non-manipulator C D
Source Authors’ projection
Truthfulness in Accounting: How to Discriminate Accounting Manipulators from Non-manipulators
123
Author's personal copy
by misleadingly changing its value. A positive
association is expected.
3. Gross margin index (GMI) GMI is the ratio of gross
margin in year t - 1 to gross margin in year t. A
value higher than 1 indicates that gross margins have
deteriorated. This could be interpreted as a negative
sign for firm’s prospects (Lev and Thiagarajan
1993). Since companies with poor prospects are
more likely to engage in earnings manipulation, a
positive sign is expected (Kellogg and Kellogg
1991). Deterioration in Gross Margins increases the
possibility of engaging in earnings manipulation.
4. Sales growth (SG) SG is the ratio of sales in year t to
sales in previous year (t - 1). Growth per se does
not have to be regarded as a manipulative even.
Nevertheless, according to professional bodies like
the National Association of Certified Fraud Exam-
iners (1993), growth companies must be treated with
caution. Given the need to achieve earnings targets
which are higher compared to other types of
companies, growth companies are more susceptible
to commit fraud. Moreover, since losing stock prices
or decelerating growth can be costly (Loebbecke
et al. 1989; Fridson 1993), growth companies face
important incentives to manipulate earnings. A
positive relationship is expected based on the fact
that a reduction in sales would encourage manage-
ment to engage in manipulation.
5. Depreciation index (DI) DI is the ratio of depreci-
ation in year t - 1 to the corresponding measure in
year t. A significant change in depreciation is
associated with a change in the estimates of assets
lives. Those firms reducing the rate of depreciation
are susceptible of manipulation by aggressively
increasing the useful lives of company’s assets. A
positive relationship is expected between DI and the
probability of manipulation. This variable did not
enhance either the specification of our model or alter
the magnitude of the significance of the coefficients
of the other explanatory variables used.
6. Discretionary expenses index (DEI) DEI is the ratio
of discretionary expenses in year t to discretionary
expenses in t - 1. Reducing discretionary expenses
in the year of manipulation is done with the scope of
improving the firm’s prospects aggressively (Lev
and Thiagarajan 1993). Such demarche used for
manipulative purposes has no connection to the
economic reality. A positive association is expected
between DEI and the probability of manipulation.
7. Leverage index 1 (LI1) LI1 is the ratio of current
debt to total assets in year t relative to the
corresponding measure in the previous year. When
the value of LI 1 is higher than 1, an increase in the
leverage index is obtained. High leverage could
encourage earnings manipulation through its effect
on debt covenants with the firm’s (current and
future) counterparties (Beneish and Press 1993). A
positive sign in the regression is expected between
LI1 and the probability of manipulation.
8. Leverage index 2 (LI2) Idem to LI1 but standardized
by Sales. A positive association is expected, between
LI2 and the probability of manipulation.
9. Asset quality (AQ) AQ is the ratio of asset quality in
year t relative to asset quality in the previous year.
AQ measures the proportion of total assets for which
future benefits are potentially less certain (e.g., assets
realization risk analysis suggested by Siegel 1991).
A value of AQ higher than 1 indicates that the firm
has potentially increased its involvement in cost
deferral (Beneish 1999). Since that part of the
increase is possible to be attributable to acquisitions
involving Goodwill, the manipulators sample was
assessed in terms of acquisitions. Since this is not the
case for our manipulators sample, we predict a
positive relationship between AQ and earnings
manipulation.
10. CFO index 1 (CFO1) A fall in CFO relative to Net
Income indicates an increase in the proportion of
accrual relative to Net Income. This provides more
room to manipulate. Therefore, a positive associa-
tion is expected, between CFO1 and earnings
manipulation.
11. CFO index 2 (CFO2) Idem to CFO1 but standard-
ized by Total Assets. Similar to CFO1 a positive
sign is expected between CFO2 and earnings manip-
ulation.
12. Sales index (SI) SI is the ratio of sales in year t to
CFO in year t, relative to the same measure in
previous year (t - 1). A disproportionate increase in
sales not mapped into CFO could indicate an
intended and aggressive inflation with the purpose
of misleading in respect of the underlying economic
performance (Mulford and Comiskey 2002). There-
fore, a positive sign of this variable is predicted, in
the case in which a manipulation case is indicated.
Dataset Construction
In this study, companies that make use of earnings man-
agement practices are regarded as manipulators. On the
other hand, companies that do follow the ‘‘good practices’’
are regarded as non-manipulators. The central idea behind
it is simple: if companies engage in earnings management
activities, their attitude toward ethicality, and truthfulness
is not severe, and vice versa.
A. B. Vladu et al.
123
Author's personal copy
The final dataset consists of 12 manipulators and 59
non-manipulators matched by industry, and year of
manipulation (71 data points). The financial industry was
discarded because of its specific characteristics which are
endowed with the industry‘s own accounting and financial
rules.
The sample of manipulators consists of firms that have
been targeted by the Spanish Stock Exchange supervisor
for allegedly overstating annual earnings. The external
validity of the results rests on the assumption that this
supervisor has correctly identified firms that managed their
earnings. Our assumption seems reasonable since this
supervisor pursues only cases involving significant inci-
dences of earnings management practices.
All companies examined in our study are listed on the
Spanish Stock Exchange, tier 1, and for period 2005–2012.
As asserted above, these data were obtained from CNMV,
the Spanish stock exchange supervisor. There is one firm
identified as belonging to the first group that is outside the
sample because it does not present information for the year
previous to the event. In addition, there are two firms not
considered in the control group in particular years based on
the lack of financial information.
It is worth mentioning that since information regarding
the CFO starts from 2007, nine observations of the dataset
were discarded when variables including CFO in their
calculation were considered. In this case, the dataset has 62
data points (10 manipulators and 52 non manipulators).
Finally, since several of the independent variables are
indices with a small denominator, we winsorized the
dataset at 5 and 95 % percentiles for each variable.
In addition, some of the balance sheet items assume zero
value in different years affecting the calculation of the
independent variables when they appear in the denomina-
tor. In this case, we put 1 as is suggested by Beneish
(1999).
Analysis of Data
MANOVA and LDA
Among all possible combinations of variables (there are
512 possible models); MANOVA was used to select those
arrangements showing the greatest discriminatory power.1
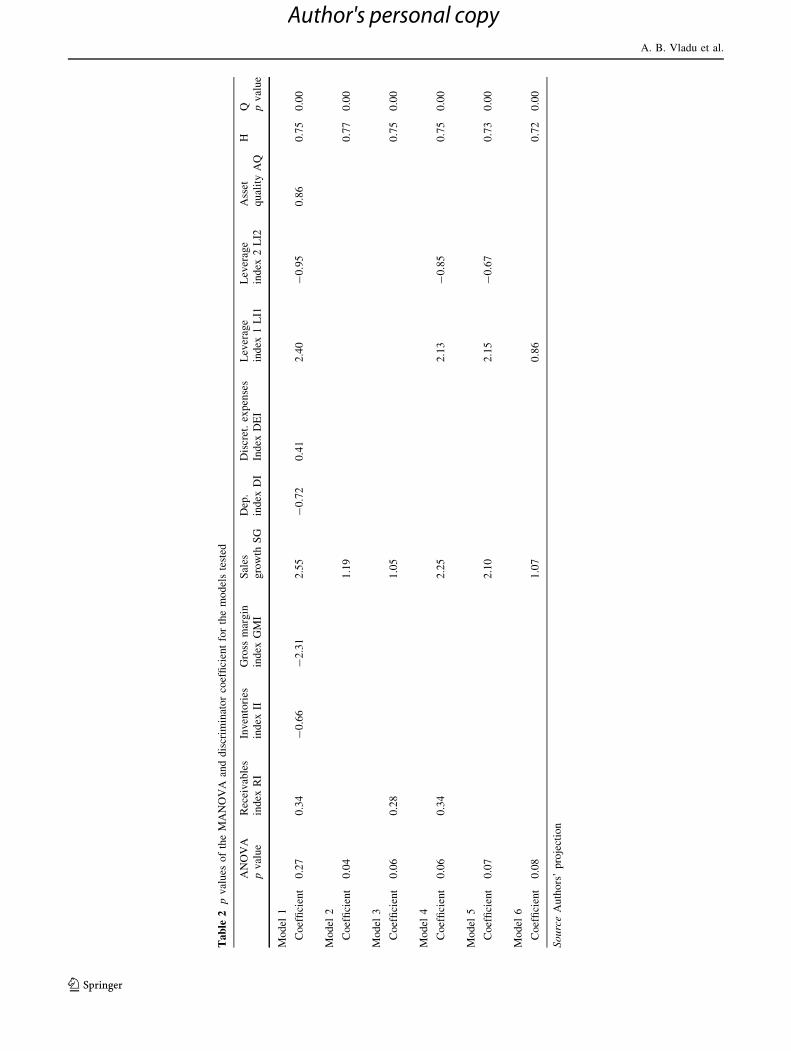
Table 2 reports the p values of the MANOVA and the
discriminator coefficient for the complete model (a model
including all the accounting variables) and for five models
showing the smallest p value from the MANOVA test.
Based on the values presented in Table 2, some
important conclusions can be drawn. Starting with our
complete model (including RI, II, GMI, SG, DI, DEI, LI1,
LI2, and AQ) we can assert that the p value of the
MANOVA test (e.g., 0.27) is not significant. In this respect,
we can conclude that not every accounting ratio can act as
a discriminator used to identify companies that do manip-
ulate their earnings.
When analyzing the secondmodel (presented in Table 2),
the p value of the MANOVA test (e.g., 0.04) shows that this
model is significant in predicting a differential profile
betweenmanipulators and non-manipulators. In this respect,
the SG ratio can be used to discriminate between manipu-
lators and non- manipulators. The third model is also found
to be significant (p value of the MANOVA test: 0.06).
Therefore, RI and SG ratios are found to be significant in
discriminating manipulators from non-manipulators. Mod-
els 5 and 6 introduce as a significant discriminator the LI1
(p value of the MANOVA test in Model 5: 0.06 and p value
of the MANOVA test in Model 6: 0.07).
According to the results presented in Table 2, it seems
that the critical explanatory variables identifying a
manipulator are: (1) Receivables index; (2) Sales Growth
and (3) Leverage index 1 (LI1, e.g., current debt/total
assets). All those explanatory variables show the expected
sign (e.g., positively associated).
LI2 (e.g., leverage index 2: current debt to sales)
deserves a special comment since it seems to act as a
discriminator variable according to the results presented in
Table 2, but its sign is opposite to the expected one (neg-
atively associated).
The Hit ratio (H) takes on values between 72 and 77 %,
showing that the models are performing well in matching
the actual group of companies with the one expected from
the Z-scores. The lowest value obtained for the Hit ratio
was for Model 6 (including accounting ratios like SG and
LI1), while the highest value is obtained for Model 2 (in-
cluding SG as the accounting ratio). Finally, the Q test
shows strong evidence in favor of our models. The
assignment of a firm to a particular group is by no means
made randomly.
Table 3 presents the major statistic regarding Z-scores
for our six models including the region of ignorance
(Altman 1968). In this respect, our models correctly clas-
sify a non-manipulator firm when its Z-score is lower than
the minimum of the ‘‘region of ignorance’’ and correctly
classify it as a manipulator when its Z-score is above the
maximum of the same region. When Z-scores belong to the
region of ignorance, the discriminant power of the models
is undermined. The ‘‘region of ignorance’’ is that range of
Z-scores where misclassifications are observed. Hence, it is
desirable to establish a guideline for classifying firms in the
‘‘region of ignorance.’’
1 Since there are 9 independent variables, the total number of
possible models is 512.
Truthfulness in Accounting: How to Discriminate Accounting Manipulators from Non-manipulators
123
Author's personal copy
Table
2pvalues
oftheMANOVA
anddiscrim
inatorcoefficientforthemodelstested
ANOVA
pvalue
Receivables
index
RI
Inventories
index
II
Gross
margin
index
GMI
Sales
growth
SG
Dep.
index
DI
Discret.expenses
Index
DEI
Leverage
index
1LI1
Leverage
index
2LI2
Asset
qualityAQ
HQ pvalue
Model
1
Coefficient
0.27
0.34
-0.66
-2.31
2.55
-0.72
0.41
2.40
-0.95
0.86
0.75
0.00
Model
2
Coefficient
0.04
1.19
0.77
0.00
Model
3
Coefficient
0.06
0.28
1.05
0.75
0.00
Model
4
Coefficient
0.06
0.34
2.25
2.13
-0.85
0.75
0.00
Model
5
Coefficient
0.07
2.10
2.15
-0.67
0.73
0.00
Model
6
Coefficient
0.08
1.07
0.86
0.72
0.00
So
urc
eAuthors’projection
A. B. Vladu et al.
123
Author's personal copy
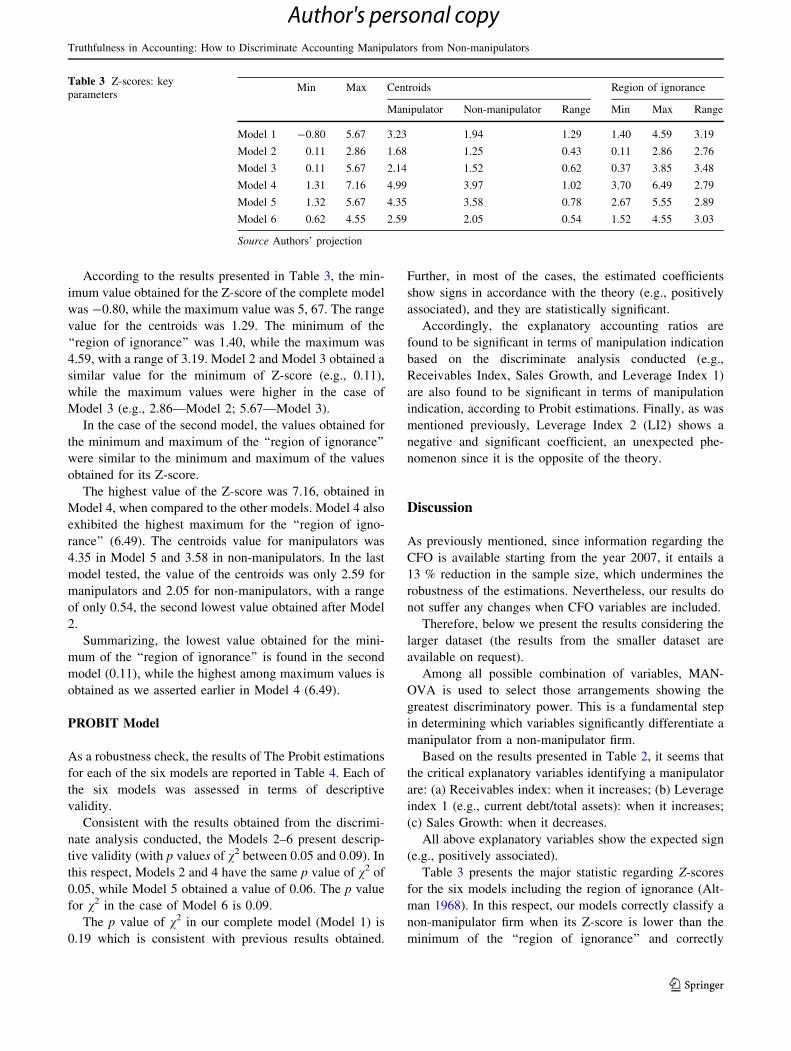
According to the results presented in Table 3, the min-
imum value obtained for the Z-score of the complete model
was -0.80, while the maximum value was 5, 67. The range
value for the centroids was 1.29. The minimum of the
‘‘region of ignorance’’ was 1.40, while the maximum was
4.59, with a range of 3.19. Model 2 and Model 3 obtained a
similar value for the minimum of Z-score (e.g., 0.11),
while the maximum values were higher in the case of
Model 3 (e.g., 2.86—Model 2; 5.67—Model 3).
In the case of the second model, the values obtained for
the minimum and maximum of the ‘‘region of ignorance’’
were similar to the minimum and maximum of the values
obtained for its Z-score.
The highest value of the Z-score was 7.16, obtained in
Model 4, when compared to the other models. Model 4 also
exhibited the highest maximum for the ‘‘region of igno-
rance’’ (6.49). The centroids value for manipulators was
4.35 in Model 5 and 3.58 in non-manipulators. In the last
model tested, the value of the centroids was only 2.59 for
manipulators and 2.05 for non-manipulators, with a range
of only 0.54, the second lowest value obtained after Model
2.
Summarizing, the lowest value obtained for the mini-
mum of the ‘‘region of ignorance’’ is found in the second
model (0.11), while the highest among maximum values is
obtained as we asserted earlier in Model 4 (6.49).
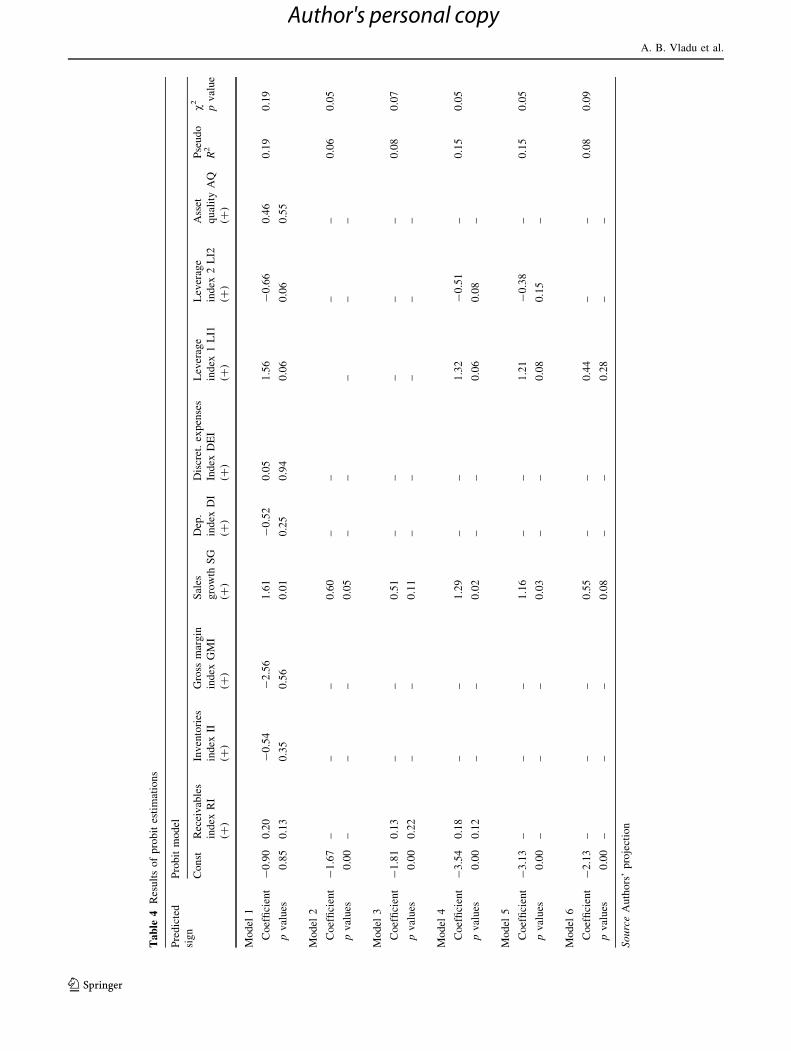
PROBIT Model
As a robustness check, the results of The Probit estimations
for each of the six models are reported in Table 4. Each of
the six models was assessed in terms of descriptive
validity.
Consistent with the results obtained from the discrimi-
nate analysis conducted, the Models 2–6 present descrip-
tive validity (with p values of v2 between 0.05 and 0.09). Inthis respect, Models 2 and 4 have the same p value of v2 of0.05, while Model 5 obtained a value of 0.06. The p value
for v2 in the case of Model 6 is 0.09.
The p value of v2 in our complete model (Model 1) is
0.19 which is consistent with previous results obtained.
Further, in most of the cases, the estimated coefficients
show signs in accordance with the theory (e.g., positively
associated), and they are statistically significant.
Accordingly, the explanatory accounting ratios are
found to be significant in terms of manipulation indication
based on the discriminate analysis conducted (e.g.,
Receivables Index, Sales Growth, and Leverage Index 1)
are also found to be significant in terms of manipulation
indication, according to Probit estimations. Finally, as was
mentioned previously, Leverage Index 2 (LI2) shows a
negative and significant coefficient, an unexpected phe-
nomenon since it is the opposite of the theory.
Discussion
As previously mentioned, since information regarding the
CFO is available starting from the year 2007, it entails a
13 % reduction in the sample size, which undermines the
robustness of the estimations. Nevertheless, our results do
not suffer any changes when CFO variables are included.
Therefore, below we present the results considering the
larger dataset (the results from the smaller dataset are
available on request).
Among all possible combination of variables, MAN-
OVA is used to select those arrangements showing the
greatest discriminatory power. This is a fundamental step
in determining which variables significantly differentiate a
manipulator from a non-manipulator firm.
Based on the results presented in Table 2, it seems that
the critical explanatory variables identifying a manipulator
are: (a) Receivables index: when it increases; (b) Leverage
index 1 (e.g., current debt/total assets): when it increases;
(c) Sales Growth: when it decreases.
All above explanatory variables show the expected sign
(e.g., positively associated).
Table 3 presents the major statistic regarding Z-scores
for the six models including the region of ignorance (Alt-
man 1968). In this respect, our models correctly classify a
non-manipulator firm when its Z-score is lower than the
minimum of the ‘‘region of ignorance’’ and correctly
Table 3 Z-scores: key
parametersMin Max Centroids Region of ignorance
Manipulator Non-manipulator Range Min Max Range
Model 1 -0.80 5.67 3.23 1.94 1.29 1.40 4.59 3.19
Model 2 0.11 2.86 1.68 1.25 0.43 0.11 2.86 2.76
Model 3 0.11 5.67 2.14 1.52 0.62 0.37 3.85 3.48
Model 4 1.31 7.16 4.99 3.97 1.02 3.70 6.49 2.79
Model 5 1.32 5.67 4.35 3.58 0.78 2.67 5.55 2.89
Model 6 0.62 4.55 2.59 2.05 0.54 1.52 4.55 3.03
Source Authors’ projection
Truthfulness in Accounting: How to Discriminate Accounting Manipulators from Non-manipulators
123
Author's personal copy
Table
4Resultsofprobitestimations
Predicted
sign
Probitmodel
Const
Receivables
index
RI
Inventories
index
II
Gross
margin
index
GMI
Sales
growth
SG
Dep.
index
DI
Discret.expenses
Index
DEI
Leverage
index
1LI1
Leverage
index
2LI2
Asset
qualityAQ
Pseudo
R2
v2
pvalue
(?)
(?)
(?)
(?)
(?)
(?)
(?)
(?)
(?)
Model
1
Coefficient
-0.90
0.20
-0.54
-2.56
1.61
-0.52
0.05
1.56
-0.66
0.46
0.19
0.19
pvalues
0.85
0.13
0.35
0.56
0.01
0.25
0.94
0.06
0.06
0.55
Model
2
Coefficient
-1.67
––
–0.60
––
––
0.06
0.05
pvalues
0.00
––
–0.05
––
––
–
Model
3
Coefficient
-1.81
0.13
––
0.51
––
––
–0.08
0.07
pvalues
0.00
0.22
––
0.11
––
––
–
Model
4
Coefficient
-3.54
0.18
––
1.29
––
1.32
-0.51
–0.15
0.05
pvalues
0.00
0.12
––
0.02
––
0.06
0.08
–
Model
5
Coefficient
-3.13
––
–1.16
––
1.21
-0.38
–0.15
0.05
pvalues
0.00
––
–0.03
––
0.08
0.15
–
Model
6
Coefficient
-2.13
––
–0.55
––
0.44
––
0.08
0.09
pvalues
0.00
––
–0.08
––
0.28
––
So
urc
eAuthors’projection
A. B. Vladu et al.
123
Author's personal copy
classify as manipulator when its Z-score is above the
maximum of the same region.
Accordingly, the explanatory accounting ratios found to
be significant in terms of manipulation indication based on
the discriminate analysis conducted (e.g., Receivables
Index, Sales Growth, Leverage Index 1) are shown to be
fundamental ratios in indicating manipulation also
according to Probit estimations (Table 4).
Conclusion
In this paper, we investigate how earnings manipulators
can be detected using financial statement ratios. The
empirical evidence in our paper is based on a sample of
companies manipulation of earnings of which was dis-
covered and a sample of companies known for following
the ‘‘good practices’’ in accounting for the period
2005–2012.
We extend prior research of ratio analysis used in the
context of earnings manipulation by combining it with
rigorous statistical technique, useful to distinguish manip-
ulator from non-manipulator companies.
Our results document significant predictive content of
the explanatory variables (e.g., accounting ratios) that take
into account the simultaneous bloating in asset accounts. In
this regard, our results document that receivables and
leverage have significant discriminatory power. Our find-
ings highlight that a prime characteristic of manipulators
was the higher growth in the value of explanatory variables
prior to periods during which manipulation is in force. The
context of earnings manipulation was the annual report.
Our evidence documents that the probability of manip-
ulation increases with the following: (1) unusual increase
in receivables; (2) increasing leverage; and (3) decrease in
sales. In addition, we have obtained several Z-scores that
can be used to assess the probability of a company
manipulating its accounts.
Given the results documented, we believe the systematic
association between earnings manipulation and financial
statement data to be of interest to both accounting scholars
and professionals. We regard our paper sheds light on a yet
under-explored facet driving accounting in the academic
debates on business ethics.
Regarded from an ethical perspective as morally repre-
hensible, earnings manipulation is not fair to users, and it
involves an unjust exercise of power. In this regard, such
practices used by manipulators tend to weaken the
authority of the regulators and supervisors. Our results
have specific implications for those whose main function in
an organization is to use financial data in the process of
decision making. The practical relevance of our findings is
important when building reliable models used to examine
companies that are conducive to decreasing earnings and
not only companies that overstate earnings. Such a
demarche may ultimately lead to analysis techniques that
better permit investors to evaluate firm performance.
The extent to which manipulators succeed in misleading
the users of financial information depends on the ability of
the latter to detect and unravel earnings manipulation.
In the light of previous documented financial scandals,
there is a stringent need for moral behavior and people of
moral integrity, willing to act in accordance with accepted
moral standards. As such, individual practitioners, profes-
sional associations, and accounting regulators should all
take steps to identify, and deter earnings management
practices, by developing specific tools to assess its exis-
tence and magnitude.
Our study has several important limitations. First, we
recognized the explored distortions as a result of manipu-
lation. On the other hand, in the period under analysis,
there were no significant changes in the firm’s economic
environment. Second, potential sampling errors can be
found, given the fact that part of the sample was con-
structed manually. Third, inherent bias in the process of
reducing the original set of variables to the best variable
profile is susceptible to be found (Altman 1968). Finally,
the sample size and the fact that the prediction models were
not tested out of sample to assess their accuracy can
comprise important limitations.
Our model regarded only Spanish listed firms, but fur-
ther research can extend this rather limited scope.
Future research can approach the association between
the failure of reason-based morality, and earnings manip-
ulation. In addition, a Kantian approach (Kant 1994)
regarding the organization can act as an adequate debate.
Committed to achieving common goals and moral com-
munities, a Kantian approach to the business environment
will regard the organization as other than merely a means
of achieving individual goals. Also, it will be interesting
for future research to assess the self-deception that man-
agers sometimes undertake to justify morally questionable
actions for the greater good of the company when the cost
of telling the truth is too high.
Given the economic and social consequences of their
actions, companies usually depend on the moral integrity of
their managers. In this respect, core values like truthfulness
or honesty in letter and spirit should be respected per se
and not only to avoid penal action.
References
Akerlof, G. A., & Shiller, R. J. (2009). Animal spirits. Princeton:
Princeton University Press.
Truthfulness in Accounting: How to Discriminate Accounting Manipulators from Non-manipulators
123
Author's personal copy
Alissa, W., Bonsall, S. B, I. V., Koharki, K., & Penn, M. W, Jr.
(2013). Firms’ use of accounting discretion to influence their
credit ratings. Journal of Accounting and Economics, 55,
129–147.
Altman, E. I. (1968). Financial ratios, discriminant analysis and the
prediction of corporate bankruptcy. The Journal of Finance,
23(4), 589–609.
Apellaniz, P., & Labrador, M. (1995). El impacto de la regulacion
contable en la manipulacion del beneficio. Estudio empırico de
los efectos del PGC de 1990. Revista Espanola de Financiacion
y Contabilidad, 24(82), 13–40.
Appiah, K. A. (2008). Experiments in Ethics. Cambridge, MA:
Harvard University Press.
Arya, A., Glover, J., & Sunder, S. (2003). Are unmanaged earnings
always better for shareholders? The Accounting Horizon,
17(Suppl), 111–116.
Azofra, V., Castrillo, L., & Delgado, M. M. (2003). Ownership
concentration, debt financing and the investment opportunity set
as determinants of accounting discretion: Empirical evidence
from Spain. Spanish Journal of Finance and Accounting, 115,
215–255.
Baker, T. A., Collins, D. L., & Reitenga, A. R. (2009). Incentives and
Opportunities to Manage Earnings around Option Grants.
Contemporary Accounting Research, 26(3), 649–672.
Ball, R. (2009). Market and political regulatory perspectives on the
recent accounting scandals. Journal of Accounting Research, 47,
277–323.
Barth, M. E., Elliott, J. A., & Finn, M. W. (1999). Market rewards
associated with patterns of increasing earnings. Journal of
Accounting Research, 37(2), 387–413.
Bartov, E. (1993). The timing of asset sales and earnings manipu-
lation. The Accounting Review, 68(4), 840–855.
Bayou, M., Reinstein, A., & Williams, P. F. (2011). To tell the truth:
A discussion of issues concerning truth and ethics in accounting.
Accounting, Organizations and Society, 36, 109–124.
Beasley, M., Carcello, J., Hermanson, D., & Lapides, P. (2000).
Fraudulent financial reporting. Accounting Horizons, 14(4),
441–455.
Beaudoin, C., Cianci, A. and Tsakumis, G. (2014). The impact of CFOs’
incentives and earnings management ethics on their financial
reporting decisions: The mediating role of moral disengagement.
Journal of Business Ethics, published on-line: March 2014.
Beneish, M. D. (1999). The detection of earnings manipulation.
Financial Analysts Journal, 55, 24–36.
Beneish, M. D., & Press, E. (1993). Costs of technical violation of
accounting-based debt covenants. The Accounting Review, 68(2),
233–257.
Bens, D. A., & Johnston, R. (2009). Accounting discretion: Use or
Abuse? An analysis of restructuring charges surrounding regu-
lator action. Contemporary Accounting Research, 26(3),
673–699.
Bishop, M. L. and Eccher, E. A. (2000). Do markets remember
accounting changes? An examination of subsequent years.
Available at SSRN: http://ssrn.com/abstract=218448 or http://
dx.doi.org/10.2139/ssrn.218448
Bowen, R., Davis, A. K., & Rajgopal, S. (2002). Determinants of
revenue reporting practices for internet firms. Contemporary
Accounting Research, 19(4), 523–562.
Bradshaw, M. T., & Sloan, R. G. (2002). GAAP versus the street: An
empirical assessment of two alternative definitions of earnings.
Journal of Accounting Research, 40(1), 41–66.
Briloff, A. J. (1972). Unaccountable accounting. New York, NY:
Harper & Row Publishers.
Briloff, A. J. (1981). The truth about corporate accounting. New
York, NY: Harper & Row Publishers.
Briloff, A. J. (1990). Accounting and society: A covenant desecrated.
Critical Perspectives on Accounting, 1(1), 5–30.
Briloff, A. J. (2001). Garbage in/garbage out: a critique of fraudulent
financial reporting: 1987–1997 (the COSO Report) and the SEC
accounting regulatory process. Critical Perspectives on Account-
ing, 12(2), 125–148.
Bruns, W. J., & Merchant, K. A. (1990). The dangerous morality of
managing earnings. Management Accounting, 72(2), 22–25.
Bunge, M. (1996). Finding philosophy in social science. New Haven,
CN: Yale University Press.
Burgstahler, D., & Eames, M. (2003). Earnings management to avoid
losses and earnings decreases: Are analysts fooled? Contempo-
rary Accounting Research, 20, 253–276.
Burgstahler, D., Hail, L., & Leuz, C. (2006). The importance of
reporting incentives: earnings management in European private
and public firms. The Accounting Review, 81(5), 983–1016.
Callao, S., Jarne, J. I., & Lainez, J. A. (2007). Adoption of IFRS in
Spain: Effect on the comparability and relevance of financial
reporting. Journal of International Accounting, Auditing and
Taxation, 16, 148–178.
Carpenter, T. D., & Reimers, J. L. (2001). Unethical and fraudulent
financial reporting: Applying the theory of planned behavior.
Journal of Business Ethics, 60(2), 115–129.
Chaney, P. K., & Lewis, C. M. (1995). Earnings management and
firm valuation under asymmetric information. Journal of Cor-
porate Finance, 1(1), 319–345.
Choi, T. H., & Jinhan, P. (2011). Business ethics and financial
reporting quality: Evidence from Korea. Journal of Business
Ethics, 103(3), 403–427.
Christensen, J., & Demski, J. S. (2003). Accounting theory: An
information content perspective. New York: McGraw-Hill Irwin.
Chung, R., Firth, M., & Kim, J. B. (2005). Earnings management,
surplus free cash flow and external monitoring. Journal of
Business Research, 58, 766–776.
Daniel, N. D., Denis, D. J., & Naveen, L. (2008). Do firms manage
earnings to meet dividend thresholds? Journal of Accounting and
Economics, 45, 2–26.
Dechow, P. M., Ge, W., & Schrand, K. M. (2010). Understanding
earnings quality: A review of the proxies, their determinants and
their consequences. Journal of Accounting and Economics, 50,
344–401.
Dechow, P., Hutton, A., Kim, J. H., & Sloan, R. G. (2012). Detecting
earnings management: A new approach. Journal of Accounting
Research, 50(2), 275–334.
Dechow, P. M., & Skinner, D. J. (2000). Earnings management:
Reconciling the views of accounting academics, practitioners,
and regulators. Accounting Horizons, 14, 235–250.
Dechow, P. M., Sloan, R. G., & Sweeny, A. P. (1995). Detecting
earnings management. The Accounting Review, 70, 193–225.
DeFond, M. L. (2010). Earnings quality research: Advances,
challenges and future research. Journal of Accounting and
Economics, 50, 402–409.
DeFond, M. L., & Jiambalvo, J. (1994). Debt covenant violation and
manipulation of accruals. Journal of Accounting and Economics,
17, 145–176.
Demski, J. S. (2003). Corporate conflicts of interest. Journal of
Economic Perspectives, 17(2), 51–72.
Demski, J. S., & Sappington, D. E. M. (1987). Delegated expertise.
Journal of Accounting Research, 25(1), 68–89.
DePree, C. M., & Grant, T. C. (1999). Earnings management and
ethical decision making: Choices in accounting for security
investments. Issues in Accounting Education, 14(4), 613–640.
Doyle, J. T., Lundhom, R. J., & Soliman, M. T. (2003). The predictive
value of expenses excluded from ‘‘pro forma’’ earnings. Review
of Accounting Studies, 8(2–3), 145–174.
A. B. Vladu et al.
123
Author's personal copy
Dye, R. A. (1988). Earnings management in an overlapping
generations model. Journal of Accounting Research, 26,
195–235.
Elias, R. (2002). Determinants of earnings management ethics among
accountants. Journal of Business Ethics, 40(1), 33–45.
Fama, E. (1980). Agency problems and the theory of the firm. Journal
of Political Economy, 88(2), 288–307.
Fama, E., & Jensen, M. (1983). Separation of ownership and control.
Journal of Law and Economics, 26, 301–325.
Feltham, G. A., Raffi, I., & Dhananjay, N. (2006). Dynamic
incentives and dual-purpose accounting. Journal of Accounting
and Economics, 42(3), 417–437.
Francis, J., LaFond, R., Olsson, P., & Schipper, K. (2004). Costs of
equity and earnings attributes. The Accounting Review, 79(4),
967–1010.
Francis, J., Schipper, K., & Vincent, L. (2003). The relative and
incremental explanatory power of alternative (to earnings)
performance measures for returns. Contemporary Accounting
Research, 21(1), 121–164.
Fridson, M. S. (1993). Financial statement analysis: A practitioner’s
guide. New York: John Wiley.
Gong, G., Louis, H., & Sun, A. X. (2008). Earnings management,
lawsuits, and stock-for-stock acquirers’ market performance.
Journal of Accounting and Economics, 46, 62–77.
Grant, C., Depree, M., & Grant, G. (2000). Earnings management and
the abuse of materiality. Journal of Accountancy, 190, 41–44.
Greenfield, A. C., Norman, C. S., & Wier, B. (2008). The effect of
ethical orientation and professional commitment on earnings
management behavior. Journal of Business Ethics, 83, 419–434.
Guay, W. R., Kothari, S. P., & Watts, R. (1996). A market-based
evaluation of discretionary accrual models. Journal of Account-
ing Research, 34(Supplement 3), 83–105.
Gunny, K. (2005). What are the consequences of real earnings
management? Available at SSRN.com/abstract = 816025.
He, L., & Yang, R. (2014). Does industry regulation matter? new
evidence on audit committees and earnings management.
Journal of Business Ethics, 123, 573–589.
Healy, P. M. (1985). The effect of bonus schemes on accounting
decisions. Journal of Accounting and Economics, 7, 85–107.
Healy, P. M., & Wahlen, M. (1999). A review of the earnings
management literature and its implications for standard setting.
Accounting Horizons, 13(4), 365–383.
Holthausen, R., Larker, D., & Sloan, R. (1995). Annual bonus
schemes and the manipulation of earnings. Journal of Account-
ing and Economics, 19, 29–74.
Hope, O.-K. (2003). Disclosures practices, enforcement and account-
ing standards and analysts’ forecast accuracy: An international
study. Journal of Accounting Research, 41(2), 235–272.
Hsiang-Lin, C., Chung-Hua, S., & Feng-Ching, K. (2008). Corporate
social responsibility, investor protection, and earnings manage-
ment: Some international evidence. Journal of Business Ethics,
79(1–2), 179–198.
Huang, P., Louwers, T. J., Moffitt, J. S., & Zhang, Y. (2008). Ethical
management, corporate governance, and abnormal accruals.
Journal of Business Ethics, 83(3), 469–487.
Jansen, I. P., Ramnath, S., & Yohn, T. L. (2012). A diagnostic for
earnings management using changes in asset turnover and profit
margin. Contemporary Accounting Research, 29(1), 221–251.
Jensen, M., & Meckling, W. (1976). Theory of the firm: managerial
behavior, agency costs, and ownership structure. Journal of
Financial Economics, 3(4), 305–360.
Johnson, E., Fleishman, G., Valentine, S., & Walker, K. (2012).
Managers’ ethical evaluations of earnings management and its
consequences. Contemporary Accounting Research, 29(3),910–927.
Jones, J. J. (1991). Earnings management during import relief
investigations. Journal of Accounting Research, 29, 193–228.
Kant, I. (1994). The metaphysics of moral. The metaphysical
principles of virtue (1797). In I. Kant, Ethical Philosophy 2nd
edn, Trans. by James W. Ellington. Hackett Publishing Com-
pany, Indianapolis/Cambridge, MA.
Kaplan, S. (2001a). Ethically related judgments by observers of
earnings management. Journal of Business Ethics, 32(4),
285–298.
Kaplan, S. (2001b). Further evidence on the ethics of managing
earnings: An examination of the ethically related judgments of
shareholders and non-shareholders. Journal of Accounting and
Public Policy, 20(1), 27–44.
Kellogg, I., & Kellogg, L. B. (1991). Fraud, Window Dressing, and
Negligence in Financial Statements. New York: McGraw-Hill.
Kirkham, R. L. (1997). Theories of truth: A critical introduction.
Cambridge, MA: The MIT Press.
Knobe, J., & Nichols, S. (2008). Experimental philosophy. New York,
NY: Oxford University Press.
Kreps, D. M. (1990). Game theory and economic modeling.
Clarendon Lectures in Economics: Oxford, Clarendon Press.
Kurosawa, K. (1979). Shiryo: Nihon no Kaikeiseido (Accounting
Institutions in Japan: Historical Data), (1)-(16), Kigyo Kaikei
31(1).
La Porta, R., Lopez-de-Silanes, F., Shleifer, A., & Vishny, R. (1998).
Law and finance. Journal of Political Economy, 106, 1113–1155.
Lara, G. M. G., Osma, B. G. and Penalva, F. (2006). Cost of equity
and accounting conservatism. Working paper. University of
Navarra.
Leuz, C., Nanda, D., & Wysocki, P. D. (2003). Earnings management
and investor protection. An international Comparison. Journal of
Financial Economics, 69, 505–527.
Lev, B., & Thiagarajan, S. R. (1993). Fundamental Information
Analysis. Journal of Accounting Research, 31(2), 190–215.
Lin, S., Radhakrishnan, S. and Su, L. N. (2006). Earnings manage-
ment and guidance for meeting or beating analysts‘ earnings
forecasts. Available at SSRN.com/abstract = 928182.
Loebbecke, J. K., Eining, M. M., & Willingham, J. J. (1989).
Auditor’s experience with material irregularities: Frequency,
nature, and detectability. Auditing: A Journal of Theory and
Practice, 9(1), 1–28.
Loomis, C. J. (1999). Lies, damned lies, and managed earnings.
Fortune, 140, 74–92.
Lucas, N. (2004). An interview with United States Senator Paul S.
Sarbanes. Journal of Leadership and Organizational Studies, 11,
3–8.
MacIntyre, A. (1981). After virtue. London: Duckworth & Co.
Marsh, C. (2013). Business executives’ perceptions of ethical
leadership and its development. Journal of Business Ethics,
114(3), 565–582.
McCumber, J. (2005). Reshaping reason: Toward a new philosophy.
Bloomington, IN: Indiana University Press.
McKernan, J., & O’Donnell, P. (2002). Cognitive objectivity in
accounting. The 2002 critical perspectives on accounting
conference. New York: Baruch College.
McVay, S. E. (2006). Earnings management using classification
shifting: An examination of core earnings and special items. The
Accounting Review, 81(3), 501–531.
Mele, D. (2009). Business ethics., Action seeking human excellence
in organizations (189–191) New York: Palgrave-MacMillan.
Merchant, K. A., & Rockness, J. (1994). The ethics of managing
earnings: An empirical investigation. Journal of Accounting and
Public Policy, 13(1), 79–94.
Miller, P. B., & Bahnson, P. R. (2002). Quality financial reporting.
New York: McGraw-Hill Irwin.
Truthfulness in Accounting: How to Discriminate Accounting Manipulators from Non-manipulators
123
Author's personal copy
Mulford, C. W., & Comiskey, E. E. (2002). The financial numbers
game: Detecting creative accounting practices. New York:
Wiley.
National Association of Certified Fraud Examiners. (1993). Cooking
the books: What every accountant should know about fraud.
New York: NASBA.
Nobes, C. (1998). Towards a general model of the reasons for
international differences in financial reporting. Abacus, 34(2),
162–184.
Ojah, K., & Manrique, J. (2005). Determinants of corporate debt
structure in a privately dominated debt market: A study of the
Spanish capital market. Applied Financial Economics, 15,
455–468.
Parfet, W. U. (2000). Accounting subjectivity and earnings manage-
ment: A preparer perspective. Accounting Horizons, 14,
481–488.
Pindado, J., & De la Torre, C. (2006). The role of investment,
financing and dividend decisions in explaining corporate own-
ership structure: empirical evidence from Spain. European
Financial Management, 12(5), 661–687.
Rawls, J. (1972). A theory of justice. Oxford: Oxford University Press.
Rescher, N. (2007). Error, on our predicament when things go wrong.
Pittsburgh: University of Pittsburgh Press.
Riedl, E. J. & Srinivasan, S. (2006). The strategic reporting of special
items: Does management presentation reflects underlying firm
performance or opportunism? Available at SSRN.com/
abstract=923898.
Ronen, J., & Yaari, V. (2010). Earnings management: Emerging
insights in theory, practice, and research. New York, NY:
Springer Science ? Business Media, LLC.
Roychowdhury, S. (2006). Earnings management through real
activities manipulation. Journal of Accounting and Economics,
42(3), 335–370.
Schilit, H. M. (2010). Financial Shenanigans: How to detect
accounting gimmicks and fraud in financial reports. UK:
McGraw-Hill.
Schipper, K. (1989). Commentary on earnings management. Ac-
counting Horizons, 3(4), 91–102.
Schrand, C. M., & Walther, B. (2000). Strategic benchmarks in
earnings announcements: The selective disclosure of prior-
period earnings components. The Accounting Review, 75(2),
151–177.
Scott, W. R. (2003). Financial accounting theory (3rd ed.). Upper
Saddle River, NJ: Prentice Hall.
Shafer, W. E. (2002). Effects of materiality, risk, and ethical
perceptions on fraudulent reporting by financial executives.
Journal of Business Ethics, 38(3), 241–260.
Shafer, W. E. (2013). Ethical climate, social responsibility, and
earnings management. Journal of Business Ethics, 1–18.
Shapiro, B. P. (1997). Objectivity, relativism, and truth in external
financial reporting: What’s really at stake in the disputes?
Accounting, Organizations and Society, 22(2), 165–185.
Siegel, J. G. (1991). How to analyze businesses, financial statements,
and the quality of earnings (2nd ed.). New Jersey: Prentice Hall.
Solomon, R. C. (1993). Corporate roles, personal virtues: An
Aristotelian approach to business ethics’. In E. R. Winkler,
and J. R. Coombs, (Eds.). Applied ethics: A reader, pp. 201–221.
Blackwell, Oxford. Originally published in Business Ethics
Quarterly 2(3), 1992, 317–330.
Thomas, J. K., & Zhang, H. (2002). Valuation relevant properties of
smoothed earnings. Working paper, Columbia Business School.
Ueno, M. (1948). Wagakuni Keizaisaiken ni okeru Kaikeigaku no Igi
(The significance of accounting in economics restructure in
Japan). Kaikei, 56(1), 1–11.
Vinciguerra, B., & O’Reilly-Allen, M. (2004). An examination of
factors influencing managers’ and auditors’ assessments of the
appropriateness of an accounting treatment and earnings man-
agement intentions. American Business Review, 22(1), 78–87.
Watts, R. L., & Zimmerman, J. L. (1986). Positive accounting theory.
Englewood Cliffs, NJ: Prentice Hall.
Williams, B. (1985). Ethics and the limits of philosophy. Cambridge,
MA: Harvard University Press.
Zang, A. Y. (2012). Evidence on the trade-off between real activities
manipulation and accrual-based earnings management. The
Accounting Review, 87(2), 675–703.
A. B. Vladu et al.
123
Author's personal copy