Embed Size (px)
Citation preview

Association for Information SystemsAIS Electronic Library (AISeL)
MCIS 2016 Proceedings Mediterranean Conference on Information Systems(MCIS)
2016
An Innovation and Risk DashboardJanine JoubertUniversity of Town, [email protected]
Jean-Paul Van BelleUniversity of Town, [email protected]
Follow this and additional works at: http://aisel.aisnet.org/mcis2016
This material is brought to you by the Mediterranean Conference on Information Systems (MCIS) at AIS Electronic Library (AISeL). It has beenaccepted for inclusion in MCIS 2016 Proceedings by an authorized administrator of AIS Electronic Library (AISeL). For more information, pleasecontact [email protected].
Recommended CitationJoubert, Janine and Van Belle, Jean-Paul, "An Innovation and Risk Dashboard" (2016). MCIS 2016 Proceedings. 14.http://aisel.aisnet.org/mcis2016/14
Tenth Mediterranean Conference on Information Systems (MCIS), Paphos, Cyprus, September 2016 1
AN INNOVATION AND RISK DASHBOARD
Completed Research
Janine Joubert, University of, Town, [email protected]
Jean-Paul Van Belle, University of, Town, [email protected]
Abstract
In order to manage new product and service innovations within organisations effectively, cognizance
needs to be taken of a wide number of diverse risks that are multidisciplinary in nature. However, to
display such a large number of risks in a fast-changing environment on short notice with dispersed
information requires novel techniques. Using a design science methodology, a unique artefact was de-
livered with a design grounded in scientific literature, including prescriptive and concrete knowledge
sources as well practical knowledge. This risk and innovation dashboard allows new product and ser-
vice development teams to make quicker and more informed decisions during stage/gate processes.
Since no dashboard design approach for managing risks in new product and service development could
be found in the academic literature, this paper hopes to make a novel contribution to the state of the art
in the fields of decision support systems as well as innovation and risk management.
Keywords: Design Science, Innovation, Risk Management, Decision Support, Dashboard.

Joubert and Van Belle /Innovation and Risk Dashboard
Tenth Mediterranean Conference on Information Systems (MCIS), Paphos, Cyprus, September 2016
2
1 Introduction
The continued sustainability of an organisation is increasingly dependent on successful innovation
(Cooper, 2001). Innovation accounts for between 33% and 60% of organisational revenues (Nambisan,
2003). Despite considerable investments, consumer innovations are subject to an 80% failure rate even
before launch (Park and Kim, 2011).
Considerable uncertainty exists during the New Product and Service Development (NPSD) lifecycle,
such as an increasingly complex technical, economic and social environment (Williams, 1995). NPSD
teams are increasingly driven by a ‘faster-better-cheaper’ philosophy, yet pressurised to provide inno-
vative solutions (Cooper, 2003). More innovative projects are subject to greater degrees of risk (Kessler
and Chakrabarti, 1999). Furthermore, high technology based service innovations are inherently complex
due to a multitude of cross-functional resources, vendors, stakeholders, customers and new business
models that distribute risk over a wide area of the organisation (Olsen et al. 1995). Technology risks
were indicated as being the source of cost escalations of 45% and schedule overruns of up to 22 months
(Olechowski et al. 2012).
While the study of innovation has become increasingly popular, there is a lack of comprehensive frame-
works for managing risks in innovation (Yen et al. 2012). To address this research gap, the Action
Research (AR) study developed an integrated innovation and risk management framework (IRMF) and
supporting risk artefacts to more effectively manage risks via three iterative cycles studied over five
years in a large multinational telecommunication company. During the action research iteration, the
NPSD group requested a summarised executive overview to be presented during NPSD stage/gate meet-
ings. Risk reviews were often quite lengthy and top management was not inclined to work through
volumes of data. A snapshot of top risks should be submitted as a concise, single-screen, decision-mak-
ing tool to assess whether the proposed product and/or services (P&S) can proceed to the next stage/gate.
The objectives were to facilitate proactive risk communication and to allow identification of major risks
at a glance, as well as to be easy to understand, use and automate. Additionally, the dashboard should
promote and reflect the research objectives and interventions introduced during the AR iterations.
The design of a dashboard presented several challenges. Deliberations and interpretations of the problem
are largely dependent on information from disparate functional areas of the NPSD group. Furthermore,
the users who attended the stage/gate meetings were unpredictable. Information was difficult to obtain
and was stored in several documents and emails; and it was not always clear what the latest version or
status was. Information was often of a ‘tacit’ nature, contained expert knowledge and was difficult to
present. The key IT requirements were to accommodate a complex and evolving knowledge basis and
unstructured supporting processes and frequent last-minute changes. Additionally, the dashboard should
be adaptable to the context of the organisation as well as the unique requirements of the P&S. Due to
the sheer number of risks presented during P&S development, it was necessary to develop a suitable
abstraction layer that could extract and present Key Risk Indicators (KRIs) from the risk knowledge
base. The main challenge to developing the dashboards was conceptual, rather than technological (Sil-
veira et al. 2010).
A design science (DS) approach was used to design the risk dashboard. The objective was the develop-
ment of a risk dashboard as a business management decision-making tool for use at NPSD stage/gate
meetings, that provides key risk metrics in a stylish, reliable, usable and customisable interface and
improves understanding and subsequent management of risks and Risk Management (RM) processes
within NPSD. The dashboard provides a visual decision-making interface that is presented at two
stage/gate meetings to allow the P&S to pass through to the next stage gate. The dashboard is built on a
RM knowledge base that displays information relevant to the stage/gate and the P&S. Processes to up-
date information from unstructured sources support the dashboard. The dashboard was implemented and
evaluated over a period of nine months. Proof of concept was delivered to risk practitioners, and cross-

Joubert and Van Belle /Innovation and Risk Dashboard
Tenth Mediterranean Conference on Information Systems (MCIS), Paphos, Cyprus, September 2016
3
case implementation in two NPSD contexts occurred, complemented with qualitative analysis, applica-
tion in practice and, lastly, an evaluation by risk experts. The risk dashboard is widely used in the or-
ganisation and has expanded to other markets in which the group operates. The dashboard is in the
process of being commercialised by a RM system developer.
The main knowledge contribution is the DS artefact itself: the NPSD risk dashboard. While a dashboard
is a popular tool in the business environment, scientific literature is lagging. Few academic studies exist
and limited guidance is provided (Yigitbasioglu et al. 2012). Dashboard design is still a relatively new
area of research (Eppler and Aeschimann, 2009). DS approaches were used to design EIS dashboards
(Marx et al. 2011), but to the best of the researchers’ knowledge, no dashboards were specially devel-
oped for managing risks in NPSD on a per project basis.
The paper starts with a short review of the literature concerning information dashboards, then details the
design science approach which was followed and articulates the problem formulation in greater depth.
The bulk of the paper is devoted to the design and development of the artefact, followed by a discussion
of the implementation. It concludes with a description of the research contributions made by the paper
and discusses the limitations and suggests future work in this space.
2 Information Dashboards
The risk dashboard design is novel as it is the first approach that investigates a comprehensive, cross-
functional area of risk with a high technology organisation validated over 160 innovation projects. Fur-
thermore, the risk dashboard is adaptable to the unique requirements of the P&S as well as to the NPSD
lifecycle requirements. Additionally, the dashboard is built on a substantial knowledge base about risk
incidences and opportunities that were developed through four years of AR iterations.
The concept of an information dashboard is not new and was popularised as an Executive Information
System (EIS) artefact in the 1980s (Few, 2013), using business intelligence to monitor Key Performance
Indicators (KPIs) of organisations such as the Balanced Score Card (Kaplan and Norton, 1992). In
NPSD, scoring models are utilised during portfolio management selection to optimise the trade-off be-
tween investments and the associated risks, such as the 19-Dimension Scoring Model proposed by
Cooper (1999). The use of multi-dimensional measurement models, rather than mere financial models,
is more successful at predicting long-term impact of the P&S on the sustainability of the organisation
(Meskendahl, 2010). In RM literature, risk dashboards are frequently used to present visual information
about Key Risk Indicators (KRIs) (Vinella and Jin, 2005). Risk indicators function as early warning
systems, which are often presented via a dashboard interface. However, the risk profile is often difficult
to visualise and describe (Horwitz, 2004) which makes it difficult to represent on dashboards. Also,
dashboards often fail to communicate the relevant information (Few, 2013).
Since risk reports are often lengthy, the risk profile can be more efficiently communicated by using
visualisation techniques, especially if the risks described are complex (Hahn et al. 2007). The benefits
of visualisation are seen as facilitating better engagement, quicker learning, improved clarity, and deeper
analysis, as well as better retention of information than mere text and print communications (Kontio et
al. 2004). Visualisation can, however, present risks such as displaying insufficient and misleading in-
formation (Bresciani and Eppler, 2008).
While business interest in dashboards as a management tool is growing, the scientific literature is lack-
ing; only a handful of academic studies exist which provide limited guidance to practitioners and re-
searchers (Yigitbasioglu et al. 2012). The design of a dashboard can, therefore, still be considered a
relatively recent area of research (Eppler and Aeschimann, 2009). While some researchers use DS ap-
proaches to design EIS dashboards, no risk dashboards could be found specifically developed for use in
NPSD (Marx et al. 2011). Since no dashboards were specially developed for managing risks in NPSD
on a per project basis, related studies were investigated.

Joubert and Van Belle /Innovation and Risk Dashboard
Tenth Mediterranean Conference on Information Systems (MCIS), Paphos, Cyprus, September 2016
4
Marx et al. (2011) provided six principles for designing EIS prototypes, which include a comprehensive
information model, reduced information, interface design, flexibility, information management princi-
ples and prototyping. Silveira et al. (2010) developed a risk dashboard that specifically deals with com-
pliance on an organisation-wide basis but does not use DS approaches. Eppler and Aeschimann (2009)
developed a systematic framework for risk visualizing in RM which answers question of why, what, for
whom, when and how as well as which kinds of risks and risk related information (what) should be
visualized. Guidelines for the development of dashboards based on principles in Gestalt theory were
investigated to establish how to arrange data in sensible ways while conveying meaning to the intended
audience (Few, 2013).
However, the research problem did not follow structured decision-making processes that can be effec-
tively supported by familiar classes of systems like EIS. NPSD processes are characterized as ‘emergent
processes’ where problem solving, assessment and action taking do not follow a predictable pattern
(Markus et al. 2002). The problem was essentially characterised by Markus et al.’s (2002) design theory
for systems that support emergent knowledge processes (EKPs) as ‘organisational activity patterns’ that
display “an emergent process of deliberations with no best structure or sequence; requirements for
knowledge that are complex (both general and situational), distributed across people, and evolving dy-
namically; and an actor set that is unpredictable in terms of job roles or prior knowledge”. The EKP
system design and development principles were used during the development of the risk dashboard.
3 Research Approach
Simon (1996) coined the phrase ‘science of the artificial’ to describe knowledge gained by DS as ”a
body of intellectually tough, analytic, partly formalisable, partly empirical, teachable doctrine about the
design process” (Cross, 2001, p. 1). The researchers developed a combined approach based on the
Peffers et al. (2006; 2007) and Sein et al. (2011) Action Design Research (ADR) frameworks. The DS
framework has been adapted to follow the requirements of the organisation and the type of artefact to
be introduced. Figure 1 below provides a consolidated view of the DS method developed by the study.
Deliverables for each phase are shown and the arrows from the Formalisation of Learning Phase desig-
nate that all the previous deliverables need to be evaluated at this point.
Phase 1: Problem Formulation: The re-
search problem is defined according to
the context and scope of the organisa-
tion and the value of the solution to the
key stakeholders. The criteria to meas-
ure the effectiveness of the artefact as it
is aligned with the objectives were also
developed during this phase.
Phase 2: Design and Development: This phase is based on Peffers et al. (2006; 2007) ‘design and de-
velopment’ stage and the first two parts of Seins et al.’s (2011) BIE phase. It is also important to consider
that the design and development follow iterative cycles such as in AR where prototypes are developed
and improved.
Phase 3: Implementation and Evaluation: This phase involves the demonstration of the problem within
the organisational context and the evaluation of the artefact according to Peffers et al.’s (2006) guideline
objectives and benefits. The phase is reflective of the ‘evaluation’ phase of Seins et al.’s (2011) BIE.
Phase 4: Formalisation of Learning: Seins et al.’s (2011) ADR ‘formalisation of learning’ principle was
selected as the final phase instead of the Peffers et al. (2006) ‘communication’ phase. The researchers
were required to demonstrate generalised outcomes in terms of the problem, solution and the develop-
ment of new design principles. Since DS was utilised as an alternate approach to AR, a less rigorous
Define problem, context, value and objectves
Problem
Formulation
Design and
Development
Design and development of
artefact
Implementation
and Evaluation
Demonstrate and
communicate to stakeholders
Demonstrate and
communicate to stakeholders
Formalisation of
Learning
Design Science Approach
Figure 1: Design Science Approach

Joubert and Van Belle /Innovation and Risk Dashboard
Tenth Mediterranean Conference on Information Systems (MCIS), Paphos, Cyprus, September 2016
5
communication phase was deemed appropriate. The artefact still, however, needed to conform to prop-
erties of being useful and original within the context of where it was delivered. The Hevner, March and
Park (2004) guidelines were used to evaluate the validity and robustness of the artefact.
The artefact as a risk dashboard was designed and evaluated using the approaches stated above and was
introduced during iteration three of the AR cycle. The design of the dashboard is primarily explorative
in nature since research on dashboard design is scarce (Yigitbasioglu and Velcu, 2012).
4 Problem Formulation
It was first necessary to assess the complexity of the
problem. Peffers et al. (2006) argue that working
backwards facilitates the solving of unexpected
problems, which entail specification of the objective
(goal state) to be achieved. Using Soft Systems
Methdology (SSM), the root definition (RD) was ar-
ticulated and purposeful activities were analysed by
using the CATWOE mnemonic of SSM. The cus-
tomers were the NPSD practitioner teams and the
risk practitioners who were the ultimate users re-
sponsible for compiling and presenting the risk
dashboards. The transformation actors were the researchers who designed the intervention that the risk
practitioners (as secondary transformation agents) applied to meet the RD objectives. The owners of the
process were the NPSD executives who could halt the use of the dashboard and request changes. The
transformation ideas were based on the concepts of visualisation as well as the existing IRMF and pro-
cesses. Several external constraints existed, such as the predictions of who would attend the meetings
and how they would deliberate use the risk dashboard. A detailed requirements analysis was not possi-
ble, as stage/gate attendees had different risk interests.
More succinct problem identification was initiated by using Eppler and Aeschimann’s (2009) systematic
framework for risk visualisation. The risk dashboard conformed to the RM framework that was used for
NPSD as well as the overall RM framework of the organisation based on the ISO 31000 (2009) frame-
work. Additional requirements emerged as a result of the analysis of the ISO 31000 compliance require-
ments such as consultation, enabling informed risk-decision-making and fit within the context of the
organisation, RM and NPSD and the complete RM process. Presenting all these requirements in a lim-
ited space for a sophisticated, high technology, fast-changing P&S was challenging. Silveira et al. (2010)
experienced similar difficulties during the design of compliance governance dashboards; they identified
these as: (1) identifying the right level of information abstraction; (2) visual presentation of the diverse
elements of the risk analysis cycle; and (3) managing various concepts, instruments and data.
Two different dashboards were required at two
stage/gates: (1) at the end of the planning stage (Gate
2) and (2) testing phase (Gate 4). More executives
would attend the development stage/gate, which there-
fore required more high-level content. The size of the
knowledge gap (meaning the uncertainty aspect of
risk) was higher at Gate 2 than Gate 4, since the P&S
was already designed and tested during the latter. The
closing of the knowledge gap is indicated by the vari-
ances between the two dashboards and potentially
could demonstrate the value added by RM.
Figure 2: Purposeful Activity
Joubert and Van Belle /Innovation and Risk Dashboard
Tenth Mediterranean Conference on Information Systems (MCIS), Paphos, Cyprus, September 2016
6
The risk dashboard was required as a business management tool that could clearly indicate risk statuses
by using key project metrics for the primary audience, senior management, to facilitate their functioning
in an oversight role within the NPSD organisation. The main risks associated with the P&S should be
indicated as well as the required risk strategies as a demonstration of risk versus reward. Additionally,
the dashboard should improve risk decision-making and focus on best practices to achieve the key ob-
jectives of the P&S. This risk dashboard furthermore was to provide visibility into the RM process and
present the users of the dashboard with the ability to understand the key risk metrics.
5 Design and Development
NPSD practitioners were consulted to derive content requirements, but their input was of limited value
due to their lack of exposure to risk dashboards. The researchers developed basic prototypes as a baseline
from which feedback could be obtained. EKP principles were subsequently used to fill the gaps with
regards to what content needed to be displayed. The risk practitioners, as the primary users, were con-
sulted in what Markus et al. (2002) referred to as an ‘onion layering’ approach. Five layers of ‘naïve
users’ were consulted, which assisted in obtaining their buy-in and commitment. These sessions lead to
the development of a conceptual model of the dashboard requirements. A KPI identified by the risk
practitioners (aligned to Marx, Mayer and Winter’s (2011) principles for EIS development) was the
availability of accurate (and latest) information. Further requirements were that Dashboard B (launch
stage/gate) could be more operational, whilst Dashboard A needed to be more strategic. Dashboard A
should present risks according to a specific P&S portfolio and the impact of those risks should be set
out. Such a method was not available, which led to the development of the portfolio classification model.
(Davis, 2002).
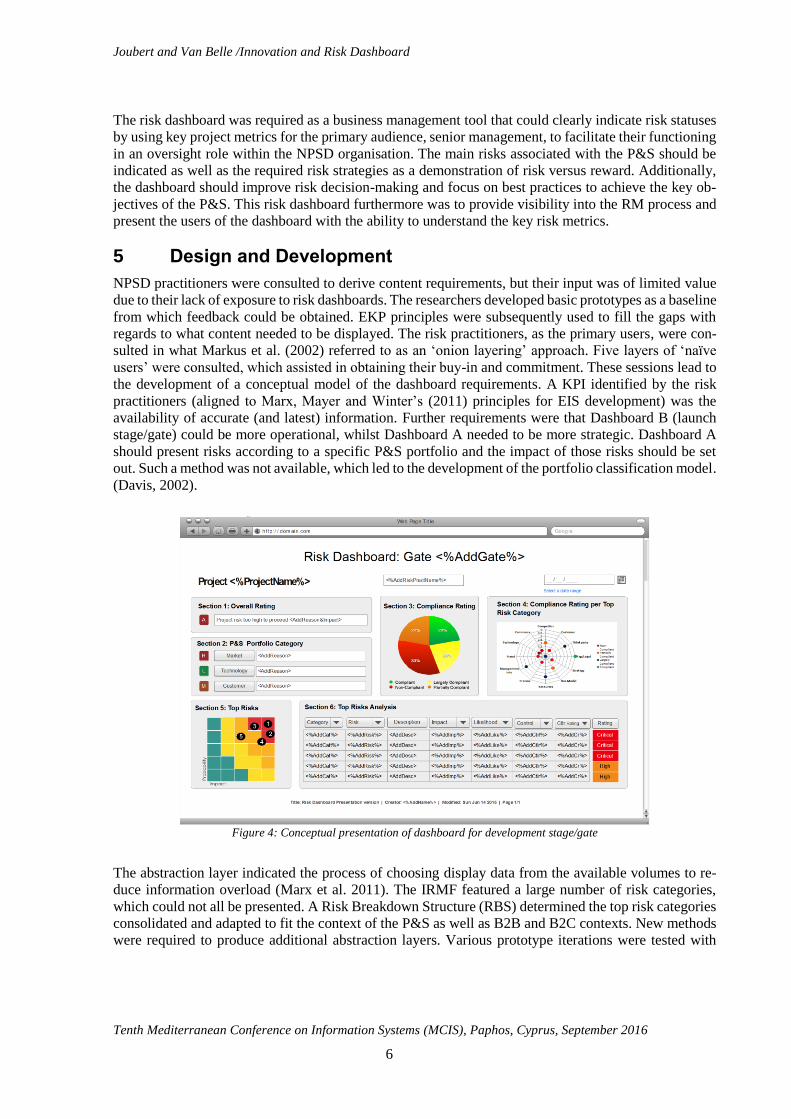
Figure 4: Conceptual presentation of dashboard for development stage/gate
The abstraction layer indicated the process of choosing display data from the available volumes to re-
duce information overload (Marx et al. 2011). The IRMF featured a large number of risk categories,
which could not all be presented. A Risk Breakdown Structure (RBS) determined the top risk categories
consolidated and adapted to fit the context of the P&S as well as B2B and B2C contexts. New methods
were required to produce additional abstraction layers. Various prototype iterations were tested with

Joubert and Van Belle /Innovation and Risk Dashboard
Tenth Mediterranean Conference on Information Systems (MCIS), Paphos, Cyprus, September 2016
7
different interface designs and alternative risk presentation methods, using different charts and styles of
presentation and using information varieties from the knowledge base. During prototyping, the general
attitude was that the dashboard appeared appealing and provided a good risk snapshot of the P&S. The
abstraction layer rules were to be updated, as they did not achieve the desired level of abstraction. By
using risk indicator values (e.g. low, medium, high) and colours (e.g. red, orange, green and blue), more
suitable abstraction layers could be designed.
Design for offline action included the design of an effective method of prioritisation activities. The risk
methodology already provided an efficient means to prioritise risks by evaluating the impact and prob-
ability. Another method used to inspire action was to demonstrate the size of the performance gap related
to ambiguity and uncertainty risks. These risks originated from uncompleted activities that could directly
influence the success or failure of the P&S. The executives could focus on non-compliant aspects that
would impact on the quality of the P&S. Expert and local knowledge was integrated by consolidation
of unstructured communications. The objective was to obtain last minute changes to provide an accurate
reflection of the project status. Risk practitioners guiding NPSD practitioners through the different in-
formation sections of the risk dashboards facilitated practical guidance. Further guidelines such as Ge-
stalt principles were applied. The risk dashboard was automated as far as possible. Last minute infor-
mation was updated in the knowledge base. All the graphs, heat maps and risk evaluations were auto-
mated based on the underlying risk knowledge base. A prototype of the risk dashboard is provided below
and the different sections of the dashboard are subsequently explained.
Section 1 – A single qualification of the overall risk exposure of the particular P&S project was devel-
oped in collaboration with risk practitioners and senior leadership of RM. The overall rating scheme
fulfilled two purposes: to provide (1) a quick guidance to senior leadership of the overall P&S risk, as
well as (2) a way for the risk practitioners to reinforce their CEO-granted mandate to prevent P&S from
exposing the organisation to excessive risk. The risk rating was classified from A to E, where A meant
that the risk was too high for the P&S to proceed, while E indicated the lowest risk level.
Section 2 – Dashboard A required a more strategic focus to
advise the NPSD executives of the portfolio risk. No pro-
cedure or matrix was in place to aid the classification of
P&S into categories. The portfolio classification model was
inspired by Davis’s (2002) categories of products. How-
ever, fundamental changes were required to create catego-
ries for services (rather than products). In addition to all
other adaptations, a significant departure from the measure-
ment of risk was introduced. Davis (2002) estimated risk
according to ‘increasing market risk’ on the left and, on the
right, ‘increasing product risk’ that was changed to ‘in-
creasing technology risk’ (refer to Figure 5). It is more rel-
evant to organisations that predominantly launch services
to measure the risks according to 'market' and 'technology' risk, especially in B2B, which operates in a
highly technical environment. The classification provided in Figure 5 provides a valuable additional
abstraction method, allowing focus on either market or technology risks.
Section 3 – The presence or absence of the risk or best practice was indicated in this section according
to a unique compliance rating designed for each risk category of the IRMF. Four possible compliance
levels exist on a maturity scale that aligns to capability maturity models (CMM) developed for the
IRMF. These are evaluated according to evidence presented by the NPSD teams: Level 4: Compliant
(C); Level 3: Largely Compliant (LC); Level 2: Partially Compliant (PC); and Level 1: Non-Compliant
(NC). If a particular risk was rated at Level 1 NC or Level 2 PC, it was specified as a mandatory re-
quirement. A Level 3 LC rating required suggestions for improvement and Level 4 C rating indicated

Joubert and Van Belle /Innovation and Risk Dashboard
Tenth Mediterranean Conference on Information Systems (MCIS), Paphos, Cyprus, September 2016
8
conformance to best practices. The compliance ratings offer a summary of the total percentage of un-
completed activities and knowledge gap risks that exist due to ambiguity and uncertainty within each of
the 24 categories of the IRMF.
Section 4 – The radar chart indicates the knowledge gap and makes visible the top categories of non-
compliance. A RBS was used to develop the abstraction layer modified according to the portfolio clas-
sification. For a P&S that is classified as ‘new market’, the market-related risk categories will be more
important since the technology is known and uncertainties and opportunities exist within the market.
Where technology risk is higher, such as in the ‘new development’ category, the technology risks would
be more important.
Section 5 – The 5x5 risk heat map provides a visual presentation of the top individual risks (shown in
Section 6) along with a qualitative scale of probability and impact.
Section 6 – The principal risks associated with the P&S are aligned with the ISO 31000 (2009) frame-
work that allows for the display of residual risks. Residual risks consider the extent to which risks are
mitigated by risk controls. The risks are considered in terms of impact that is multiplied by probability
on a 5-point scale. The effectiveness of the control is deducted, and this provides an indication of the
residual risks. The risks and controls are based on the risk lists and risk strategies developed during the
AR iteration and contained within the risk knowledge base.
6 Implementation and Evaluation
The implementation process was inspired by Markus et al.’s (2002) EKP principle of design for cus-
tomer engagement by consulting with the individual risk practitioners to obtain buy-in and collaborate
on the development of the dashboard. The personal approach, rather than a group approach, worked
well. By the time the dashboard was introduced in a group setting, the risk practitioners had bought into
the concept. RM measures were adequately organized into groups of related information, and colour
was effectively used to highlight areas where attention was required. The visual design was thought to
be pleasing. Risk practitioners, however, had reservations around whether the NPSD practitioners would
approve of the dashboards since the dashboard style did not align with the prevailing predominantly
text-based NPSD dashboards. Executive approval was initially tested when the dashboard was presented
to the executive in charge of RM in a group setting. The opinion was that the executive approved of the
dashboard but lacked an intuitive understanding of it. It followed that the dashboard was required to be
demonstrated with some training to the NPSD teams. Two basic evaluation approaches are used by
studies, namely user studies and expert evaluation (Gannholm, 2013).
Dashboards were subsequently demonstrated and explained to NPSD teams during special focus ses-
sions. Two sessions with respondents from B2B and three with B2C respondents took place. All pro-
spective dashboard users were present, and attendees ranged from eight to 12 at a time. The objective
was to determine the usability of the dashboard. Following a walkthrough by a risk expert explaining
the different components, questions were posed: (1) what they thought about the dashboard; (2) if they
believed that it was useful; (3) if the information was relevant; (4) whether there was missing infor-
mation (anything else they wanted to look at); (5) whether there was too much information; (6) whether
it was easily understandable; (7) whether it was unnecessarily complex; and (8) what they thought about
the presentation of the information regarding layout and symbols/icons. NPSD group consensus was
that the dashboard was useful, relevant, not too complicated and understandable, and the attendees liked
the way it was presented. NPSD practitioners remarked, ‘that it was definitely useful’ and even though
they did not have previous exposure to a risk dashboard, they ‘thought it was good’. Additional com-
ments were that the dashboard was ‘very colourful’, ‘looks very professional’ and ‘delivered what was
asked’.
B2B executives generally indicated a more favourable disposition to the dashboard than the B2C teams.
Top management was attracted to the ‘look and feel’ of the risk dashboards. The strong selling point

Joubert and Van Belle /Innovation and Risk Dashboard
Tenth Mediterranean Conference on Information Systems (MCIS), Paphos, Cyprus, September 2016
9
was a quick summary and overview of risks instead of detailed documentation that supported the risk
assessment of the P&S. The NPSD practitioners mentioned that the dashboard delivered on their purpose
of providing an accurate bird’s-eye view of the risks, relevant to the specific P&S, as well as the
stage/gate meeting. A further test came when the dashboard was implemented and demonstrated at a
stage/gate meeting where high-level executives were present that were not previously exposed to the
risk dashboard. One of the researchers was meant to introduce the dashboard, but instead, the product
manager talked the executives through the dashboard with a complete understanding of what each of the
elements meant. One of the senior executives expressed unexpected delight by remarking how much he
liked the risk dashboard. The risk dashboard was subsequently implemented at various stage/gate meet-
ings and integrated as a key deliverable of the stage/gate processes. An unintended consequence of the
risk dashboard was that other risk specialist units felt pressurised to deliver similar dashboards, stating
that they needed to compete to provide 'fancy dashboards like risk'.
Five months after the dashboard was implemented, risk practitioners convened to conduct a final eval-
uation of the dashboard. Alignment to its stated objectives was confirmed. An assessment of compliance
to Pauwels et al.’s (2009) metrics for adoption and success of marketing dashboards was conducted by
the risk experts. The results indicated that all relevant users were consulted, the decision-making style
of the organisation was considered, and interdepartmental coordination was included, as were key in-
dustry metrics. The fit between the metrics, sophistication, visual display and drill-down capabilities
with the user needs were considered. Implementation considered key success factors such as support of
top management, user involvement, prototyping, communication, training and IT department involve-
ment. A positive predisposition was indicated in terms of attitude, trust and delivering on expectations.
These criteria can be effectively applied for the development of NPSD risk dashboards.
For DS design it is of particular relevance to demonstrate the utility of the dashboard. Usefulness was
evaluated by practitioners and experts and then in a practical organisational setting for a period of five
months applied to more than 50 diverse NPSD projects. The dashboard was effective in supporting the
real-life problem situation of functioning as a business management decision-making tool during
stage/gate meetings. The key risk metrics that indicated effective management of risks and opportunities
associated with innovation were utilised on a per project basis and improved understanding and subse-
quent management of risks and RM processes within NPSD, established by the increased utilisation of
the dashboard in other project contexts and countries. The dashboard evolved as an essential tool sup-
porting innovation project stage/gate decision-making in the organisation. The dashboard utility rested
in its ability to help practitioners solve a practical problem as well as providing a process that guides
informed risk aware decision-making and problem solving.
The success of the dashboard was assigned to the provision of consolidated risk information at the
stage/gate meetings, which facilitated an improved understanding of the risk processes. Acceptance of
the dashboard was also attributed to the organisational culture, since NPSD practitioners could establish
that the dashboard was designed based on robust processes and research, as they would typically suggest
changes. Risk practitioners perceived the fundamental advantage of the risk dashboard to be the process
implemented to obtain the latest information from NPSD project stakeholders. NPSD practitioners were
not exposed to surprises due to having full knowledge of what would be presented by risk practitioners
at the stage/gate meetings. Formerly, stage/gate meetings could be contentious, as some P&S would not
pass through to the next gate due to risks that were highlighted which reflected negatively on the re-
sponsible NPSD practitioner. The dashboard was reckoned as a tool for building trust and consensus
during the stage/gate meetings rather than as merely an information device. The tool changed behaviour
in the organisation where risks and opportunities were assessed via calculated decision-making methods.

Joubert and Van Belle /Innovation and Risk Dashboard
Tenth Mediterranean Conference on Information Systems (MCIS), Paphos, Cyprus, September 2016
10
7 Research Contributions
This study applied DS to develop an organisation artefact within the main study method of AR. The
knowledge contribution (DS phase 4) is articulated by reflecting Gregor et al.’s (2013) DS knowledge
framework by explaining the knowledge contributions in terms of descriptive knowledge (what?) and
prescriptive knowledge (how?). The section is concluded with a practical summary of generic guidelines
for the development of risk NPSD dashboards. Prescriptive knowledge sources (how?) are subsequently
explained as knowledge contributions, as indicated in Figure 6.
This study proposes a methodology that can ef-
fectively be applied within the context of a large
high technology organisation, as well as within
an AR study. The methodology consisted of
four phases, of which phase two followed an it-
erative approach. As new requirements became
visible, due to the application of additional the-
ories and methods, these were built into the
dashboard design. Peffers et al.’s (2007) DS ap-
proach and Sein et al.’s (2011) ADR processes
offer high-level guidance but do not explain
how the actual activities of the processes should
take place. This study expands on existing research by providing guidance for problem formulation.
Support is provided in terms of structuring the problem to obtain a clear understanding of the context,
actors and cultural aspects. Application of SSM RD and CATWOE can aid in understanding the problem
and in guiding purposeful action at a high level.
The study further expands on existing DS and ADR research by providing guidance for the design of
the risk dashboard. In this study, this was achieved by applying Eppler and Aeschimann’s (2009) sys-
tematic framework for risk visualisation. The design requirements were further expanded by introducing
another layer of design requirements by including compliance to the ISO 31000 framework. It is thus
suggested that design should also consider best practices applicable to the development of the artefact.
The approach followed by this research implies that, for unstructured problem resolution, the problem
should be analysed from several perspectives.
Additional guidance was required to define the content and methods that would be applied to the dash-
board. The six principles of Markus et al.’s (2002) EKP theory were applied; these were supportive of
the way the NPSD group was structured and indicative of the competitive, fast-changing and unique
requirements of each P&S. This study expands on the EKP theory by proposing that additional processes
to support near real-time consolidation of information are supported if required. One of the reasons for
the success of the dashboard was attributed to inclusion of up-to-date, last minute, unstructured infor-
mation. Dashboard design principles were applied to analyse how to arrange volumes of disparate data
in a sensible way that conveys meaning (Few, 2013).
Hevner et al.’s (2004) evaluation criteria for artefact design are furthermore discussed. The dashboard
was practical and was an instantiation of the AR deliverables. Davis (2005, p.18) advises that a DS
artefact should have characteristics of a “new or improved design… (that can be) demonstrated by rea-
soning, proof of concept, proof of value added, or proof of acceptance and use”. There were serious
initial concerns about the ability to deliver the artefact and about the performance of the artefact. The
artefact was applied in a particular domain, namely RM within NPSD, which is deemed to be appropriate
for the development of dashboards. All of the challenges inherent in establishing problem relevance
were present. People, organisational and technology aspects presented some of these challenges. The
problem was relevant to practitioners and the artefact effectively solved the problem.

Joubert and Van Belle /Innovation and Risk Dashboard
Tenth Mediterranean Conference on Information Systems (MCIS), Paphos, Cyprus, September 2016
11
The research should be of relevance to practitioners as well as researchers. Wilson’s (2002) research
contributions analysis includes advancement of the theory, methods and applications, improvements to
existing works, whether it is interesting and whether it can be transferable to other situations.
The descriptive knowledge (what?) is subsequently discussed with reference to Figure 7. Descriptive
knowledge sources included the IRMF as well as the supporting risk artefacts and models developed
during the AR. The IRMF consolidated
both best practices and risks into the dash-
board. The abstraction layer was based on
the prioritisation methods developed dur-
ing the AR iterations, including consolida-
tion of risks into second-level constructs
and portfolio classifications. Further con-
temporary information is being introduced
by knowledge about the NPSD lifecycle,
stage/gate processes and the different types
of knowledge that are utilised at each
stage/gate. The ISO 31000 RM process re-
quirements were further introduced during
the design of the dashboard. The organisation’s NPSD lifecycle and stage/gate processes and the differ-
ent types of knowledge were utilised at each stage/gate provided descriptive knowledge sources. Other
types of ‘what’ knowledge sources were applied to understand the different categories of P&S. For this
purpose, Davis’s (2002) model of four major product categories was adapted to more specifically suit
services and the requirements of the organisation that predominantly launched services in both B2C and
B2B areas. The prototyping followed an iterative process that resulted in the final artefact.
The evaluation methods considered usefulness, quality and value of the artefact. Hevner et al. (2004)
advised that descriptive evaluation is best suited to original artefacts where no other feasible methods
of assessment exist. The dashboard was evaluated in several ways: firstly, by developing proof of con-
cepts to the risk practitioners; secondly, by demonstration in two environments, namely B2B and B2C,
during which a qualitative analysis was conducted; thirdly, by putting it in practice for a period of five
months, after which it was again evaluated by a panel of risk experts; and lastly, implementing the
dashboard in additional contexts which allowed additional cross-case analysis to establish if the dash-
board would be applicable to the context of IS projects, mobile-health and the financial and insurance
industries in which the organisation operates. At the end of AR iteration three, the dashboard was im-
plemented in other countries in which the organisation operates. The dashboard was also widely tested
on over a hundred NPSD projects and could easily accommodate diverse requirements. The adoption
and success of the dashboard can be indicated by its increased adoption and use. This research also
expands on existing knowledge by the evaluation methods that were applied within the organisation.
Qualitative approaches were used which the NPSD practitioners guided by open-ended questions, fol-
lowed by expert-analysis and usage within a variety of contexts. This multi-disciplinary approach vali-
dated the success of the dashboard since usage increased over many different departments and types of
P&S.
Generalisable design principles are subsequently articulated. The following lessons learnt could stimu-
late the design and implementation of a successful NPSD risk dashboard in large organisations in high
technology environments. Design principles that can be shared with practitioners are deemed to be:
Obtain a clear understanding of the problem by using structured methods; understand the extent of flex-
ibility that is required to address the problem since the application of rigid methodologies to flexible
problems is not suitable; use a variety of methods that offer different perspectives to obtain a deeper
understanding of the problem; consider best practices suited to the discipline to inform the requirements;
and apply a personal one-on-one approach to collaborate with selected experts during the design of
Risk Dashboard
Innovation & Risk Framework (IRMF)
Risk ListsRisk Action
ListsRisk
Strategy
Risk Knowledge Base
Portfolio Classificaton
Innovation & Risk Literature
review
AR interventions
B2B
B2C
Financial
Services
IT/IS projects
International
operations
Knowledge SourcesDescriptive (What?)Context
Descriptive Knowledge
Figure 7: Descriptive Knowledge

Joubert and Van Belle /Innovation and Risk Dashboard
Tenth Mediterranean Conference on Information Systems (MCIS), Paphos, Cyprus, September 2016
12
prototypes to obtain buy-in and commitment. To elicit requirements, develop prototypes that are diverse
and opposing. It is easier to gage negative and positive responses and define requirements from these
responses. Consider the decisions and actions that need to be taken by the different customers as a result
of the dashboard, as part of requirements. Design the abstraction layer by developing classification mod-
els that can reduce the risk indicator values from the risk knowledge base into manageable components.
Design supporting processes to obtain the latest, most accurate information for inclusion in the dash-
board, as well as rules for maintenance of the dashboards. Use several methods to evaluate the artefact
in different contexts to ensure transferability to other environments.
8 Limitations and Future Work
Because the dashboard was specifically developed for the purpose of the organisation, it is not clear to
what extent it would be transferable to other organisations. It also depends on the extent to which other
organisations actively manage risks in new P&S. The question of transferability between B2B and B2C
organisations can be answered as the dashboard was found to be equally applicable to both. In addition,
the dashboard and risk processes were introduced in the financial services function of the NPSD organ-
isation, where it was found to be working equally well. The dashboard was also introduced in other
countries in which the organisation operates, of which three countries are active users. Considering these
contexts, it is viable that the research can be transferable to other ICT contexts.
Limitations of the dashboard could potentially be that the dashboard did not utilise qualitative criteria
to gauge the effectiveness of the risk dashboard due to organisational constraints. However the applica-
tion of multiple evaluation methods and the application of the artefact in different domains should ad-
dress some of these shortcomings.
Future research should consider how to accommodate unstructured knowledge within a dashboard and
introduce flexibility to accommodate unique service requirements. Further methods for abstracting the
vast volumes of information and presenting alternative dashboard displays can be considered. How the
dashboard contributes toward knowledge management in the organisation has not been formally as-
sessed by this study. We also suggest that less formal but robust validation procedures should be devel-
oped to assess the validity of the dashboard within an organisational environment that does not disrupt
normal business practices. Such breakthroughs can bring DS design benefits into the mainstream of
organisational practice. It follows that practical formal design processes applied within organisational
practices will increase innovation, improve quality and drive down cost that will ultimately deliver ben-
efits to consumers.
The artefact was practical, delivered a new design, and proved to be accepted and used within the or-
ganisation. The design additionally met criteria of completeness, consistency, accuracy, performance,
reliability, usability and fit (Hevner et al. 2004). The design of the artefact delivered contributions in
terms of prescriptive and descriptive knowledge (Gregor et al. 2013), was grounded in theory and de-
livered new knowledge, since no similar NPSD risk dashboards were produced by the literature. Fol-
lowing a formal DS approach for an organisational design was time and resource intensive but the ben-
efits made the effort worthwhile. DS provided useful design perspectives in terms of delivering research-
inspired change interventions. The NPSD practitioners were much more risk and best practice aware
and adopted a risk-based decision making style during stage/gate meetings. DS can rightfully be credited
as a design intervention that can solves problems in novel ways and, as this study has shown, can be
effectively applied within a practical organisational context.

Joubert and Van Belle /Innovation and Risk Dashboard
Tenth Mediterranean Conference on Information Systems (MCIS), Paphos, Cyprus, September 2016
13
References
Arvola, M. and H. Artman. (2007). “Enactments in Interaction Design: How Designers Make Sketches
Behave.” Journal of Visual Design. 1(2), 106–119.
Barczak, G. and K.B. Kahn (2012). “Identifying new product development best practice.” Business
Horizons 55(3), 293-305.
Bresciani, S. and M. Eppler (2008). “The risk of visualisation: a classification of disadvantages associ-
ated with graphic representations of information.” (ICA working paper 1/2008).
Cooper, R.G. (1999). “From experience: the invisible success factors in product innovation.” Journal
of Product Innovation 16(2), 115-133.
Cooper, R. (2001). Winning at new products: Accelerating the process from idea to launch. Massachu-
setts: Perseus.
Cooper, L.P. (2003). “A research agenda to reduce risk in new product development through knowledge
management: a practitioner perspective.” Journal of Engineering Technology Management 20(1/2),
117-140.
Cross, N. (2001). “Designerly ways of knowing: Design discipline versus design science.” Design Issues
17(3), 49-55.
Davis, R.D. (2002). “Calculated risk: a framework for evaluating service development.” MIT Sloan
Management Review 43(3), 71-77.
Eppler, M. and M. Aeschimann (2009). “A systematic framework for risk visualisation in risk manage-
ment and communication.” Risk Management 11(2), 67-89.
Few, S.C. (2013). Information dashboard design: Displaying data for at-a-glance monitoring. 2nd ed.
Burlingame, Calif.: Analytics Press.
Gannholm, L. (2013). A Comparative Evaluation between Two Design Solutions for an Information
Dashboard. URL: http://www.diva-portal.org/smash/rec-
ord.jsf?pid=diva2%3A669041&dswid=9930 (visited 2/5/2016).
Hahn, D., Shangraw, R., and K. Mark (2007). “Does visualization affect perceptions of ethically com-
plex policy decisions: An experimental study.” 40th Hawaii International Conference on System
Sciences, Hawaii.
Hevner, A., March, S., Park, J., and S. Ram (2004). “Design science in information systems research.”
MIS Quarterly 28(1), 75-105.
Horwitz, R. (2004). “Hedge fund risk fundamentals: solving the risk management and transparency
challenge.” Princeton, N.J.: Bloomberg Press.
Järvinen, P. (2007). “Action research is similar to design science.” Quality & Quantity 41(1), 37-54.
Kaplan, R.S. & D.P. Norton (1992). “The balanced scorecard: measures that drive performance.” Har-
vard Business Review 70(1), 71-79.
Kessler, E.H. and A.K. Chakrabarti (1999). “Speeding up the pace of new service development.” Jour-
nal of Service Innovation Management 16(3), 231-247.
Kontio, J., Jokinen, J.P. and E. Rosendahl (2004). “Visualising and formalizing risk information: an
experiment.” (Proceedings of the 10th International Symposium in Software Metrics, 11-17 Septem-
ber. Chicago).
Leithead, B.S. (2000). “Risk watch: product development risks.” Internal Auditor 59-61.
Markus, M. L., Majchrzak, A., and L. Gasser (2002). “A design theory for systems that support emergent
knowledge processes.” MIS Quarterly 179-212.
Marx, F., Mayer, J. H., and R. Winter (2011). “Six principles for redesigning executive information
systems-findings of a survey and evaluation of a prototype.” ACM Transactions on Management
Information Systems (TMIS) 2(4), 26.
Meskendahl, S. (2010). “The influence of business strategy on project portfolio management and its
success: a conceptual framework.” International Journal of Project Management 28(8), 807-817.

Joubert and Van Belle /Innovation and Risk Dashboard
Tenth Mediterranean Conference on Information Systems (MCIS), Paphos, Cyprus, September 2016
14
Nambisan, S. (2003). “Information systems as a reference discipline for new product development.”
MIS Quarterly 27(1), 1-18.
Olsen, E.M., Walker, O.C. and R.W. Ruekert (1995). “Organizing for effective new product develop-
ment: the moderating role of product innovativeness.” Journal of Marketing 59, 48-62.
Olechowski, A., Oehmen, J., Seering, W. and M. Ben-Daya (2012). “Characteristics of successful risk
management in product design.” (Proceedings of the 12th International Design Conference – DE-
SIGN 2012: 269-278 Dubrovnik, Croatia. May.)
Park, S. and J. Kim (2011). “A risk management system framework for new product development
(NPD).” (International Conference on Economics and Finance Research Singapore: IACSIT Press.
IPEDR, 4, 51-56.).
Pauwels, K., Silva-Risso, J., Srinivasan, S., and D. Hanssens (2004). “New products, sales promotions,
and firm value: The case of the automobile industry.” Journal of Marketing, 68(4) 142-156.
Peffers, K., Tuunamen, T., Gengler, C.E., Rossi, M., Hui, W., Virtanen, V. and J. Bragge (2006). “The
design science research process: a model for producing and presenting information systems re-
search.” In: Proceedings of the First International Conference on Design Science Research in In-
formation Systems and Technology (DESRIST). February 24-25, Claremont, Calif. p. 83-106.
Sein, M., Henfridsson, O., Purao, S., Rossi, M. and R. Lindgren (2011). “Action design research.” MIS
Quarterly 35(1), 37-56.
Silveira, P., Rodríguez, C., Casati, F., Daniel, F., D’Andrea, V., Worledge, C. and Z. Taheri (2010). “On
the design of compliance governance dashboards for effective compliance and audit management.”
In: Service-oriented computing. ICSOC/ServiceWave 2009 Workshops. Heidelberg: Springer. p.
208-217.
Simon, H.A. (1996). “The sciences of the artificial.” Cambridge, Mass. MIT Press.
Vinella, P. and J. Jin (2005). “A foundation for KPI and KRI.” In: Davis, E., ed. Operational risk:
practical approaches to implementation. London: Risk Books, p. 157-168.)
Williams, T. (1995). “A classified bibliography of recent research relating to project risk management.”
European Journal of Operational Research 85(1), 18-38.
Yen, H.R., Wang, W., Wei, C.P., Hsu, S.H.Y. and H.C. Chiu (2012). “Service innovation readiness:
dimensions and performance outcome.” Decision Support Systems 53(4), 813-824.
Yigitbasioglu, O. M., and O. Velcu (2012). “A review of dashboards in performance management: Im-
plications for design and research.” International Journal of Accounting Information Systems 13(1),
41-59.