Embed Size (px)
Citation preview
Risk and Capital Management Report
2Q2014
1
Table of Contents
A. Introduction ....................................................................................................................................................................3
B. Scope of Consolidation and Comparison of Balance Sheets .............................................................................................4
C. Internal Governance ........................................................................................................................................................7
1. Governance Structure of Committees .................................................................................................................................7
2. Organizational Structure .....................................................................................................................................................9
3. Policies, Standards, Procedures and Manuals .....................................................................................................................9
4. Structured Flow of Information ...........................................................................................................................................9 D. Capital management ..................................................................................................................................................... 10
1. Capital Adequacy (Regulatory view) .................................................................................................................................10 1.1 Basel III .....................................................................................................................................................................11
1.2 Available Capital (Total Capital, Tier 1 Capital and Common Equity Tier 1 Capital) .................................................11
1.3 Risk-Weighted Assets ...............................................................................................................................................12
1.3.1 Risk-Weighted Assets for Credit Risk (RWACPAD) ..................................................................................................13
1.3.2 Risk-Weighted Assets for Market Risk (RWAMPAD) ...............................................................................................14
1.3.3 Risk-weighted assets for Operational risk (RWAOPAD) ..........................................................................................15
1.3.4 Capital Adequacy Analysis (Regulatory View) ......................................................................................................15
2. Internal Capital Adequacy Assessment Process – ICAAP ...................................................................................................16 E. Risk management .......................................................................................................................................................... 17
1. Credit Risk..........................................................................................................................................................................17 1.1 Definition ..................................................................................................................................................................17
1.2 Basic Principles .........................................................................................................................................................17
1.3 Risk management structure and areas involved ......................................................................................................18
1.4 Credit Lending Structure and Areas Involved ...........................................................................................................19
1.5 Credit Risk Management ..........................................................................................................................................19
1.5.1 Total and Average Exposure in the Quarter .........................................................................................................20
1.5.2 Exposure by Country and Brazil Geographical Region .........................................................................................20
1.5.3 Exposure by Economic Sector ..............................................................................................................................21
1.5.4 Credit Concentration ............................................................................................................................................22
1.5.5 Unelapsed period of operations ..........................................................................................................................22
1.5.6 Operations overdue .............................................................................................................................................23
1.5.7 Allowance for loan losses .....................................................................................................................................23
1.6 Credit Risk Mitigation ...............................................................................................................................................24
1.7 Counterparty Credit Risk ..........................................................................................................................................25
1.7.1 Counterparty Credit Risk Management ...............................................................................................................26
1.7.2 Credit Derivatives .................................................................................................................................................27
1.8 Acquisition, sale and transfer of financial assets .....................................................................................................27
1.8.1 Exposures granted ...............................................................................................................................................27
1.8.2 Exposures Acquired ..............................................................................................................................................28
1.9 Securitization ............................................................................................................................................................29
2. Market Risk .......................................................................................................................................................................30 2.1 Definitions ................................................................................................................................................................30
2.2 Basic Principles .........................................................................................................................................................30
2.3 Areas Involved ..........................................................................................................................................................30
2.4 Market Risk Management ........................................................................................................................................31
2.4.1 Segregation of Portfolios .....................................................................................................................................31
2.4.2 Risk Measures and Limits for Management and Control .....................................................................................31
2
2.4.3 Risk Measurement Methodology .........................................................................................................................32
2.4.3.1 Trading portfolio .........................................................................................................................................32
2.4.3.2 Banking portfolio .........................................................................................................................................32
2.4.4 Measurement Systems and Communication Process ..........................................................................................33
2.4.5 Reporting Limits Exceeded or Noncompliant Transactions .................................................................................33
2.4.6 Financial Derivative portfolio Profile ...................................................................................................................34
2.4.7 Sensitivity Analyses ..............................................................................................................................................35
3. Liquidity Risk .....................................................................................................................................................................37 3.1 Definition ..................................................................................................................................................................37
3.2 Basic Principles .........................................................................................................................................................37
3.3 Management and control governance and commissions ........................................................................................37
3.4 Areas Involved ..........................................................................................................................................................38
3.5 Liquidity Risk Management ......................................................................................................................................38
3.5.1 Risk Measures and Limits for Management and Control .....................................................................................38
3.5.2 Measurement Systems and Communication Process ..........................................................................................39
3.5.3 Notifying Limits Exceeded and Contingency Plan ................................................................................................39
4. Operational Risk ................................................................................................................................................................40 4.1 Definition ..................................................................................................................................................................40
4.2 Basic Principles .........................................................................................................................................................40
4.3 Areas Involved ..........................................................................................................................................................40
4.4 Measurement System and Communication Process ................................................................................................41
4.5 Operating Losses by Category of risk .......................................................................................................................41
4.6 Business Continuity Management ............................................................................................................................42
5. Equity Risk .........................................................................................................................................................................43
6. Other risks .........................................................................................................................................................................44 6.1 Reputation risk .........................................................................................................................................................44
6.2 Strategy risk ..............................................................................................................................................................44
6.3 Environmental and Social Risk ..................................................................................................................................44
6.4 Underwriting risk ......................................................................................................................................................44
6.5 Model Risk ................................................................................................................................................................44
6.6 Risks Appetite ...........................................................................................................................................................45
F. Attachments .................................................................................................................................................................. 45
1. Composition of Total Capital (TC) - Appendix 1 .................................................................................................................45
2. Main Characteristics of the Capital Instruments – Appendix 2 .........................................................................................48 G. Glossary ......................................................................................................................................................................... 49
3
A. Introduction
This document presents information referring to risk management, to the determination of the sum of risk-weighted assets (RWA) and to the adequacy of the capital of the Votorantim Consolidated Financial Entity (referred to as “Bank”, for the purposes of this report), in accordance with the demands of the Brazilian Central Bank (“BACEN”), through Circular No. 3,678, of October 31, 2013, and in accordance with Pillar 3 rules of the Basel II Accord.
In accordance with CMN Resolutions 3,380, 3,464, 3,721, 4,090 and 3,988, the Bank has institutional structures and policies for the management of operational risk, market risk, credit risk, liquidity risk and capital management approved by the Board of Directors and the basic principles observed in the management and control were established in compliance with the current regulations and market practices, as detailed in the specific chapters on each one of these topics to be presented in this report.
The Bank also declares that it has a formal policy for disclosure of information about risk and capital management approved by the Board of Directors, as provided for in Art 12 of CMN Resolution No. 4,193.
In addition, according to BACEN Circular No. 3,678, the information contained in this report is responsibility of the Director appointed under the terms of art 14 of Resolution No. 4,193.
Banco Votorantim has a portfolio of products and services, classified internally in Wholesale and Consumer Finance. The Wholesale segment is geared towards companies with annual revenues above R$ 200 million, and seeks a position as an important partner of clients through an efficiency, long-term relationship, focusing on integrated financial solutions offering structured products. In Consumer Finance, the Bank is one of the market leaders in consumer finance, focusing on the auto business and positions in other supplementary business lines such as credit cards, insurance brokerage and payroll loans. The following is a summary of the main capital adequacy indicators in the Regulatory View for base date June 2014.
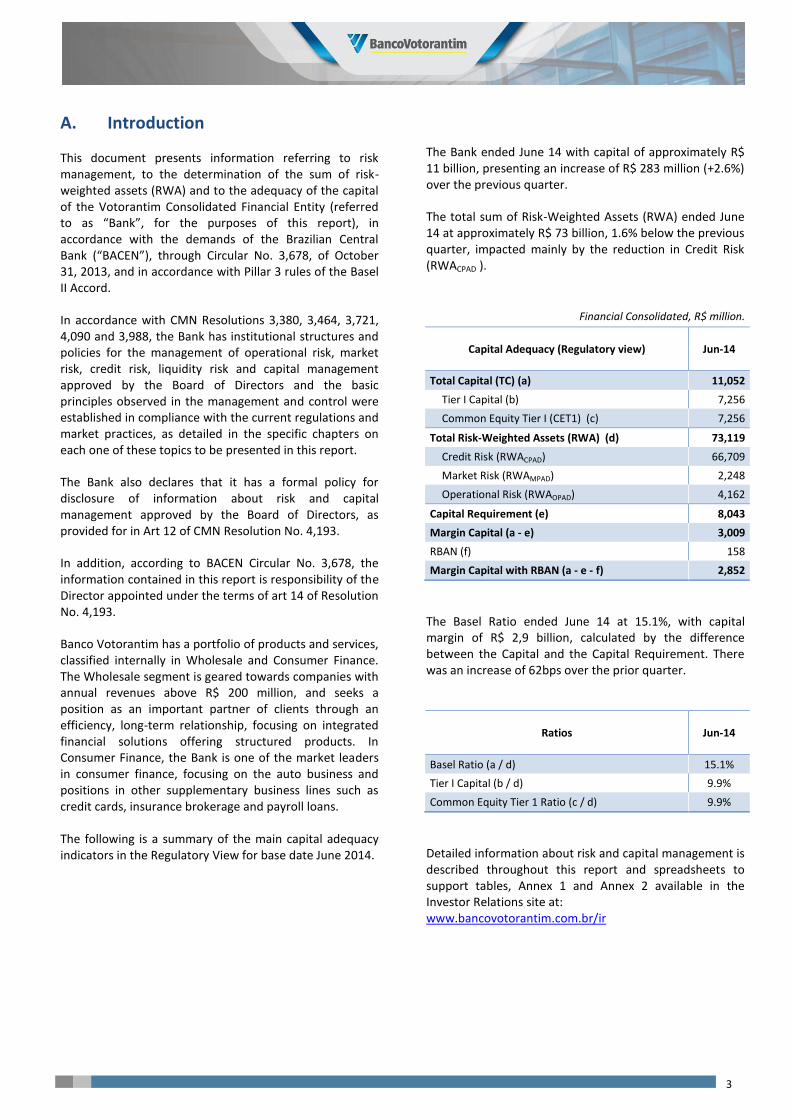
The Bank ended June 14 with capital of approximately R$ 11 billion, presenting an increase of R$ 283 million (+2.6%) over the previous quarter.
The total sum of Risk-Weighted Assets (RWA) ended June 14 at approximately R$ 73 billion, 1.6% below the previous quarter, impacted mainly by the reduction in Credit Risk (RWACPAD ).
Financial Consolidated, R$ million.
Capital Adequacy (Regulatory view) Jun-14
Total Capital (TC) (a) 11,052
Tier I Capital (b) 7,256
Common Equity Tier I (CET1) (c) 7,256
Total Risk-Weighted Assets (RWA) (d) 73,119
Credit Risk (RWACPAD) 66,709
Market Risk (RWAMPAD) 2,248
Operational Risk (RWAOPAD) 4,162
Capital Requirement (e) 8,043
Margin Capital (a - e) 3,009
RBAN (f) 158
Margin Capital with RBAN (a - e - f) 2,852
The Basel Ratio ended June 14 at 15.1%, with capital margin of R$ 2,9 billion, calculated by the difference between the Capital and the Capital Requirement. There was an increase of 62bps over the prior quarter.
Ratios Jun-14
Basel Ratio (a / d) 15.1%
Tier I Capital (b / d) 9.9%
Common Equity Tier 1 Ratio (c / d) 9.9%
Detailed information about risk and capital management is described throughout this report and spreadsheets to support tables, Annex 1 and Annex 2 available in the Investor Relations site at: www.bancovotorantim.com.br/ir
4
B. Scope of Consolidation and Comparison of Balance Sheets
Risk and capital management is performed for the consolidated financial entity according to recommendations published by the Brazilian Central Bank (BACEN). In this context, the table below lists the companies from the Consolidated Financial Entity (according to the regulation defined by BACEN), which is used to calculate the Basel Ratio and the Consolidated Publication List (disclosed by the Financial Statements), indicating the sector of activity, total assets and shareholders’ equity of each of the companies individually for the base date June 2014.
Financial Consolidated, R$ million.
Company Business Segment Total Assets Shareholders'
Equity Balance Sheet
Regulatory Balance Sheet
Banco Votorantim S/A. Multiple Bank. 100,324 7,587
BV Financeira S.A. – Crédito, Financiamento e Investimento.
Credit society, financing and investment.
50,796 1,394
BV Leasing – Arrendamento Mercantil S/A.
Leasing company 30,156 986
Votorantim – Corretora de Títulos e Valores Mobiliários LTDA.
Securities Brokerage. 398 277
Votorantim Asset Management Distribuidora de Títulos e Valores Mobiliários LTDA.
Distributor Company Securities 149 85
Votorantim Bank Limited. Foreign Financial Institution. 71 41
Banco Votorantim Securities Inc. Foreign Financial Institution. 12 10
Votorantim Securities (UK) Limited. Foreign Financial Institution. 15 15
We present below a comparison between the Published Balance Sheet and the Regulatory Balance Sheet, whose main objective is to highlight the equity elements that constitute the determination of Capital, according to rules established by CMN Resolution No. 4,192. Chapter F discloses the breakdown of capital through a standardized model made available by BACEN Circular No. 3,678.
5
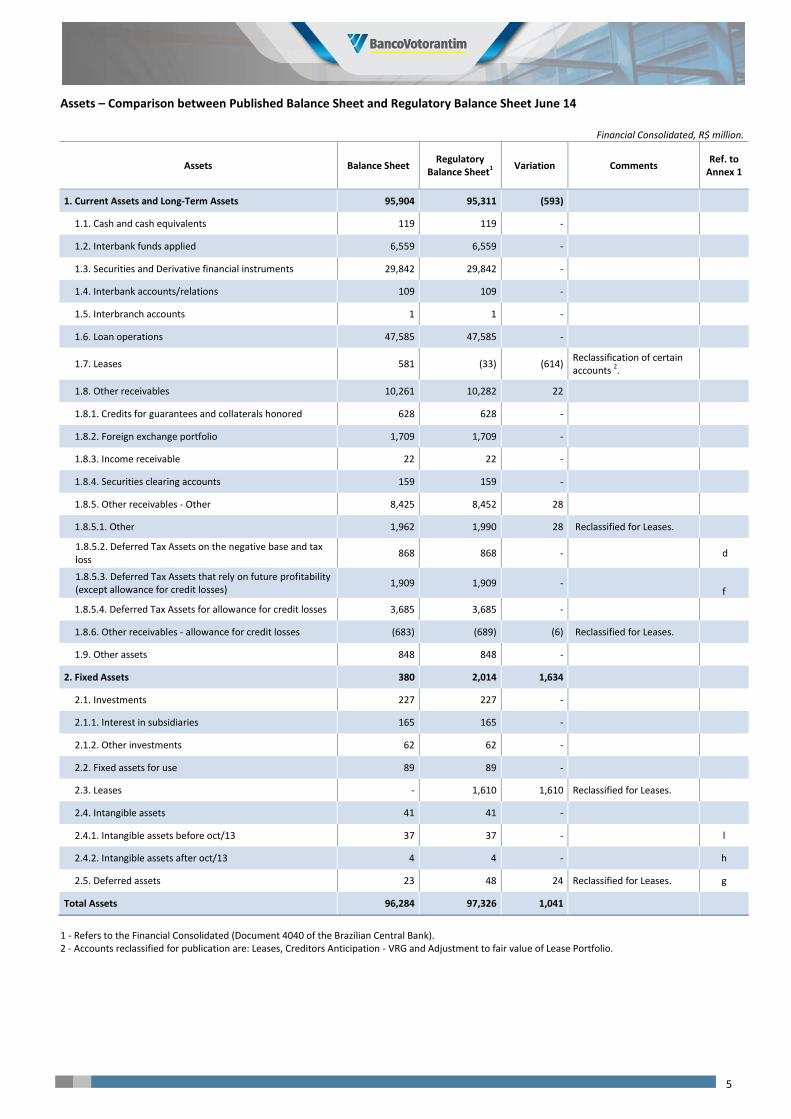
Assets – Comparison between Published Balance Sheet and Regulatory Balance Sheet June 14
Financial Consolidated, R$ million.
Assets Balance Sheet Regulatory
Balance Sheet1 Variation Comments
Ref. to Annex 1
1. Current Assets and Long-Term Assets 95,904 95,311 (593)
1.1. Cash and cash equivalents 119 119 -
1.2. Interbank funds applied 6,559 6,559 -
1.3. Securities and Derivative financial instruments 29,842 29,842 -
1.4. Interbank accounts/relations 109 109 -
1.5. Interbranch accounts 1 1 -
1.6. Loan operations 47,585 47,585 -
1.7. Leases 581 (33) (614) Reclassification of certain accounts 2.
1.8. Other receivables 10,261 10,282 22
1.8.1. Credits for guarantees and collaterals honored 628 628 -
1.8.2. Foreign exchange portfolio 1,709 1,709 -
1.8.3. Income receivable 22 22 -
1.8.4. Securities clearing accounts 159 159 -
1.8.5. Other receivables - Other 8,425 8,452 28
1.8.5.1. Other 1,962 1,990 28 Reclassified for Leases.
1.8.5.2. Deferred Tax Assets on the negative base and tax loss
868 868 - d
1.8.5.3. Deferred Tax Assets that rely on future profitability (except allowance for credit losses)
1,909 1,909 - f
1.8.5.4. Deferred Tax Assets for allowance for credit losses 3,685 3,685 -
1.8.6. Other receivables - allowance for credit losses (683) (689) (6) Reclassified for Leases.
1.9. Other assets 848 848 -
2. Fixed Assets 380 2,014 1,634
2.1. Investments 227 227 -
2.1.1. Interest in subsidiaries 165 165 -
2.1.2. Other investments 62 62 -
2.2. Fixed assets for use 89 89 -
2.3. Leases - 1,610 1,610 Reclassified for Leases.
2.4. Intangible assets 41 41 -
2.4.1. Intangible assets before oct/13 37 37 - l
2.4.2. Intangible assets after oct/13 4 4 - h
2.5. Deferred assets 23 48 24 Reclassified for Leases. g
Total Assets 96,284 97,326 1,041
1 - Refers to the Financial Consolidated (Document 4040 of the Brazilian Central Bank). 2 - Accounts reclassified for publication are: Leases, Creditors Anticipation - VRG and Adjustment to fair value of Lease Portfolio.
6
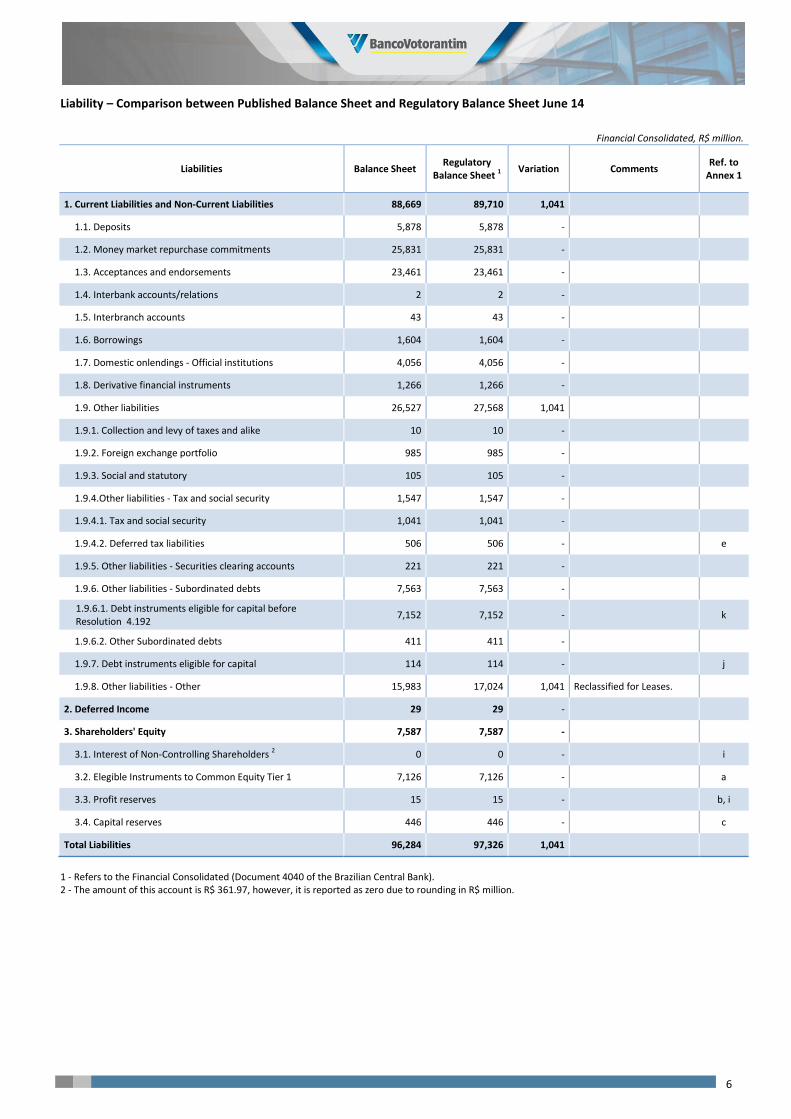
Liability – Comparison between Published Balance Sheet and Regulatory Balance Sheet June 14
Financial Consolidated, R$ million.
Liabilities Balance Sheet Regulatory
Balance Sheet 1 Variation Comments
Ref. to Annex 1
1. Current Liabilities and Non-Current Liabilities 88,669 89,710 1,041
1.1. Deposits 5,878 5,878 -
1.2. Money market repurchase commitments 25,831 25,831 -
1.3. Acceptances and endorsements 23,461 23,461 -
1.4. Interbank accounts/relations 2 2 -
1.5. Interbranch accounts 43 43 -
1.6. Borrowings 1,604 1,604 -
1.7. Domestic onlendings - Official institutions 4,056 4,056 -
1.8. Derivative financial instruments 1,266 1,266 -
1.9. Other liabilities 26,527 27,568 1,041
1.9.1. Collection and levy of taxes and alike 10 10 -
1.9.2. Foreign exchange portfolio 985 985 -
1.9.3. Social and statutory 105 105 -
1.9.4.Other liabilities - Tax and social security 1,547 1,547 -
1.9.4.1. Tax and social security 1,041 1,041 -
1.9.4.2. Deferred tax liabilities 506 506 - e
1.9.5. Other liabilities - Securities clearing accounts 221 221 -
1.9.6. Other liabilities - Subordinated debts 7,563 7,563 -
1.9.6.1. Debt instruments eligible for capital before Resolution 4.192
7,152 7,152 - k
1.9.6.2. Other Subordinated debts 411 411 -
1.9.7. Debt instruments eligible for capital 114 114 - j
1.9.8. Other liabilities - Other 15,983 17,024 1,041 Reclassified for Leases.
2. Deferred Income 29 29 -
3. Shareholders' Equity 7,587 7,587 -
3.1. Interest of Non-Controlling Shareholders 2 0 0 - i
3.2. Elegible Instruments to Common Equity Tier 1 7,126 7,126 - a
3.3. Profit reserves 15 15 - b, i
3.4. Capital reserves 446 446 - c
Total Liabilities 96,284 97,326 1,041
1 - Refers to the Financial Consolidated (Document 4040 of the Brazilian Central Bank). 2 - The amount of this account is R$ 361.97, however, it is reported as zero due to rounding in R$ million.
7
C. Internal Governance
The Bank’s governance structure is composed of collegial forums, formally organized and with delegation of levels of authority. Each governance body has its role, scope and composition defined in a dedicated norm, which specifies the management and the risk monitoring and tracking responsibilities.
1. Governance Structure of Committees
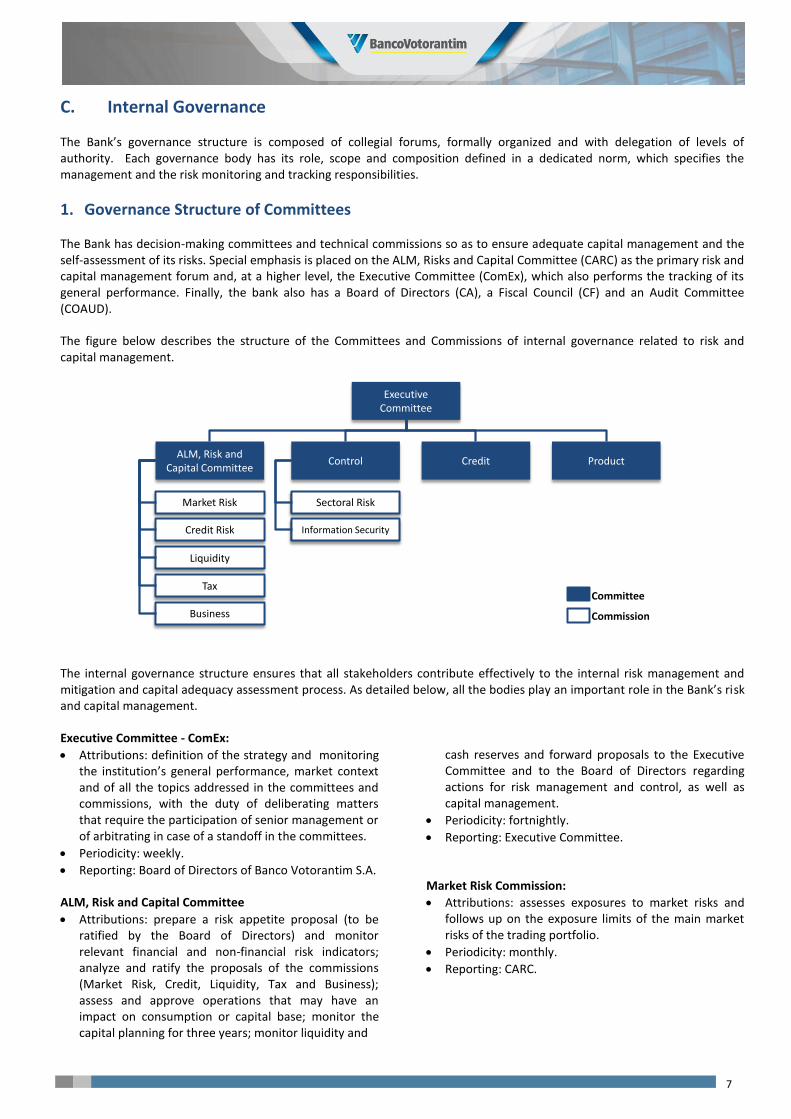
The Bank has decision-making committees and technical commissions so as to ensure adequate capital management and the self-assessment of its risks. Special emphasis is placed on the ALM, Risks and Capital Committee (CARC) as the primary risk and capital management forum and, at a higher level, the Executive Committee (ComEx), which also performs the tracking of its general performance. Finally, the bank also has a Board of Directors (CA), a Fiscal Council (CF) and an Audit Committee (COAUD).
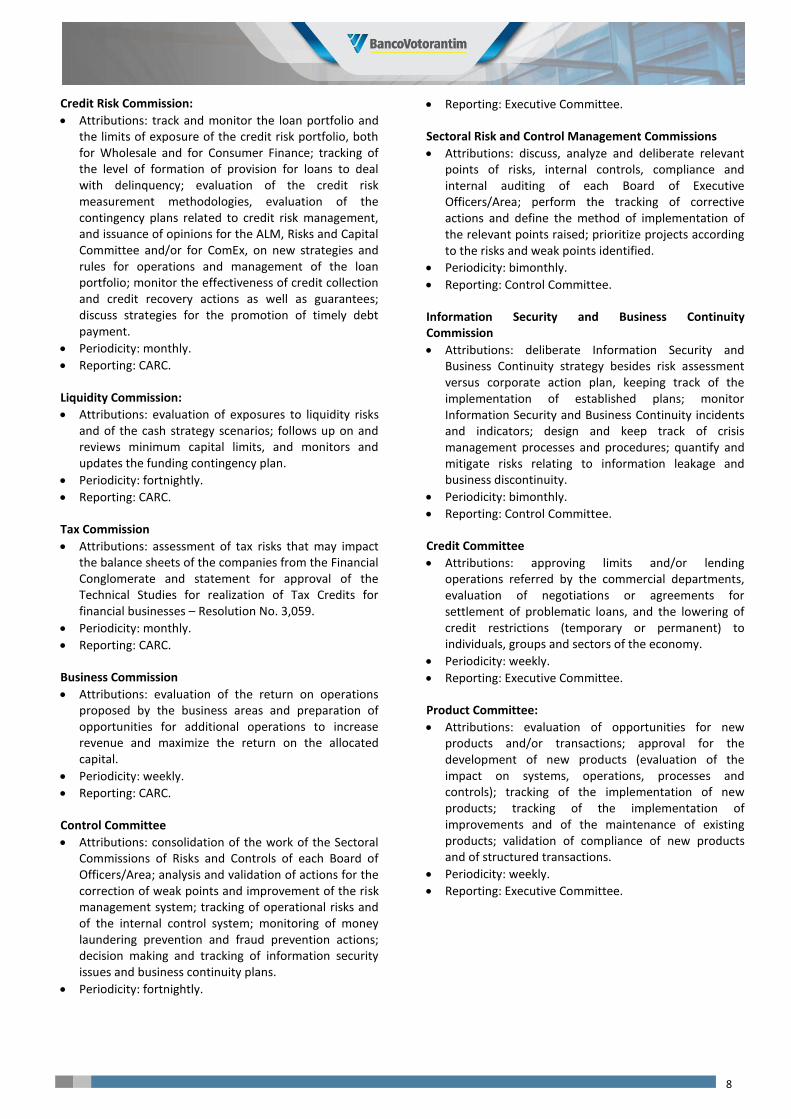
The figure below describes the structure of the Committees and Commissions of internal governance related to risk and capital management.
The internal governance structure ensures that all stakeholders contribute effectively to the internal risk management and mitigation and capital adequacy assessment process. As detailed below, all the bodies play an important role in the Bank’s risk and capital management.
Executive Committee - ComEx:
Attributions: definition of the strategy and monitoring the institution’s general performance, market context and of all the topics addressed in the committees and commissions, with the duty of deliberating matters that require the participation of senior management or of arbitrating in case of a standoff in the committees.
Periodicity: weekly.
Reporting: Board of Directors of Banco Votorantim S.A.
ALM, Risk and Capital Committee
Attributions: prepare a risk appetite proposal (to be ratified by the Board of Directors) and monitor relevant financial and non-financial risk indicators; analyze and ratify the proposals of the commissions (Market Risk, Credit, Liquidity, Tax and Business); assess and approve operations that may have an impact on consumption or capital base; monitor the capital planning for three years; monitor liquidity and
cash reserves and forward proposals to the Executive Committee and to the Board of Directors regarding actions for risk management and control, as well as capital management.
Periodicity: fortnightly.
Reporting: Executive Committee.
Market Risk Commission:
Attributions: assesses exposures to market risks and follows up on the exposure limits of the main market risks of the trading portfolio.
Periodicity: monthly.
Reporting: CARC.
Credit
Executive Committee
Control ProductALM, Risk and
Capital Committee
Sectoral Risk
Credit Risk
Liquidity
Tax
Market Risk
Committee
Commission
Information Security
Business
8
Credit Risk Commission:
Attributions: track and monitor the loan portfolio and the limits of exposure of the credit risk portfolio, both for Wholesale and for Consumer Finance; tracking of the level of formation of provision for loans to deal with delinquency; evaluation of the credit risk measurement methodologies, evaluation of the contingency plans related to credit risk management, and issuance of opinions for the ALM, Risks and Capital Committee and/or for ComEx, on new strategies and rules for operations and management of the loan portfolio; monitor the effectiveness of credit collection and credit recovery actions as well as guarantees; discuss strategies for the promotion of timely debt payment.
Periodicity: monthly.
Reporting: CARC.
Liquidity Commission:
Attributions: evaluation of exposures to liquidity risks and of the cash strategy scenarios; follows up on and reviews minimum capital limits, and monitors and updates the funding contingency plan.
Periodicity: fortnightly.
Reporting: CARC.
Tax Commission
Attributions: assessment of tax risks that may impact the balance sheets of the companies from the Financial Conglomerate and statement for approval of the Technical Studies for realization of Tax Credits for financial businesses – Resolution No. 3,059.
Periodicity: monthly.
Reporting: CARC.
Business Commission
Attributions: evaluation of the return on operations proposed by the business areas and preparation of opportunities for additional operations to increase revenue and maximize the return on the allocated capital.
Periodicity: weekly.
Reporting: CARC.
Control Committee
Attributions: consolidation of the work of the Sectoral Commissions of Risks and Controls of each Board of Officers/Area; analysis and validation of actions for the correction of weak points and improvement of the risk management system; tracking of operational risks and of the internal control system; monitoring of money laundering prevention and fraud prevention actions; decision making and tracking of information security issues and business continuity plans.
Periodicity: fortnightly.
Reporting: Executive Committee.
Sectoral Risk and Control Management Commissions
Attributions: discuss, analyze and deliberate relevant points of risks, internal controls, compliance and internal auditing of each Board of Executive Officers/Area; perform the tracking of corrective actions and define the method of implementation of the relevant points raised; prioritize projects according to the risks and weak points identified.
Periodicity: bimonthly.
Reporting: Control Committee.
Information Security and Business Continuity Commission
Attributions: deliberate Information Security and Business Continuity strategy besides risk assessment versus corporate action plan, keeping track of the implementation of established plans; monitor Information Security and Business Continuity incidents and indicators; design and keep track of crisis management processes and procedures; quantify and mitigate risks relating to information leakage and business discontinuity.
Periodicity: bimonthly.
Reporting: Control Committee.
Credit Committee
Attributions: approving limits and/or lending operations referred by the commercial departments, evaluation of negotiations or agreements for settlement of problematic loans, and the lowering of credit restrictions (temporary or permanent) to individuals, groups and sectors of the economy.
Periodicity: weekly.
Reporting: Executive Committee.
Product Committee:
Attributions: evaluation of opportunities for new products and/or transactions; approval for the development of new products (evaluation of the impact on systems, operations, processes and controls); tracking of the implementation of new products; tracking of the implementation of improvements and of the maintenance of existing products; validation of compliance of new products and of structured transactions.
Periodicity: weekly.
Reporting: Executive Committee.

9
2. Organizational Structure
For the execution of risk and capital management activities, the Bank relies on dedicated areas that are responsible for the consolidated controls of risks and capital. The main processes relating to risk and capital management are under the responsibility of the Board of Executive Officers of Risks, Executive Board of Internal Controls and Operational Risks to the Executive Board of Finance and Investor Relations.
See below the structure of these management boards:
The attributions of these specialized risk-management structures are detailed in the following chapters as part of the presentation of the Bank's approach to each type of risk management and control.
3. Policies, Standards, Procedures and Manuals
The risk and capital management process uses a set of documents which establish the main guidelines which must be followed in risk management activities.
The level of detail of these standards is structured depending on the purpose of each document and is organized according to the hierarchy shown below:
Corporate Policies: fundamental principles and guidelines established by the highest hierarchical level, which must be followed by the entire organization and govern all the other regulations, procedures and product and service manuals;
Rules: rules established to define the activities and the manner in which procedures are organized, detailing the aspects addressed by corporate policies;
Procedures: operational rules established to describe the activities and their completion stages, detailing aspects addressed by the standards; e
Product, Service, System and Calculation Modeling Manuals: set of documents that compile the main features on structuring of products, services, systems and calculation methodologies used.
These regulations are published for the internal consultation at the Corporate Portal (Intranet), and are periodically reviewed and updated (at least on an annual basis), or whenever there are significant changes in business aims and strategies, or in the risk management approach and methodology.
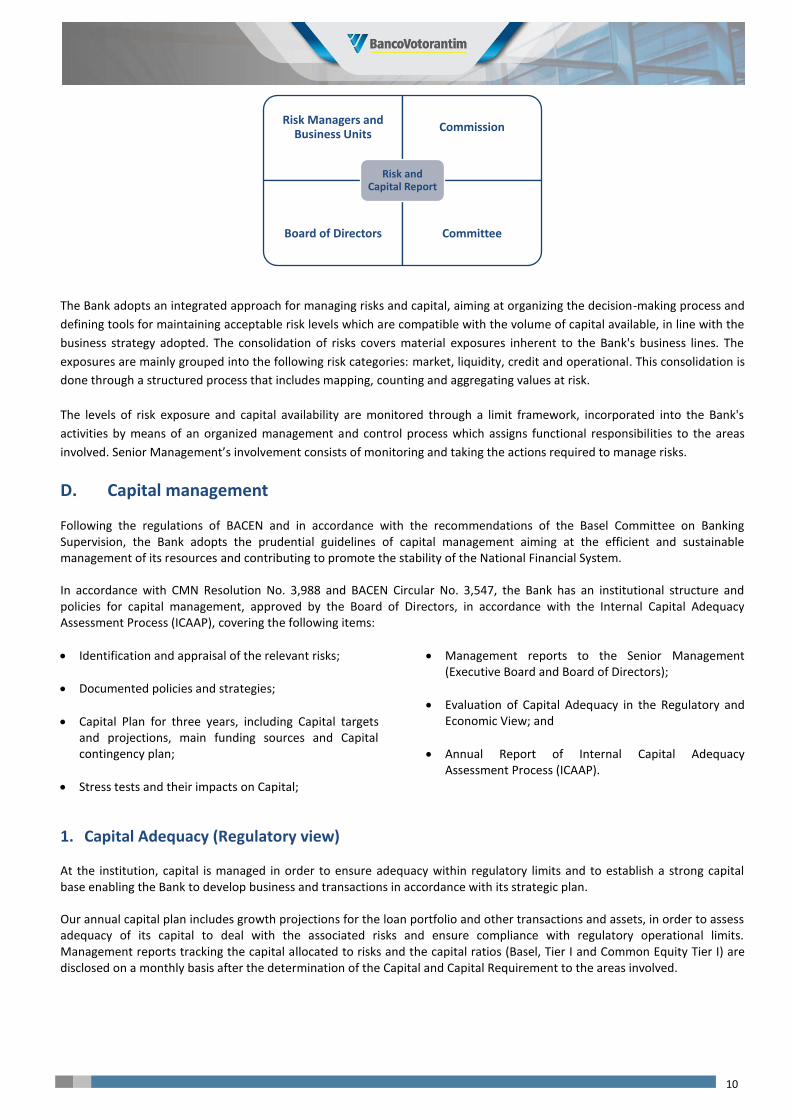
4. Structured Flow of Information
The institution adopts the practice of communicating information about risks and capital through reporting with specific periodicity to the parties involved in the process and senior management, which reinforces the timely monitoring of information that subsidizes corporate decisions.
Board of Directors
Board of Executive Officers of Risks
Executive Board of Internal Controls and
Operational Risks
Executive Board of Finance and Investor
Relations
10
The Bank adopts an integrated approach for managing risks and capital, aiming at organizing the decision-making process and
defining tools for maintaining acceptable risk levels which are compatible with the volume of capital available, in line with the
business strategy adopted. The consolidation of risks covers material exposures inherent to the Bank's business lines. The
exposures are mainly grouped into the following risk categories: market, liquidity, credit and operational. This consolidation is
done through a structured process that includes mapping, counting and aggregating values at risk.
The levels of risk exposure and capital availability are monitored through a limit framework, incorporated into the Bank's
activities by means of an organized management and control process which assigns functional responsibilities to the areas
involved. Senior Management’s involvement consists of monitoring and taking the actions required to manage risks.
D. Capital management
Following the regulations of BACEN and in accordance with the recommendations of the Basel Committee on Banking Supervision, the Bank adopts the prudential guidelines of capital management aiming at the efficient and sustainable management of its resources and contributing to promote the stability of the National Financial System.
In accordance with CMN Resolution No. 3,988 and BACEN Circular No. 3,547, the Bank has an institutional structure and policies for capital management, approved by the Board of Directors, in accordance with the Internal Capital Adequacy Assessment Process (ICAAP), covering the following items:
Identification and appraisal of the relevant risks;
Documented policies and strategies;
Capital Plan for three years, including Capital targets and projections, main funding sources and Capital contingency plan;
Stress tests and their impacts on Capital;
Management reports to the Senior Management (Executive Board and Board of Directors);
Evaluation of Capital Adequacy in the Regulatory and Economic View; and
Annual Report of Internal Capital Adequacy Assessment Process (ICAAP).
1. Capital Adequacy (Regulatory view)
At the institution, capital is managed in order to ensure adequacy within regulatory limits and to establish a strong capital base enabling the Bank to develop business and transactions in accordance with its strategic plan.
Our annual capital plan includes growth projections for the loan portfolio and other transactions and assets, in order to assess adequacy of its capital to deal with the associated risks and ensure compliance with regulatory operational limits. Management reports tracking the capital allocated to risks and the capital ratios (Basel, Tier I and Common Equity Tier I) are disclosed on a monthly basis after the determination of the Capital and Capital Requirement to the areas involved.
Risk Managers andBusiness Units
Commission
Board of Directors Committee
Risk andCapital Report
11
1.1 Basel III
The new capital requirement rules of Basel III took effect in Brazil in October 2013, and establish the new definitions and the new minimum capital requirements. They also define which companies should compose the Prudential Consolidated Balance Sheet to be used to calculate the capital base and the capital requirement.
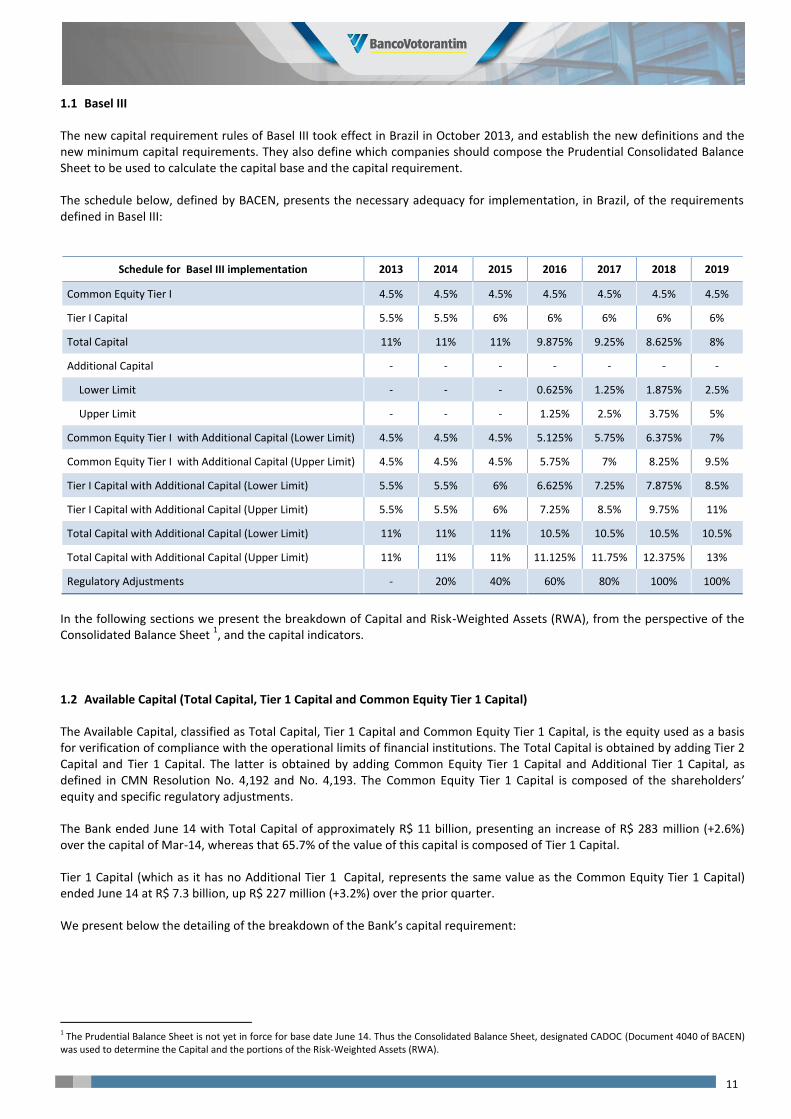
The schedule below, defined by BACEN, presents the necessary adequacy for implementation, in Brazil, of the requirements defined in Basel III:
Schedule for Basel III implementation 2013 2014 2015 2016 2017 2018 2019
Common Equity Tier I 4.5% 4.5% 4.5% 4.5% 4.5% 4.5% 4.5%
Tier I Capital 5.5% 5.5% 6% 6% 6% 6% 6%
Total Capital 11% 11% 11% 9.875% 9.25% 8.625% 8%
Additional Capital - - - - - - -
Lower Limit - - - 0.625% 1.25% 1.875% 2.5%
Upper Limit - - - 1.25% 2.5% 3.75% 5%
Common Equity Tier I with Additional Capital (Lower Limit) 4.5% 4.5% 4.5% 5.125% 5.75% 6.375% 7%
Common Equity Tier I with Additional Capital (Upper Limit) 4.5% 4.5% 4.5% 5.75% 7% 8.25% 9.5%
Tier I Capital with Additional Capital (Lower Limit) 5.5% 5.5% 6% 6.625% 7.25% 7.875% 8.5%
Tier I Capital with Additional Capital (Upper Limit) 5.5% 5.5% 6% 7.25% 8.5% 9.75% 11%
Total Capital with Additional Capital (Lower Limit) 11% 11% 11% 10.5% 10.5% 10.5% 10.5%
Total Capital with Additional Capital (Upper Limit) 11% 11% 11% 11.125% 11.75% 12.375% 13%
Regulatory Adjustments - 20% 40% 60% 80% 100% 100%
In the following sections we present the breakdown of Capital and Risk-Weighted Assets (RWA), from the perspective of the Consolidated Balance Sheet
1, and the capital indicators.
1.2 Available Capital (Total Capital, Tier 1 Capital and Common Equity Tier 1 Capital)
The Available Capital, classified as Total Capital, Tier 1 Capital and Common Equity Tier 1 Capital, is the equity used as a basis for verification of compliance with the operational limits of financial institutions. The Total Capital is obtained by adding Tier 2 Capital and Tier 1 Capital. The latter is obtained by adding Common Equity Tier 1 Capital and Additional Tier 1 Capital, as defined in CMN Resolution No. 4,192 and No. 4,193. The Common Equity Tier 1 Capital is composed of the shareholders’ equity and specific regulatory adjustments.
The Bank ended June 14 with Total Capital of approximately R$ 11 billion, presenting an increase of R$ 283 million (+2.6%) over the capital of Mar-14, whereas that 65.7% of the value of this capital is composed of Tier 1 Capital.
Tier 1 Capital (which as it has no Additional Tier 1 Capital, represents the same value as the Common Equity Tier 1 Capital) ended June 14 at R$ 7.3 billion, up R$ 227 million (+3.2%) over the prior quarter.
We present below the detailing of the breakdown of the Bank’s capital requirement:
1 The Prudential Balance Sheet is not yet in force for base date June 14. Thus the Consolidated Balance Sheet, designated CADOC (Document 4040 of BACEN) was used to determine the Capital and the portions of the Risk-Weighted Assets (RWA).
12
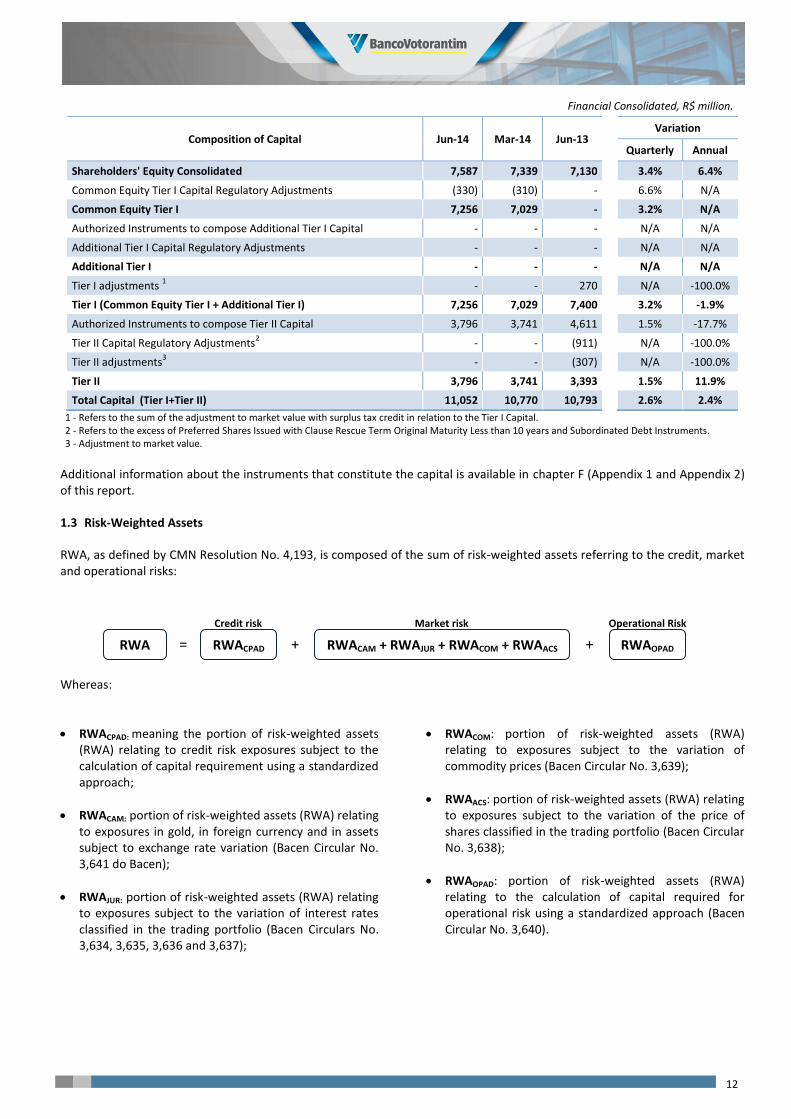
Financial Consolidated, R$ million.
Composition of Capital Jun-14 Mar-14 Jun-13
Variation
Quarterly Annual
Shareholders' Equity Consolidated 7,587 7,339 7,130
3.4% 6.4%
Common Equity Tier I Capital Regulatory Adjustments (330) (310) -
6.6% N/A
Common Equity Tier I 7,256 7,029 -
3.2% N/A
Authorized Instruments to compose Additional Tier I Capital - - -
N/A N/A
Additional Tier I Capital Regulatory Adjustments - - -
N/A N/A
Additional Tier I - - -
N/A N/A
Tier I adjustments 1 - - 270
N/A -100.0%
Tier I (Common Equity Tier I + Additional Tier I) 7,256 7,029 7,400
3.2% -1.9%
Authorized Instruments to compose Tier II Capital 3,796 3,741 4,611
1.5% -17.7%
Tier II Capital Regulatory Adjustments2 - - (911)
N/A -100.0%
Tier II adjustments3 - - (307)
N/A -100.0%
Tier II 3,796 3,741 3,393
1.5% 11.9%
Total Capital (Tier I+Tier II) 11,052 10,770 10,793
2.6% 2.4%
1 - Refers to the sum of the adjustment to market value with surplus tax credit in relation to the Tier I Capital. 2 - Refers to the excess of Preferred Shares Issued with Clause Rescue Term Original Maturity Less than 10 years and Subordinated Debt Instruments. 3 - Adjustment to market value.
Additional information about the instruments that constitute the capital is available in chapter F (Appendix 1 and Appendix 2) of this report.
1.3 Risk-Weighted Assets
RWA, as defined by CMN Resolution No. 4,193, is composed of the sum of risk-weighted assets referring to the credit, market and operational risks:
Whereas:
RWACPAD: meaning the portion of risk-weighted assets (RWA) relating to credit risk exposures subject to the calculation of capital requirement using a standardized approach;
RWACAM: portion of risk-weighted assets (RWA) relating to exposures in gold, in foreign currency and in assets subject to exchange rate variation (Bacen Circular No. 3,641 do Bacen);
RWAJUR: portion of risk-weighted assets (RWA) relating to exposures subject to the variation of interest rates classified in the trading portfolio (Bacen Circulars No. 3,634, 3,635, 3,636 and 3,637);
RWACOM: portion of risk-weighted assets (RWA) relating to exposures subject to the variation of commodity prices (Bacen Circular No. 3,639);
RWAACS: portion of risk-weighted assets (RWA) relating to exposures subject to the variation of the price of shares classified in the trading portfolio (Bacen Circular No. 3,638);
RWAOPAD: portion of risk-weighted assets (RWA) relating to the calculation of capital required for operational risk using a standardized approach (Bacen Circular No. 3,640).
Credit risk Market risk
RWACAM + RWAJUR + RWACOM + RWAACS RWACPAD RWAOPAD RWA = + +
Operational Risk
13
The Capital Requirement is obtained from the portions of Risk-Weighted Assets, and is calculated as follows:
Where Factor F is equal to:
Until 31/12/2015 01/01/2016 01/01/2017 31/12/2018 01/01/2019
11% 9,875% 9,25% 8,625% 8%
The evolution of the RWA composition is presented in consolidated form in the table below:
Financial Consolidated, R$ million.
Composition of Risk-Weighted Assets (RWA) Jun-14 Mar-14 Jun-13 Variation
Quarterly Annual
Total Risk-Weighted Assets (RWA) 73,119 74,299 77,653
-1.6% -5.8%
Credit Risk (RWACPAD) 66,709 68,624 72,654
-2.8% -8.2%
Market Risk (RWAMPAD) 2,248 1,513 2,435
48.6% -7.7%
Operational Risk (RWAOPAD) 4,162 4,162 2,565
N/A 62.3%
We present below in detail the composition of RWA by Credit, Market and Operational Risks.
1.3.1 Risk-Weighted Assets for Credit Risk (RWACPAD)
The institution uses the Standardized Approach, defined by BACEN Circular No. 3,644, to calculate the portion of risk-weighted assets (RWA) relating to credit risk exposures subject to calculation of capital requirement (RWACPAD). The amount determined for RWACPAD is reported monthly to Senior Management, together with the Basel Ratio chart.
Financial Consolidated, R$ million.
Composition of RWACPAD Jun-14 Mar-14 Jun-13 Variation
Quarterly Annual
Credit Risk (RWACPAD) 66,709 68,624 72,654
-2.8% -8.2%
Risk Weight of 2% 67 21 -
211.6% N/A
Risk Weight of 20% 170 122 344
39.7% -50.5%
Risk Weight of 50% 2,935 3,205 3,170
-8.4% -7.4%
Risk Weight of 75% 25,766 25,908 34,846
-0.5% -26.1%
Risk Weight of 85% 7,902 7,784 -
1.5% N/A
Risk Weight of 100% 26,284 28,340 31,937
-7.3% -17.7%
Risk Weight of 150% 151 177 261
-14.8% -42.2%
Risk Weight of 250% 1,856 1,794 -
3.5% N/A
Risk Weight of 300% 2,605 2,504 2,133
4.0% 22.1%
Risk Weight of 1250% 300 189 - 58.8% N/A
Risk Weight of -100%1 (423) (548) (37)
-22.8% 1032.5%
Risk Weight of -300%1 (1,240) (1,376) -
-9.9% N/A
Without Risk weight 336 504 - -33.4% N/A
1 – Refers to the RWA of the assets deducted from the determination of Common Equity Tier 1 Capital, according to the current resolution.
Capital Requirements = Factor F x RWA
14
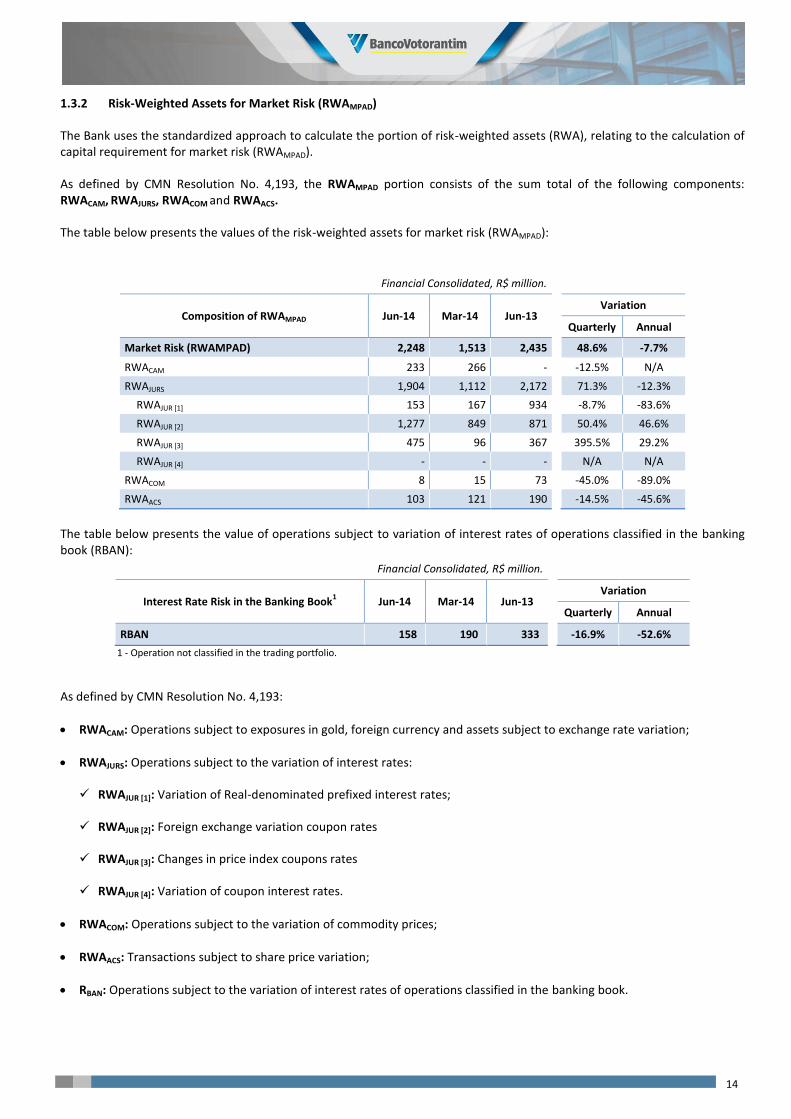
1.3.2 Risk-Weighted Assets for Market Risk (RWAMPAD)
The Bank uses the standardized approach to calculate the portion of risk-weighted assets (RWA), relating to the calculation of capital requirement for market risk (RWAMPAD).
As defined by CMN Resolution No. 4,193, the RWAMPAD portion consists of the sum total of the following components: RWACAM, RWAJURS, RWACOM and RWAACS.
The table below presents the values of the risk-weighted assets for market risk (RWAMPAD):
Financial Consolidated, R$ million.
Composition of RWAMPAD Jun-14 Mar-14 Jun-13 Variation
Quarterly Annual
Market Risk (RWAMPAD) 2,248 1,513 2,435
48.6% -7.7%
RWACAM 233 266 -
-12.5% N/A
RWAJURS 1,904 1,112 2,172
71.3% -12.3%
RWAJUR [1] 153 167 934
-8.7% -83.6%
RWAJUR [2] 1,277 849 871
50.4% 46.6%
RWAJUR [3] 475 96 367
395.5% 29.2%
RWAJUR [4] - - -
N/A N/A
RWACOM 8 15 73
-45.0% -89.0%
RWAACS 103 121 190
-14.5% -45.6%
The table below presents the value of operations subject to variation of interest rates of operations classified in the banking book (RBAN):
Financial Consolidated, R$ million.
Interest Rate Risk in the Banking Book1 Jun-14 Mar-14 Jun-13
Variation
Quarterly Annual
RBAN 158 190 333
-16.9% -52.6%
1 - Operation not classified in the trading portfolio.
As defined by CMN Resolution No. 4,193:
RWACAM: Operations subject to exposures in gold, foreign currency and assets subject to exchange rate variation;
RWAJURS: Operations subject to the variation of interest rates:
RWAJUR [1]: Variation of Real-denominated prefixed interest rates;
RWAJUR [2]: Foreign exchange variation coupon rates
RWAJUR [3]: Changes in price index coupons rates
RWAJUR [4]: Variation of coupon interest rates.
RWACOM: Operations subject to the variation of commodity prices;
RWAACS: Transactions subject to share price variation;
RBAN: Operations subject to the variation of interest rates of operations classified in the banking book.
15
1.3.3 Risk-weighted assets for Operational risk (RWAOPAD)
The Bank uses the Alternative Standardized Approach (ASA) defined by BACEN Circular No. 3,640 to calculate the portion of risk-weighted assets (RWA), relating to the calculation of capital requirement for operational risk (RWAOPAD).
The table below presents the opening of the risk-weighted assets for operational risk:
Financial Consolidated, R$ million.
Composition of RWAOPAD Jun-14 Mar-14 Jun-13 Variation
Quarterly Annual
Operational Risk (RWAOPAD)1 4,162 4,162 2,565
N/A 62.3%
1 – Portion of Operational Risk for financial entities.
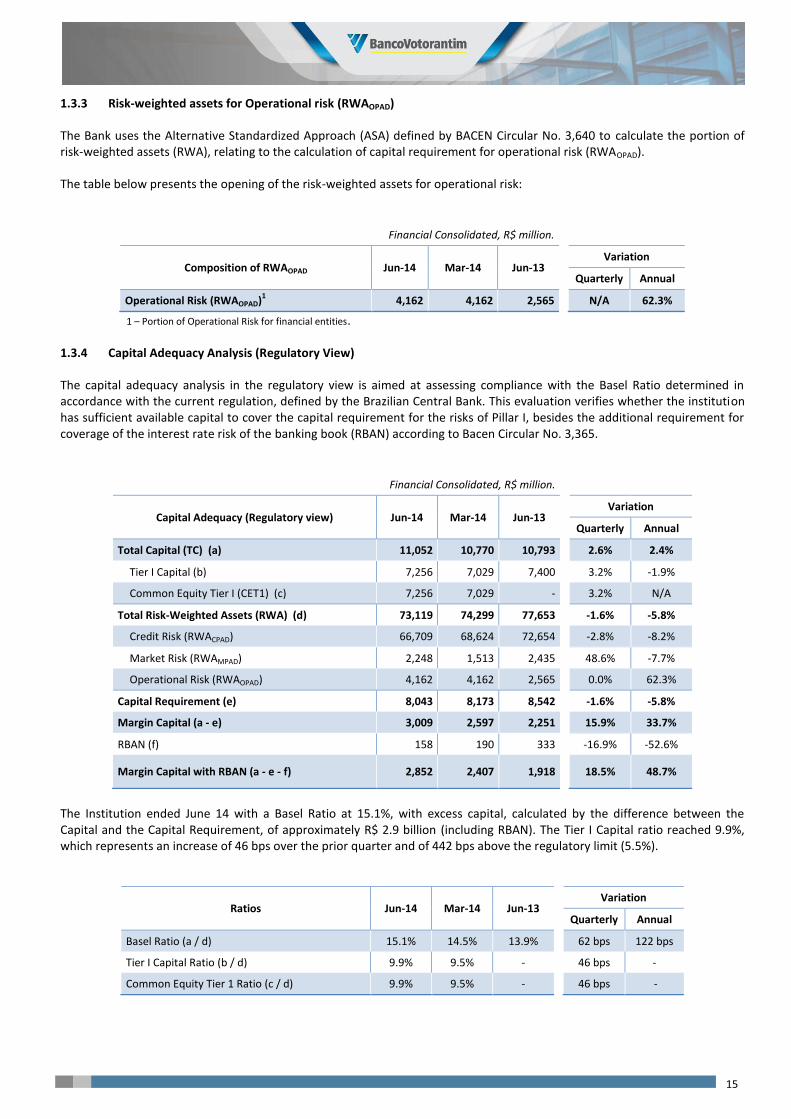
1.3.4 Capital Adequacy Analysis (Regulatory View)
The capital adequacy analysis in the regulatory view is aimed at assessing compliance with the Basel Ratio determined in accordance with the current regulation, defined by the Brazilian Central Bank. This evaluation verifies whether the institution has sufficient available capital to cover the capital requirement for the risks of Pillar I, besides the additional requirement for coverage of the interest rate risk of the banking book (RBAN) according to Bacen Circular No. 3,365.
Financial Consolidated, R$ million.
Capital Adequacy (Regulatory view) Jun-14 Mar-14 Jun-13 Variation
Quarterly Annual
Total Capital (TC) (a) 11,052 10,770 10,793
2.6% 2.4%
Tier I Capital (b) 7,256 7,029 7,400
3.2% -1.9%
Common Equity Tier I (CET1) (c) 7,256 7,029 -
3.2% N/A
Total Risk-Weighted Assets (RWA) (d) 73,119 74,299 77,653
-1.6% -5.8%
Credit Risk (RWACPAD) 66,709 68,624 72,654
-2.8% -8.2%
Market Risk (RWAMPAD) 2,248 1,513 2,435
48.6% -7.7%
Operational Risk (RWAOPAD) 4,162 4,162 2,565
0.0% 62.3%
Capital Requirement (e) 8,043 8,173 8,542
-1.6% -5.8%
Margin Capital (a - e) 3,009 2,597 2,251
15.9% 33.7%
RBAN (f) 158 190 333
-16.9% -52.6%
Margin Capital with RBAN (a - e - f) 2,852 2,407 1,918
18.5% 48.7%
The Institution ended June 14 with a Basel Ratio at 15.1%, with excess capital, calculated by the difference between the Capital and the Capital Requirement, of approximately R$ 2.9 billion (including RBAN). The Tier I Capital ratio reached 9.9%, which represents an increase of 46 bps over the prior quarter and of 442 bps above the regulatory limit (5.5%).
Ratios Jun-14 Mar-14 Jun-13 Variation
Quarterly Annual
Basel Ratio (a / d) 15.1% 14.5% 13.9%
62 bps 122 bps
Tier I Capital Ratio (b / d) 9.9% 9.5% -
46 bps -
Common Equity Tier 1 Ratio (c / d) 9.9% 9.5% -
46 bps -
16
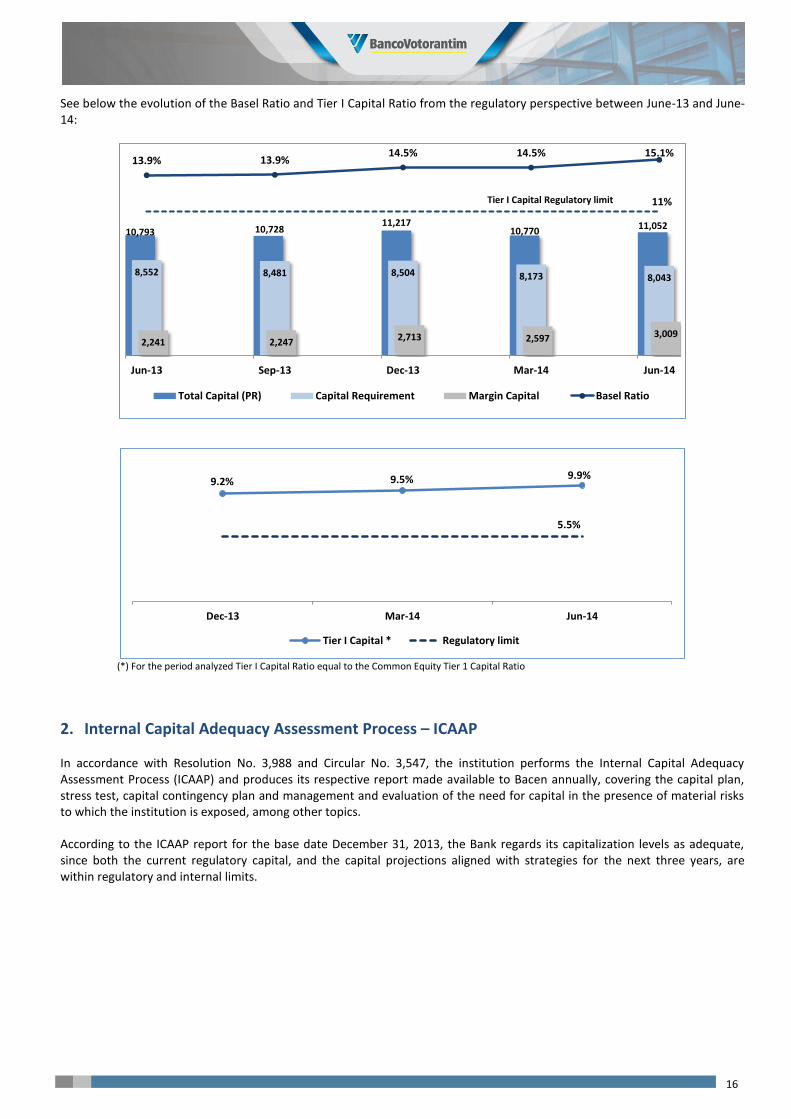
See below the evolution of the Basel Ratio and Tier I Capital Ratio from the regulatory perspective between June-13 and June-14:
(*) For the period analyzed Tier I Capital Ratio equal to the Common Equity Tier 1 Capital Ratio
2. Internal Capital Adequacy Assessment Process – ICAAP
In accordance with Resolution No. 3,988 and Circular No. 3,547, the institution performs the Internal Capital Adequacy Assessment Process (ICAAP) and produces its respective report made available to Bacen annually, covering the capital plan, stress test, capital contingency plan and management and evaluation of the need for capital in the presence of material risks to which the institution is exposed, among other topics.
According to the ICAAP report for the base date December 31, 2013, the Bank regards its capitalization levels as adequate, since both the current regulatory capital, and the capital projections aligned with strategies for the next three years, are within regulatory and internal limits.
10,793 10,72811,217
10,77011,052
8,552 8,481 8,504 8,173 8,043
2,241 2,247 2,713 2,597 3,009
13.9% 13.9%14.5% 14.5% 15.1%
11%
00%
02%
04%
06%
08%
10%
12%
14%
16%
0
2,0 00
4,0 00
6,0 00
8,0 00
10, 000
12, 000
14, 000
16, 000
18, 000
Jun-13 Sep-13 Dec-13 Mar-14 Jun-14
Total Capital (PR) Capital Requirement Margin Capital Basel Ratio
Tier I Capital Regulatory limit
9.2% 9.5% 9.9%
5.5%
Dec-13 Mar-14 Jun-14
Tier I Capital * Regulatory limit
17
E. Risk management
Risk management of the institution is performed for risks considered relevant to Senior Management (Material Risks), which are dealt with and monitored by specific processes means.
The identification of material risks is performed recurrently (at least annually or when a relevant change is identified), based on specific internal methodology and with the participation of the risk area in committees related to business management, such as the Executive Committee and Product Committee.
1. Credit Risk
The aim of credit risk management is to provide support for the Senior Management in the decision-making process by defining strategies and policies and establishing operational limits, risk mitigation tools and procedures to maintain credit risk exposure within levels deemed acceptable by the Bank’s management.
1.1 Definition
Credit Risk is defined as the likelihood of losses occurring due to the borrower or counterparty not complying with their respective financial obligations in accordance with agreed terms.
1.2 Basic Principles
In accordance with CMN Resolution No. 3,721, the Bank has an institutional structure and policies for credit risk management approved by the Board of Directors and the basic principles observed in management and control were established in compliance with current regulations and market practices, as follows:
Manuals and documents containing the organizational structure, relevant products, corporate policies, standards and procedures including flowcharts and rules related to the governance, business and credit support processes;
Technological environment encompassing the credit cycle ranging from risk admission, tracking and monitoring, to restructuring when applicable;
Validation process covering risks involved in systems, accuracy of models used for calculations and quality of processed data, as well as the coverage of the documentation;
Committee structure and powers for approving credit;
Criteria and procedures for selecting clients and preventing money laundering;
Credit analysis, lending and management standards;
Procedures for analysis, approval and release of new products involving credit risk;
Classification of portfolio risk levels, considering the clients ratings, the collateral involved, the maturity dates and operational arrears;
Classification and analysis of country risk;
Monitoring geographic, sector and conglomerate concentration, as well as monitoring internal and regulatory limits defined by policies and rules;
Managing counterparty credit risk and limits for derivatives;
Evaluating risk in transactions for sales or transfer of assets;
Formalized procedures covering credit recovery flows;
Setting limits for carrying out transactions subject to credit risk, both individually and at the aggregate level - a group of companies with common economic interest - and for borrowers or counterparties with similar characteristics;
Control of guarantees and instruments for mitigating credit risk;
Monitoring of the loan asset portfolio using indicators with the aim of minimizing the risk of losses;
Performance of stress tests, measuring the combined effect of adverse movements in macroeconomic indicators, estimating financial impacts affecting delinquency, provisions and consequently, available and required capital;
18
Periodic reporting to Senior Management addressing the performance indicators of risk management based on the policies and strategies adopted; and
Documented procedures for policy exceptions.
In addition, credit risk management activities are carried out by specific control units, strengthening their performance with independence in relation to their trading units.
1.3 Risk management structure and areas involved
Credit risk management activities include a number of strategic, tactical and operational activities permeating the entire 'business chain', from product development, setting limits, portfolio management, management information, collection and credit recovery, as well as monitoring the effectiveness of processes and controls used.
Risk management attributions are performed by formally set up units with technically qualified staff, under separate management, with clearly defined responsibilities.
Credit Risk Policies
Manages the policies and strategies for Wholesale and Retail credit risk management, and it’s responsible for identifying, measuring, controlling and mitigating credit risk exposure, by evaluating the characteristics of the borrower, operation, market, macroeconomic outlook and sector concentration monitoring. The area is also responsible for operational limits definition at an individual or aggregate level and controlling and monitoring the exceptions to the current rules. Regarding credit risk, the area also takes part in the definition of new types of products, evaluating the indicators necessary for their implementation.
MIS, Modeling and Credit and Risk Infrastructure
Responsible for the management of the credit systems, interface with external bureaux, consolidation of reports on the measurement and control of exposures of the wholesale and retail portfolio at aggregate level (portfolio view), for the development of statistical models, such as credit scoring, behavior scoring, collection scoring and for rating private companies and government entities, in accordance with the requirements of the new Basel accord.
Credit collection and recovery
Manages the Retail Credit Recovery, Wholesale Credit Recovery and Planning and MIS teams, whose main attributions are detailed below:
Credit recovery - Wholesale: responsible for management and control of loans in arrears, supporting the commercial unit's renegotiations, arranging friendly credit collections and ongoing monitoring, along with the legal department, and bringing judicial proceedings, acting as liaison and coordinator between the units involved, and analyzing and submitting renegotiating proposals to the proper court.
Credit recovery - Retail: responsible for the litigious administrative credit collection of all products: vehicles, payroll loans, cards, personal credit and consumer credit. It is also responsible for the safekeeping and sale of guarantees taken back.
Planning and MIS: responsible for conceptualization, specification and monitoring of credit collection projects; report and collection indicator generation and monitoring, and establishing related policies.
Derivative Risk Control
Performs the daily monitoring of the portfolio of derivatives held with clients.
Environmental and Social Risk
Responsible for assessing the social and environmental aspects with which the client is involved, such as: Waste Management, Compliance with Legislation, Working Conditions and Use of Natural Resources, establishing their level of environmental and social risk and issuing a social and environmental opinion to subsidize the Lending area in the credit decision process.
Integrated Risk and Capital
Responsible for the (procedural and methodological) coordination of the Internal Capital Adequacy Assessment Process (ICAAP), risk appetite, stress test and ALM, Risks and Capital Committee (CARC) and for the determination and analysis of the regulatory and economic capital of credit risk, as well as for the capital ratios (Basel, Tier I and Common Equity Tier I).
19
Validation of models
Responsible for the independent assessment of the risks associated with the development process model, monitoring the action plans prepared to mitigate risks identified in the validation of models and monitoring the model performance.
1.4 Credit Lending Structure and Areas Involved
Middle Market Credit and Credit CIB (Corporate & Investment Banking)
Responsible for the credit analysis and approval process of the Middle Market Companies and CIB segment. It’s a member of the credit committee of, Middle Market and CIB and of the decision-making committees of the area, monitoring the business strategy based on market scenarios and internal credit policies and instructs the commercial managers in relation to best credit practices, aiming at a sustainable growth and alignment with the organization's strategic objectives.
Retail Credit
Responsible for the individual analysis, when required by policies, of requests for credit produced through the corporate commercial structures of the Retail segment, ensuring that they are dealt with in compliance with the norms and procedures and with the respective approval levels of each operation. It is also responsible for control over the risk exposure of the portfolio.
1.5 Credit Risk Management
The institution performs credit risk management through the adoption of governance, instruments and tools that allow the identification, assessment and measurement, tracking and reporting of the risk incurred in its activities in the main stages of credit risk, which are lending, credit monitoring and credit recovery.
Credit Lending
The lending process of the wholesale segment is based on detailed assessments of proponent clients, either in the admission of prospective clients or in the renewal of credit limits for existing clients. In the credit analysis process, the institution relies on integrated systems that manage the entire analysis flow, from the proposition of limits, through to the updating of detailed knowledge of the client (Know Your Client “KYC”), verification of documentation and inquiries to credit bureaus, submission to the credit approval levels and implementation of the decisions of the corresponding committees. The evaluation of the loan proposal is carried out based on quantitative and qualitative factors of companies, weighing corporate and management information of the client, market aspects and competitive positioning, economic sector of activity, access to credit and economic and financial situation, in addition to others.
In the Retail segment, credit proposals are processed by an automated, parameterized system supported by a scoring model, which favor greater efficiency and reliability in lending decisions, which are intended for individuals that demonstrate payment ability and reputability. For cases where the scoring model does not automatically decide, the credit desk carries out a more detailed check of all the aspects involved in the contract, with the intention of approving or rejecting the credit proposal.
Credit Monitoring
In Wholesale, after the approval of the credit limit and/or loan for the client, these are tracked by means of recurrent monitoring of the portfolio, identifying warning signs that demonstrate, with propriety, in advance and in a timely manner, the deterioration of credit at individual and aggregate levels. In Retail segment, the institution performs the monitoring of the credit risk through performance indicators and management reports of the credit portfolio.
Credit Recovery
The credit recovery area works together with the monitoring area from the first day of delinquency observed in loans. Several strategies are used to maximize credit collection opportunities.
20
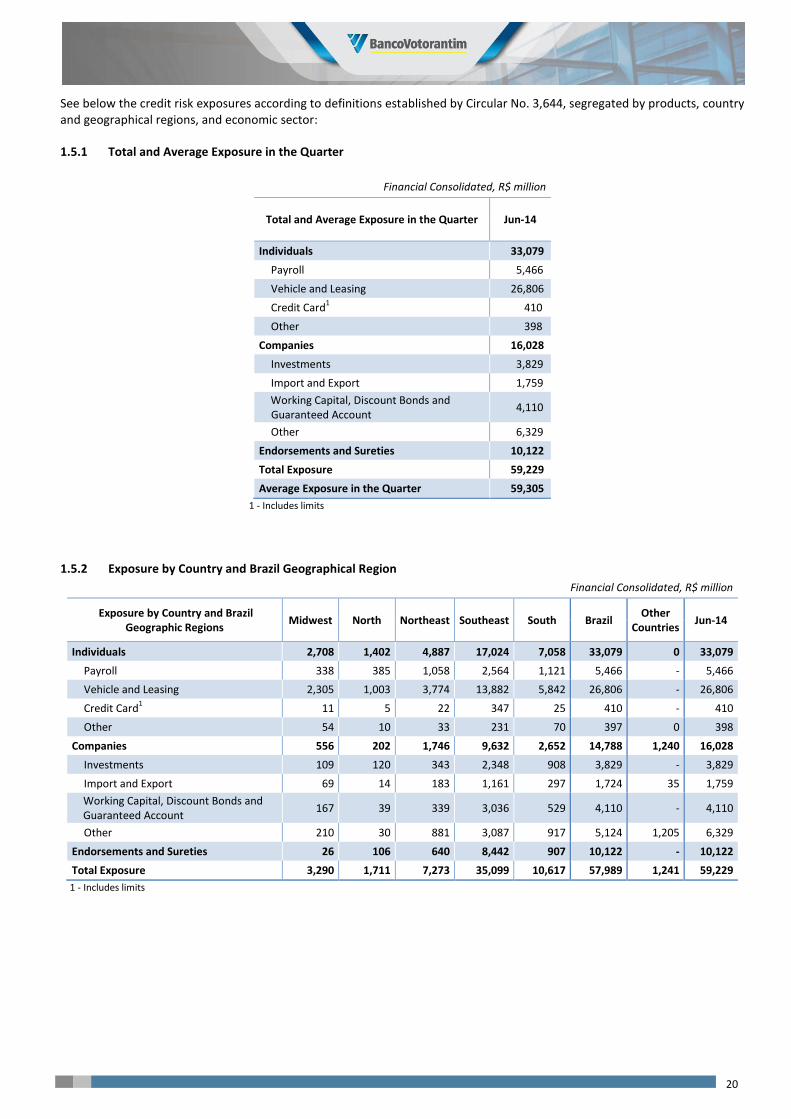
See below the credit risk exposures according to definitions established by Circular No. 3,644, segregated by products, country and geographical regions, and economic sector:
1.5.1 Total and Average Exposure in the Quarter
Financial Consolidated, R$ million
Total and Average Exposure in the Quarter Jun-14
Individuals 33,079
Payroll 5,466
Vehicle and Leasing 26,806
Credit Card1 410
Other 398
Companies 16,028
Investments 3,829
Import and Export 1,759
Working Capital, Discount Bonds and Guaranteed Account
4,110
Other 6,329
Endorsements and Sureties 10,122
Total Exposure 59,229
Average Exposure in the Quarter 59,305
1 - Includes limits
1.5.2 Exposure by Country and Brazil Geographical Region
Financial Consolidated, R$ million
Exposure by Country and Brazil Geographic Regions
Midwest North Northeast Southeast South Brazil Other
Countries Jun-14
Individuals 2,708 1,402 4,887 17,024 7,058 33,079 0 33,079
Payroll 338 385 1,058 2,564 1,121 5,466 - 5,466
Vehicle and Leasing 2,305 1,003 3,774 13,882 5,842 26,806 - 26,806
Credit Card1 11 5 22 347 25 410 - 410
Other 54 10 33 231 70 397 0 398
Companies 556 202 1,746 9,632 2,652 14,788 1,240 16,028
Investments 109 120 343 2,348 908 3,829 - 3,829
Import and Export 69 14 183 1,161 297 1,724 35 1,759
Working Capital, Discount Bonds and Guaranteed Account
167 39 339 3,036 529 4,110 - 4,110
Other 210 30 881 3,087 917 5,124 1,205 6,329
Endorsements and Sureties 26 106 640 8,442 907 10,122 - 10,122
Total Exposure 3,290 1,711 7,273 35,099 10,617 57,989 1,241 59,229
1 - Includes limits
21
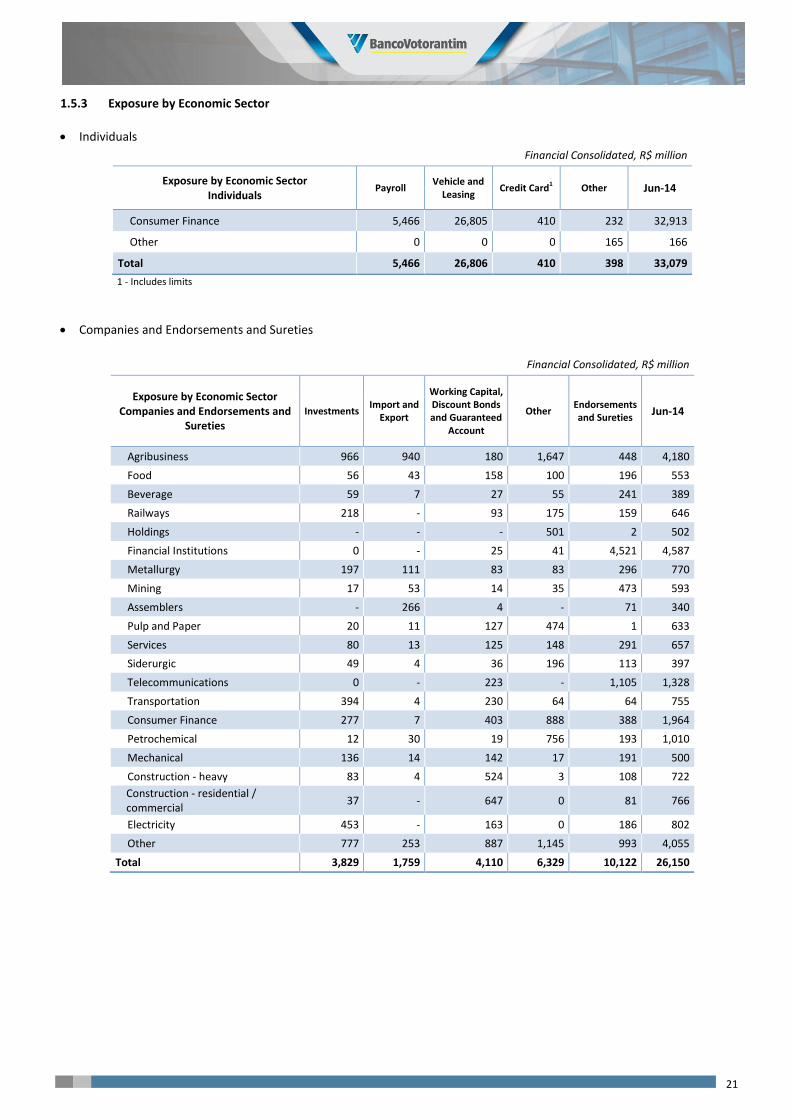
1.5.3 Exposure by Economic Sector
Individuals
Financial Consolidated, R$ million
Exposure by Economic Sector Individuals
Payroll Vehicle and
Leasing Credit Card1 Other Jun-14
Consumer Finance 5,466 26,805 410 232 32,913
Other 0 0 0 165 166
Total 5,466 26,806 410 398 33,079
1 - Includes limits
Companies and Endorsements and Sureties
Financial Consolidated, R$ million
Exposure by Economic Sector Companies and Endorsements and
Sureties
Investments Import and
Export
Working Capital, Discount Bonds and Guaranteed
Account
Other Endorsements and Sureties
Jun-14
Agribusiness 966 940 180 1,647 448 4,180
Food 56 43 158 100 196 553
Beverage 59 7 27 55 241 389
Railways 218 - 93 175 159 646
Holdings - - - 501 2 502
Financial Institutions 0 - 25 41 4,521 4,587
Metallurgy 197 111 83 83 296 770
Mining 17 53 14 35 473 593
Assemblers - 266 4 - 71 340
Pulp and Paper 20 11 127 474 1 633
Services 80 13 125 148 291 657
Siderurgic 49 4 36 196 113 397
Telecommunications 0 - 223 - 1,105 1,328
Transportation 394 4 230 64 64 755
Consumer Finance 277 7 403 888 388 1,964
Petrochemical 12 30 19 756 193 1,010
Mechanical 136 14 142 17 191 500
Construction - heavy 83 4 524 3 108 722
Construction - residential / commercial
37 - 647 0 81 766
Electricity 453 - 163 0 186 802
Other 777 253 887 1,145 993 4,055
Total 3,829 1,759 4,110 6,329 10,122 26,150
22
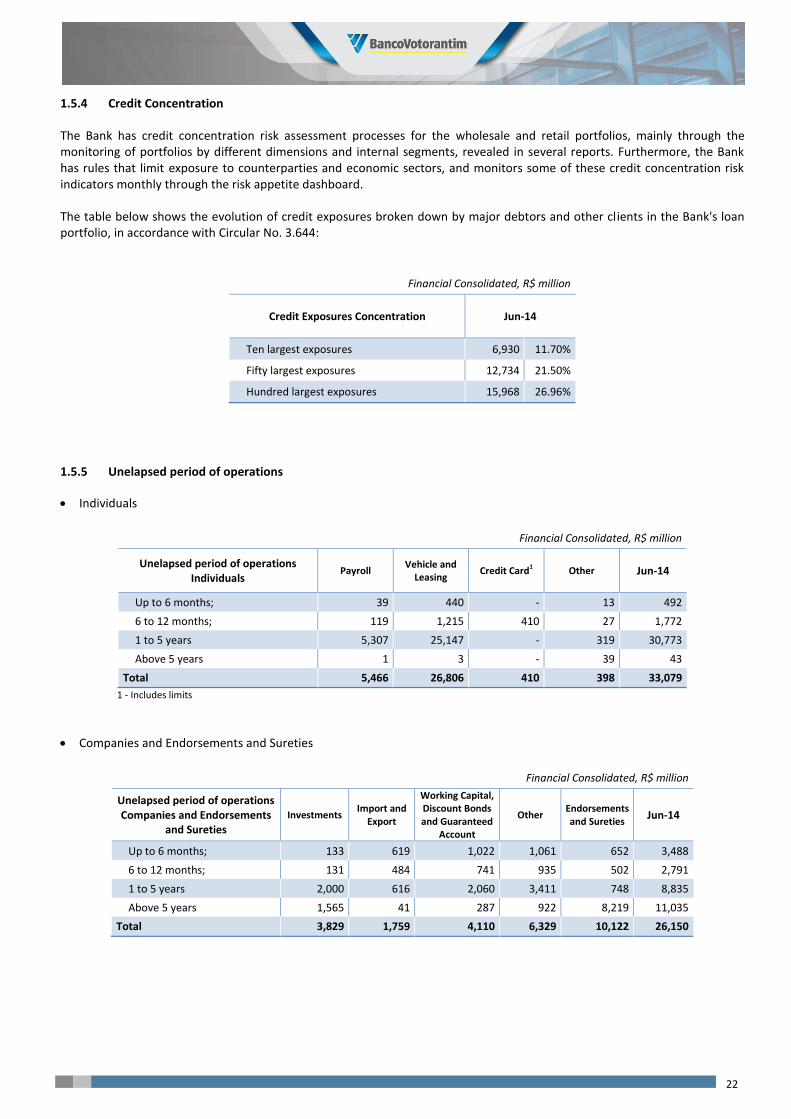
1.5.4 Credit Concentration
The Bank has credit concentration risk assessment processes for the wholesale and retail portfolios, mainly through the monitoring of portfolios by different dimensions and internal segments, revealed in several reports. Furthermore, the Bank has rules that limit exposure to counterparties and economic sectors, and monitors some of these credit concentration risk indicators monthly through the risk appetite dashboard.
The table below shows the evolution of credit exposures broken down by major debtors and other clients in the Bank's loan portfolio, in accordance with Circular No. 3.644:
Financial Consolidated, R$ million
Credit Exposures Concentration Jun-14
Ten largest exposures 6,930 11.70%
Fifty largest exposures 12,734 21.50%
Hundred largest exposures 15,968 26.96%
1.5.5 Unelapsed period of operations
Individuals
Financial Consolidated, R$ million
Unelapsed period of operations Individuals
Payroll Vehicle and
Leasing Credit Card1 Other Jun-14
Up to 6 months; 39 440 - 13 492
6 to 12 months; 119 1,215 410 27 1,772
1 to 5 years 5,307 25,147 - 319 30,773
Above 5 years 1 3 - 39 43
Total 5,466 26,806 410 398 33,079
1 - Includes limits
Companies and Endorsements and Sureties
Financial Consolidated, R$ million
Unelapsed period of operations Companies and Endorsements
and Sureties
Investments Import and
Export
Working Capital, Discount Bonds and Guaranteed
Account
Other Endorsements and Sureties
Jun-14
Up to 6 months; 133 619 1,022 1,061 652 3,488
6 to 12 months; 131 484 741 935 502 2,791
1 to 5 years 2,000 616 2,060 3,411 748 8,835
Above 5 years 1,565 41 287 922 8,219 11,035
Total 3,829 1,759 4,110 6,329 10,122 26,150
23
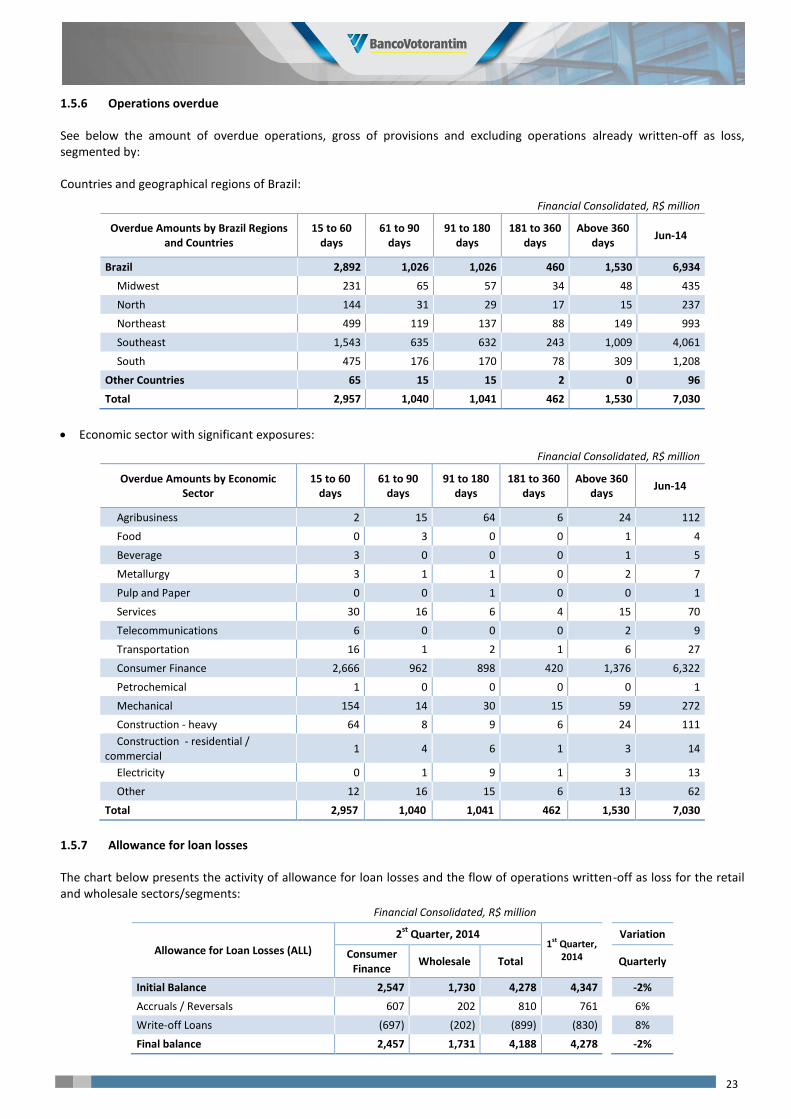
1.5.6 Operations overdue
See below the amount of overdue operations, gross of provisions and excluding operations already written-off as loss, segmented by:
Countries and geographical regions of Brazil:
Financial Consolidated, R$ million
Overdue Amounts by Brazil Regions and Countries
15 to 60 days
61 to 90 days
91 to 180 days
181 to 360 days
Above 360 days
Jun-14
Brazil 2,892 1,026 1,026 460 1,530 6,934
Midwest 231 65 57 34 48 435
North 144 31 29 17 15 237
Northeast 499 119 137 88 149 993
Southeast 1,543 635 632 243 1,009 4,061
South 475 176 170 78 309 1,208
Other Countries 65 15 15 2 0 96
Total 2,957 1,040 1,041 462 1,530 7,030
Economic sector with significant exposures:
Financial Consolidated, R$ million
Overdue Amounts by Economic Sector
15 to 60 days
61 to 90 days
91 to 180 days
181 to 360 days
Above 360 days
Jun-14
Agribusiness 2 15 64 6 24 112
Food 0 3 0 0 1 4
Beverage 3 0 0 0 1 5
Metallurgy 3 1 1 0 2 7
Pulp and Paper 0 0 1 0 0 1
Services 30 16 6 4 15 70
Telecommunications 6 0 0 0 2 9
Transportation 16 1 2 1 6 27
Consumer Finance 2,666 962 898 420 1,376 6,322
Petrochemical 1 0 0 0 0 1
Mechanical 154 14 30 15 59 272
Construction - heavy 64 8 9 6 24 111
Construction - residential / commercial
1 4 6 1 3 14
Electricity 0 1 9 1 3 13
Other 12 16 15 6 13 62
Total 2,957 1,040 1,041 462 1,530 7,030
1.5.7 Allowance for loan losses
The chart below presents the activity of allowance for loan losses and the flow of operations written-off as loss for the retail and wholesale sectors/segments:
Financial Consolidated, R$ million
Allowance for Loan Losses (ALL)
2st
Quarter, 2014 1st Quarter,
2014
Variation
Consumer Finance
Wholesale Total
Quarterly
Initial Balance 2,547 1,730 4,278 4,347
-2%
Accruals / Reversals 607 202 810 761
6%
Write-off Loans (697) (202) (899) (830)
8%
Final balance 2,457 1,731 4,188 4,278
-2%
24
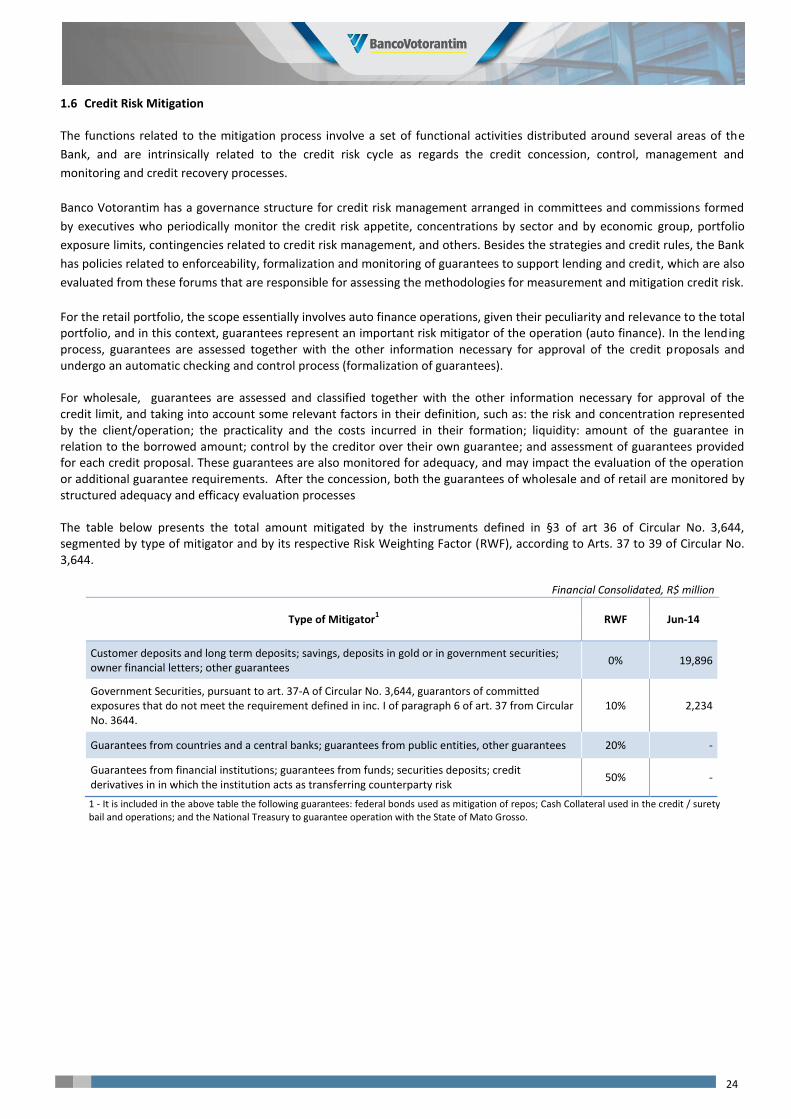
1.6 Credit Risk Mitigation
The functions related to the mitigation process involve a set of functional activities distributed around several areas of the
Bank, and are intrinsically related to the credit risk cycle as regards the credit concession, control, management and
monitoring and credit recovery processes.
Banco Votorantim has a governance structure for credit risk management arranged in committees and commissions formed
by executives who periodically monitor the credit risk appetite, concentrations by sector and by economic group, portfolio
exposure limits, contingencies related to credit risk management, and others. Besides the strategies and credit rules, the Bank
has policies related to enforceability, formalization and monitoring of guarantees to support lending and credit, which are also
evaluated from these forums that are responsible for assessing the methodologies for measurement and mitigation credit risk.
For the retail portfolio, the scope essentially involves auto finance operations, given their peculiarity and relevance to the total portfolio, and in this context, guarantees represent an important risk mitigator of the operation (auto finance). In the lending process, guarantees are assessed together with the other information necessary for approval of the credit proposals and undergo an automatic checking and control process (formalization of guarantees).
For wholesale, guarantees are assessed and classified together with the other information necessary for approval of the credit limit, and taking into account some relevant factors in their definition, such as: the risk and concentration represented by the client/operation; the practicality and the costs incurred in their formation; liquidity: amount of the guarantee in relation to the borrowed amount; control by the creditor over their own guarantee; and assessment of guarantees provided for each credit proposal. These guarantees are also monitored for adequacy, and may impact the evaluation of the operation or additional guarantee requirements. After the concession, both the guarantees of wholesale and of retail are monitored by structured adequacy and efficacy evaluation processes
The table below presents the total amount mitigated by the instruments defined in §3 of art 36 of Circular No. 3,644, segmented by type of mitigator and by its respective Risk Weighting Factor (RWF), according to Arts. 37 to 39 of Circular No. 3,644.
Financial Consolidated, R$ million
Type of Mitigator1 RWF Jun-14
Customer deposits and long term deposits; savings, deposits in gold or in government securities; owner financial letters; other guarantees
0% 19,896
Government Securities, pursuant to art. 37-A of Circular No. 3,644, guarantors of committed exposures that do not meet the requirement defined in inc. I of paragraph 6 of art. 37 from Circular No. 3644.
10% 2,234
Guarantees from countries and a central banks; guarantees from public entities, other guarantees 20% -
Guarantees from financial institutions; guarantees from funds; securities deposits; credit derivatives in in which the institution acts as transferring counterparty risk
50% -
1 - It is included in the above table the following guarantees: federal bonds used as mitigation of repos; Cash Collateral used in the credit / surety bail and operations; and the National Treasury to guarantee operation with the State of Mato Grosso.

25
To supplement the mitigators used to determine the necessary credit risk capital presented above, the table below lists other guarantees considered in wholesale operations:
Financial Consolidated, R$ million
Guarantees1 Jun-14
Fidejussory Guarantees 12,435
Stock Disposal 2,307
Stock Rental -
Agri/Rural Disposal 335
Financed Assets Disposal 4,081
Commodities Stock Disposal 1,651
Property Disposal 1,483
Machines and Equipments Disposal 1,724
Vehicles Disposal 301
Ships Disposal 3
Aircraft Disposal 69
Fixed Income Investments 364
Variable Income Investments 209
Granted of Commercial Invoice 403
Real Estate Mortgage 1,590
Mortgages Vessel 7
Granted of asset-backed 23
Pledge of agribusiness 685
Commercial Pledge 804
Total of Guarantees 28,475
1 - Wholesale operations
1.7 Counterparty Credit Risk
The counterparty credit risk is defined as the possibility of losses resulting from the bilateral risk relating to the uncertainty of the market value of the operation and its fluctuations associated with the movement of the risk factors or with the deterioration of the counterparty’s credit rating.
The roles of counterparty credit risk management are performed by specific units, with defined attributions, as presented below: Derivative Products
Responsible for the structuring of derivative products without central counterparty.
Credit Lending - Wholesale
Responsible for the concession of limits of derivative operations according to the current credit policies.
Integrated Risk and Capital
The area is responsible for the measurement of regulatory capital.
Derivative Control
Performs the daily monitoring of the portfolio of derivatives held with clients.
Market risk and liquidity
Responsible for mark-to-market, economic/ management models, analysis of structured derivative operations and support to Lending.
Credit Risk Management
Responsible for the control and monitoring of the limits used and preparation of management reports (after sales).
26
1.7.1 Counterparty Credit Risk Management
The Bank considers that counterparty credit risk is present mainly in operations with derivative financial instruments, unsettled operations, purchase and sale commitments and loans of assets.
Specific classifications and treatments are performed for derivative operations with regards the existence of a central counterparty.
Transactions with no central counterparty: the management and control process for derivative operations without a central counterparty is carried out in such a way that specific credit limits of derivatives are defined for each client. The credit policies and standards adopted by the Institution are employed both in the definition and in the periodic tracking of these limits.
Transactions with central counterparty: operations with a central counterparty have contract clauses (margin calls, etc.) that mitigate the counterparty credit risk.
The Bank has a dedicated structure for managing limits, which monitors portfolio behavior and issues periodic reports informing Senior Management of business opportunities and any risks of exceeding limits.
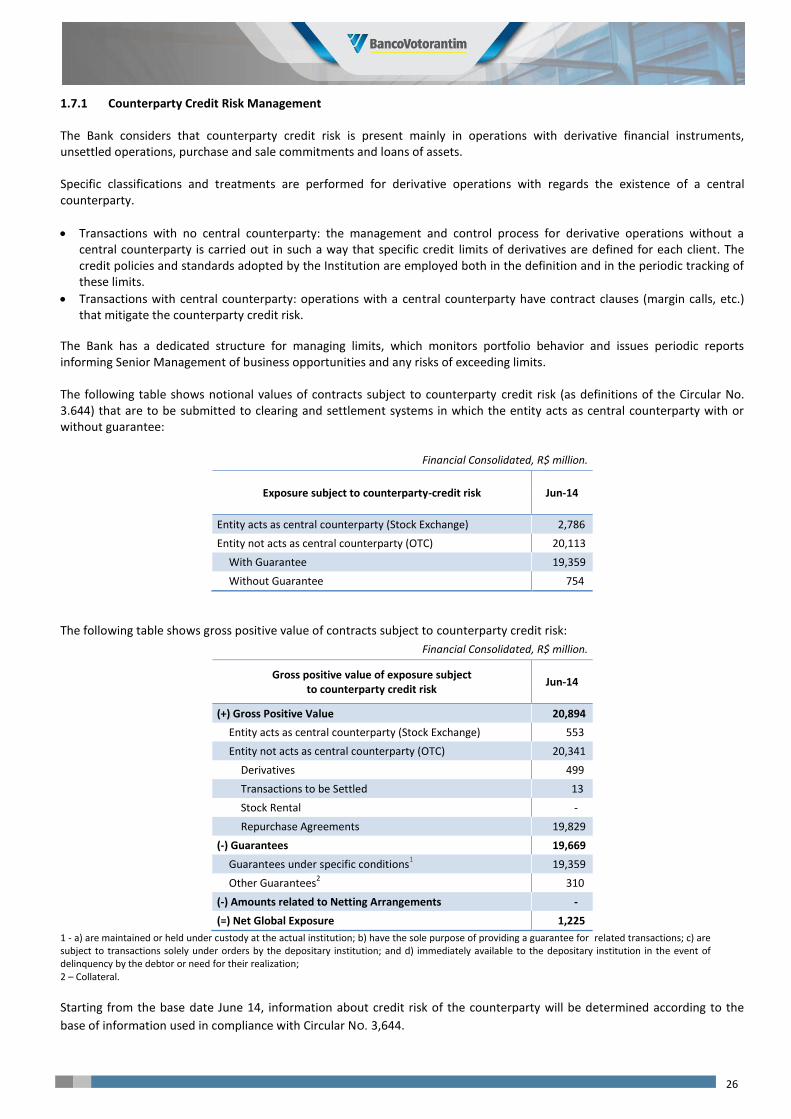
The following table shows notional values of contracts subject to counterparty credit risk (as definitions of the Circular No. 3.644) that are to be submitted to clearing and settlement systems in which the entity acts as central counterparty with or without guarantee:
Financial Consolidated, R$ million.
Exposure subject to counterparty-credit risk Jun-14
Entity acts as central counterparty (Stock Exchange) 2,786
Entity not acts as central counterparty (OTC) 20,113
With Guarantee 19,359
Without Guarantee 754
The following table shows gross positive value of contracts subject to counterparty credit risk:
Financial Consolidated, R$ million.
Gross positive value of exposure subject to counterparty credit risk
Jun-14
(+) Gross Positive Value 20,894
Entity acts as central counterparty (Stock Exchange) 553
Entity not acts as central counterparty (OTC) 20,341
Derivatives 499
Transactions to be Settled 13
Stock Rental -
Repurchase Agreements 19,829
(-) Guarantees 19,669
Guarantees under specific conditions1 19,359
Other Guarantees2 310
(-) Amounts related to Netting Arrangements -
(=) Net Global Exposure 1,225
1 - a) are maintained or held under custody at the actual institution; b) have the sole purpose of providing a guarantee for related transactions; c) are subject to transactions solely under orders by the depositary institution; and d) immediately available to the depositary institution in the event of delinquency by the debtor or need for their realization; 2 – Collateral.
Starting from the base date June 14, information about credit risk of the counterparty will be determined according to the
base of information used in compliance with Circular No. 3,644.

27
1.7.2 Credit Derivatives
The following table shows the notional value of credit derivatives broken down by risk exposure transferred and risk received:
Financial Consolidated, R$ million.
Credit Derivatives jun-14 mar-14 jun-13 Variação
Trimestre Ano
Asset position – Risk received 294 351 853
-16.3% -65.6%
Credit Swaps 294 351 853
-16.3% -65.6%
Liability position – Transferred risk 705 769 654
-8.4% 7.8%
Credit Swaps 705 769 654
-8.4% 7.8%
1.8 Acquisition, sale and transfer of financial assets
The Bank carries out acquisitions, sales or transfers of financial assets to wholesale and retail portfolios, guided by the credit strategy defined by the institution or going from business opportunity identification. These operations can, by nature, be carried out with substantial retention or transfer of the risks and benefits.
In this respect, the Bank has policies designed to establish adequate criteria for a correct evaluation of the retention or transfer of risks and benefits in acquisitions, sales or transfers of financial assets, and through these policies, defines the general conditions (e.g. restrictions, criteria for the selection of the purchasing institution, necessary documentation of the portfolio, payment method of contracts and others).
1.8.1 Exposures granted
In general, sales or transfers of financial assets performed by the Bank are related mainly to the assignments of receivables of payroll loan and auto finance agreements (in a regular situation or delinquent) and assets of the wholesale portfolio. Such assignments are aligned with the funding strategies for new operations and portfolio management, and are normally negotiated with other financial institutions, securitization companies or investment funds.
The table below shows the value of assignments with recourse operations prior to Resolution No. 3,533:
Financial Consolidated, R$ million.
Balance of exposures assigned recorded in memorandum accounts
Jun-14 Mar-14 Variation
Quarterly
With Coobligation1 3,021 3,861
-21,7%
1 - Include Financial Institutions, Related Parties and Other Financial Institutions.
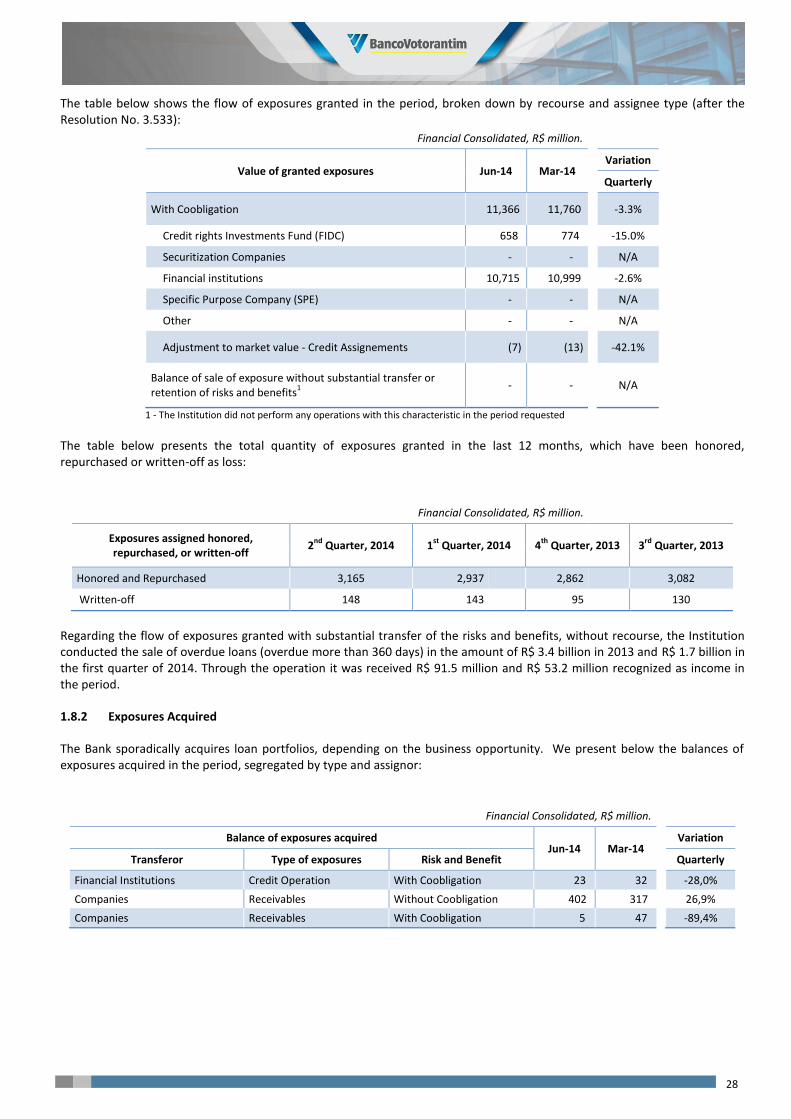
28
The table below shows the flow of exposures granted in the period, broken down by recourse and assignee type (after the Resolution No. 3.533):
Financial Consolidated, R$ million.
Value of granted exposures Jun-14 Mar-14 Variation
Quarterly
With Coobligation 11,366 11,760
-3.3%
Credit rights Investments Fund (FIDC) 658 774
-15.0%
Securitization Companies - -
N/A
Financial institutions 10,715 10,999
-2.6%
Specific Purpose Company (SPE) - -
N/A
Other - -
N/A
Adjustment to market value - Credit Assignements (7) (13)
-42.1%
Balance of sale of exposure without substantial transfer or retention of risks and benefits
1
- -
N/A
1 - The Institution did not perform any operations with this characteristic in the period requested
The table below presents the total quantity of exposures granted in the last 12 months, which have been honored, repurchased or written-off as loss:
Financial Consolidated, R$ million.
Exposures assigned honored, repurchased, or written-off
2nd
Quarter, 2014 1st
Quarter, 2014 4th
Quarter, 2013 3rd
Quarter, 2013
Honored and Repurchased 3,165 2,937
2,862
3,082
Written-off 148 143
95
130
Regarding the flow of exposures granted with substantial transfer of the risks and benefits, without recourse, the Institution conducted the sale of overdue loans (overdue more than 360 days) in the amount of R$ 3.4 billion in 2013 and R$ 1.7 billion in the first quarter of 2014. Through the operation it was received R$ 91.5 million and R$ 53.2 million recognized as income in the period.
1.8.2 Exposures Acquired
The Bank sporadically acquires loan portfolios, depending on the business opportunity. We present below the balances of exposures acquired in the period, segregated by type and assignor:
Financial Consolidated, R$ million.
Balance of exposures acquired Jun-14 Mar-14
Variation
Transferor Type of exposures Risk and Benefit
Quarterly
Financial Institutions Credit Operation With Coobligation 23 32
-28,0%
Companies Receivables Without Coobligation 402 317
26,9%
Companies Receivables With Coobligation 5 47
-89,4%
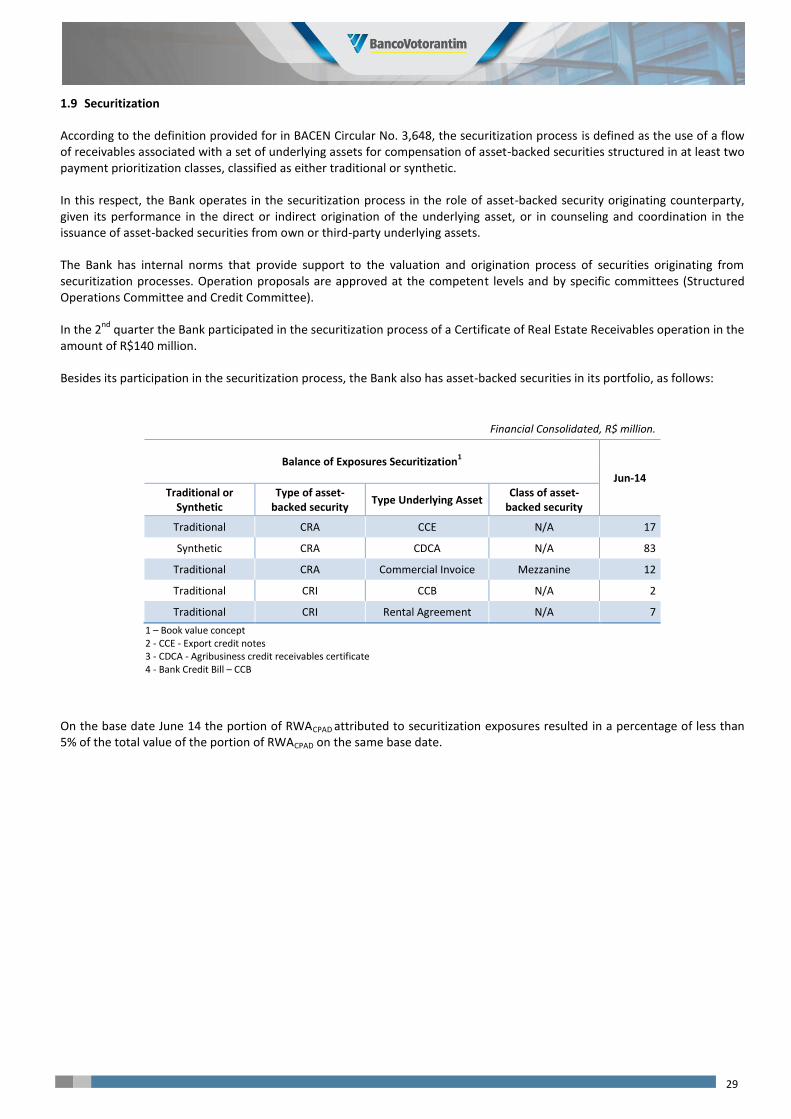
29
1.9 Securitization
According to the definition provided for in BACEN Circular No. 3,648, the securitization process is defined as the use of a flow of receivables associated with a set of underlying assets for compensation of asset-backed securities structured in at least two payment prioritization classes, classified as either traditional or synthetic.
In this respect, the Bank operates in the securitization process in the role of asset-backed security originating counterparty, given its performance in the direct or indirect origination of the underlying asset, or in counseling and coordination in the issuance of asset-backed securities from own or third-party underlying assets.
The Bank has internal norms that provide support to the valuation and origination process of securities originating from securitization processes. Operation proposals are approved at the competent levels and by specific committees (Structured Operations Committee and Credit Committee).
In the 2nd
quarter the Bank participated in the securitization process of a Certificate of Real Estate Receivables operation in the amount of R$140 million.
Besides its participation in the securitization process, the Bank also has asset-backed securities in its portfolio, as follows:
Financial Consolidated, R$ million.
Balance of Exposures Securitization1
Jun-14 Traditional or
Synthetic Type of asset-
backed security Type Underlying Asset
Class of asset-backed security
Traditional CRA CCE N/A 17
Synthetic CRA CDCA N/A 83
Traditional CRA Commercial Invoice Mezzanine 12
Traditional CRI CCB N/A 2
Traditional CRI Rental Agreement N/A 7
1 – Book value concept 2 - CCE - Export credit notes 3 - CDCA - Agribusiness credit receivables certificate 4 - Bank Credit Bill – CCB
On the base date June 14 the portion of RWACPAD attributed to securitization exposures resulted in a percentage of less than 5% of the total value of the portion of RWACPAD on the same base date.
30
2. Market Risk
It is the aim of market risk control to provide support for the business management, establish the processes and implement the tools required for assessing and controlling market risks, enabling the measurement and follow-up of the risk appetite levels defined by Senior Management.
2.1 Definitions
Market risk is defined as the possibility of financial losses arising from the variation in the market value of exposures held by a financial institution. These financial losses may be incurred due to the impact generated by the variation in interest rates, exchange rate parity and prices of shares and commodities.
2.2 Basic Principles
In accordance with CMN Resolution No. 3,464, the Bank has an institutional structure and policies for market risk management approved by the Board of Directors and the basic principles observed in management and control were established in compliance with the current regulations and market practices, as follows:
Involvement of Senior Management: the existing committees and commissions are structured in manner that Senior Management participates in the overall supervision of risk-taking;
Segregation of portfolios: for a consolidated management and control of market risk exposures, operations are divided into two types of portfolios, in accordance with their business strategy: trading portfolio (trading) or banking portfolio (non-trading);
Segregation of attributions: segregation of functions between units responsible for trade execution and defining business strategies, and the units responsible for accounting, risk control, compliance and internal controls and auditing. This segregation is structured with the objective of ensuring independence and autonomy in the management of the attributions inherent to each role;
Definition of attributions: clear definition of processes and the range of activities of each function involved in market risk management and control. This definition is structured with the objective of enabling organized and efficient operations management;
Definition of pricing and risk calculation methods: for the purpose of risk control, structured methodologies based on market practices are adopted for mandatory corporate use;
Limits Establishment: clear and objective definition of the authorized risk levels, based on the risk measures. This definition is structured with the objective of including the risk appetite levels defined by the institution in the daily activities;
Monitoring of limits: definition of the process for monitoring and reporting on the level of usage of the authorized limits.
2.3 Areas Involved
Market risk management functions include a set of functional activities that permeate the entire 'business chain', from product development, to operations, modeling and control of market risk, P&L attribution and formalization, accounting and settlement of transactions, as well as monitoring the effectiveness of processes and controls used.
These functions are performed by formally set up functional units, with technically qualified teams, under separate management, and with clearly defined attributions, as presented below:
Market Risk Control
Responsible for pricing methodologies and modeling, and calculating market risk;
Responsible for the independent capture of the prices used;
Responsible for calculating the values at risk and the allocated capital and monitoring authorized limits.
Treasury
Responsible for trade execution with the market, constantly ensuring fair prices and trading compliance;
Responsible for monitoring market opportunities and trends and managing risk exposures, in compliance with the defined strategies and authorized limits;
Responsible for the effective operation of the management segregation of portfolios.
31
Operations
Responsible for the independent confirmation, formalization, registration, accounting and settlement of transactions, as well as for ensuring the completeness, consistency, integrity and reliability of databases.
Finance
Responsible for the determination and tracking of the accounting and management result of operations.
2.4 Market Risk Management
2.4.1 Segregation of Portfolios
For the purposes of consolidated management and control of market risk exposures, transactions are segregated into two types of portfolios depending on their business strategy: trading portfolio (trading) or banking portfolio (non-trading).
The trading portfolio covers all transactions, financial instruments, commodities or derivatives held with the intention of trading, or turning over, or hedging other trading portfolio transactions, and not subject to tradability restrictions. The banking portfolio encompasses all the operations not classified as trading.
The principal mechanisms adopted by the Bank for segregating portfolios are the following:
Segregation of transactions is based on business strategies intention, captured at the time of trading, reflecting proactive treasury management, and it might be classified as trading or banking;
Conditions for trading classification: intention of trading in short-term, need for liquidity, being marked to market on a daily basis, and observe rules for defined turnover dates and carrying levels; e
Breakdown of banking portfolio: includes other transactions, financial instruments, commodities or derivatives, which, by exclusion, are those not held for the sole purpose of trading in the short term.
2.4.2 Risk Measures and Limits for Management and Control
The Bank adopts a set of objective measures for managing and controlling market risks.
VaR (Value-at-risk): it seeks to determine the risk resulting from market exposures, by determining the highest expected loss within a confidence interval and a time horizon;
Stress test: it is used to estimate potential fluctuations in value of financial instruments, which occur because of extreme movements of market variables (or risk factors);
Market Risk Regulatory Capital: comprises the regulatory capital calculated as a result of the exposures of trading and non-trading portfolios;
Sensitivity Analysis: it is used to estimate the potential fluctuations in value of financial instruments, which occur because of fluctuations in the risk factors; and
GAP analysis: consists of the measurement of cash flow mismatching by risk factor.
Risk measures are used along with limits as market risk management tools. These limits include the definition of maximum authorized amounts, adhering to the strategies adopted, the scope of products authorized for trading, consistent with budgeted assumptions and targets. There are two types of limits, depending on decision-making powers:
Upper Limits: maximum authorized limits at the Board of Directors’ level;
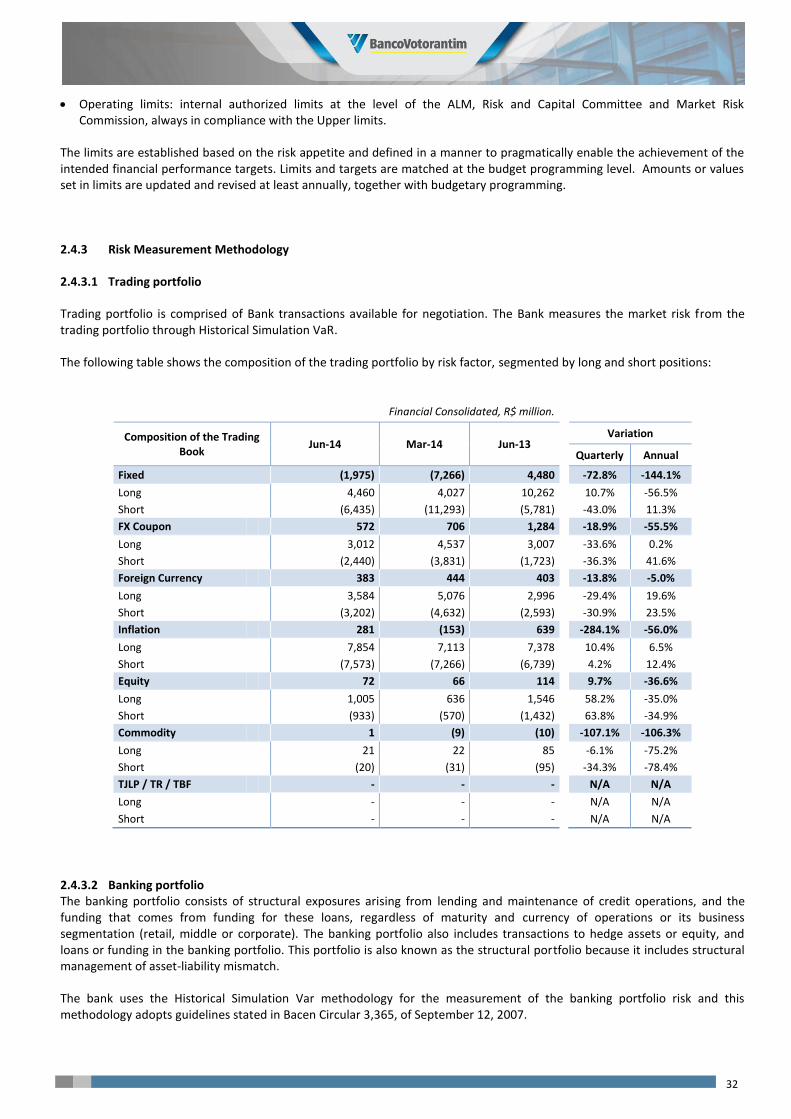
32
Operating limits: internal authorized limits at the level of the ALM, Risk and Capital Committee and Market Risk Commission, always in compliance with the Upper limits.
The limits are established based on the risk appetite and defined in a manner to pragmatically enable the achievement of the intended financial performance targets. Limits and targets are matched at the budget programming level. Amounts or values set in limits are updated and revised at least annually, together with budgetary programming.
2.4.3 Risk Measurement Methodology
2.4.3.1 Trading portfolio
Trading portfolio is comprised of Bank transactions available for negotiation. The Bank measures the market risk from the trading portfolio through Historical Simulation VaR.
The following table shows the composition of the trading portfolio by risk factor, segmented by long and short positions:
Financial Consolidated, R$ million.
Composition of the Trading Book
Jun-14 Mar-14 Jun-13 Variation
Quarterly Annual
Fixed (1,975) (7,266) 4,480
-72.8% -144.1%
Long 4,460 4,027 10,262
10.7% -56.5%
Short (6,435) (11,293) (5,781)
-43.0% 11.3%
FX Coupon 572 706 1,284
-18.9% -55.5%
Long 3,012 4,537 3,007
-33.6% 0.2%
Short (2,440) (3,831) (1,723)
-36.3% 41.6%
Foreign Currency 383 444 403
-13.8% -5.0%
Long 3,584 5,076 2,996
-29.4% 19.6%
Short (3,202) (4,632) (2,593)
-30.9% 23.5%
Inflation 281 (153) 639
-284.1% -56.0%
Long 7,854 7,113 7,378
10.4% 6.5%
Short (7,573) (7,266) (6,739)
4.2% 12.4%
Equity 72 66 114
9.7% -36.6%
Long 1,005 636 1,546
58.2% -35.0%
Short (933) (570) (1,432)
63.8% -34.9%
Commodity 1 (9) (10)
-107.1% -106.3%
Long 21 22 85
-6.1% -75.2%
Short (20) (31) (95)
-34.3% -78.4%
TJLP / TR / TBF - - -
N/A N/A
Long - - -
N/A N/A
Short - - -
N/A N/A
2.4.3.2 Banking portfolio The banking portfolio consists of structural exposures arising from lending and maintenance of credit operations, and the funding that comes from funding for these loans, regardless of maturity and currency of operations or its business segmentation (retail, middle or corporate). The banking portfolio also includes transactions to hedge assets or equity, and loans or funding in the banking portfolio. This portfolio is also known as the structural portfolio because it includes structural management of asset-liability mismatch.
The bank uses the Historical Simulation Var methodology for the measurement of the banking portfolio risk and this methodology adopts guidelines stated in Bacen Circular 3,365, of September 12, 2007.
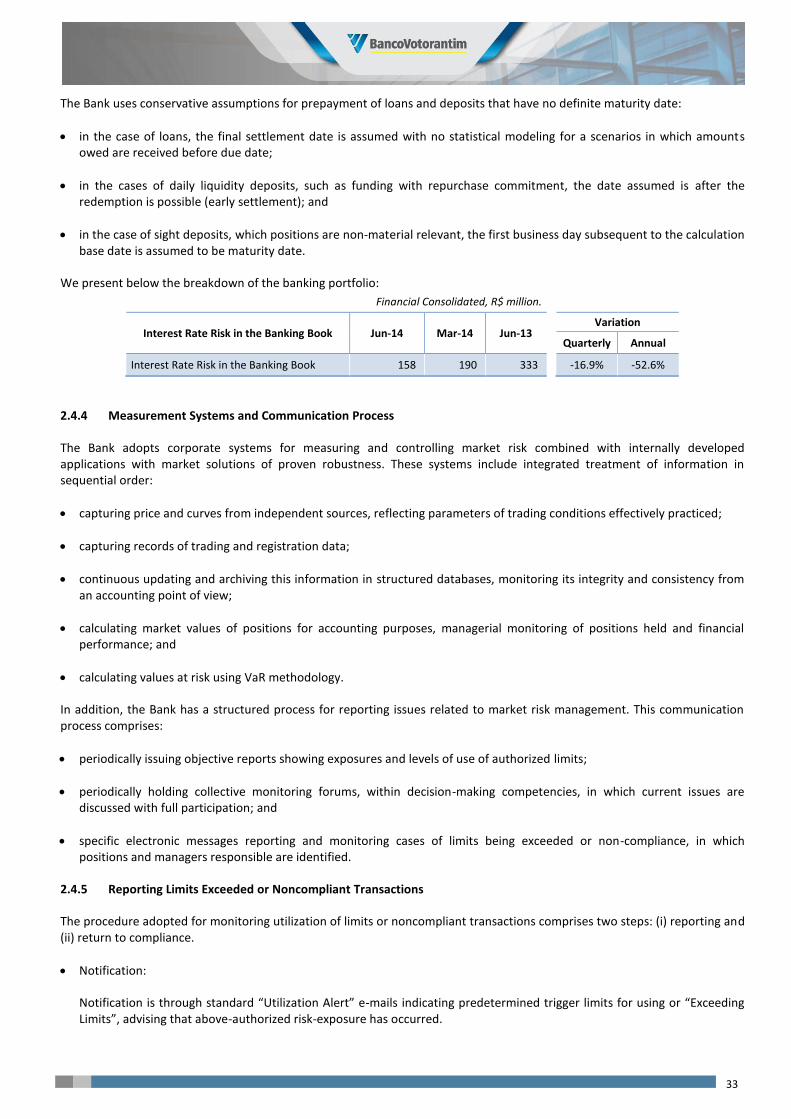
33
The Bank uses conservative assumptions for prepayment of loans and deposits that have no definite maturity date:
in the case of loans, the final settlement date is assumed with no statistical modeling for a scenarios in which amounts owed are received before due date;
in the cases of daily liquidity deposits, such as funding with repurchase commitment, the date assumed is after the redemption is possible (early settlement); and
in the case of sight deposits, which positions are non-material relevant, the first business day subsequent to the calculation base date is assumed to be maturity date.
We present below the breakdown of the banking portfolio:
Financial Consolidated, R$ million.
Interest Rate Risk in the Banking Book Jun-14 Mar-14 Jun-13 Variation
Quarterly Annual
Interest Rate Risk in the Banking Book 158 190 333
-16.9% -52.6%
2.4.4 Measurement Systems and Communication Process
The Bank adopts corporate systems for measuring and controlling market risk combined with internally developed applications with market solutions of proven robustness. These systems include integrated treatment of information in sequential order:
capturing price and curves from independent sources, reflecting parameters of trading conditions effectively practiced;
capturing records of trading and registration data;
continuous updating and archiving this information in structured databases, monitoring its integrity and consistency from an accounting point of view;
calculating market values of positions for accounting purposes, managerial monitoring of positions held and financial performance; and
calculating values at risk using VaR methodology.
In addition, the Bank has a structured process for reporting issues related to market risk management. This communication process comprises:
periodically issuing objective reports showing exposures and levels of use of authorized limits;
periodically holding collective monitoring forums, within decision-making competencies, in which current issues are discussed with full participation; and
specific electronic messages reporting and monitoring cases of limits being exceeded or non-compliance, in which positions and managers responsible are identified.
2.4.5 Reporting Limits Exceeded or Noncompliant Transactions
The procedure adopted for monitoring utilization of limits or noncompliant transactions comprises two steps: (i) reporting and (ii) return to compliance.
Notification:
Notification is through standard “Utilization Alert” e-mails indicating predetermined trigger limits for using or “Exceeding Limits”, advising that above-authorized risk-exposure has occurred.
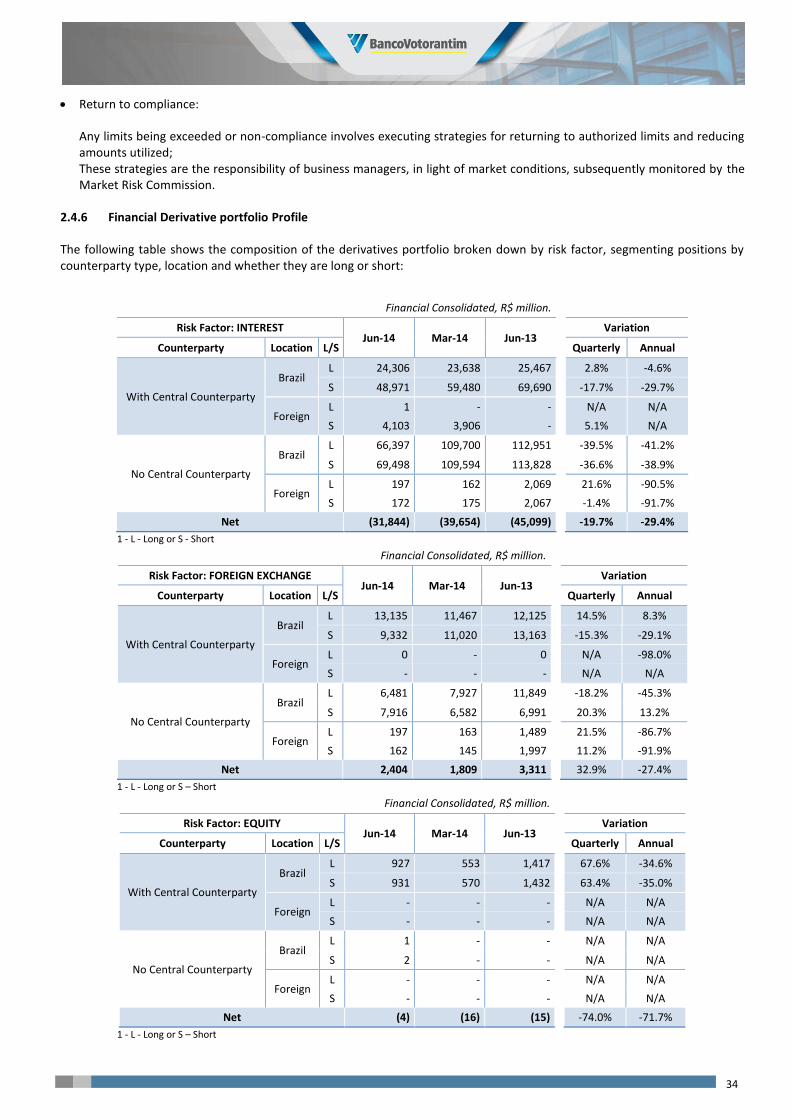
34
Return to compliance:
Any limits being exceeded or non-compliance involves executing strategies for returning to authorized limits and reducing amounts utilized; These strategies are the responsibility of business managers, in light of market conditions, subsequently monitored by the Market Risk Commission.
2.4.6 Financial Derivative portfolio Profile
The following table shows the composition of the derivatives portfolio broken down by risk factor, segmenting positions by counterparty type, location and whether they are long or short:
Financial Consolidated, R$ million.
Risk Factor: INTEREST Jun-14 Mar-14 Jun-13
Variation
Counterparty Location L/S
Quarterly Annual
With Central Counterparty
Brazil L 24,306 23,638 25,467
2.8% -4.6%
S 48,971 59,480 69,690
-17.7% -29.7%
Foreign L 1 - -
N/A N/A
S 4,103 3,906 -
5.1% N/A
No Central Counterparty
Brazil L 66,397 109,700 112,951
-39.5% -41.2%
S 69,498 109,594 113,828
-36.6% -38.9%
Foreign L 197 162 2,069
21.6% -90.5%
S 172 175 2,067
-1.4% -91.7%
Net (31,844) (39,654) (45,099)
-19.7% -29.4%
1 - L - Long or S - Short
Financial Consolidated, R$ million.
Risk Factor: FOREIGN EXCHANGE Jun-14 Mar-14 Jun-13
Variation
Counterparty Location L/S
Quarterly Annual
With Central Counterparty
Brazil L 13,135 11,467 12,125
14.5% 8.3%
S 9,332 11,020 13,163
-15.3% -29.1%
Foreign L 0 - 0
N/A -98.0%
S - - -
N/A N/A
No Central Counterparty
Brazil L 6,481 7,927 11,849
-18.2% -45.3%
S 7,916 6,582 6,991
20.3% 13.2%
Foreign L 197 163 1,489
21.5% -86.7%
S 162 145 1,997
11.2% -91.9%
Net 2,404 1,809 3,311
32.9% -27.4%
1 - L - Long or S – Short
Financial Consolidated, R$ million.
Risk Factor: EQUITY Jun-14 Mar-14 Jun-13
Variation
Counterparty Location L/S
Quarterly Annual
With Central Counterparty
Brazil L 927 553 1,417
67.6% -34.6%
S 931 570 1,432
63.4% -35.0%
Foreign L - - -
N/A N/A
S - - -
N/A N/A
No Central Counterparty
Brazil L 1 - -
N/A N/A
S 2 - -
N/A N/A
Foreign L - - -
N/A N/A
S - - -
N/A N/A
Net (4) (16) (15)
-74.0% -71.7%
1 - L - Long or S – Short
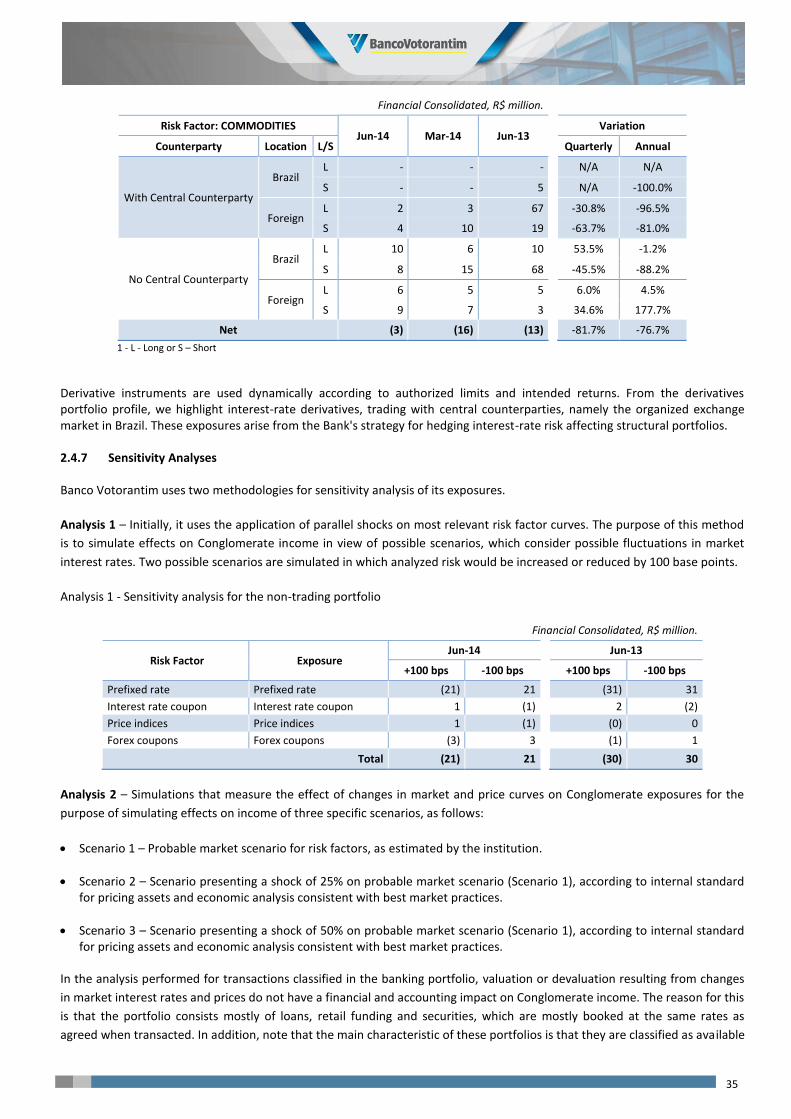
35
Financial Consolidated, R$ million.
Risk Factor: COMMODITIES Jun-14 Mar-14 Jun-13
Variation
Counterparty Location L/S
Quarterly Annual
With Central Counterparty
Brazil L - - -
N/A N/A
S - - 5
N/A -100.0%
Foreign L 2 3 67
-30.8% -96.5%
S 4 10 19
-63.7% -81.0%
No Central Counterparty
Brazil L 10 6 10
53.5% -1.2%
S 8 15 68
-45.5% -88.2%
Foreign L 6 5 5
6.0% 4.5%
S 9 7 3
34.6% 177.7%
Net (3) (16) (13)
-81.7% -76.7%
1 - L - Long or S – Short
Derivative instruments are used dynamically according to authorized limits and intended returns. From the derivatives portfolio profile, we highlight interest-rate derivatives, trading with central counterparties, namely the organized exchange market in Brazil. These exposures arise from the Bank's strategy for hedging interest-rate risk affecting structural portfolios.
2.4.7 Sensitivity Analyses
Banco Votorantim uses two methodologies for sensitivity analysis of its exposures.
Analysis 1 – Initially, it uses the application of parallel shocks on most relevant risk factor curves. The purpose of this method
is to simulate effects on Conglomerate income in view of possible scenarios, which consider possible fluctuations in market
interest rates. Two possible scenarios are simulated in which analyzed risk would be increased or reduced by 100 base points.
Analysis 1 - Sensitivity analysis for the non-trading portfolio
Financial Consolidated, R$ million.
Risk Factor Exposure Jun-14
Jun-13
+100 bps -100 bps
+100 bps -100 bps
Prefixed rate Prefixed rate (21) 21
(31) 31
Interest rate coupon Interest rate coupon 1 (1)
2 (2)
Price indices Price indices 1 (1)
(0) 0
Forex coupons Forex coupons (3) 3
(1) 1
Total (21) 21
(30) 30
Analysis 2 – Simulations that measure the effect of changes in market and price curves on Conglomerate exposures for the
purpose of simulating effects on income of three specific scenarios, as follows:
Scenario 1 – Probable market scenario for risk factors, as estimated by the institution.
Scenario 2 – Scenario presenting a shock of 25% on probable market scenario (Scenario 1), according to internal standard for pricing assets and economic analysis consistent with best market practices.
Scenario 3 – Scenario presenting a shock of 50% on probable market scenario (Scenario 1), according to internal standard for pricing assets and economic analysis consistent with best market practices.
In the analysis performed for transactions classified in the banking portfolio, valuation or devaluation resulting from changes
in market interest rates and prices do not have a financial and accounting impact on Conglomerate income. The reason for this
is that the portfolio consists mostly of loans, retail funding and securities, which are mostly booked at the same rates as
agreed when transacted. In addition, note that the main characteristic of these portfolios is that they are classified as available
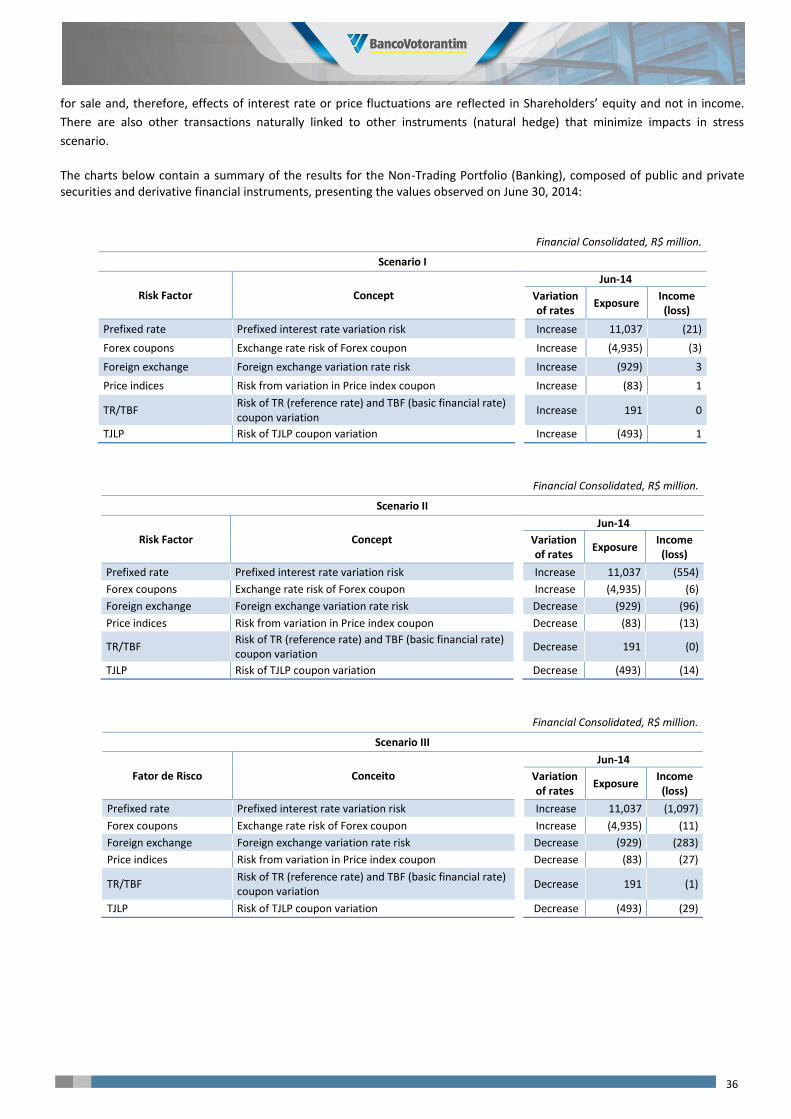
36
for sale and, therefore, effects of interest rate or price fluctuations are reflected in Shareholders’ equity and not in income.
There are also other transactions naturally linked to other instruments (natural hedge) that minimize impacts in stress
scenario.
The charts below contain a summary of the results for the Non-Trading Portfolio (Banking), composed of public and private securities and derivative financial instruments, presenting the values observed on June 30, 2014:
Financial Consolidated, R$ million.
Scenario I
Risk Factor Concept
Jun-14
Variation of rates
Exposure Income (loss)
Prefixed rate Prefixed interest rate variation risk
Increase 11,037 (21)
Forex coupons Exchange rate risk of Forex coupon
Increase (4,935) (3)
Foreign exchange Foreign exchange variation rate risk
Increase (929) 3
Price indices Risk from variation in Price index coupon
Increase (83) 1
TR/TBF Risk of TR (reference rate) and TBF (basic financial rate) coupon variation
Increase 191 0
TJLP Risk of TJLP coupon variation
Increase (493) 1
Financial Consolidated, R$ million.
Scenario II
Risk Factor Concept
Jun-14
Variation of rates
Exposure Income (loss)
Prefixed rate Prefixed interest rate variation risk
Increase 11,037 (554)
Forex coupons Exchange rate risk of Forex coupon
Increase (4,935) (6)
Foreign exchange Foreign exchange variation rate risk
Decrease (929) (96)
Price indices Risk from variation in Price index coupon
Decrease (83) (13)
TR/TBF Risk of TR (reference rate) and TBF (basic financial rate) coupon variation
Decrease 191 (0)
TJLP Risk of TJLP coupon variation
Decrease (493) (14)
Financial Consolidated, R$ million.
Scenario III
Fator de Risco Conceito
Jun-14
Variation of rates
Exposure Income (loss)
Prefixed rate Prefixed interest rate variation risk
Increase 11,037 (1,097)
Forex coupons Exchange rate risk of Forex coupon
Increase (4,935) (11)
Foreign exchange Foreign exchange variation rate risk
Decrease (929) (283)
Price indices Risk from variation in Price index coupon
Decrease (83) (27)
TR/TBF Risk of TR (reference rate) and TBF (basic financial rate) coupon variation
Decrease 191 (1)
TJLP Risk of TJLP coupon variation
Decrease (493) (29)
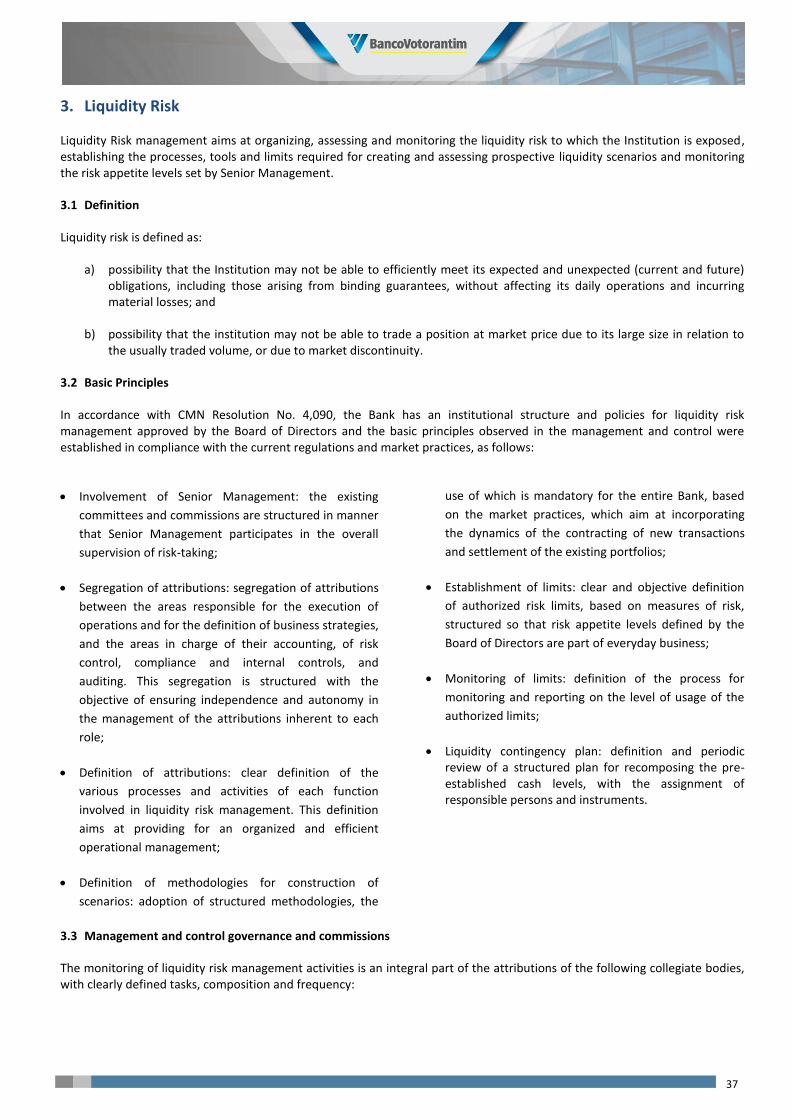
37
3. Liquidity Risk
Liquidity Risk management aims at organizing, assessing and monitoring the liquidity risk to which the Institution is exposed, establishing the processes, tools and limits required for creating and assessing prospective liquidity scenarios and monitoring the risk appetite levels set by Senior Management.
3.1 Definition
Liquidity risk is defined as:
a) possibility that the Institution may not be able to efficiently meet its expected and unexpected (current and future) obligations, including those arising from binding guarantees, without affecting its daily operations and incurring material losses; and
b) possibility that the institution may not be able to trade a position at market price due to its large size in relation to the usually traded volume, or due to market discontinuity.
3.2 Basic Principles
In accordance with CMN Resolution No. 4,090, the Bank has an institutional structure and policies for liquidity risk management approved by the Board of Directors and the basic principles observed in the management and control were established in compliance with the current regulations and market practices, as follows:
Involvement of Senior Management: the existing
committees and commissions are structured in manner
that Senior Management participates in the overall
supervision of risk-taking;
Segregation of attributions: segregation of attributions
between the areas responsible for the execution of
operations and for the definition of business strategies,
and the areas in charge of their accounting, of risk
control, compliance and internal controls, and
auditing. This segregation is structured with the
objective of ensuring independence and autonomy in
the management of the attributions inherent to each
role;
Definition of attributions: clear definition of the
various processes and activities of each function
involved in liquidity risk management. This definition
aims at providing for an organized and efficient
operational management;
Definition of methodologies for construction of
scenarios: adoption of structured methodologies, the
use of which is mandatory for the entire Bank, based
on the market practices, which aim at incorporating
the dynamics of the contracting of new transactions
and settlement of the existing portfolios;
Establishment of limits: clear and objective definition
of authorized risk limits, based on measures of risk,
structured so that risk appetite levels defined by the
Board of Directors are part of everyday business;
Monitoring of limits: definition of the process for
monitoring and reporting on the level of usage of the
authorized limits;
Liquidity contingency plan: definition and periodic review of a structured plan for recomposing the pre-established cash levels, with the assignment of responsible persons and instruments.
3.3 Management and control governance and commissions
The monitoring of liquidity risk management activities is an integral part of the attributions of the following collegiate bodies, with clearly defined tasks, composition and frequency:
38
Board of Directors:
Responsible for setting the basic guidelines of the Bank's general policy, and for checking and monitoring whether they are being complied with.
Executive Committee:
Responsible for discussing and monitoring recurring topics addressed in operational committees and commissions and continuously reviewing the internal governance structure, with a view to making improvements and approving potential adjustments and changes to internal governance operating committees, commissions and sub-commissions.
ALM, Risk and Capital Committee
Responsible for assessing and approving proposals submitted by subordinate Commissions when they refer to measures aimed at risk management and control.
Liquidity Commission:
Responsible for monitoring and deciding on matters related to risk liquidity management, submitting them to the follow-up of the ALM Risk and Capital Committee.
3.4 Areas Involved
Liquidity risk management includes a set of functional activities that permeate the entire “business chain” from product development, trading and disbursement, liquidity risk modeling and control and the formalization, accounting records and disbursement of transactions, as well as monitoring the effectiveness of processes and controls used.
Liquidity risk management functions are carried out by formally constituted functional units with technically capable staff under separate management with clearly defined responsibilities, as shown below:
Market risk and liquidity
Responsible for modeling methodologies and to validate the assumptions used to liquidity-risk scenarios and metrics;
Responsible for updating and periodically revising liquidity scenarios, liquidity contingency plan and for monitoring of authorized cash limits.
Treasury and Commercial Units
Responsible for executing trades and transactions with the market and clients, seeking fair prices all times and compliance for these transactions;
Responsible for the definition and periodic update of investment and funding assumptions and the implementation of the liquidity contingency plan, in compliance with the strategies defined and previously approved instruments.
Finance
Responsible for the preparation and delivery of the projected budget;
Responsible for monitoring portfolios and composition of assets, and evaluating proposals to issue subordinated debt instruments.
3.5 Liquidity Risk Management
3.5.1 Risk Measures and Limits for Management and Control
The Bank has a set of objective measures to manage and control liquidity risk:
Liquidity Target and Minimum Cash: consist of establishing minimum acceptable levels and ranges, setting limits for the various prospective liquidity scenarios;
Maturity scenarios: consist of the calculation of the future liquidity profile, based on the general maturity assumption of the current portfolios;
39
Budgetary scenarios: consist of the calculation of the future liquidity profile, using assumptions which are consistent with the budgetary planning, based on the general rollover assumption of the current portfolios;
Stress scenarios: consist of the simulations of impact on portfolios arising from extreme market conditions and/or the dynamics and composition of portfolios, which may change significant the Bank’s projected liquidity scenarios;
Sensitivity analyses: consist of the simulations of the sensitivity of the future liquidity profile to slight fluctuations in market conditions and/or the dynamics and composition of the portfolios; and
Funding Concentration Profile: consist of monitoring the concentration profile of the portfolios in terms of volumes, timing, tools, threads and counterparties.
Risk measures are used to set limits and for decision - making. These limits comprise the definition of the maximum authorized amounts through the establishment of minimum cash limits and contingency measures. The Market and Liquidity Risk area is responsible for the daily monitoring of liquidity risk and for notifying the competent forums in the event of an increase in risk.
The values determined for liquidity limits and in the contingency plan are updated and revised periodically in light of significant changes in market conditions or the dynamics and composition of portfolios.
3.5.2 Measurement Systems and Communication Process
The Bank adopts corporate systems for measuring and controlling liquidity risk, combining internally developed applications with market solutions of proven robustness. These systems deploy integrated treatment of information on a sequential basis:
capturing records of trading and registration data;
continuous updating and archiving of this information in structured databases, monitoring its integrity and consistency from an accounting point of view;
determining liquidity profile, by calculating rollover and maturity of transactions, according to the premises of the various scenarios under consideration.
In addition, the Bank has a structured process for reporting liquidity-risk management related issues. This communication process is comprised of:
periodically issuing objective reports showing liquidity scenarios and evolution of the profile of funding portfolios, and showing levels of use of authorized limits;
periodically holding collective monitoring forums, within decision-making competencies, in which current issues are discussed with full participation.
3.5.3 Notifying Limits Exceeded and Contingency Plan
There is a two-stage procedure for monitoring cash levels and a contingency plan: communication and monitoring.
Notification:
For notification purposes, the liquidity scenarios and metrics are submitted to the ALM Committee and Liquidity Risk Commission, where the variations are analyzed with predetermine trigger levels if there may be failure to maintain limits.
Monitoring:
Any eventual extrapolation of limits will necessarily lead to implementation of agreed business strategies, with investment and funding portfolio management to rebuild liquidity levels, including, if necessary, taking initiatives previously determined in the contingency plan;
These strategies are the responsibility of business managers, considering market conditions and are monitored by the Liquidity Commission and ALM, Risk and Capital Committee.
40
4. Operational Risk
4.1 Definition
Operational risk is defined as the possibility of losses arising from any failure, deficiency or inadequacy of internal processes, people or systems, or from external events. This definition includes the legal risk associated to the inadequacy or deficiency in contracts signed by the Institution, and to legal sanctions due to failure to abide by legal provisions and indemnities for damages to third parties arising from activities performed by the Institution.
4.2 Basic Principles
In accordance with CMN Resolution No. 3,380, the Bank has an institutional structure and policies for operational risk management approved by the Board of Directors and the basic principles observed in the management and control were established in compliance with the current regulations and best market practices, as follows:
Involvement by Senior Management in global supervision and risk assumption by means of established committees and commissions;
Mapping systemic and operational processes, mapping existing controls, and analysis of inherent and residual risks;
Evaluation of the potential financial impact and of the vulnerability of the control environment to the mapped risks. Based on this assessment, operating risk level is defined according to entire institution’s standard risk matrix;
Capturing operational losses and maintaining a structured database with information relating to events;
Analysis, communication, and deployment of action plans to improve processes and controls for mitigation of the risks incurred; and
Calculating Capital allocated to operating risk based on structured methods, based on market practices that are appropriate with regulatory requirements.
4.3 Areas Involved
Operational risk management is carried out by formally constituted functionally segregated units staffed by qualified teams with clearly defined attributions, as shown below:
Internal Controls Unit
Responsible by:
Providing support in the identification and assessment of the operational risks and controls existing in the areas and processes of the Institution, including relevant outsourced services;
Evaluate the design and test the effectiveness of the controls of business, support and IT processes;
Assess the adequacy of the technological architecture made available by the Technology area, as well as the integrity of the systemic interfaces that affect internal risk models;
Monitoring the progress and implementation of action plans developed to mitigate operational risks and promote improvements in the control environment;
Providing methodologies, models and tools to assure the identification and monitoring of relevant risks;
Training and fostering a culture of internal controls to the Institution’s employees;
Informing the Controls Committee the results of mapping assessment, evaluating and testing of control, as well as risks and relevant potential weaknesses found.
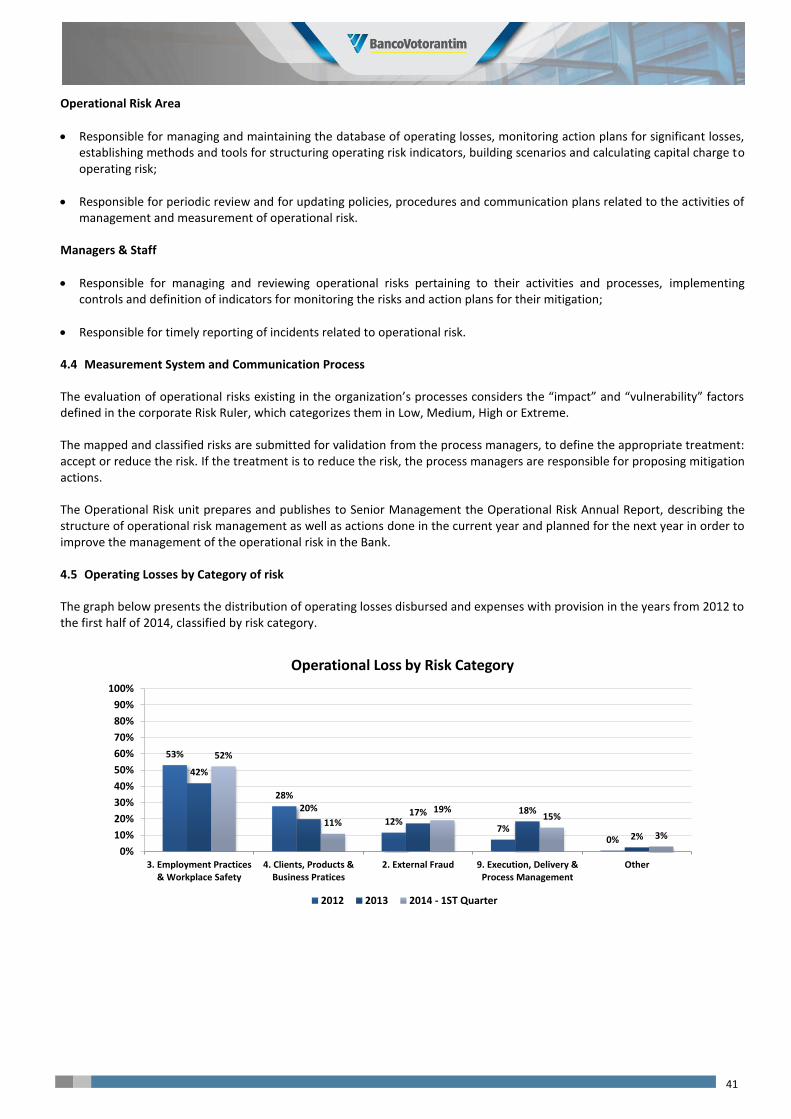
41
Operational Risk Area
Responsible for managing and maintaining the database of operating losses, monitoring action plans for significant losses, establishing methods and tools for structuring operating risk indicators, building scenarios and calculating capital charge to operating risk;
Responsible for periodic review and for updating policies, procedures and communication plans related to the activities of management and measurement of operational risk.
Managers & Staff
Responsible for managing and reviewing operational risks pertaining to their activities and processes, implementing controls and definition of indicators for monitoring the risks and action plans for their mitigation;
Responsible for timely reporting of incidents related to operational risk.
4.4 Measurement System and Communication Process
The evaluation of operational risks existing in the organization’s processes considers the “impact” and “vulnerability” factors defined in the corporate Risk Ruler, which categorizes them in Low, Medium, High or Extreme.
The mapped and classified risks are submitted for validation from the process managers, to define the appropriate treatment: accept or reduce the risk. If the treatment is to reduce the risk, the process managers are responsible for proposing mitigation actions.
The Operational Risk unit prepares and publishes to Senior Management the Operational Risk Annual Report, describing the structure of operational risk management as well as actions done in the current year and planned for the next year in order to improve the management of the operational risk in the Bank.
4.5 Operating Losses by Category of risk
The graph below presents the distribution of operating losses disbursed and expenses with provision in the years from 2012 to the first half of 2014, classified by risk category.
53%
28%
12%7%
0%
42%
20% 17% 18%
2%
52%
11%
19%15%
3%
0%
10%
20%
30%
40%
50%
60%
70%
80%
90%
100%
3. Employment Practices& Workplace Safety
4. Clients, Products &Business Pratices
2. External Fraud 9. Execution, Delivery &Process Management
Other
Operational Loss by Risk Category
2012 2013 2014 - 1ST Quarter
42
4.6 Business Continuity Management
The Bank has a high-availability and highly-resilient technology environment, composed of the following elements:
Two hot site datacenters, built according to the safe room concept by Aceco, where the infrastructure to support critical systems is replicated – one of them in the Rochaverá building in Morumbi and the other in the BFC building on Avenida Paulista;
Data storage system at both data centers where the production databases are mirrored in a synchronous manner;
Application server pool and file-server cluster for critical processes and systems;
Tape units at both datacenters and external storage of the backup media;
Remote access to critical applications;
Tool for Internet access to accessible contingency plans;
The Business Continuity area uses the RPX system (Recovery Planner) to manage occurrences of interruption, definition of continuity plans and supporting documentation of the evidence of the tests and exercises applied.
For companies in the retail segment, the continuity plan encompasses the sites of third parties, such as card processing (EDS) and client service (Tivit and Contax). The corporate guidelines of Business Continuity Management involve policies, standards, procedures, roles and responsibilities targeting the implementation of effective Business Continuity and Crisis Management in the Organization, guaranteeing greater resilience in the presence of adverse situations.
Starting from the established concepts, principles and guidelines, the Consolidated Entity strengthens its risk management structure and its corporate governance, offers greater security to its clients and shareholders in the event of unforeseen incidents to potential crises and during recovery until return to normality.
The Information Security and Business Continuity area is the structure responsible for coordinating the information security and business continuity activities at the Consolidated Entity with the Business and Support areas and is, in principle, independent in the performance of its attributions.
The application of the Business Impact Analysis (BIA) methodology makes it possible to identify and classify the impact of business-critical processes, with regards to financial loss, image, reputation and legal risks, if they undergo the impact of any event that prevents them from being executed as usual. This business continuity discipline facilitates the strategic planning of the contingency plans of the Votorantim Consolidated Financial and Economic Entity and the prioritization of projects to fulfill the new needs and/or adequacy of existing plans.
From the BIA (Business Impact Analysis) evaluation stage, where the business processes of the Votorantim Consolidated Financial and Economic Entity are arranged according to their activity suspension cost, until the Criticality Analysis stage, where they are evaluated according to the impacts that the organization suffers due an interruption, the information submitted adds important indicators for the managers and persons in charge of the company’s senior management. The Business Impact Analysis (BIA) is used to assess business-critical processes, considering that the suspension of its activities may give rise to financial losses, damage to reputation, violation of laws, regulations, contracts and corporate policies. The classification of impact on business processes is measured through quantitative analysis, which assesses image risk from the perspective of clients, market and regulators, and/or quantitative analysis, which assesses potential financial impacts resulting from unavailability.
43
5. Equity Risk The equity risk is defined as the risk of losses arising from unconsolidated investments in the balance sheet. In short, they are the losses of interests recorded in the financial account of investments. The risk arises from the fact that the bank has investments in companies that (i) do not have majority interest and
consequently, do not predominate in the control of its management or (ii) are not part of the consolidation scope and
consequently, are not part of typical activities of financial entities, and that for various reasons (market, credit, operational,
liquidity, management and others), this company may affect the result of the consolidated financial entity.
Regarding the accounting policy for investments in companies, the institution abides by the rules established by BACEN, described in COSIF Basic Standards (Chapter 11, Fixed Assets items 1 and 2), whose content covers the rules or methods for valuation of investments and the methodologies applied to each situation, such as the equity method of accounting, and the assumptions to be adopted for the accounting processes. For the other permanent investments, the institution uses the cost method, applying the accounting rule of CPC 01 “Impairment of Assets” approved by BACEN by Resolution No. 3,566. This procedure aims to ensure that assets are not accounted for in an amount higher than that recoverable over time or in a potential sale.
See below the value of the equity interests represented by the investment account recorded in the institution’s assets:
Financial Consolidated, R$ million.
Investments in other entities Activity Segmentation
Jun-14
Book Valuel
1
BVIP - BV Inv. E Partic S.A Holdings of non-financial
institutions Close companies (0)
BVIA - BV Inv. E Gestão S.A Holdings of non-financial
institutions Close companies 28
Votorantim Corretora de Seguros S.A Brokers and insurance agents,
private pension plans and health Close companies 137
1 – Related companies are classified as close companies and the book value is the same as the fair value. There were no sales or liquidations without realization or recognition of earnings and losses for the period analyzed.
The institution has other investments characterized by tax incentives (FINOR), equity securities (CETIP and CIP), and shares and quotas (ANDIMA).Additional information can be found in note No. 13 of the Report of Consolidated Financial Statements, available on the Investor Relations website (www.bancovotorantim.com.br/ir). For the period analyzed, the amount of capital requirement relating to equity interests not classified in the trading portfolio, according to criteria presented above, totaled R$ 18.2 million. Given the low relevance of equity not classified in the trading portfolio relative to the total asset portfolio, the institution does not perform the categorization of their holdings.
44
6. Other risks
In addition to the material risks described above, the institution also regards the risks listed below to be relevant, and has specific processes for their handling and monitoring, which form part of the scope of the Internal Capital Adequacy Assessment Process (ICAAP):
6.1 Reputation risk
The reputation risk is defined as the possibility of damage to the institution’s reputation as a result of the negative perception of clients, shareholders, investors, rating agencies, civil society, employees, trade unions and regulatory agencies, in relation to the institutions’ business practices, conduct or financial condition.
Reputation risk management is performed using specific processes contained in several areas of the institution, which are designed to mitigate the occurrence of events that affect reputation, and to act by containing the dissemination of these impacts, upon the occurrence of these events.
In addition, the Board of Executive Officers of Risks performs the integrated management of the reputation risk, by means of consolidated evaluations and monitoring of actions and reporting (among other activities) of the individual areas involved in the reputation risk mitigation process.
6.2 Strategy risk
The strategy risk is defined as the possibility of loss resulting from the use of an inadequate business strategy, assumption or policy, or absence thereof, including the absence of response to market changes and to factors outside the institution.
Strategy risk management is performed by means of a structured market assessment and monitoring, strategic planning and budgeting process, as well as through the monitoring and analysis of deviations between the projected and realized values and updates of projections over the year based on more up-to-date information.
6.3 Environmental and Social Risk
Environmental and social risk relating to the client/counterparty is the possibility of occurrence of losses due to the deterioration of the credit rating of a particular counterparty, resulting from involvement in inadequate practices relating to environmental and social issues.
The institution has specific evaluations on the environmental and social risk exposure of its credit activities and loans and is currently adapting its activities to comply with Resolution No. 4,327 relating to the Environmental and Social Responsibility Policy. Environmental and social risk management occurs with the application of the environmental and social risk analysis process that consists of evaluating the environmental and social aspects with which the client is involved with regards to Compliance with Environmental Legislation, Working Conditions, Use of Natural Resources and Waste Management, and of establishing its level of environmental and social risk according to the defined methodology.
6.4 Underwriting risk
The underwriting risk is defined as the possibility of losses originating from the issuance of third-party debts in which the institution is obliged to place these instruments in its active portfolio due to the execution of firm commitment clauses. Its management and control process is segregated into two views: the previous specific analysis of each operation with demand of firm commitment and the analysis of the consolidated exposure of operations with firm commitment.
6.5 Model Risk
The model risk is defined as the possibility of losses due to the deterioration of the predictive power or of errors in the development, implementation and calibration of financial models.
The control and mitigation of the model risk at the institution is mainly performed through (i) analyses of the predictive power, itemization and stability of its models, (ii) internal validation process, independent from the development and implementation processes, (iii) adequate maintenance of the control of versions of the modeling documents and (iv) monitoring the performance of models.
45
6.6 Risks Appetite
In addition to the risk management and mitigation processes described in the foregoing items, the institution has a risk appetite framework that consists of the declaration of the risk that the Bank is willing to accept to achieve its goals, and is monitored by means of indicators and their respective limits and reported to the Management Board of Risks and ALM, Risks and Capital Committee (CARC) and to the Board of Directors on a monthly basis.
F. Attachments
1. Composition of Total Capital (TC) - Appendix 1
See below a table with the breakdown of the Total Capital and information about the adequacy of this capital, as provided for
in Circular No. 3,716 for the base date June 2014:
Line Number
Common Equity Tier 1 Capital: instruments and reserves
Value (R$mil) Amount subject to pre-Basel III treatment (R$
mil)
Balance Sheet Reference
1 Directly issued qualifying Common Equity Tier 1 Capital instruments 7,125,761 - a
2 Retained earnings 277,816 - b, c
3 Accumulated other comprehensive income (and other reserves) 182,999 - b, c
4 Authorized Instruments to compose Common Equity Tier 1 Capital before Resolution No. 4,192, 2013
5 Common share capital issued by subsidiaries and held by third parties 1 1 - i
6 Common Equity Tier 1 Capital before regulatory adjustments 7,586,576 - -
Line Number
Common Equity Tier 1 Capital: regulatory adjustments Value (R$mil) Amount subject to pre-Basel III treatment (R$
mil)
Balance Sheet Reference
7 Prudential valuation adjustments - - -
8 Goodwill paid on acquisition of investments on the basis of expected future profitability
- - -
9 Intangibles Assets 746 3,730 h
10 Deferred Tax Assets on the negative base and tax loss of Social Contribution on Net Income and those originating from this contribution related to determination periods ended until December 31, 1998
113,749 568,745 d-e 2
11 Adjustments related to the fair value of derivative financial instruments used to hedge cash flow of hedged items that do not have their settings checkbox to market accounted
- - -
12 Shortfall of provisions to expected losses from institutions under internal ratings-based approach
- - -
13 Securitisation gain on sale
14 Gains and losses due to changes in own credit risk on fair valued liabilities
15 Defined-benefit pension fund net assets - - -
16 Shares or other instruments issued by itself allowed to compose the Common Equity Tier 1 Capital, acquired directly, indirectly or synthetically
- - -
17 Securitisation investments in eligible Common Equity Tier 1 Capital instruments
18
Aggregate value of holdings lower than 10% of the share capital from institutions authorized to operate by the Brazilian Central Bank or by a foreign financial institution that does not compose the conglomerate, companies resembled the open unconsolidated financial institutions, the insurance companies, reinsurers, capitalization and pension entities, that exceeds 10% of Common Equity Tier 1 Capital value, not considering specific adjustments
- - -
19
Holdings higher than 10% of the share capital from institutions authorized to operate by the Brazilian Central Bank or by a unconsolidated foreign financial institutions, companies resembled the open unconsolidated financial institutions, the insurance companies, reinsurers, capitalization and pension entities
- - -
46
20 Mortgage servicing rights
21 Deferred tax assets arising from temporary differences (amount above 10% threshold, net of related tax liability)
168,250 841,251 f-e 3
22 Amount exceeding the 15% of the Common Equity Tier 1 - - -
23
of which: holdings on the share capital from institutions authorized to operate by the Brazilian Central Bank or by a unconsolidated foreign financial institutions, companies resembled the open unconsolidated financial institutions, the insurance companies, reinsurers, capitalization and pension entities
- - -
24 of which: mortgage servicing rights
25 of which: deferred Tax Assets that rely on future profitability or future taxable income for their realization
- - -
26 National regulatory adjustments 47,635 - -
26.a Deferred permanent assets 47,635 - g
26.b Investment on dependence, foreign subsidiary financial institution or non-financial entity that compose the cluster, for which the Brazilian Central Bank has no access to information, data and documents
- - -
26.c Funding instruments eligible to Common Equity Tier 1 Capital issued by an institution authorized to operate by the Brazilian Central Bank or by a foreign financial institution that does not compose the conglomerate
- - -
26.d Unauthorized increase in share capital - - -
26.e Excess of the adjusted value of Common Equity Tier 1 Capital - - -
26.f Deposit to cover capital deficiency - - -
26.g Amount of intangible assets constituted before Resolution No. 4192, 2013 - 36,949 l
26.h Excess funds invested in fixed assets -
26.i Total Capital featured -
26.j Other differences concerning the methodology of Common Equity Tier 1 Capital's calculation for regulatory purposes
-
27 Regulatory adjustments applied to Common Equity Tier 1 Capital due to insufficient Additional Tier 1 Capital and Tier 2 Capital to cover deductions
- - -
28 Total regulatory adjustments to Common equity Tier 1 Capital 330,380 - -
29 Common Equity Tier 1 Capital (CET1) 7,256,196 - -
Line Number
Additional Tier 1 Capital: instruments Value (R$mil) Amount subject to pre-Basel III treatment (R$
mil)
Balance Sheet Reference
30 Directly issued qualifying Additional Tier 1 Capital instruments - - -
31 of which: classified as equity under applicable accounting standards - - -
32 of which: classified as liabilities under applicable accounting standards - - -
33 Authorized Instruments to compose Additional Tier 1 Capital before Resolution No. 4,192, 2013
- - -
34 Noncontrolling interest in subsidiary members of the conglomerate, not deductible from Additional Tier 1 Capital
- - -
35 of which: instruments issued by subsidiaries before Resolution No. 4,192, 2013
- - -
36 Additional Tier 1 Capital before regulatory adjustments - - -
Line Number
Additional Tier 1 Capital: regulatory adjustments Value (R$mil) Amount subject to pre-Basel III treatment (R$
mil)
Balance Sheet Reference
37 Shares or other instruments issued by itself allowed to compose the Additional Tier 1 Capital, acquired directly, indirectly or synthetically
- - -
38 Reciprocal cross-holdings in Additional Tier 1 Capital instruments
39
Aggregate value of holdings lower than 10% of the share capital from institutions authorized to operate by the Brazilian Central Bank or by a foreign financial institution that does not compose the conglomerate, that exceeds 10% of Additional Tier 1 Capital value
-
40 Investments higher than 10% of the share capital from institutions authorized to operate by the Brazilian Central Bank or by a foreign financial institution that does not compose the conglomerate
-
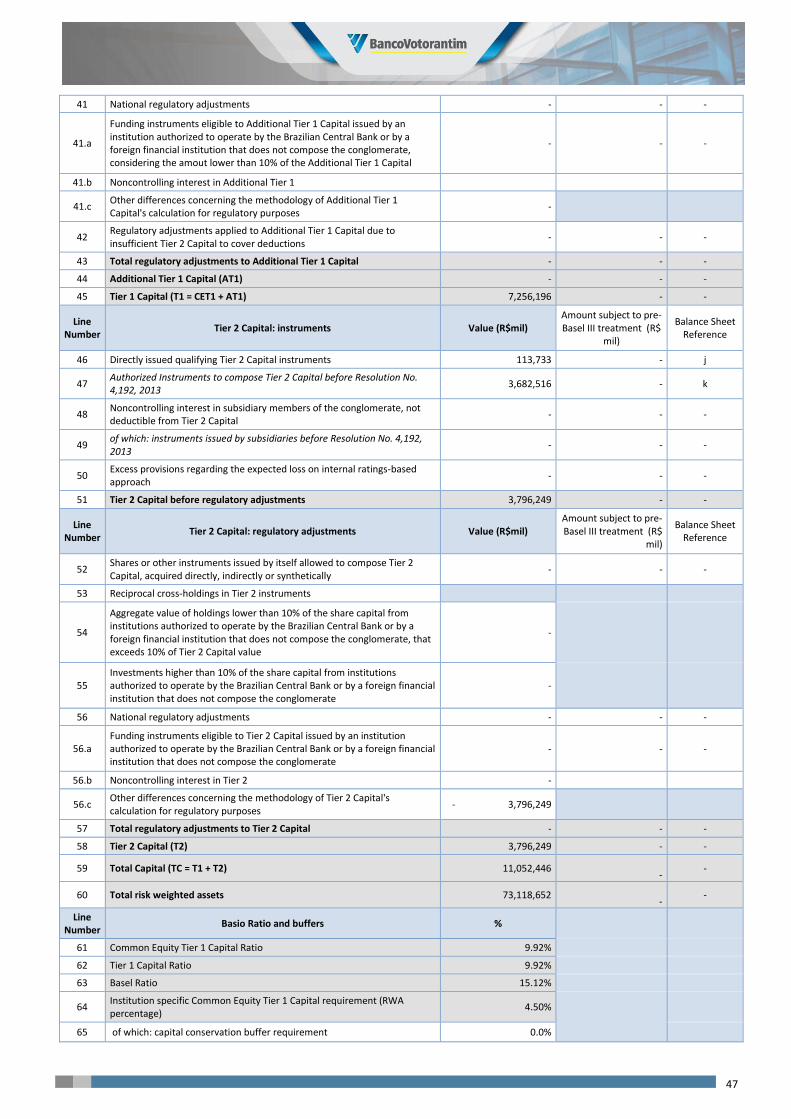
47
41 National regulatory adjustments - - -
41.a
Funding instruments eligible to Additional Tier 1 Capital issued by an institution authorized to operate by the Brazilian Central Bank or by a foreign financial institution that does not compose the conglomerate, considering the amout lower than 10% of the Additional Tier 1 Capital
- - -
41.b Noncontrolling interest in Additional Tier 1
41.c Other differences concerning the methodology of Additional Tier 1 Capital's calculation for regulatory purposes
-
42 Regulatory adjustments applied to Additional Tier 1 Capital due to insufficient Tier 2 Capital to cover deductions
- - -
43 Total regulatory adjustments to Additional Tier 1 Capital - - -
44 Additional Tier 1 Capital (AT1) - - -
45 Tier 1 Capital (T1 = CET1 + AT1) 7,256,196 - -
Line Number
Tier 2 Capital: instruments Value (R$mil) Amount subject to pre-Basel III treatment (R$
mil)
Balance Sheet Reference
46 Directly issued qualifying Tier 2 Capital instruments 113,733 - j
47 Authorized Instruments to compose Tier 2 Capital before Resolution No. 4,192, 2013
3,682,516 - k
48 Noncontrolling interest in subsidiary members of the conglomerate, not deductible from Tier 2 Capital
- - -
49 of which: instruments issued by subsidiaries before Resolution No. 4,192, 2013
- - -
50 Excess provisions regarding the expected loss on internal ratings-based approach
- - -
51 Tier 2 Capital before regulatory adjustments 3,796,249 - -
Line Number
Tier 2 Capital: regulatory adjustments Value (R$mil) Amount subject to pre-Basel III treatment (R$
mil)
Balance Sheet Reference
52 Shares or other instruments issued by itself allowed to compose Tier 2 Capital, acquired directly, indirectly or synthetically
- - -
53 Reciprocal cross-holdings in Tier 2 instruments
54
Aggregate value of holdings lower than 10% of the share capital from institutions authorized to operate by the Brazilian Central Bank or by a foreign financial institution that does not compose the conglomerate, that exceeds 10% of Tier 2 Capital value
-
55 Investments higher than 10% of the share capital from institutions authorized to operate by the Brazilian Central Bank or by a foreign financial institution that does not compose the conglomerate
-
56 National regulatory adjustments - - -
56.a Funding instruments eligible to Tier 2 Capital issued by an institution authorized to operate by the Brazilian Central Bank or by a foreign financial institution that does not compose the conglomerate
- - -
56.b Noncontrolling interest in Tier 2 -
56.c Other differences concerning the methodology of Tier 2 Capital's calculation for regulatory purposes
- 3,796,249
57 Total regulatory adjustments to Tier 2 Capital - - -
58 Tier 2 Capital (T2) 3,796,249 - -
59 Total Capital (TC = T1 + T2) 11,052,446
- -
60 Total risk weighted assets 73,118,652
- -
Line Number
Basio Ratio and buffers %
61 Common Equity Tier 1 Capital Ratio 9.92%
62 Tier 1 Capital Ratio 9.92%
63 Basel Ratio 15.12%
64 Institution specific Common Equity Tier 1 Capital requirement (RWA percentage)
4.50%
65 of which: capital conservation buffer requirement 0.0%
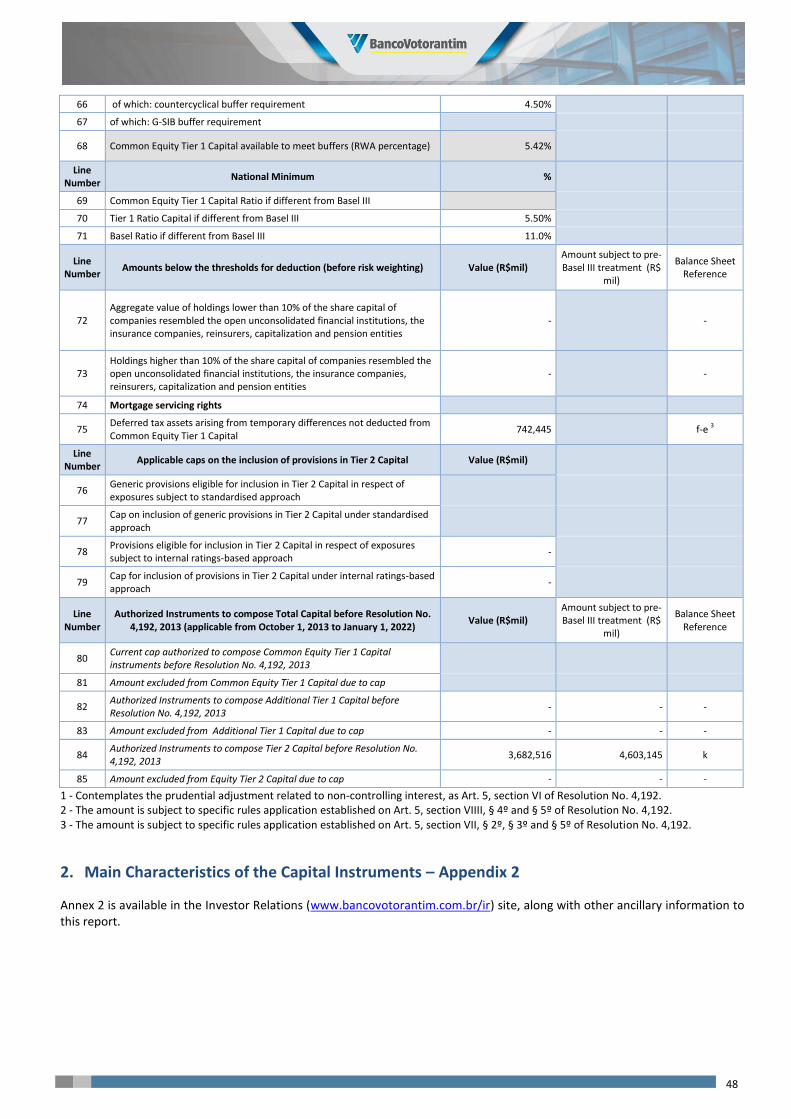
48
66 of which: countercyclical buffer requirement 4.50%
67 of which: G-SIB buffer requirement
68 Common Equity Tier 1 Capital available to meet buffers (RWA percentage) 5.42%
Line Number
National Minimum %
69 Common Equity Tier 1 Capital Ratio if different from Basel III
70 Tier 1 Ratio Capital if different from Basel III 5.50%
71 Basel Ratio if different from Basel III 11.0%
Line Number
Amounts below the thresholds for deduction (before risk weighting) Value (R$mil) Amount subject to pre-Basel III treatment (R$
mil)
Balance Sheet Reference
72 Aggregate value of holdings lower than 10% of the share capital of companies resembled the open unconsolidated financial institutions, the insurance companies, reinsurers, capitalization and pension entities
-
-
73 Holdings higher than 10% of the share capital of companies resembled the open unconsolidated financial institutions, the insurance companies, reinsurers, capitalization and pension entities
-
-
74 Mortgage servicing rights
75 Deferred tax assets arising from temporary differences not deducted from Common Equity Tier 1 Capital
742,445 f-e 3
Line Number
Applicable caps on the inclusion of provisions in Tier 2 Capital Value (R$mil)
76 Generic provisions eligible for inclusion in Tier 2 Capital in respect of exposures subject to standardised approach
77 Cap on inclusion of generic provisions in Tier 2 Capital under standardised approach
78 Provisions eligible for inclusion in Tier 2 Capital in respect of exposures subject to internal ratings-based approach
-
79 Cap for inclusion of provisions in Tier 2 Capital under internal ratings-based approach
-
Line Number
Authorized Instruments to compose Total Capital before Resolution No. 4,192, 2013 (applicable from October 1, 2013 to January 1, 2022)
Value (R$mil) Amount subject to pre-Basel III treatment (R$
mil)
Balance Sheet Reference
80 Current cap authorized to compose Common Equity Tier 1 Capital instruments before Resolution No. 4,192, 2013
81 Amount excluded from Common Equity Tier 1 Capital due to cap
82 Authorized Instruments to compose Additional Tier 1 Capital before Resolution No. 4,192, 2013
- - -
83 Amount excluded from Additional Tier 1 Capital due to cap - - -
84 Authorized Instruments to compose Tier 2 Capital before Resolution No. 4,192, 2013
3,682,516 4,603,145 k
85 Amount excluded from Equity Tier 2 Capital due to cap - - -
1 - Contemplates the prudential adjustment related to non-controlling interest, as Art. 5, section VI of Resolution No. 4,192. 2 - The amount is subject to specific rules application established on Art. 5, section VIIII, § 4º and § 5º of Resolution No. 4,192. 3 - The amount is subject to specific rules application established on Art. 5, section VII, § 2º, § 3º and § 5º of Resolution No. 4,192.
2. Main Characteristics of the Capital Instruments – Appendix 2
Annex 2 is available in the Investor Relations (www.bancovotorantim.com.br/ir) site, along with other ancillary information to this report.
49
G. Glossary
Multiple Bank: private financial institution that performs the active and ancillary operations of the various financial
institutions through the following portfolios: commercial, investment and / or development of real estate loans, leases and
credit, financing and investment;
Capital Requirement: It is the capital representation of the Risk Weighted Assets, determined by Factor F x RWA;
Tier I Capital: obtained by adding the Common Equity Tier I Capital and Additional Tier I Capital, as defined in Resolution No.
4,192 of the CMN;
Common Equity Tier I: it is the composition of the Shareholders' Equity and specific deductions, as defined in Resolution No.
4,192 of the CMN;
Basel Committee on Banking Supervision: Forum for regular cooperation on banking supervisory matters. Its objective is to
enhance understanding of key supervisory issues and improve the quality of banking supervision worldwide;
ICAAP: Internal Capital Adequacy Assessment Process;
Basel Ratio: Index that measures the relation between capital and risk weighted assets;
Behavior Score Model: System that assigns scores to a lot of credit decisions variables to a borrower, including the historical
purchase and customer payments, through the application of statistical techniques, in order to identify features that
segregate the good from the bad customers;
Collection Score Model: it is a model that seeks to identify the likelihood of the customer payment after default, used to
optimize the credit recovery process. Through statistical techniques, it is attributed scores to several variables (historical
payment, contract information, etc.) that make up the final score of the customer, identifying its payment profile;
Credit Score Model: Similar to Behavior Scoring Model, however, does not consider the historical variables customer in
modeling;
Capital (PR): PR is the capital used as the basis for verification compliance with operational limits of financial institutions. Its
value is obtained by adding Tier 1 Capital and Tier 2 Capital, as defined by National Monetary Council (CMN) Resolution 4192;
Rating: System to rate credit quality of an individual, company or country.
RWA: Risk Weighted Assets.