Embed Size (px)
Citation preview
Final project 2019
RIPARIAN FOREST DEGRADATION IN GORNO-BADAKHSHAN
AUTONOMUS OBLAST (GBAO): PROBLEMS AND SOLUTIONS
Haqrizobek Nurmamadov
Public Foundation of CAMP Tabiat.
9 Sohibnazarov str. Khorog, GBAO Tajikistan
Supervisor Friðþór Sófus Sigurmundsson
Þjóðskrá Íslands
ABSTRACT
Forest is the most important ecosystem in the high Pamir Mountain region. It has an important
role in the socio-economical livelihoods of the local community where people are highly
dependent on the forest resources. Firewood from the forest, given the harsh climatic conditions
and long rigorous winters for the Western Pamir, remains the most valuable energy source, for
both cooking and heating. Other alternatives are limited, or people are not able to access them.
The huge demands on firewood are the highest pressure on the forest ecosystem and are causing
the main challenge of forest degradation. By conducting this case study, I was able to
understand the main factors of forest degradation and suggest possible solutions. In this
research, I investigated the pressure on the forest by accounting for the consumers’ demands
on energy resources and compared it with the growth of population, and with factors which
influence forest growth as well. I surveyed three villages with a total of 48 households and
conducted three focus group discussions for mapping the village resources. This study
discovered that due to scarcity of fuel biomass people are still heavily relying on firewood for
heating and cooking. The average annual consumption per household was estimated at 6 m3.
The factors which influenced firewood consumption were limited access to other alternative
energy resources in terms of their high price and affordability, a long and rigorous winter, the
big size of the traditional houses and bad insulation of the buildings. The positive outcomes
obtained through a survey were that 52% of the respondents were satisfied with the availability
of electricity to use for cooking and that the quantity of firewood used had decreased to some
extent. The destructive factors of forest degradation revealed included uncontrolled grazing,
flooding, and settlement encroachment into forest bare plots, all of which had an enormous
negative impact.
Keywords: pressure, firewood, grazing, flooding, Western Pamir.
Land Restoration Training Programme
Keldnaholt, 112 Reykjavik, Iceland
UNU Land Restoration Training Programme
ii
This paper should be cited as:
Nurmamadov H (2019) Riparian forest degradation in Gorno-Badakhshan Autonomous
Oblast (GBAO): problems and solutions. United Nations University Land Restoration
Training Programme [final project]
https://www.grocentre.is/static/gro/publication/725/document/nurmamadov2019.pdf
UNU Land Restoration Training Programme
iii
TABLE OF CONTENTS
1. INTRODUCTION ................................................................................................................. 1
1.1 Project goal .......................................................................................................................... 3
1.1.1 Research objectives ........................................................................................................... 3
1.1.2 Research questions ............................................................................................................ 3
2. METHODOLOGY ................................................................................................................ 3
2.1 Study area............................................................................................................................. 3
2.2 Data collection and analyses ................................................................................................ 4
2.2.1 Semi-structured interviews ............................................................................................... 5
2.2.2 Community forest resource mapping ................................................................................ 5
2.2.3 Energy consumption analysis ........................................................................................... 5
2.2.4 Heating season period ....................................................................................................... 5
2.2.5 Comparative analysis of SFE statistical and field data on firewood harvesting and
consumption ............................................................................................................................... 6
3. RESULTS .............................................................................................................................. 6
3.1 The patterns of energy consumption .................................................................................... 6
3.1.1 Comparing the use of energy resources ............................................................................ 6
3.1.2 Duration of the heating season .......................................................................................... 7
3.1.3 Factors impacting the amount of fuelwood usage ............................................................ 8
3.1.4 The most used tree species for firewood ......................................................................... 11
3.1.5 Comparative analysis of SFE statistical and field data on firewood harvesting and
consumption ............................................................................................................................. 11
3.2 Uncontrolled grazing and overgrazing in the forest areas ................................................. 13
3.3 Community forest resource mapping ................................................................................. 14
3.4 House building in the forest areas ...................................................................................... 14
3.5 The impacts of flooding on forest areas ............................................................................. 16
4. DISCUSSION ...................................................................................................................... 17
4.1 The patterns of energy consumption .................................................................................. 17
4.1.1 Firewood as the main fuel energy source ....................................................................... 18
4.1.2 The most used tree species for firewood ......................................................................... 19
4.2. Comparative analyses of statistical data ........................................................................... 19
4.3 Uncontrolled grazing and overgrazing in forest areas ....................................................... 20
4.4 Settlement expansion into forest areas and the change in forest size and condition ......... 21
4.5 The impact of flooding on forest sites ............................................................................... 22
5. CONCLUSIONS AND RECOMMENDATIONS .............................................................. 22
ACKNOWLEDGEMENTS ..................................................................................................... 24

UNU Land Restoration Training Programme
iv
LITERATURE CITED ............................................................................................................ 25
APPENDICES ......................................................................................................................... 29
APPENDIX I. GUIDELINE FOR SEMI-STRUCTURED INTERVIEWS.......................... 29
APPENDIX II. FOCUS GROUP DISCUSSION GUIDELINE ............................................. 33
v
LIST OF FIGURES
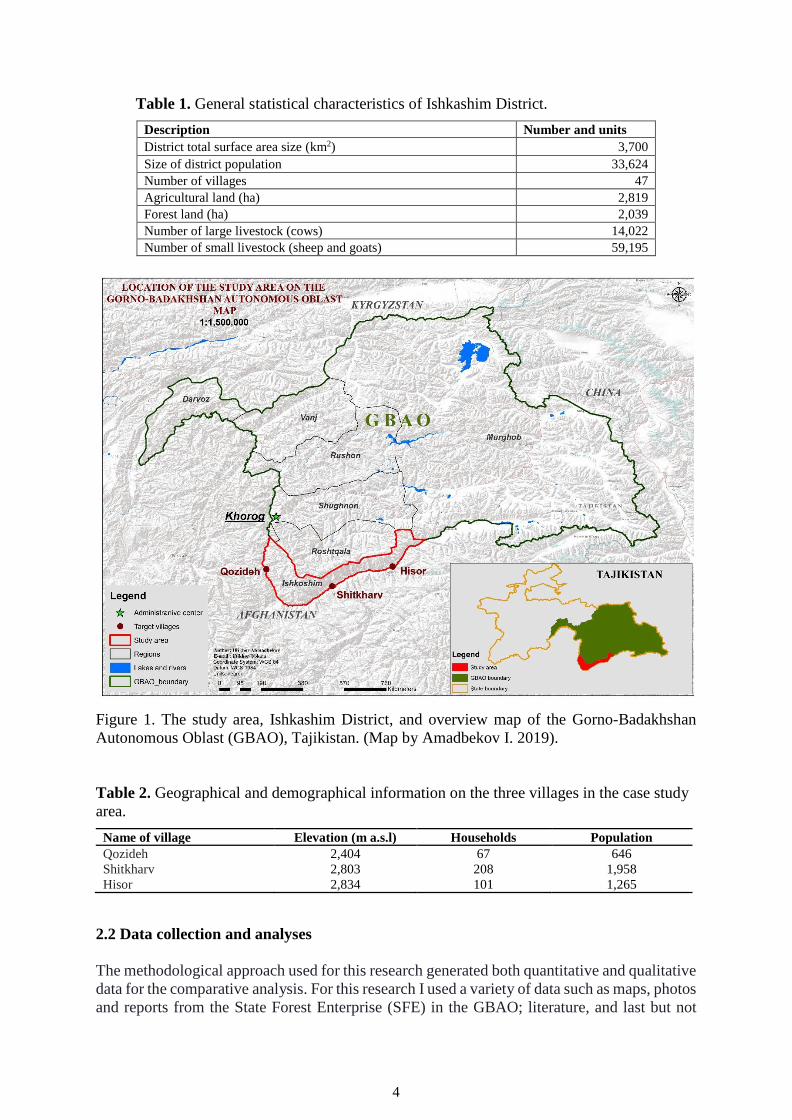
Figure 1. The study area, Ishkashim District, and overview map of the Gorno-Badakhshan
Autonomous Oblast (GBAO), Tajikistan .……………………………………………………4
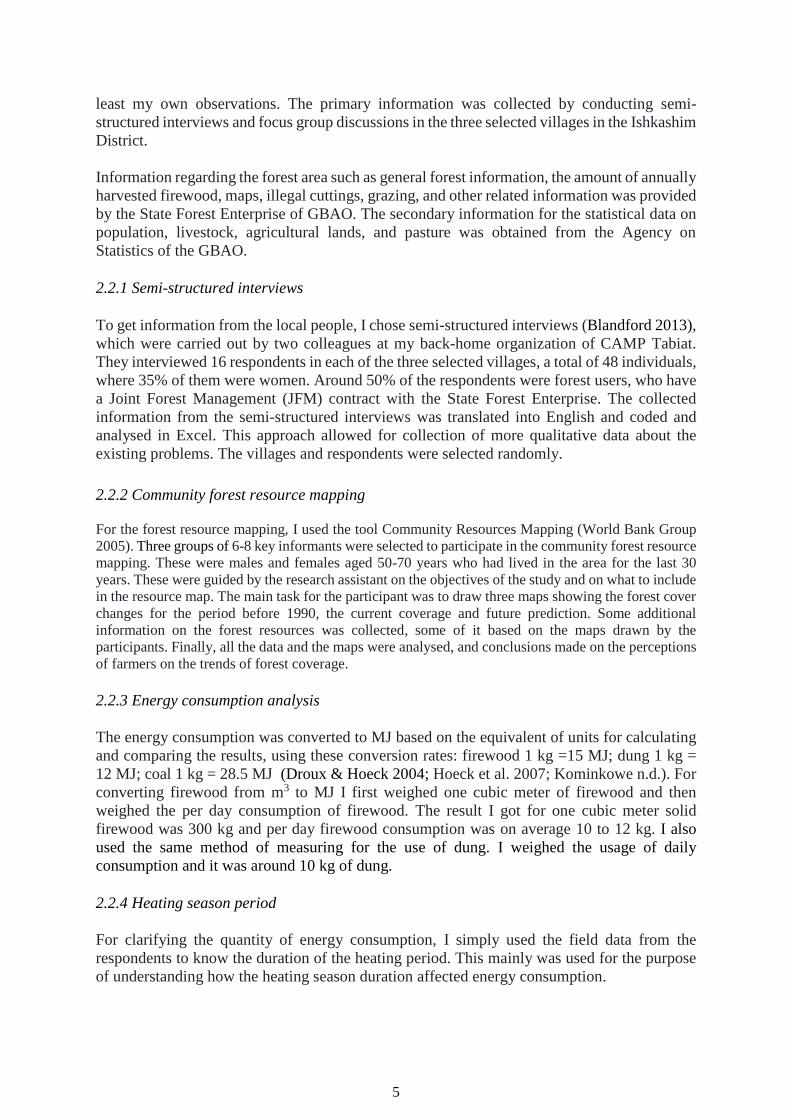
Figure 2. Energy consumption in the three target villages of the study area, based on the
semi-structured interviews …………………………………………………………………....7
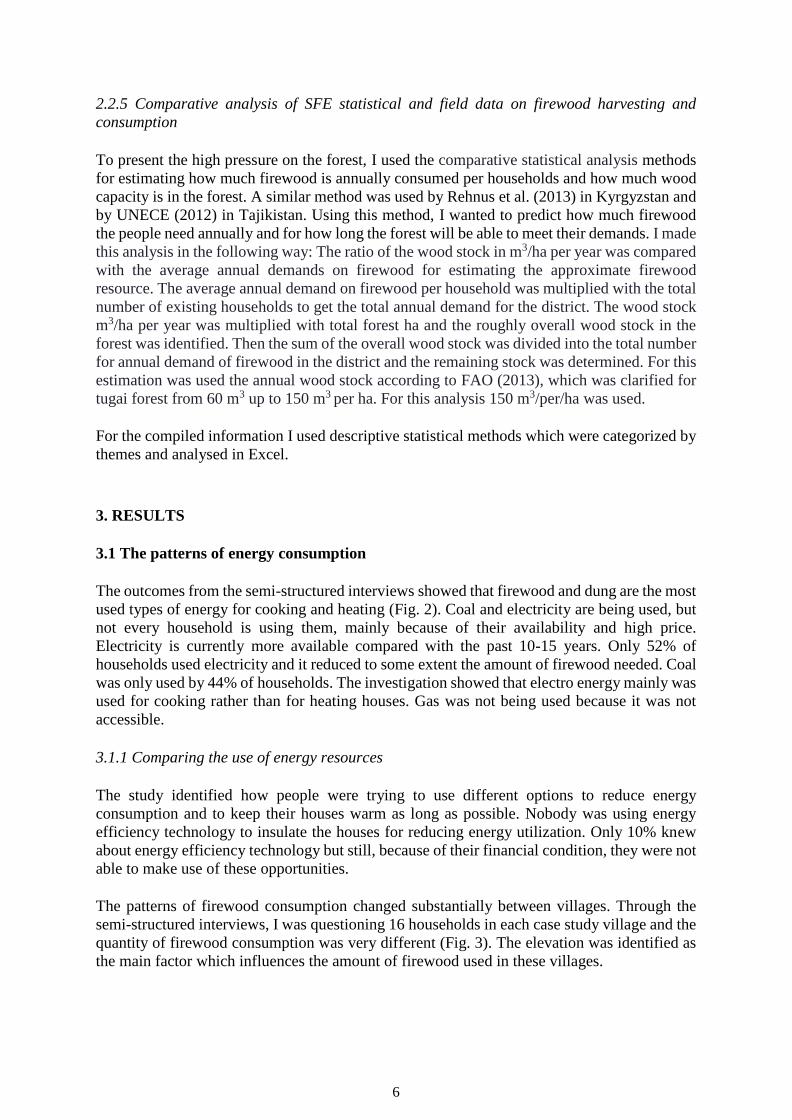
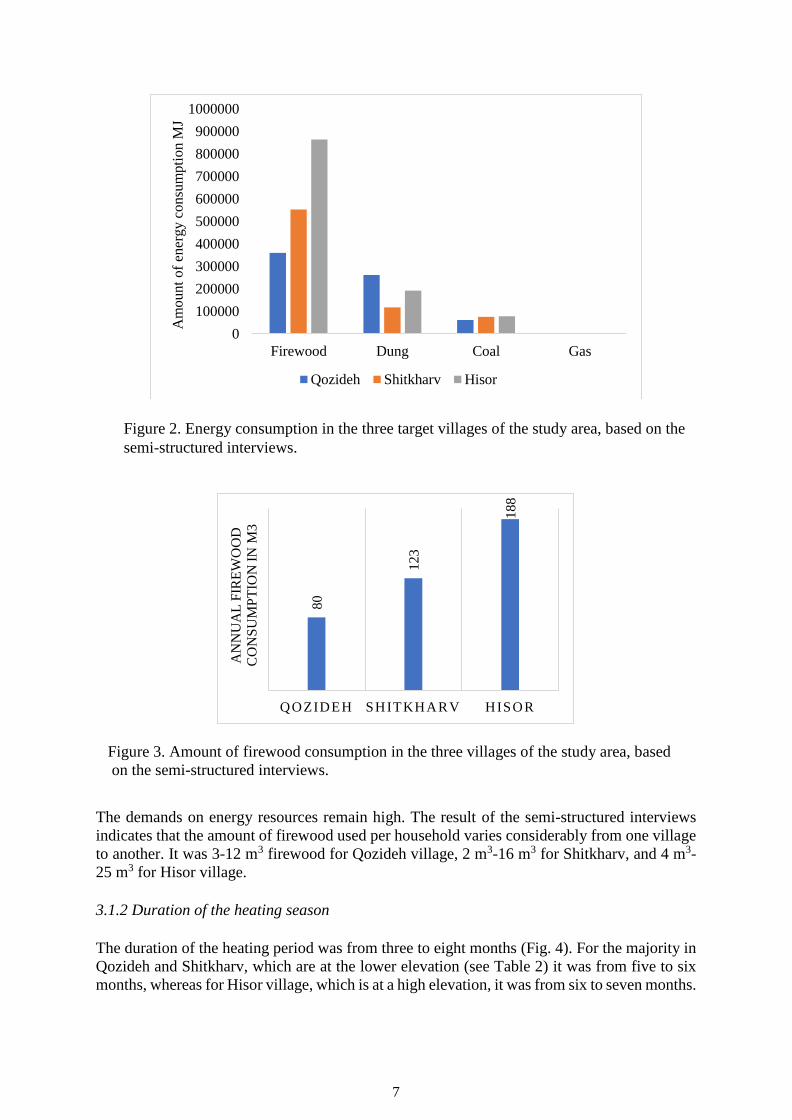
Figure 3. Amount of firewood consumption in the three villages of the study area, based on
the semi-structured interviews …………………………………………………………..........7
Figure 4. The duration of the heating season (months) for the three villages of the case study.
Based on semi-structured interviews ………………………………………………………….8
Figure 5. Factors impacting the amount of firewood energy consumption in the study area.
Based on the 48 respondents’ answers ………………………………………………………..8
Figure 6. The main firewood sources for the three case study villages. Based on the semi-
structured interviews ………………………………………………………………………….9
Figure 7. Ranking of the most commonly used energy sources for the three villages in the
study area, based on the 48 respondents’ answers ……………………………………………9
Figure 8. The patterns of forest use and its importance for the community in study areas. …10
Figure 9. The most used tree species for firewood in the tree villages ……………………..11
Figure 10. Average forest production capacity compared to the annual demand for firewood
………………………………………………………………………………………………..12
Figure 11. Livestock grazing in different seasons in the case study forest areas …………....13
Figure 12. The estimated numbers of grazed livestock in the village forests in the case study
area at different time periods ………………………………………………………………...13
Figure 13. Community Resource Mapping pictures by focus group participants in the target
villages. There are three maps for each village describing the change in forest cover and
shape over time.………………………………………………………………………………15
Figure 14. Explanations for house construction in forest areas, based on the semi-structured
interviews ………………………………………………………………………....................15
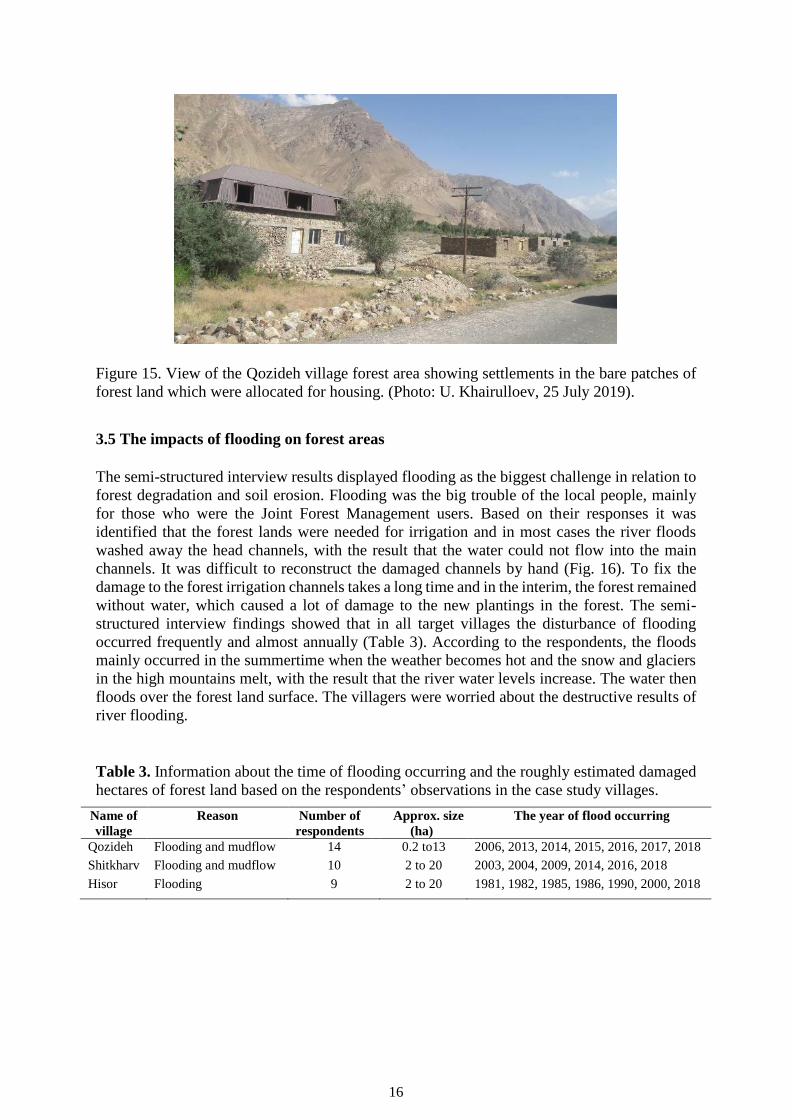
Figure 15. View of the Qozideh village forest area showing settlements in the bare patches of forest
land which were allocated for housing …………………….…...…………………………………….16
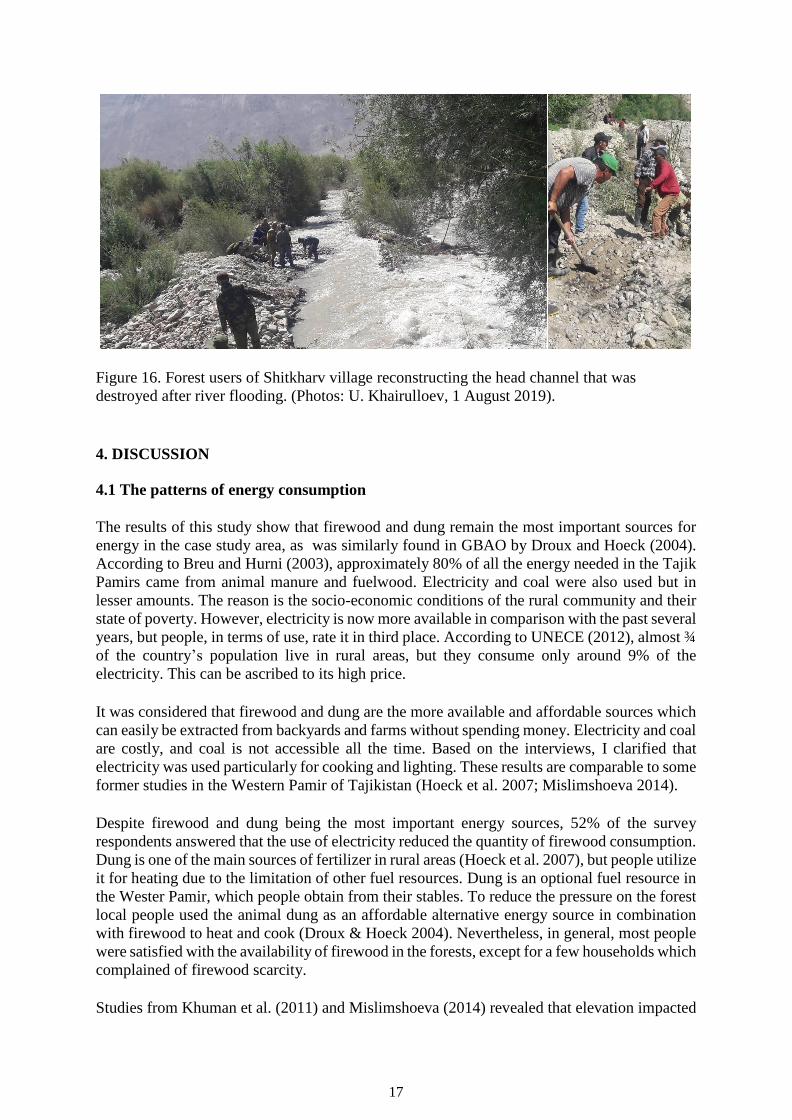
Figure 16. Forest users of Shitkharv village reconstructing the head channel that was
destroyed after river flooding ………………………………………………………………..17

vi
LIST OF TABLES
Table 1. General statistical characteristics of Ishkashim District …………………………….4
Table 2. Geographical and demographical information on the three villages in the case study
area. …………………………………………………………………………….……………..4
Table 3. Information about the time of flooding occurring and the roughly damaged hectares
of forest land based on respondent’s observations in case study villages ………………......16
1
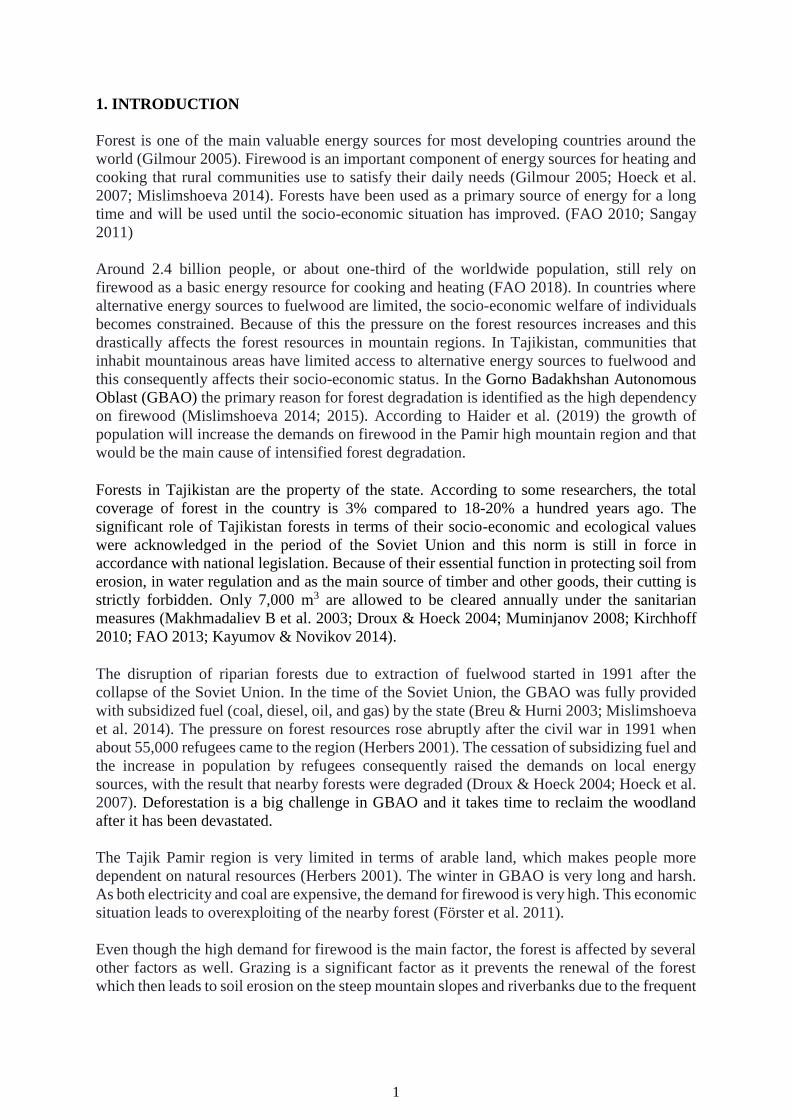
1. INTRODUCTION
Forest is one of the main valuable energy sources for most developing countries around the
world (Gilmour 2005). Firewood is an important component of energy sources for heating and
cooking that rural communities use to satisfy their daily needs (Gilmour 2005; Hoeck et al.
2007; Mislimshoeva 2014). Forests have been used as a primary source of energy for a long
time and will be used until the socio-economic situation has improved. (FAO 2010; Sangay
2011)
Around 2.4 billion people, or about one-third of the worldwide population, still rely on
firewood as a basic energy resource for cooking and heating (FAO 2018). In countries where
alternative energy sources to fuelwood are limited, the socio-economic welfare of individuals
becomes constrained. Because of this the pressure on the forest resources increases and this
drastically affects the forest resources in mountain regions. In Tajikistan, communities that
inhabit mountainous areas have limited access to alternative energy sources to fuelwood and
this consequently affects their socio-economic status. In the Gorno Badakhshan Autonomous
Oblast (GBAO) the primary reason for forest degradation is identified as the high dependency
on firewood (Mislimshoeva 2014; 2015). According to Haider et al. (2019) the growth of
population will increase the demands on firewood in the Pamir high mountain region and that
would be the main cause of intensified forest degradation.
Forests in Tajikistan are the property of the state. According to some researchers, the total
coverage of forest in the country is 3% compared to 18-20% a hundred years ago. The
significant role of Tajikistan forests in terms of their socio-economic and ecological values
were acknowledged in the period of the Soviet Union and this norm is still in force in
accordance with national legislation. Because of their essential function in protecting soil from
erosion, in water regulation and as the main source of timber and other goods, their cutting is
strictly forbidden. Only 7,000 m3 are allowed to be cleared annually under the sanitarian
measures (Makhmadaliev B et al. 2003; Droux & Hoeck 2004; Muminjanov 2008; Kirchhoff
2010; FAO 2013; Kayumov & Novikov 2014).
The disruption of riparian forests due to extraction of fuelwood started in 1991 after the
collapse of the Soviet Union. In the time of the Soviet Union, the GBAO was fully provided
with subsidized fuel (coal, diesel, oil, and gas) by the state (Breu & Hurni 2003; Mislimshoeva
et al. 2014). The pressure on forest resources rose abruptly after the civil war in 1991 when
about 55,000 refugees came to the region (Herbers 2001). The cessation of subsidizing fuel and
the increase in population by refugees consequently raised the demands on local energy
sources, with the result that nearby forests were degraded (Droux & Hoeck 2004; Hoeck et al.
2007). Deforestation is a big challenge in GBAO and it takes time to reclaim the woodland
after it has been devastated.
The Tajik Pamir region is very limited in terms of arable land, which makes people more
dependent on natural resources (Herbers 2001). The winter in GBAO is very long and harsh.
As both electricity and coal are expensive, the demand for firewood is very high. This economic
situation leads to overexploiting of the nearby forest (Förster et al. 2011).
Even though the high demand for firewood is the main factor, the forest is affected by several
other factors as well. Grazing is a significant factor as it prevents the renewal of the forest
which then leads to soil erosion on the steep mountain slopes and riverbanks due to the frequent
2
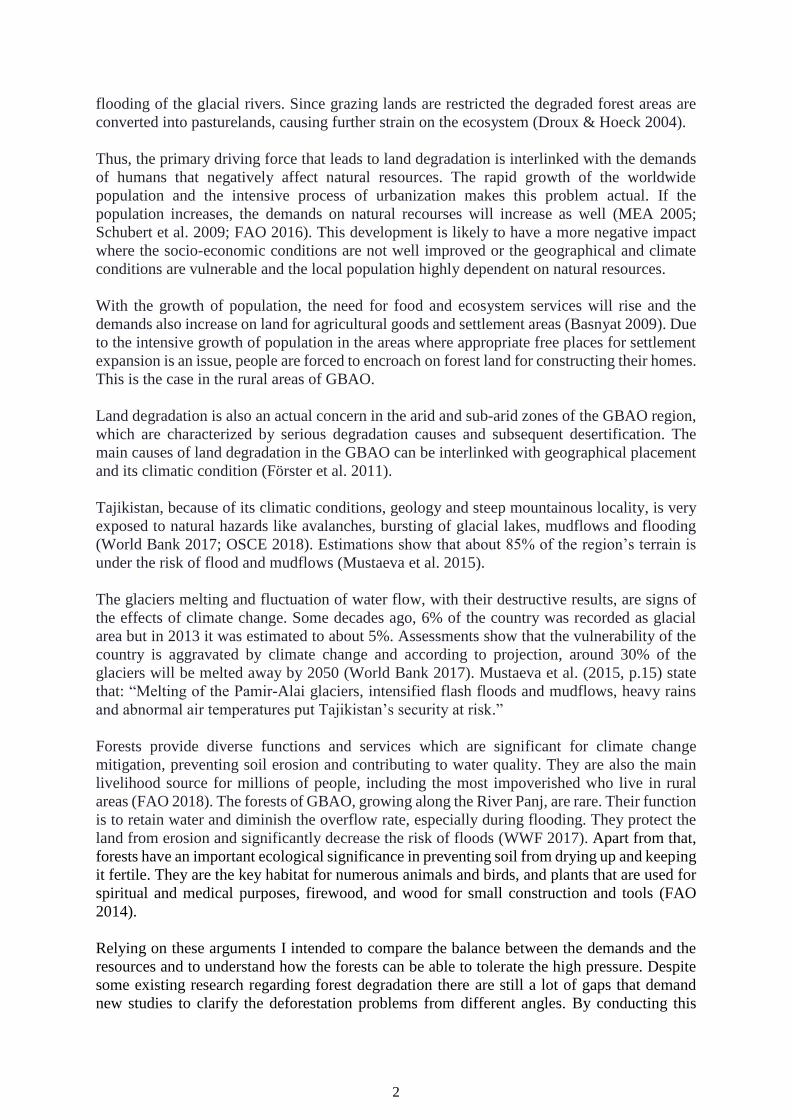
flooding of the glacial rivers. Since grazing lands are restricted the degraded forest areas are
converted into pasturelands, causing further strain on the ecosystem (Droux & Hoeck 2004).
Thus, the primary driving force that leads to land degradation is interlinked with the demands
of humans that negatively affect natural resources. The rapid growth of the worldwide
population and the intensive process of urbanization makes this problem actual. If the
population increases, the demands on natural recourses will increase as well (MEA 2005;
Schubert et al. 2009; FAO 2016). This development is likely to have a more negative impact
where the socio-economic conditions are not well improved or the geographical and climate
conditions are vulnerable and the local population highly dependent on natural resources.
With the growth of population, the need for food and ecosystem services will rise and the
demands also increase on land for agricultural goods and settlement areas (Basnyat 2009). Due
to the intensive growth of population in the areas where appropriate free places for settlement
expansion is an issue, people are forced to encroach on forest land for constructing their homes.
This is the case in the rural areas of GBAO.
Land degradation is also an actual concern in the arid and sub-arid zones of the GBAO region,
which are characterized by serious degradation causes and subsequent desertification. The
main causes of land degradation in the GBAO can be interlinked with geographical placement
and its climatic condition (Förster et al. 2011).
Tajikistan, because of its climatic conditions, geology and steep mountainous locality, is very
exposed to natural hazards like avalanches, bursting of glacial lakes, mudflows and flooding
(World Bank 2017; OSCE 2018). Estimations show that about 85% of the region’s terrain is
under the risk of flood and mudflows (Mustaeva et al. 2015).
The glaciers melting and fluctuation of water flow, with their destructive results, are signs of
the effects of climate change. Some decades ago, 6% of the country was recorded as glacial
area but in 2013 it was estimated to about 5%. Assessments show that the vulnerability of the
country is aggravated by climate change and according to projection, around 30% of the
glaciers will be melted away by 2050 (World Bank 2017). Mustaeva et al. (2015, p.15) state
that: “Melting of the Pamir-Alai glaciers, intensified flash floods and mudflows, heavy rains
and abnormal air temperatures put Tajikistan’s security at risk.”
Forests provide diverse functions and services which are significant for climate change
mitigation, preventing soil erosion and contributing to water quality. They are also the main
livelihood source for millions of people, including the most impoverished who live in rural
areas (FAO 2018). The forests of GBAO, growing along the River Panj, are rare. Their function
is to retain water and diminish the overflow rate, especially during flooding. They protect the
land from erosion and significantly decrease the risk of floods (WWF 2017). Apart from that,
forests have an important ecological significance in preventing soil from drying up and keeping
it fertile. They are the key habitat for numerous animals and birds, and plants that are used for
spiritual and medical purposes, firewood, and wood for small construction and tools (FAO
2014).
Relying on these arguments I intended to compare the balance between the demands and the
resources and to understand how the forests can be able to tolerate the high pressure. Despite
some existing research regarding forest degradation there are still a lot of gaps that demand
new studies to clarify the deforestation problems from different angles. By conducting this
3
research I intended to clarify some of the primary drivers which were leading to deforestation
and land degradation in the western part of the GBAO.
1.1 Project goal
The main goal of this project was to find out the primary driving forces behind the degradation
of forests and the associated land degradation, and the pressure on the limited firewood energy
source in the GBAO.
1.1.1 Research objectives
o Identify and analyse the pressure on the forests by accounting for the availability of the
resource compared to the consumers’ demands for forest products.
o Define the main causes of riparian forest degradation in the GBAO.
1.1.2 Research questions
o How many hectares of forest land exist in the district and what is the average cover?
o How much firewood do people need to use annually?
o Does the grazing effect the forest?
o What is the effect of settlement expansion on the forest area?
o Does the river flooding influence the forest land?
2. METHODOLOGY
2.1 Study area
Tajikistan is a mountainous country with several mountain ranges rising to 6,500 m a.s.l. and
the average elevation of the country is 3,186 m. a.s.l. making it the third highest country in the
world, only topped by Nepal and Bhutan (Curtis 2007).
The eastern part of Tajikistan, the Gorno Badakhshan Autonomous Oblast (GBAO) is the
largest region and makes up almost half of the country's land area, or 63,700 km2. It is also
called the Tajik Pamirs, and is divided into two parts; the Western and Eastern Pamirs (Droux
& Hoeck 2004). The Western Pamirs constitute the most mountainous area, with the altitude
ranging from 2,200 up to the highest peaks at nearly 7,500 m a.s.l. The climate of the Western
Pamirs is extremely cold in winters and moderately warm during the summers, with average
temperatures in June ranging from 18 to 20°C and the minimum temperature in January
typically -8°C to -2°C (Mislimshoeva 2014).
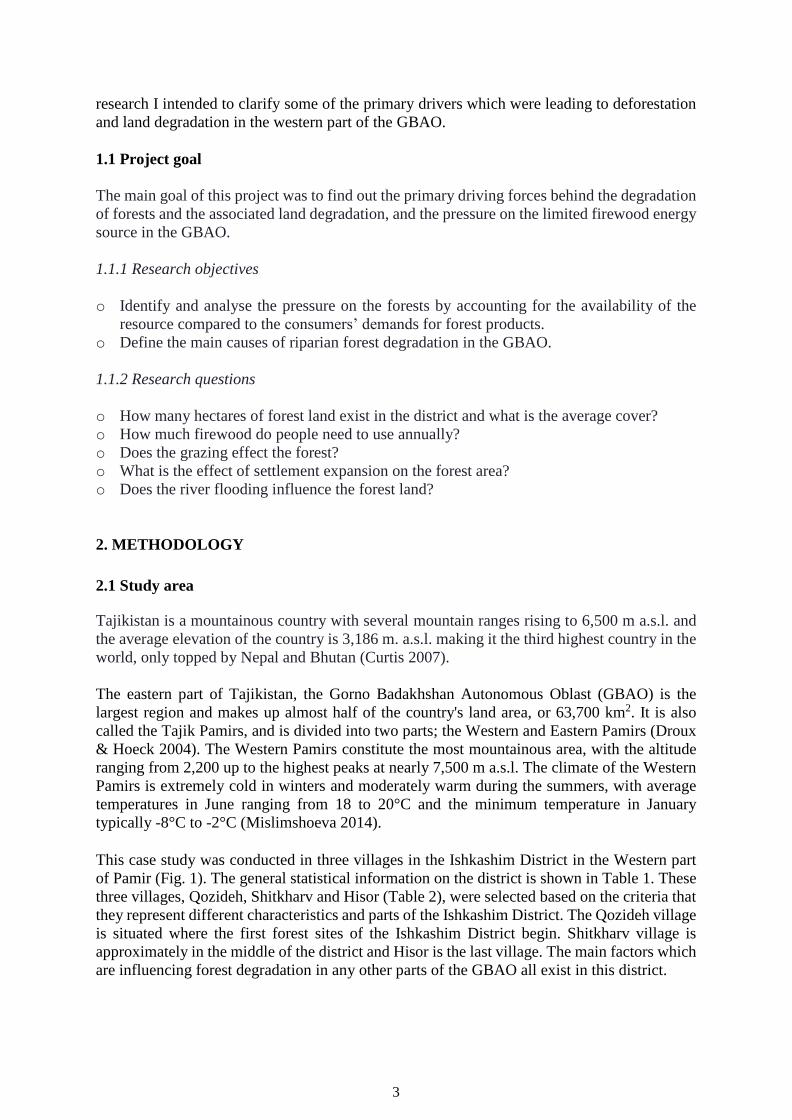
This case study was conducted in three villages in the Ishkashim District in the Western part
of Pamir (Fig. 1). The general statistical information on the district is shown in Table 1. These
three villages, Qozideh, Shitkharv and Hisor (Table 2), were selected based on the criteria that
they represent different characteristics and parts of the Ishkashim District. The Qozideh village
is situated where the first forest sites of the Ishkashim District begin. Shitkharv village is
approximately in the middle of the district and Hisor is the last village. The main factors which
are influencing forest degradation in any other parts of the GBAO all exist in this district.
4
Table 1. General statistical characteristics of Ishkashim District.
Description Number and units
District total surface area size (km2) 3,700
Size of district population 33,624
Number of villages 47
Agricultural land (ha) 2,819
Forest land (ha) 2,039
Number of large livestock (cows) 14,022
Number of small livestock (sheep and goats) 59,195
Figure 1. The study area, Ishkashim District, and overview map of the Gorno-Badakhshan
Autonomous Oblast (GBAO), Tajikistan. (Map by Amadbekov I. 2019).
Table 2. Geographical and demographical information on the three villages in the case study
area.
Name of village Elevation (m a.s.l) Households Population
Qozideh 2,404 67 646
Shitkharv 2,803 208 1,958
Hisor 2,834 101 1,265
2.2 Data collection and analyses
The methodological approach used for this research generated both quantitative and qualitative
data for the comparative analysis. For this research I used a variety of data such as maps, photos
and reports from the State Forest Enterprise (SFE) in the GBAO; literature, and last but not
5
least my own observations. The primary information was collected by conducting semi-
structured interviews and focus group discussions in the three selected villages in the Ishkashim
District.
Information regarding the forest area such as general forest information, the amount of annually
harvested firewood, maps, illegal cuttings, grazing, and other related information was provided
by the State Forest Enterprise of GBAO. The secondary information for the statistical data on
population, livestock, agricultural lands, and pasture was obtained from the Agency on
Statistics of the GBAO.
2.2.1 Semi-structured interviews
To get information from the local people, I chose semi-structured interviews (Blandford 2013),
which were carried out by two colleagues at my back-home organization of CAMP Tabiat.
They interviewed 16 respondents in each of the three selected villages, a total of 48 individuals,
where 35% of them were women. Around 50% of the respondents were forest users, who have
a Joint Forest Management (JFM) contract with the State Forest Enterprise. The collected
information from the semi-structured interviews was translated into English and coded and
analysed in Excel. This approach allowed for collection of more qualitative data about the
existing problems. The villages and respondents were selected randomly.
2.2.2 Community forest resource mapping
For the forest resource mapping, I used the tool Community Resources Mapping (World Bank Group
2005). Three groups of 6-8 key informants were selected to participate in the community forest resource
mapping. These were males and females aged 50-70 years who had lived in the area for the last 30
years. These were guided by the research assistant on the objectives of the study and on what to include
in the resource map. The main task for the participant was to draw three maps showing the forest cover
changes for the period before 1990, the current coverage and future prediction. Some additional
information on the forest resources was collected, some of it based on the maps drawn by the
participants. Finally, all the data and the maps were analysed, and conclusions made on the perceptions
of farmers on the trends of forest coverage.
2.2.3 Energy consumption analysis
The energy consumption was converted to MJ based on the equivalent of units for calculating
and comparing the results, using these conversion rates: firewood 1 kg =15 MJ; dung 1 kg =
12 MJ; coal 1 kg = 28.5 MJ (Droux & Hoeck 2004; Hoeck et al. 2007; Kominkowe n.d.). For
converting firewood from m3 to MJ I first weighed one cubic meter of firewood and then
weighed the per day consumption of firewood. The result I got for one cubic meter solid
firewood was 300 kg and per day firewood consumption was on average 10 to 12 kg. I also
used the same method of measuring for the use of dung. I weighed the usage of daily
consumption and it was around 10 kg of dung.
2.2.4 Heating season period
For clarifying the quantity of energy consumption, I simply used the field data from the
respondents to know the duration of the heating period. This mainly was used for the purpose
of understanding how the heating season duration affected energy consumption.
6
2.2.5 Comparative analysis of SFE statistical and field data on firewood harvesting and
consumption
To present the high pressure on the forest, I used the comparative statistical analysis methods
for estimating how much firewood is annually consumed per households and how much wood
capacity is in the forest. A similar method was used by Rehnus et al. (2013) in Kyrgyzstan and
by UNECE (2012) in Tajikistan. Using this method, I wanted to predict how much firewood
the people need annually and for how long the forest will be able to meet their demands. I made
this analysis in the following way: The ratio of the wood stock in m3/ha per year was compared
with the average annual demands on firewood for estimating the approximate firewood
resource. The average annual demand on firewood per household was multiplied with the total
number of existing households to get the total annual demand for the district. The wood stock
m3/ha per year was multiplied with total forest ha and the roughly overall wood stock in the
forest was identified. Then the sum of the overall wood stock was divided into the total number
for annual demand of firewood in the district and the remaining stock was determined. For this
estimation was used the annual wood stock according to FAO (2013), which was clarified for
tugai forest from 60 m3 up to 150 m3 per ha. For this analysis 150 m3/per/ha was used.
For the compiled information I used descriptive statistical methods which were categorized by
themes and analysed in Excel.
3. RESULTS
3.1 The patterns of energy consumption
The outcomes from the semi-structured interviews showed that firewood and dung are the most
used types of energy for cooking and heating (Fig. 2). Coal and electricity are being used, but
not every household is using them, mainly because of their availability and high price.
Electricity is currently more available compared with the past 10-15 years. Only 52% of
households used electricity and it reduced to some extent the amount of firewood needed. Coal
was only used by 44% of households. The investigation showed that electro energy mainly was
used for cooking rather than for heating houses. Gas was not being used because it was not
accessible.
3.1.1 Comparing the use of energy resources
The study identified how people were trying to use different options to reduce energy
consumption and to keep their houses warm as long as possible. Nobody was using energy
efficiency technology to insulate the houses for reducing energy utilization. Only 10% knew
about energy efficiency technology but still, because of their financial condition, they were not
able to make use of these opportunities.
The patterns of firewood consumption changed substantially between villages. Through the
semi-structured interviews, I was questioning 16 households in each case study village and the
quantity of firewood consumption was very different (Fig. 3). The elevation was identified as
the main factor which influences the amount of firewood used in these villages.
7
Figure 2. Energy consumption in the three target villages of the study area, based on the
semi-structured interviews.
Figure 3. Amount of firewood consumption in the three villages of the study area, based
on the semi-structured interviews.
The demands on energy resources remain high. The result of the semi-structured interviews
indicates that the amount of firewood used per household varies considerably from one village
to another. It was 3-12 m3 firewood for Qozideh village, 2 m3-16 m3 for Shitkharv, and 4 m3-
25 m3 for Hisor village.
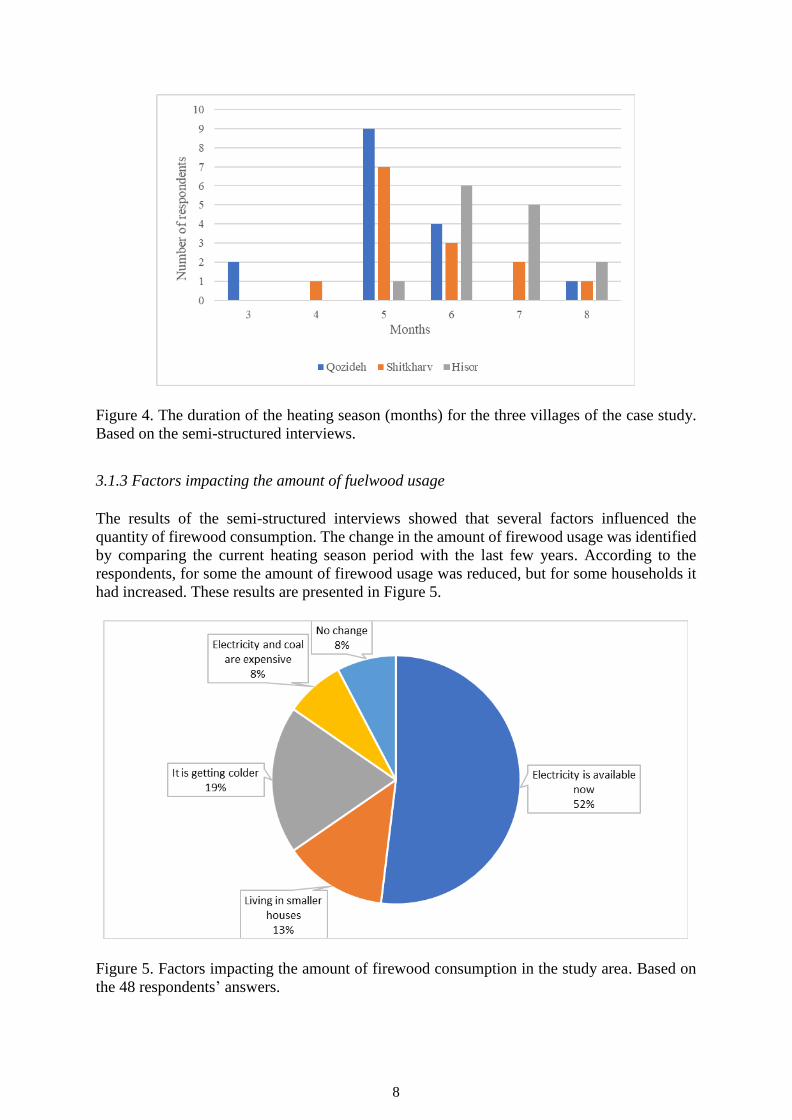
3.1.2 Duration of the heating season
The duration of the heating period was from three to eight months (Fig. 4). For the majority in
Qozideh and Shitkharv, which are at the lower elevation (see Table 2) it was from five to six
months, whereas for Hisor village, which is at a high elevation, it was from six to seven months.
0
100000
200000
300000
400000
500000
600000
700000
800000
900000
1000000
Firewood Dung Coal Gas
Am
ou
nt
of
ener
gy c
on
sum
pti
on
MJ
Qozideh Shitkharv Hisor
80
123
188
QOZIDEH SHITKHARV HISOR
AN
NU
AL
FIR
EW
OO
D
CO
NS
UM
PT
ION
IN
M3
8
Figure 4. The duration of the heating season (months) for the three villages of the case study.
Based on the semi-structured interviews.
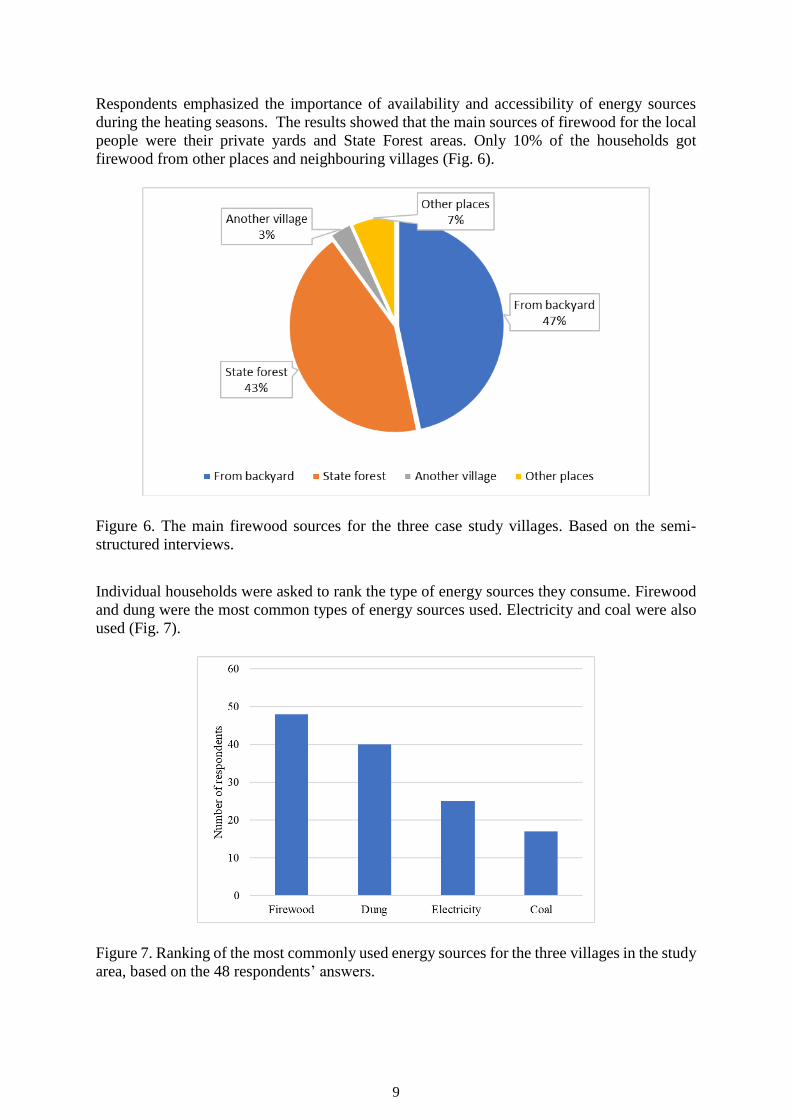
3.1.3 Factors impacting the amount of fuelwood usage
The results of the semi-structured interviews showed that several factors influenced the
quantity of firewood consumption. The change in the amount of firewood usage was identified
by comparing the current heating season period with the last few years. According to the
respondents, for some the amount of firewood usage was reduced, but for some households it
had increased. These results are presented in Figure 5.
Figure 5. Factors impacting the amount of firewood consumption in the study area. Based on
the 48 respondents’ answers.
9
Respondents emphasized the importance of availability and accessibility of energy sources
during the heating seasons. The results showed that the main sources of firewood for the local
people were their private yards and State Forest areas. Only 10% of the households got
firewood from other places and neighbouring villages (Fig. 6).
Figure 6. The main firewood sources for the three case study villages. Based on the semi-
structured interviews.
Individual households were asked to rank the type of energy sources they consume. Firewood
and dung were the most common types of energy sources used. Electricity and coal were also
used (Fig. 7).
Figure 7. Ranking of the most commonly used energy sources for the three villages in the study
area, based on the 48 respondents’ answers.
10
The result from the semi-structured interviews showed that people were moderately satisfied
with the availability of firewood in the forest. It was quite enough for 42% of the respondents
and partly enough for 47%. For 17% of the respondents it was not enough. The firewood stocks
in our target areas during the heating period was enough for 34 households and it was not quite
enough for 14 of them.
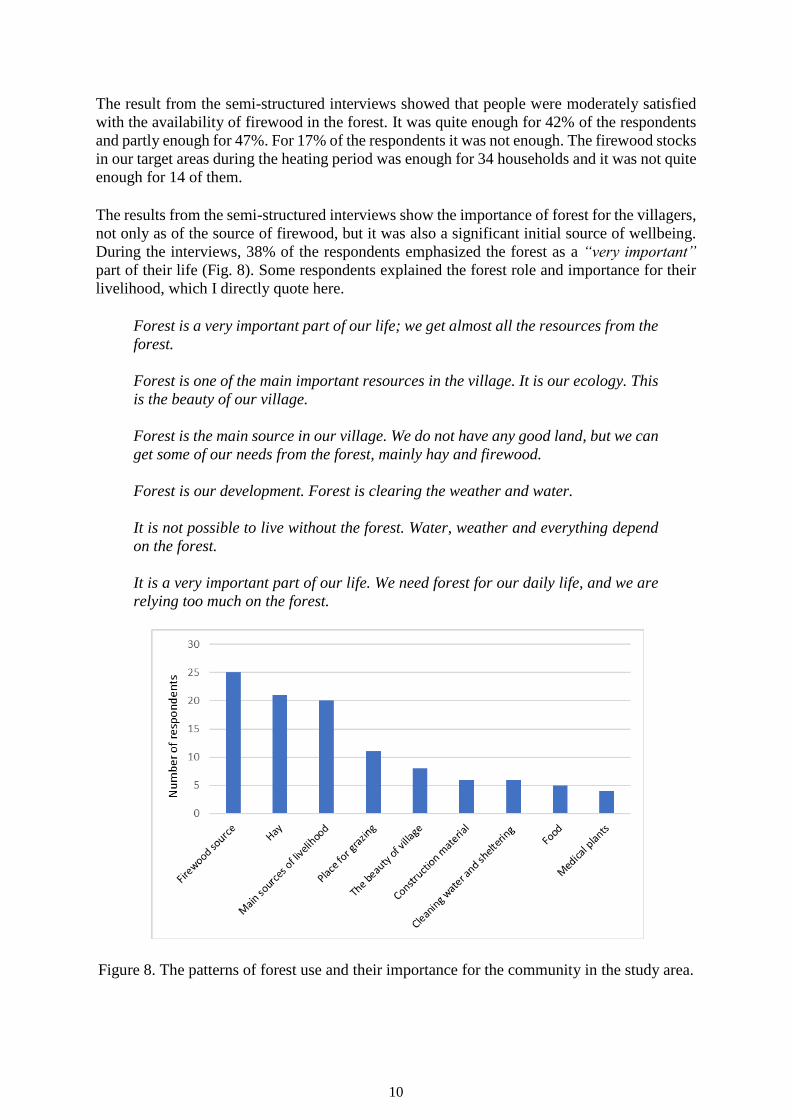
The results from the semi-structured interviews show the importance of forest for the villagers,
not only as of the source of firewood, but it was also a significant initial source of wellbeing.
During the interviews, 38% of the respondents emphasized the forest as a “very important”
part of their life (Fig. 8). Some respondents explained the forest role and importance for their
livelihood, which I directly quote here.
Forest is a very important part of our life; we get almost all the resources from the
forest.
Forest is one of the main important resources in the village. It is our ecology. This
is the beauty of our village.
Forest is the main source in our village. We do not have any good land, but we can
get some of our needs from the forest, mainly hay and firewood.
Forest is our development. Forest is clearing the weather and water.
It is not possible to live without the forest. Water, weather and everything depend
on the forest.
It is a very important part of our life. We need forest for our daily life, and we are
relying too much on the forest.
Figure 8. The patterns of forest use and their importance for the community in the study area.
11
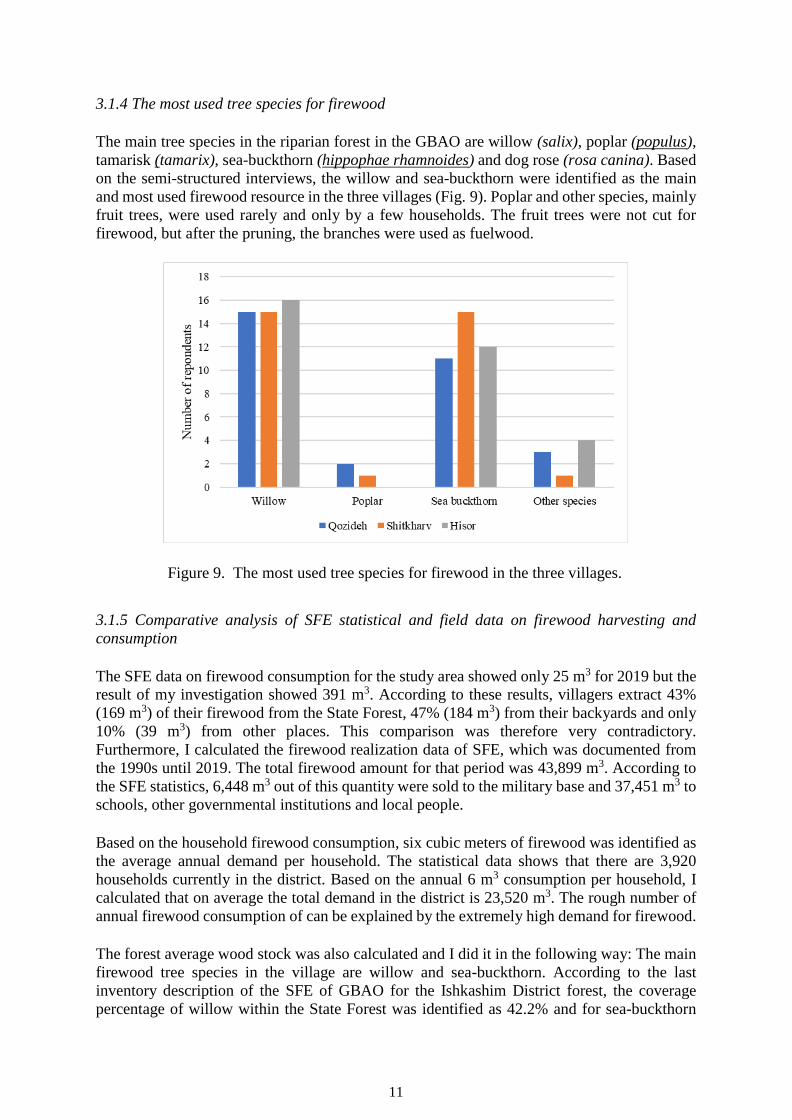
3.1.4 The most used tree species for firewood
The main tree species in the riparian forest in the GBAO are willow (salix), poplar (populus),
tamarisk (tamarix), sea-buckthorn (hippophae rhamnoides) and dog rose (rosa canina). Based
on the semi-structured interviews, the willow and sea-buckthorn were identified as the main
and most used firewood resource in the three villages (Fig. 9). Poplar and other species, mainly
fruit trees, were used rarely and only by a few households. The fruit trees were not cut for
firewood, but after the pruning, the branches were used as fuelwood.
Figure 9. The most used tree species for firewood in the three villages.
3.1.5 Comparative analysis of SFE statistical and field data on firewood harvesting and
consumption
The SFE data on firewood consumption for the study area showed only 25 m3 for 2019 but the
result of my investigation showed 391 m3. According to these results, villagers extract 43%
(169 m3) of their firewood from the State Forest, 47% (184 m3) from their backyards and only
10% (39 m3) from other places. This comparison was therefore very contradictory.
Furthermore, I calculated the firewood realization data of SFE, which was documented from
the 1990s until 2019. The total firewood amount for that period was 43,899 m3. According to
the SFE statistics, 6,448 m3 out of this quantity were sold to the military base and 37,451 m3 to
schools, other governmental institutions and local people.
Based on the household firewood consumption, six cubic meters of firewood was identified as
the average annual demand per household. The statistical data shows that there are 3,920
households currently in the district. Based on the annual 6 m3 consumption per household, I
calculated that on average the total demand in the district is 23,520 m3. The rough number of
annual firewood consumption of can be explained by the extremely high demand for firewood.
The forest average wood stock was also calculated and I did it in the following way: The main
firewood tree species in the village are willow and sea-buckthorn. According to the last
inventory description of the SFE of GBAO for the Ishkashim District forest, the coverage
percentage of willow within the State Forest was identified as 42.2% and for sea-buckthorn
12
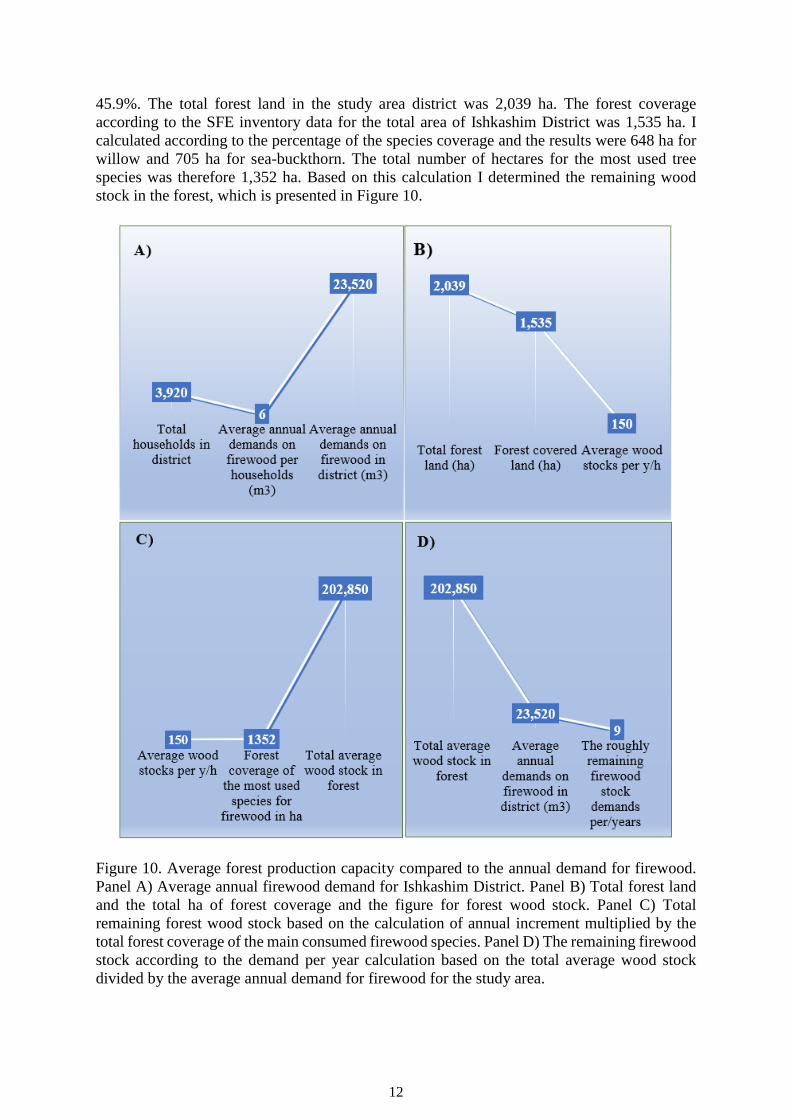
45.9%. The total forest land in the study area district was 2,039 ha. The forest coverage
according to the SFE inventory data for the total area of Ishkashim District was 1,535 ha. I
calculated according to the percentage of the species coverage and the results were 648 ha for
willow and 705 ha for sea-buckthorn. The total number of hectares for the most used tree
species was therefore 1,352 ha. Based on this calculation I determined the remaining wood
stock in the forest, which is presented in Figure 10.
Figure 10. Average forest production capacity compared to the annual demand for firewood.
Panel A) Average annual firewood demand for Ishkashim District. Panel B) Total forest land
and the total ha of forest coverage and the figure for forest wood stock. Panel C) Total
remaining forest wood stock based on the calculation of annual increment multiplied by the
total forest coverage of the main consumed firewood species. Panel D) The remaining firewood
stock according to the demand per year calculation based on the total average wood stock
divided by the average annual demand for firewood for the study area.
13
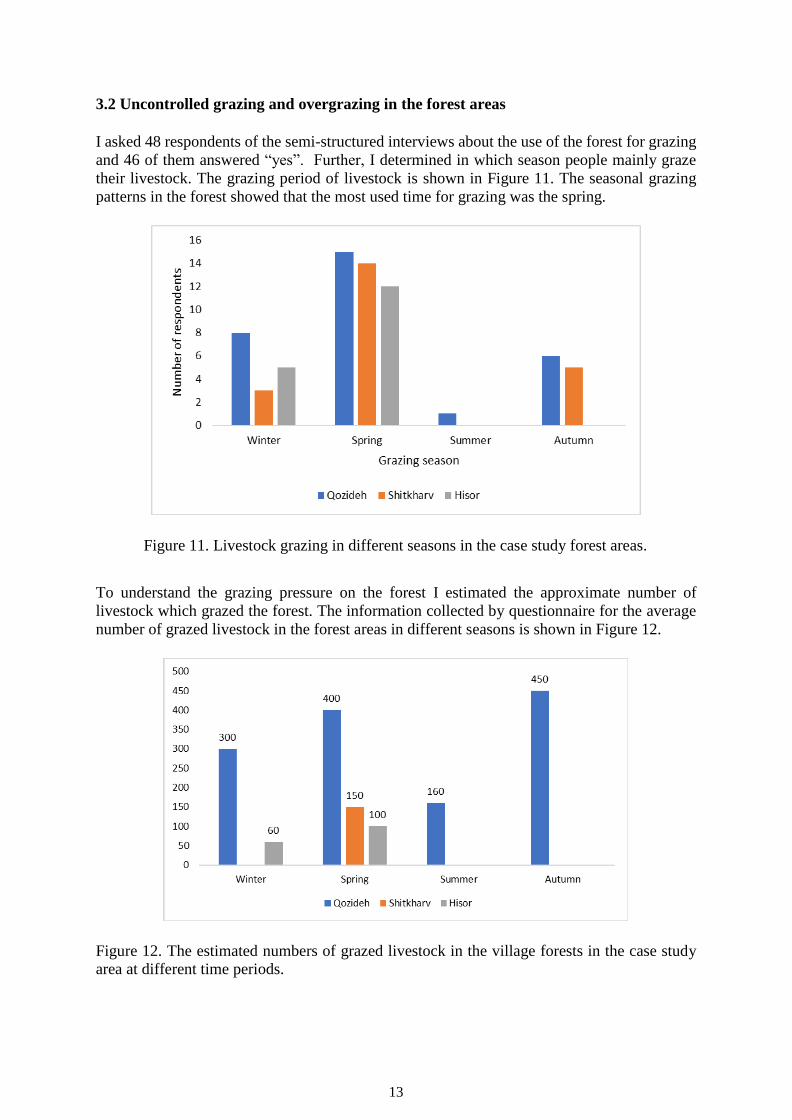
3.2 Uncontrolled grazing and overgrazing in the forest areas
I asked 48 respondents of the semi-structured interviews about the use of the forest for grazing
and 46 of them answered “yes”. Further, I determined in which season people mainly graze
their livestock. The grazing period of livestock is shown in Figure 11. The seasonal grazing
patterns in the forest showed that the most used time for grazing was the spring.
Figure 11. Livestock grazing in different seasons in the case study forest areas.
To understand the grazing pressure on the forest I estimated the approximate number of
livestock which grazed the forest. The information collected by questionnaire for the average
number of grazed livestock in the forest areas in different seasons is shown in Figure 12.
Figure 12. The estimated numbers of grazed livestock in the village forests in the case study
area at different time periods.
14
According to the respondents, there are no pasture lands near the village that could be used
for grazing. The main pastureland which they have is the summer pastures, which are also far
away from the villages and they are used only during summers. During summer mainly the
small livestock go to the summer pastures and the large livestock remain in the village for
dairying needs. This is why the grazing problems are very real, given the conditions in the
Western Pamirs.
3.3 Community forest resource mapping
During three focus group discussions I asked the key informants to draw their surroundings on
simple maps to show how the changes had occurred. By using the Community Resource
Mapping method, I understood the past and current situations roughly in comparison to the
condition and shape of the village. The results show how the growth of the population is
impacting in terms of resource use and how gradually and unnoticeable everything is changing.
In this investigation, the main results told that about 30 years ago, the area was less populated
and there was no feeling of limited natural resources. The second map explains how the land
changed in comparison with the past and the third map shows the future scenario of how the
growth of population might be affecting land use. The three scenarios for each village are
illustrated in the maps in Figure 13. This simple example shows the view of typical villages in
the Western Pamirs. There are two main parts drawn on the maps, the forest area and the
community settlements.
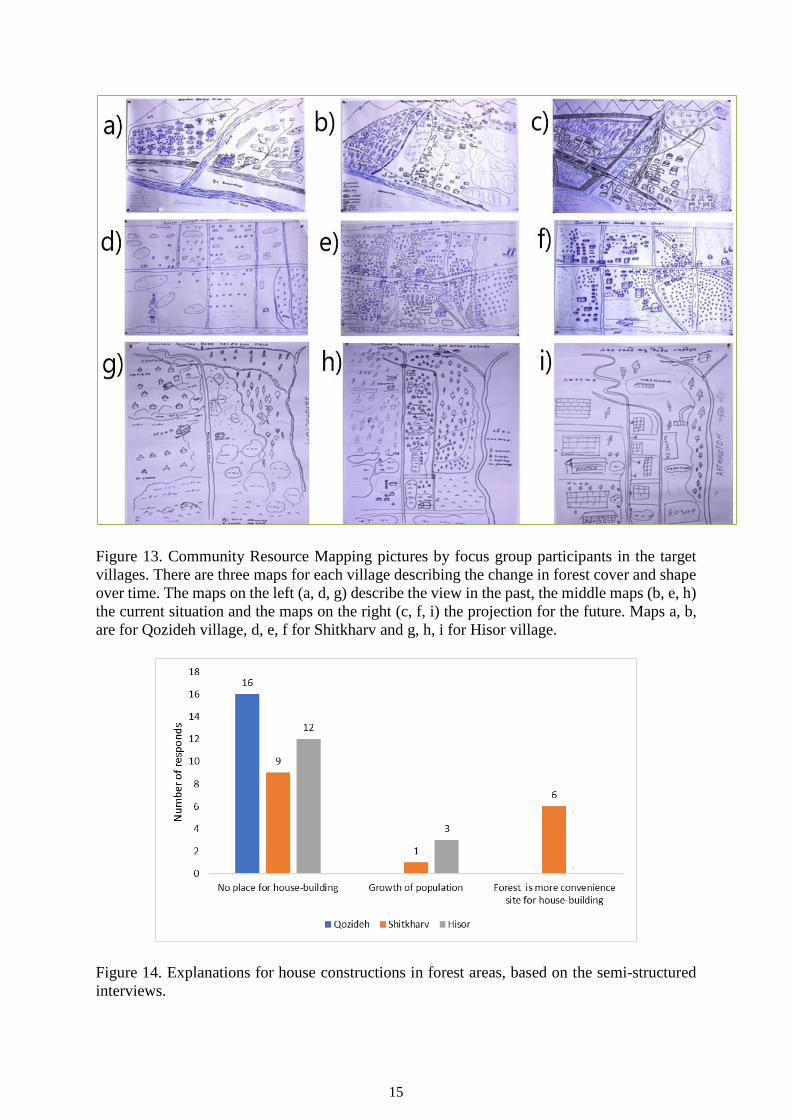
3.4 House building in the forest areas
The results from the Community Resources Mapping (see Fig. 13) elucidate the encroachment
into forest bare patches for construction, and the semi-structured interview respondents
explained it as the lack of land for settlements. When I asked about the reasons for building
new houses in the forest, the majority of the respondents said there was no other place for house
building (Fig. 14).
The house building in forest sites was mainly according to government decisions by allocating
a piece of land with an average size of 0.06 to 0.08 ha for each house (Fig. 15). The findings
showed that there was no illegal land grabbing for house building. I obtained an official
document copy from the State Forest Enterprise on land allocation for house building in the
forest areas for 40 ha. Hence, SFE stated that the land allocation was carried out by the Land
Committee according to the government´s decision.
15
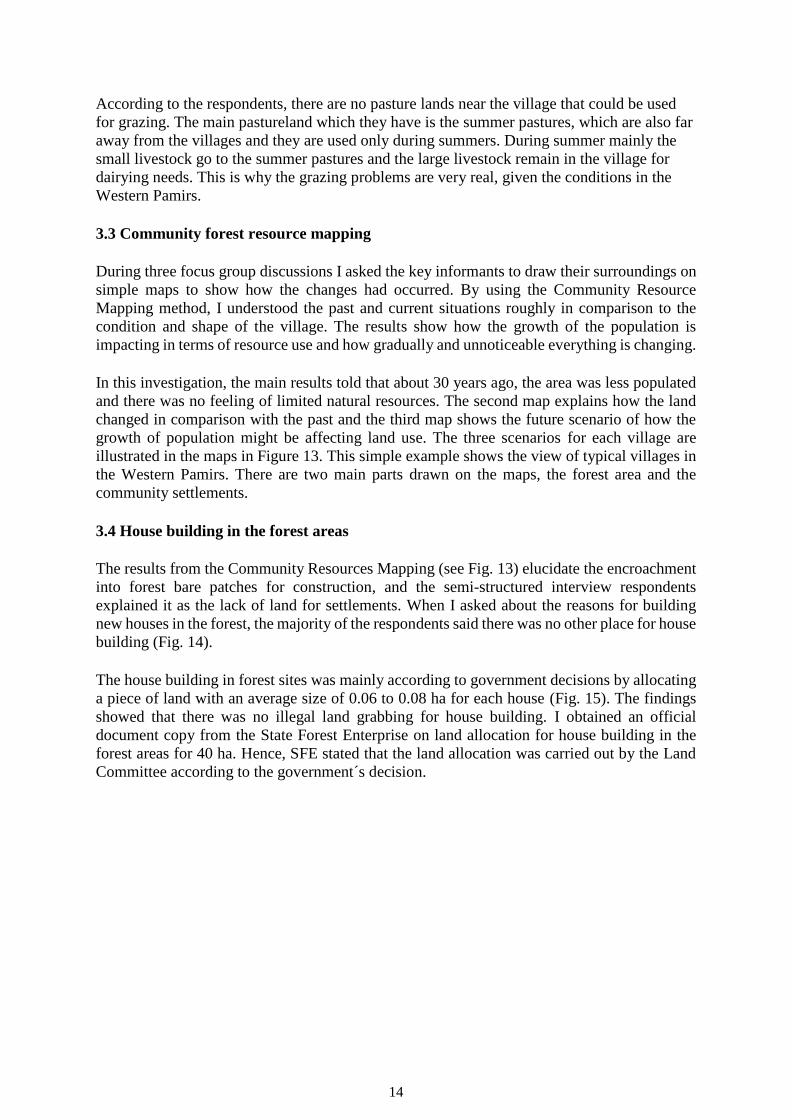
Figure 13. Community Resource Mapping pictures by focus group participants in the target
villages. There are three maps for each village describing the change in forest cover and shape
over time. The maps on the left (a, d, g) describe the view in the past, the middle maps (b, e, h)
the current situation and the maps on the right (c, f, i) the projection for the future. Maps a, b,
are for Qozideh village, d, e, f for Shitkharv and g, h, i for Hisor village.
Figure 14. Explanations for house constructions in forest areas, based on the semi-structured
interviews.
16
Figure 15. View of the Qozideh village forest area showing settlements in the bare patches of
forest land which were allocated for housing. (Photo: U. Khairulloev, 25 July 2019).
3.5 The impacts of flooding on forest areas
The semi-structured interview results displayed flooding as the biggest challenge in relation to
forest degradation and soil erosion. Flooding was the big trouble of the local people, mainly
for those who were the Joint Forest Management users. Based on their responses it was
identified that the forest lands were needed for irrigation and in most cases the river floods
washed away the head channels, with the result that the water could not flow into the main
channels. It was difficult to reconstruct the damaged channels by hand (Fig. 16). To fix the
damage to the forest irrigation channels takes a long time and in the interim, the forest remained
without water, which caused a lot of damage to the new plantings in the forest. The semi-
structured interview findings showed that in all target villages the disturbance of flooding
occurred frequently and almost annually (Table 3). According to the respondents, the floods
mainly occurred in the summertime when the weather becomes hot and the snow and glaciers
in the high mountains melt, with the result that the river water levels increase. The water then
floods over the forest land surface. The villagers were worried about the destructive results of
river flooding.
Table 3. Information about the time of flooding occurring and the roughly estimated damaged
hectares of forest land based on the respondents’ observations in the case study villages.
Name of
village
Reason Number of
respondents
Approx. size
(ha)
The year of flood occurring
Qozideh Flooding and mudflow 14 0.2 to13 2006, 2013, 2014, 2015, 2016, 2017, 2018
Shitkharv Flooding and mudflow 10 2 to 20 2003, 2004, 2009, 2014, 2016, 2018
Hisor Flooding 9 2 to 20 1981, 1982, 1985, 1986, 1990, 2000, 2018
17
Figure 16. Forest users of Shitkharv village reconstructing the head channel that was
destroyed after river flooding. (Photos: U. Khairulloev, 1 August 2019).
4. DISCUSSION
4.1 The patterns of energy consumption
The results of this study show that firewood and dung remain the most important sources for
energy in the case study area, as was similarly found in GBAO by Droux and Hoeck (2004).
According to Breu and Hurni (2003), approximately 80% of all the energy needed in the Tajik
Pamirs came from animal manure and fuelwood. Electricity and coal were also used but in
lesser amounts. The reason is the socio-economic conditions of the rural community and their
state of poverty. However, electricity is now more available in comparison with the past several
years, but people, in terms of use, rate it in third place. According to UNECE (2012), almost ¾
of the country’s population live in rural areas, but they consume only around 9% of the
electricity. This can be ascribed to its high price.
It was considered that firewood and dung are the more available and affordable sources which
can easily be extracted from backyards and farms without spending money. Electricity and coal
are costly, and coal is not accessible all the time. Based on the interviews, I clarified that
electricity was used particularly for cooking and lighting. These results are comparable to some
former studies in the Western Pamir of Tajikistan (Hoeck et al. 2007; Mislimshoeva 2014).
Despite firewood and dung being the most important energy sources, 52% of the survey
respondents answered that the use of electricity reduced the quantity of firewood consumption.
Dung is one of the main sources of fertilizer in rural areas (Hoeck et al. 2007), but people utilize
it for heating due to the limitation of other fuel resources. Dung is an optional fuel resource in
the Wester Pamir, which people obtain from their stables. To reduce the pressure on the forest
local people used the animal dung as an affordable alternative energy source in combination
with firewood to heat and cook (Droux & Hoeck 2004). Nevertheless, in general, most people
were satisfied with the availability of firewood in the forests, except for a few households which
complained of firewood scarcity.
Studies from Khuman et al. (2011) and Mislimshoeva (2014) revealed that elevation impacted
18
energy consumption, which I found in my study as well. The use of firewood and the length of
the heating season increased from the lowlands to the higher elevations (see Fig. 3 and Table
2).
However, differences in the energy consumption were evident between the three villages. The
main factors influencing the different fuel energy consumption are likely related to social,
cultural, financial, physical and climatic conditions, as has also been emphasized in other
studies (Hoeck et al. 2007; Mislimshoeva 2014).
4.1.1 Firewood as the main fuel energy source
The demand for firewood remains high. It has been estimated that around 70% of the Tajikistan
population relies heavily on solid firewood (UNECE 2012). This was the main factor that
highly influenced forest condition and I identified it as the primary reason for degradation. In
this regard, I studied some components that affected the patterns of firewood consumption at
the household level.
One of these factors was the long and rigorous winter in the area, which forces people to heat
the house all day to keep it warm. The heating season duration was substantially different from
one village to another however. The responses I got explained how the patterns of energy use
fluctuated considerably. Due to the availability of electricity and living in small houses during
the wintertime the majority used less firewood. According to some respondents, during the last
few years the winters had been getting colder and they had used more firewood. Only 8% of
the respondents observed no change in their firewood consumption compared to previous years
(see Fig.5). The study showed a lack of awareness of using energy efficiency technology, which
is similar to other research done in Eastern Pamir (Wiedemann et al. 2012).
Another thing that was influencing firewood consumption quantity was related to the size of
the big traditional Pamiri house. According to the respondents, for heating the big room they
had been using more firewood, mostly for the traditional houses with the average sizes of 115
m3 to 150 m3, and even some larger. The villagers stated that it is very difficult to provide the
needed amount of firewood for the long heating season. Living in the Pamiri traditional big
houses, they have to use enough fuelwood to heat the house all day. This result I have found
comparable with Droux and Hoeck (2004) and Hoeck et al. (2007), who described an average
size of the Pamiri house as 100-160 m3. Due to that, people need more firewood and dung to
heat the house and some of them had decided to live in a smaller apartment within the house
during the wintertime. My results showed that 13% of the households have spent the winter in
small rooms with all family members (see Fig. 5). They can thus save some resources and be
able to keep the room warm all day, which is a practice that has been used for a long time. As
usual, they heat the house three times a day when they cook. This was similar to findings from
the study of Mislimshoeva (2014) which was done in the same region. People explained that if
there are babies in the family, elderly persons or someone sick, they heated the house more
than usual. This also highly impacts the consumption patterns. Although 52% of households
were satisfied to some extent with the electricity for reducing the amount of firewood, they still
used the same amount of energy as they had used before.
The private backyards and the State Forest were the two main sources where people extracted
firewood for their demands. To discuss firewood resource consumption, it is still unclear how
much firewood comes from which sources. This is the point which needs new studies and
explanations. Out of the qualitative data 47% of survey respondents, almost the majority,
19
claimed that they obtained firewood from their private backyards. The same result was found
by Mislimshoeva (2014).
If the average demand for firewood for the annual heating period is 6 m3 per household, then
the question would be from where people can acquire this quantity. Whether or not their private
gardens or backyards will be able to provide such an amount of firewood, whether they can
provide at least 6 m3 per household, or even half of this amount annually. If this is the case,
then for how long would it be possible to get firewood from their private gardens and other
sources. Because of the time limitation of this study and lack of information it was very difficult
to explain this uncertainty. Anyway, the results showed that the demand on forest resources,
mainly firewood, always remains high and the pressure on the scarce and demandable energy
resources is a big challenge in the sub-arid mountainous zone in Western Pamir.
The importance and vital role of the forest in the wellbeing of the rural community have been
indicated in many studies and reports (Kirchoff 2010; FAO 2013, 2018). The results show the
importance of the forest in the daily life of people in the study area and how they are highly
relying on the use of different timber and non-timber products. This again highlight the crucial
role of forests in human life and especially the heavy dependence of rural communities on
natural resources. The interviews helped to explain that forests are one of the most significant
sources of livelihoods in the rural areas of Western Pamir. Some quotes from the semi-
structured interviews on forest importance for the local community welfare and their economic
and ecological functions give an understanding of how people are really feeling about their
dependency on forest resources (see Fig. 8). These quotes clearly explain how the forest plays
a significant role in the life of those who live in very remote and harsh geographical places in
the Western Pamir.
4.1.2 The most used tree species for firewood
In this case study, I was interested in determining the most used tree species for firewood.
There was a similar approach in a case study in Kirgizstan done by Rehnus et al. (2013). Their
research was done to clarify the pressure on the main consumed species for firewood and to
show how the consequence of overuse will impact on the genetics. Using the same approach, I
wanted to explain the pressure on the main tree species in forests which people mostly use for
fuelwood. Based on the respondents’ information, willow and sea-buckthorn were identified
as the two mainly used species for firewood in Western Pamir, which according to the SFE of
GBAO forest inventory data covers 1,352 ha of the total forest land area.
4.2. Comparative analyses of statistical data
According to the national legislation, the forests in Tajikistan belong to Category 1 because of
their socio-economic and ecological value and cutting them is forbidden, which is very clearly
argued by the Country Report on the State of Plant Genetic Resources for Food and
Agriculture:
The Clearance of forest imposes a special threat to the disappearance of plants. The
forests of Tajikistan belong to the category 1, i.e. all of them deal with
environmental protection and protection of soil and their clearance is strictly
forbidden. It is only allowed to clear under sanitary measures and annually about 7
000 m3 of firewood. (Muminjanov 2008, p. 25)
20
According to the State Forest, the limit for firewood realization is 400 m3 for all the GBAO for
one year, but given the people’s demand for firewood, much more was found than expected.
I asked the State Forest of GBAO to provide information on firewood harvesting and realization
for the case study area. The outcomes of the qualitative interviews showed that the annual
demands on firewood are not comparable with the information from the State Forest. The
difference I found shows that the real figures for firewood consumption were 15 times higher
than the State Forest statistical data. For clarifying the forest firewood production capacity and
annual demands on firewood I used an average figure of firewood consumption which I got
from my results. According to my estimation, the average annual firewood use was 6 m3 per
household. In comparison, by Akhmadov (2008) and UNECE (2012) the firewood
consumption in Tajikistan was estimated at 0.25 m3 per month for three months of the heating
season in 2008 and 3-4 m3 annually per individual in 2010. Comparing average annual demand
for fuelwood per household of the estimation from 2008 with the 6 m3 average demand from
my study results it is in comparison. With the calculation of 2010, it is much less than from my
estimation.
There is considerable pressure on the natural resources in the study area, where the forest land
amounts to only 0.06 ha per capita. I hypothesize that the scarce forest production capacity is
under high pressure and needs to be addressed in the national policy and at the decision-makers’
level.
4.3 Uncontrolled grazing and overgrazing in forest areas
Overgrazing of forest is a common problem almost around the globe (Buffum et al. 2009). The
harmful results of uncontrolled grazing of domestic livestock in the State Forest land that
drastically impacts on forest vegetation cover is considered the main issue of forest land
degradation in Tajikistan (FAO 2013). In this study, I mainly wanted to identify the primary
reasons for forest degradation, and I recognized that grazing was one of the main components.
I tried to get some information regarding grazing in forest areas from the State Forest office,
but unfortunately it was insufficient. Then I decided to clarify this issue through the semi-
structured interviews in the case study villages. Beforehand I was not fully sure that the
interviewees would share openly their information about this very critical problem. People have
the tendency to avoid the subject of overgrazing the forest, as I have evidence of from my work
experience in this region. Therefore, I was surprised about their response and openness about
the overgrazing. These results were similar to the study of Haider at al. (2019) in the Western
Pamir, where the respondents were talking very openly, and the results proved that the forest
is the only available place for grazing. The Tajik Pamirs are very rocky with very steep
hillslopes and it has inadequate lowland areas, comprising arable, pasture and forest. Of the
agricultural land in the Tajik Pamirs 95% is pastureland (UNECE 2012), and more than 85%
of the pastures have no vegetation cover and are not suitable for grazing (Breu et al. 2005).
Due to this scarcity of pasturelands, the cleared forest lands are transformed into grazing lands,
which interfere with the regeneration of forests (Droux & Hoeck 2004).
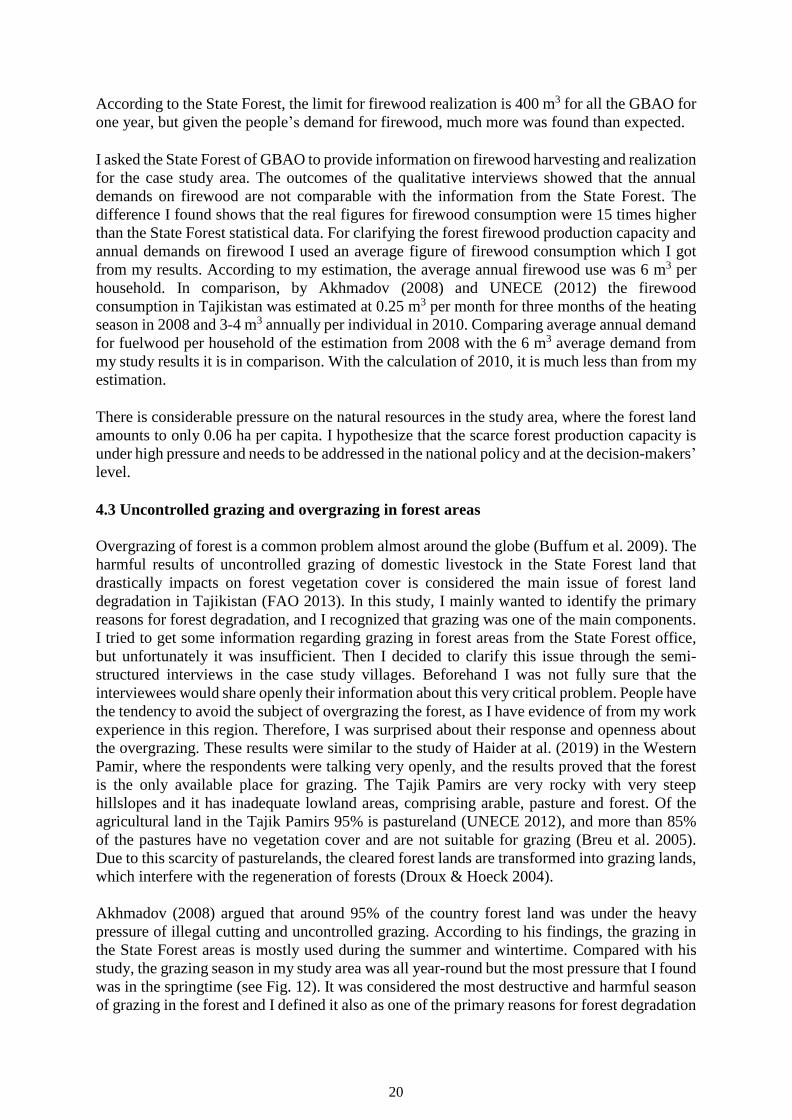
Akhmadov (2008) argued that around 95% of the country forest land was under the heavy
pressure of illegal cutting and uncontrolled grazing. According to his findings, the grazing in
the State Forest areas is mostly used during the summer and wintertime. Compared with his
study, the grazing season in my study area was all year-round but the most pressure that I found
was in the springtime (see Fig. 12). It was considered the most destructive and harmful season
of grazing in the forest and I defined it also as one of the primary reasons for forest degradation
21
in the Western Pamirs.
4.4 Settlement expansion into forest areas and the change in forest size and condition
Intensive growth of population and shifting the forest bare patches into housing areas has
negative impacts on forest cover and environment and this tendency reduces the scarce riparian
forest land size in Western Pamir. Using the community forest resource mapping I was able to
understand the main reason why people expand settlements into forest areas. When looking at
the maps, which were drawn by the focus group discussion participants, it shows that some 30
years ago there were few households in the village households, and there was no houses on
forest land. In comparison, on the second map showing the current situation of the village the
participants had drawn some houses within the forest lands, which could be explained as the
result of the growth of population and limited land. People therefore started to use the forest
for housing in the Western Pamirs.
By visualizing the village in sketches the people were able to share their main problems in the
surrounding environment. The analysis and comparison of three different periods of time in
each village explained that the encroachment into the forest and the change in land-use patterns
had a geographical and topographical character. Encroachment of settlements into forest areas
is not only an issue in Western Pamirs, but a common concern for most countries across the
world. A similar problem was investigated by Stein et al. (2009), Mondal et al. (2013) and
Mockrin et al. (2019) in the US, regarding the expanding of housing in private forests and the
impacts on land coverage and the environment.
According to Basnyat (2009), human pressure is considered the main driving force for land-
use changes such as converting forest into agricultural land and expansion for settlements. The
main problem I detected was the expanding of settlements into forest land areas, which
negatively impacted forest coverage and ecosystem services. Several studies were done in the
US on historical land-use change and housing density and the projection for the future
(Theobald 2005; Stein et al. 2005; Mondal et al. 2013; Mockrin et al. 2019). These studies
showed a similar result to mine, that by increasing housing density the forests are becoming
encroached on and are reducing in size.
It is worth understanding that in my case study area the bare patches in the forests have been
used for constructing houses, whereas clearance of forest was done for firewood primarily and
forests were degraded by the impact of overgrazing or parts where afforestation is impossible.
The results showed that people are not grabbing the land illegally but their geographical
location with limited resources and difficult socio-economic circumstances make them forced
to use what is available in their surrounding environment. This issue has not been investigated
in the Western Pamirs before. In this study, I tried to find problems related to forest degradation
and based on the qualitative field data this problem was identified.
I estimate the negative effect of this problem as very high and it mainly results in decreasing
forest areas in the region where forest is already very rare. The total forest land in the district
consists of 2,039 ha only. The population in the district according to the Statistical Agency of
Ishkashim is currently 33,624 people and the total forest land per capita is therefore only 0.06
ha. These figures are quite disquieting for the Western Pamirs, where people are still relying
fully on forest resources. The population is intensively increasing, and I hypothesize that this
problem will have major implications for future generations. The demographic issues really
need more attention and new empirical studies to look at the problems and to find better
22
solutions need to be carried out.
From the Community Resource Mapping results, I can conclude that the forest areas are
gradually decreasing, and people will face more trouble and difficulties in the upcoming future.
4.5 The impact of flooding on forest sites
Floodplain forests play a very significant role in sedimentation and water retention and they
reduce the high risk of flooding (WWF 2017). Flooding in floodplain forests is a big concern,
as it is a common issue across the world. In Western Pamirs forests are mainly along the rivers
and they are impacted very frequently by floods. The study outcomes show that flooding occurs
very often, and with destructive results. According to the respondents, the vegetation cover and
the topsoil of forests are being swept away by the flooding. They argued that during the
summertime when the temperature is hot, the snow melts and the level of water in the rivers
rises and is therefore destroying the nearby riparian forests.
Most of the respondents repeatedly underlined flooding and mudflows as the main causes of
damage to their forest areaa. Globally, in the last few years flooding is occurring very
frequently with destructive results (Schneidergruber et al. 2004). The frequent occurrence of
river floods in the Western Pamirs with the destructive results gives us evidence of how climate
change and global warming is becoming more actual.
The figures for the number of damaged of hectares of the forest cited by the respondents were
based on their assumptions and observations (Table 4). I was not able to get any recorded
information from the State Forest regarding flooding, which is why I do not know how many
hectares of the riparian forests have already been destroyed by floods in reality.
5. CONCLUSIONS AND RECOMMENDATIONS
The high demands on scarce renewable energy resources are the primary reason for forest
degradation in the Western Pamirs, where the undesirable climatic environment and difficult
living conditions contribute to the overexploitation of the region’s most important ecosystem.
Nevertheless, the tendency of intensive growth of the population in the region with its
inadequate land leads people to extend construction into bare forest patches, which has reduced
the coverage of forests. The negative effects of uncontrolled grazing and the destructive results
of flooding increase the impact on forest resources further.
To some extent, people are feeling the negative impact of ecological problems and the
consequences, which they now face, but they are continuing to use the resources in the same
way, even though this overuse will cause tremendous trouble and implication for the next
generation.
The outcomes of this study give an understanding that the Tajik Pamirs, especially because of
their remoteness and mountainous environment with inadequate and scarce resources and low
socio-economic level of livelihood, need urgent attention of decision makers on the national
level and the support of governmental and non-governmental organizational interventions for
solving all these challenges.
In this research, due to limited time and lack of more precise information, I was faced with
23
some challenges, mainly in comparing the statistical data of SFE on firewood consumption and
demands, issues concerning the floods, and the settlement expansion into forest areas.
Therefore, these issues really need more empirical studies that I would highly recommend
investigating with more precise data in the future. Considering the main outcomes of this study,
I would suggest some recommendations for reducing the pressure on the scarce forest resources
and their conservation.
For diminishing the amount of firewood consumption, it is highly recommended that other
alternative energy sources be provided. It is possible to open selling points for coal and gas
with affordable prices in rural areas. Here I suggest that the local government representatives
promote the interests of the rural community to high-level decision makers to help realize these
ideas for solving the problems. Tajikistan luckily has its coal resources that can be made
available to the public through opening a selling point in the rural areas, where people heavily
rely on forest energy resources. This might be a temporary solution for reducing the pressure
on forests, while more renewable energy sources are not in place.
Referring to the good example of Iceland in using geothermal water resources as the main
heating system, I can suggest experimenting and applying this approach for the GBAO, where
similarly hot springs are available in the Western Pamirs. The rural people should be
encouraged to use energy-efficient technology such as stoves, ovens and other electrical
appliances, and insulation of the houses, to reduce the use of forest energy sources. It is worth
mentioning that energy efficiency technology, mainly the use of insulation materials, is costly
and the people in the area, due to their socio-economic livelihood levels, are not able to afford
it. Therefore the intervention and financial support of governmental and nongovernmental
organizations are much needed.
It is essential to minimize the impact of livestock grazing on forest coverage and vegetation.
This is a very serious and big concern for the rural areas of the GBAO, where pastoralism is
considered their main source of livelihood. However, the lack of pastureland and the steep
slope environment are the main reasons that people are forced to use their nearby forests as the
most accessible sources for grazing. I highly recommend that the State Forest propose new
projects on afforestation and rehabilitation of degraded forests, and to protect the forests from
grazing and keeping the livestock outside of the forest by fencing the forest areas.
The flooding really needs urgent consideration and solutions. Of course, the reinforcement
work of riverbanks with levees and gabions is a very costly project and it needs financial
support and funding, but primarily it is recommended that the State Forest plant the most stable
trees along the riverbanks for preventing and diminishing the risk of floods.
The extending of settlements into forest land areas also needs more precise and detailed
empirical research in order to identify the reality of the problem. Currently, I suggest building
more compact houses in the areas, where the free space for housing is a big issue. It is
recommended that the housing authority should identify places where people can build their
houses without damaging the environment.
Finally, yet importantly, I recommend promoting educational projects and raising the
awareness of the local community on ecological problems and climate change effects on the
environment and human ecology. As seen in today's world, everything is changing except the
attitude of people towards natural resources and ecological problems. That is why awareness-
raising is the main and most valuable part of solving the problems addressed in this study.

24
ACKNOWLEDGEMENTS
I would like to express my heartfelt thanks to the Land Restoration Training Programme
Director Dr Hafdís Hanna Ægisdóttir and Deputy Director Berglind Orradóttir for their
wonderful guidance, coordination and encouragement throughout the study program.
I would like to express my sincere gratitude to my supervisor Friðþór Sófus Sigurmundsson
for his professional guidance and valuable advice throughout all the project. With his great
support and enthusiasm, I successfully finalized my research project.
I am deeply grateful to Halldóra Traustadóttir for her outstanding work and efforts on making
available all opportunities for us during our stay in Iceland. She provided all opportunities for
us to make our six month stay in Iceland comfortable and joyful.
I am most grateful to the Icelandic Government, the Soil Conservation Service, the Agricultural
University of Iceland and the United Nations University (UNU) for this crucial and well
organized UNU-LRT training program, which opened new opportunities to me.
I would like to say my sincere thanks to the UNU-LRT training lecturers for their excellent
effort and jobs.
My special thanks to my back-home Public Organization of CAMP Tabiat Director Umed
Bulbulshoev for giving me the chance to participate in the UNU-LRT training program and my
gratitude to my colleagues, Shodikhon Mirzohasanov and Fakhriddin Dilshodov, for their input
in conducting the survey for my research project.
I am much indebted to Muhammad Azfar Karim for his support and for encouraging us during
our stay in Gunnarsholt. I want to thank him for guiding us during the Mastermind classes. I
am deeply grateful to him for his good organizing work during the wonderful trips, which were
very valuable for us.
My best affections and deep thanks to my UNU-LRT 2019 fellows, for their kindness, support
and making the friendly environment during the six month period of my being in Iceland, which
made me feel at home. I have learned a lot of things from their knowledge and experience.
And thanks for all those who made my stay in Iceland unforgettable and, full of joy, I express
my respect and thanks to them.
25
LITERATURE CITED
Akhmadov, K. (2008) Forest and forest products country profile: Tajikistan. Geneva timber
and forest discussion paper 46, United Nations Economic Commission for Europe/Food and
Agriculture Organization of the United Nations, New York and Geneva
Basnyat, B. (2008) Impacts of demographic changes on forests and forestry in Asia and the
Pacific. Asia-Pacific forestry sector outlook study II. Working Paper No. APFSOS
II/WP/2009/08. FAO, Bangkok, FAO
Blandford A (2013) Semi-structured qualitative studies. In: Soegaard, M, Dam, RF (eds.).
The encyclopedia of human-computer interaction. 2nd edition. The Interaction Design
Foundation, Aarhus
Breu T, Hurni H (2003) The Tajik Pamirs: challenges of sustainable development in an isolated
mountain region. Centre for Development and Environment, University of Berne, Berne
Breu T, Maselli D, Hurni H (2005) Knowledge for sustainable development in the Tajik Pamir
mountains. Mountain Research and Development 25:139–146
Buffum B, Gratzer G, Tenzin Y (2009) Forest grazing and natural regeneration in a late
successional broadleaved community forest in Bhutan. Mountain Research and Development
29:30–35
Curtis GE (2007) Country profile: Tajikistan Library of Congress-Federal Research Division.
https://www.loc.gov/rr/frd/cs/profiles/Tajikistan-new.pdf
Droux R, Hoeck T (2004) Energy for Gorno Badakhshan: hydropower and the cultivation of
firewood: analysis of the energy situation in the Tajik Pamirs and its consequences for land use
and natural resource management. M.Sc. thesis, University of Bern, Bern
http://www.north-south.ch/Upload/Energy%20for%20GBAO.pdf
FAO (Food and Agriculture Organization of the United Nations) (2010) What wood fuels can
do to mitigate climate change. FAO Forestry Paper 162. FAO, Rome
FAO (Food and Agriculture Organization of the United Nations) (2013) The state of forest
genetic resources in the sec region, the republic of Tajikistan. http://www.fao.org/3/a-
i3299b.pdf
FAO (Food and Agriculture Organization of the United Nations) (2014) Forest genetic
resources commission on genetic resources for food and agriculture. Rome.
http://www.fao.org/3/a-i3825e.pdf
FAO (Food and Agriculture Organization of the United Nations) (2016b) Guidelines on urban
and peri-urban forestry. FAO Forestry Paper No. 178. Rome. http://www.fao.org/3/a-
i6210e.pdf
26
FAO (Food and Agriculture Organization of the United Nations) (2018) The state of the
world’s forests 2018: forest pathways to sustainable development. Rome.
http://www.fao.org/3/I9535EN/i9535en.pdf
Förster H, Pachova NI, Renaud FG (2011) Energy and land use in the Pamir-Alai mountains.
Mountain Research and Development 31:305–314.
Gilmour D (2005) An historical account of fuelwood restoration efforts. Pages 223-227. In:
Mansourian S, Vallauri D, Dudley N (eds) Forest restoration in landscapes: beyond planting
trees. Springer, New York
Haider LJ, Neucel B, Peterson GD, Schlüter M (2019) Past management affects success of
current joint forestry management institutions in Tajikistan. Environment Development and
Sustainability 21: 2183–2224
Herbers H (2001) Transformation in the Tajik Pamirs: Gornyi-Badakhshan - an example of
successful restructuring? Central Asian Survey 20:367–381
Hoeck T, Droux R, Breu T, Hurni H, Maselli D (2007) Rural energy consumption and land
degradation in a post-Soviet setting: an example from the West Pamir mountains in Tajikistan.
Energy for Sustainable Development 11:48–57
Kayumov A, Novikov V (2014) Third National Communication of the Republic of Tajikistan
under the United Nations Framework Convention on Climate Change.
https://unfccc.int/sites/default/files/resource/tjknc3_eng.pdf
Khuman YSC, Pandey R, Rao KS (2011) Fuelwood consumption patterns in Fakot watershed,
Garhwal Himalaya, Uttarakhand. Energy 36:4769–4776
Kirchhoff J (2010) Forestry sector analysis. Deutsche Gesellschaft für Technische
Zusammenarbeit GmbH, Eschborn
Kominkowe (n.d.) www.kominkowe.info
Makhmadaliev B, Novikov V, Kayumov A, Karimov U, Perdomo M, Houston A, Andrew J
(eds) (2003) National action plan for the Republic of Tajikistan for climate change mitigation.
https://unfccc.int/resource/docs/nap/tainap01e.pdf
MEA (Millenium Ecosystem Assessment) (2005) Ecosystems and human well-being:
biodiversity synthesis. World Resources Institute, Washington D.C.
https://www.millenniumassessment.org/documents/document.356.aspx.pdf
Mislimshoeva B, Hable R, Fezakov M, Samimi C, Abdulnazarov A, Koellner Th (2014)
Factors influencing households' firewood consumption in the Western Pamirs. Mountain
Research and Development 34:147-156
Mislimshoeva B (2015) Forest ecosystem services governance, supply and demand in
Tajikistan. Doctoral thesis, University of Bayreuth, Bayreuth
https://epub.uni-bayreuth.de/2800/
27
Mockrin MH, Locke DH, Stewart SI, Hammer RB, Radeloff VC (2019) Forests, houses, or
both? Relationships between land cover, housing characteristics, and resident socioeconomic
status across ecoregions. Journal of Environmental Management 234:464–475.
Mondal P, Butler BJ, Kittredge DB, Moser WK (2013) How are America’s private forests
changing? An integrated assessment of forest management, housing pressure, and urban
development in alternate emissions scenarios. Land Use Policy 32:230–238
Muminjanov H (2008) State of Plant Genetic Resources for Food and Agriculture (PGRFA)
in the Republic of Tajikistan: country report. Dushanbe. http://www.fao.org/pgrfa-gpa-
archive/tjk/Tajikistan2.pdf
Mustaeva N., Wyes H., Mohr B., Kayumov A., (2015) Tajikistan: country situation
assessment. The Regional Environmental Center for Central Asia (CAREC).
https://carececo.org/upload/02/eng_CSA_Tajikistan.pdf
OSCE (Organization for Security and Co-operation in Europe) (2018) Natural hazards in
Tajikistan. OSCE Technical Report.
https://www.osce.org/programme-office-in-dushanbe/408008?download=true
Rehnus M, Nazarek A, Mamadzhanov D, Venglovsky BI, Sorg JP (2013) High demand for
firewood leads to overuse of walnut-fruit forests in Kyrgyzstan. Journal of Forestry Research
24:797–800
Sangay W (2011) Fuelwood consumption and production in alpine Bhutan: a management in
Wangchuk implications for conservation and case study of resource use and Centennial Park.
Master’s thesis. University of Montana, Missoula
https://scholarworks.umt.edu/etd/474
Schneidergruber M, Cierna M, Jones T (2004) Living with foods: achieving ecologically
sustainable flood management in Europe. WWF European Policy Office, Brussels
Schubert R, Schellnhuber HJ, Buchmann N, Epiney A, Grießhammer R, Kulessa M, Messner
D, Rahmstorf S, Schmid J (2009) Future bioenergy and sustainable land use. Earthscan
Publications, London
Stein SM, McRoberts RE, Alig RJ, Nelson MD, Theobald DM, Eley M, Dechter M, Carr M
(2005) Forests on the edge: housing development on America’s private forests. General
Technical Report PNW, USDA Forest Service, Washington D.C.
Stein, S.M., McRoberts, R.E., Mahal, L.G., Carr, M.A., Alig, R.J., Comas, S.J., Theobald,
D.M., Cundiff, A (2009). Private forests, public benefits: increased housing density and other
pressures on private forest contributions. USDA and Forest Service General Technical Report.
PNW-GTR-795, Pacific Northwest Research Station, Corvallis
Theobald (2005) Landscape patterns of exurban growth in the USA from 1980 to 2020.
Ecology and Society 10:(1)32
UNECE (United Nations Economic Commission for Europe) (2012) Tajikistan, second review.
Environmental Performance Reviews Series 33, ECE/CEP/163. New York and Geneva
28
World Bank (2017) Reducing multi-hazard risks across Tajikistan: protecting communities
through quality infrastructure (English). Washington D.C., World Bank Group.
http://documents.worldbank.org/curated/en/759391512551626035/Reducing-multi-hazard-
risks-across-Tajikistan-protecting-communities-through-quality-infrastructure
World Bank Group (2005) Community based resource mapping.
http://siteresources.worldbank.org/EXTTOPPSISOU/Resources/.pdf
WWF (World Wide Fund for Nature) (2017) Riparian forests: benefits, present condition,
conservation. Bulgaria, Sofia
https://www.gfdrr.org/sites/default/files/publication/Tajikistan.pdf
Wiedemann C, Salzmann S, Mirshakarov I, Volkmer H (2012) Thermal Insulation in High
Mountainous Regions. Mountain Research and Development 32:294–303

29
APPENDICES
APPENDIX I. GUIDELINE FOR SEMI-STRUCTURED INTERVIEWS
ID of Questionnaire _________
Date: “_________” _________ 2019
Region: _________________________District: _______________Village: _____________
Name of respondent: _________________________________________________________
Age of respondent _____________
Gender: male female
The purpose of conducting this survey is to understand the main reasons of the forest
degradation problems and to clarify the pressure on forests by accounting the demands of
consumers on forest resources in comparing with the availability of the resources.
The personality is not be mentioned in the report and all the provided information by the
respondents will be kept confidential and should be used only for the research purpose.
1. Do you have a forest in your village or nearby to your village?
Yes No
2. What is the average size of your forest? _________ha
3. Do you have any kind of forest land?
Private forest
JFM forest
Rented forest
Other
4. Do not have any kind of forest plots? If yes how much ha do you have and how do
you use the forest plots?
5. To whom belongs the forest area in your village? (Please tick all relevant answers)
State Forest Enterprise
Deqan farmers (Association)
It belongs to the village
Private
Others
6. Do you have access to forest?
Yes No
Please explain in both cases, if yes how you are using forest, and if not, why you do not have
access to forest.

30
7. Do you think the forest size still is the same as it was before, or it has been changed
over the time?
Yes, it changed
No, it did not change
If the forest size has been changed, then ask him/her to give a reason of what, why and how it
has been changed.
8. How the forest condition was in the past? What do you think about the forest change
if to compare the current forest condition with previous Soviet Union time? Please
take notes in more detail
9. Do people use the forest land for building house?
10. Approximately how many houses were built in the forest area until nowadays? (And
ask the respondent about the approximate size of plots where the house was built)
11. What do you think, why do people build house in forest area? (Please, clarify the
reason, and ask if there is any free place for building house)
12. Did you observe any flooding or mudflow in your forest, and how it influenced on
the forest?
(Please, ask if there was any flooding before, then ask your respondent how many ha of
the forest was destroyed?)
13. What do you think if the population number is increasing the demand on firewood
will increase or not?
Yes No
14. How do you predict the future of your forests? Does the growth of population and
their demands impact on forest condition or not?
15. What are the main reasons of forest degradation? (Please, list all the answers, which
the respondent tells you and which are really causing the degradation of the forest
area).
High demands on firewood
Uncontrol grazing
Flooding
Erosion
Lack of water
Building houses

31
Week control of SFE
Influence of climate change
Other reason
16. What kind of energy do you use for cooking food and heating houses? (Please, list
all type of energy which the respondent tells you, and indicate each of them with
priority number. Enter amounts of use for each that applies)
Electro power
Firewood
Gas
Coal
Animal dung
Other
17. How much firewood (m3) do you consume for one year?
18. From where do you get the firewood?
From you own yard
From forest
From market
From another village
Other
19. Which type of trees do you usually use for firewood? (If the respondent tells several
species, please rate them from high to low)
Willow
Poplar
Birch
Sea buckthorn
Other tree species and bushes
20. If you get firewood from forest do you need any permission?
21. From where do you get the permission for firewood?
22. What about the price of firewood, how much does it cost?
23. For how long period do you heat your house during the year. (Please, indicate the
exact time of heating period)
All year.
______months
Please ask the respondent, if the heating period is the same in compare with previous years
or it is different. Write the using amount firewood and period heating and cooking for at least
5 years, if it is available.

32
24. What do you think about the availability of firewood, does it enough for you during
one-year period?
25. Does the firewood resources is enough in the forest or not?
Quite enough
Enough
Not enough
We don’t have any resources
26. Do you have any idea to reduce the using amount of firewood, in order to save the
resources and money?
27. Do you know about any new energy efficiency technology?
28. What is the importance of forest for you?
29. What are the main functions of forest that you know?
30. Are you satisfied with the forest coverage and productivity?
Satisfied
Partly satisfied
Not satisfied
31. Do you have any animals?
Yes No
32. Please, could you tell us the approximately number of all domestic animals of your
village?
Large livestock_____________
Small livestock_____________
33. Where do you graze your livestock?
34. Do people use forest for grazing?
Yes No
35. Can you tell us for how many days people graze in the forest during the period of
year?

33
36. In which season people graze in forest? (Please tick all relevant answer)
Winter
Spring
Summer
Autumn
(Please, clarify in more detail, how many livestock the villagers graze in forest)
37. Does the grazing influence on forest growth? (Ask your respondent about the grazing
effect in more detail)
38. Is there any penalty system for grazing in the forest?
Yes No
Please tell in detail the process of fining system, why yes or no?
39. Who is responsible for the penalty system?
40. What do you suggest for making better the forest condition?
41. Please, feel free to add any comments, suggestions or expectation you have?
Say thanks to respondent for his/her time and shared information.
APPENDIX II. FOCUS GROUP DISCUSSION GUIDELINE
The focus group discussion topic is:
“The change of forest from the past to present and the prediction for future”
ID of Questionnaire _________
Date: “ _________” _________ 2019
Region:_____________________District:_____________________________
Village:_____________
№ Name of respondent Age of respondent mail female
1
2
3
4
5
6
7
34
8
The main aim of this group is to discuss the forest change in the period from past to present
time and to predict the future scenario of forest development. This method will help us to
understand and get clearer view of the forest situation in different period. With this exercise,
we intend to involve the local community to draw the resource map of their village. In the map
mainly they should draw the main existing resources of their surroundings such as settlement
area, arable lands, pasture and forest sites. It is required to draw three maps of the village, but
for three different periods, with consideration to show the view of each time as it was or must
be. In the first map, it is required to draw the village approximately how it looked like in the
past 30 years and in the second map to draw the current situation of it in terms of change from
the past. In the last map must be drawn how the village will be in future. The focus will be on
how the changes are occurring over time and what is the main reason for these changes. The
aim of using this method is to visualize the changes in land use to find out the main driving
force of these changes.
In the Community Resource Mapping should participate a group of 6-8 key informants in each
target village. The participants should be males and females aged 50-70 years, mainly those
who had lived in the village for the last 30 years.
Instruction for discussion.
First to explain the aim of the topic and then ask them to discuss the forest degradation
problems. The main questions of this discussion are:
o What are the main reasons for forest degradation?
o How many m3 firewood do you need for one year?
o Do you see any shortage in forest resources?
After the discussion, the research assistant will facilitate them to draw their village resources
map for three periods. It is required to draw all changes that occurred over time and all problems
that relate to the environment. The research assistance should lead the group through all the
process and if there is anything unclear, he or she should explain and guide the group.
Everything should be enough clear drawn in the map. Each map should be drawn in the
separate flipchart. When the past and current resources maps are done, the facilitator should
ask the participants to compare the first two maps and then lets them continue to visualize their
future map with the prediction of how it would be in terms of changes.
Taking into consideration the intensive growth of population, increasing the demand on natural
recourses, the climate change impacts and other factors that might impact on their environment.
After that, the facilitator should ask the participants to say their opinion of this difference and
changes and to suggest some ways for solving the problem.