Embed Size (px)
Citation preview
RACE AND ALTERNATIVE SCHOOLS
Richard R. Verdugo and Beverly C. Glenn
This paper was partially supported by the Hamilton Fish Institute on School and Community Violence through Award No. 2005-JL-FX-0157, awarded by the Office of Juvenile Justice and Delinquency Prevention, Office of Justice Programs, U.S. Department of Justice. Points of view or opinions in this document are those of the author and do not necessarily represent the official position or policies of the U.S. Department of Justice or The George Washington University.
RACE AND ALTERNATIVE SCHOOLS
Richard R. Verdugo and Beverly C. Glenn1
Paper presented at the annual meeting of the Alternatives to
Expulsion, Suspension, and Dropping Out of School
Conference. February 16 – 18, 2006. Orlando, Florida
ABSTRACT
Traditional mainstream public schools are not for everyone. Some students are unable to function in traditional schools, though they might have the aptitude to do so. Other students have special needs (e.g., emotional problems, marriage, children), and still others have been retained for one or more years and may feel out-of-place in traditional environments. Then there are those students who are placed in alternative schools in lieu of expulsion or suspension. One issue that has taken on greater urgency in recent years concerns the discipline of racial and ethnic minorities in school. There is mounting evidence that Black and Hispanic students are disciplined at rates greater than their representation in school. It is quite reasonable to assume that alternative schools might be used to house ethnic/racial minority students. Moreover, if this is the case what is the focus of these schools, academic, vocational, or disciplinary? The purpose of our paper is to explore some of these issues by (1) examining the relationship between the percent minority in a school district and the presence of at least one alternative school, and (2) examine the traits/focus of these schools.
1 Richard R. Verdugo is the Senior Research Scientist at the National Education Association, Washington, DC. Beverly C. Glenn is Director, The Hamilton Fish Institute on School and Community Violence, The George Washington University, Washington, DC. Address all correspondence to Richard R. Verdugo, NEA, 1201 16th Street, N.W., Washington, DC 20036. The views expressed in this paper do not necessarily reflect the views of our employers, the National Education Association or the George Washington University.
2
RACE AND ALTERNATIVE SCHOOLS
I. Introduction
Traditional mainstream public schools are not for everyone. Some students are
unable to function in traditional schools, though they might have the aptitude to do so.
Other students have special needs (e.g., emotional problems, marriage, and children), still
others have been retained for one or more years and may feel out-of-place in traditional
environments. Then there are those students who are placed in alternative schools in lieu
of expulsion or suspension. Alternative schools exist for a variety of reasons, and their
focus also varies depending on their mission and the kind of students they serve.
One issue that has taken on greater urgency in recent years concerns the
discipline of racial and ethnic minorities in school. There is mounting evidence that
Black and Hispanic students are disciplined at rates greater than their representation in
school (Skiba et al 2000, p. 14):
“…ethnographic studies have reported that students consistently perceive
that students of color and those from low-income backgrounds are more
likely to experience a variety of school punishments… Unfortunately,
results both in this study and in previous research going back at least 25
years are consistent with those perceptions.”
If race and ethnicity are related to school discipline, are they also related to being
sent to alternative school environments? And what kind of alternative schools are they
being sent to? Are they being sent to alternative schools where the focus is on discipline
rather than on education? The purpose of our paper is to examine the extent to which
race is associated with alternative school environments; especially those alternative
schools whose focus is discipline rather than academic or vocational. Using data from
the US Department of Education’s alternative school survey, we examine the following
hypothesis: the greater the percent minority students in a school district, the greater the
likelihood they are sent to alternative schools whose focus is on.
3
II. Background
A. The Demography of Alternative Schools
1. Number of School Districts with Alternative Schools
Nearly forty percent (39%) of all US school districts have alternative schools.
There are, however, some important urban and regional differences. (See Table 1.)
Table 1 about here
Not only are alternative schools an urban phenomenon, but it also seems that
most districts in the southeast have at least one alternative school. About two-thirds of
urban schools (66%) have alternative schools. Compare this figure to the 41% and 35%
of suburban and rural school districts, respectively. Moreover, it also appears that a large
number of school districts in the southeastern part of the country have at least one
alternative school--about 80 percent. In contrast, only 28 percent of school districts in the
central United States have alternative schools and 31 percent of northeastern school
districts have alternative schools. In addition, Kleiner et al (2002) indicate that nationally
there are 10,900 public alternative schools, with an enrollment of about 612,900 students.
What should be of interest is whether alternative schools will proliferate in years
to come. There are at least two issues that may drive up the creation of such schools.
First, there is the national concern with school safety. Many alternative schools have
been established to handle disruptive students, and we can see the creation of such
schools to handle what many believe is a growing problem. Second, the academic
achievement of U.S. students is a major policy topic, for both white and ethnic-racial
minorities. Alternative schools can be established to create non-traditional environments
to handle the specific needs and issues of low achieving students. Time will tell whether
alternative schools will be an option for dealing with both these important educational
issues.
2. Alternative Schools by Grade Level
At what level are alternative schools best suited? Are they needed or best suited
for elementary school students or for students in secondary school? The empirical data
4
suggest that educational decision makers believe they are best suite for students in the
upper grades.
The percent of school districts with alternative school programs increases as the
grade level increases. Data in Figure 1 corroborates such a statement--from a low of one
percent for PK, and seven percent for Kindergartners, to about ninety percent for high
schools.
Figure 1 about here
Is this particular pattern sound educational policy? Given the many current
educational crises surrounding the American educational system, we believe some
additional thinking needs to be introduced. Certainly one strategy would be to introduce
alternative schools in districts with significant number of students who are chronically
disruptive, who fail to fit into traditional school environments, or whose career choices or
interests simply cannot be met by traditional schools. Alternative schools are one way of
addressing many of the challenges currently facing the American public school system.
3. Enrollment
In terms of student enrollment, alternative schools do not have a significant
proportion of students in school districts. This is as it should be because alternative
schools were never meant to replace public schools, but to ease the challenges of
educating a small percentage of students who, for one reason or another, do not fit
traditional school environments. Forty-three percent of school districts have alternative
schools that enroll less than 1 percent of their total student enrollment. In contrast,
sixteen percent of school districts have alternative schools that enroll three percent or
more. These data may be found in Table 2.
Table 2 about here
B. Types of Alternative Schools
There are to be at least three types of alternative educational environments
(Raywid 1994). A listing and brief descriptions of each may be found in Table 3.
5
Table 3 about here
Are these programs effective? Type I, programs are less costly than Type
III because they operate with the same student-adult ratio as traditional schools
(Raywid 1982). These schools also tend to be effective, and there is evidence that
their effects are long lasting (Wehlage et al. 1989; Wood 1989; Schwartz 1993).
They tend to generate long-lasting effects because they have many of the traits of
quality schools (see Verdugo et. al. 1997).
Type II programs do not appear to be effective. In one study of Type II schools
in Florida, researchers found that such programs had no effect in dropout or referral rates,
corporal punishment, suspension, or expulsion. Type II alternative schools are mainly
concerned with discipline and with maintaining order. Their ability to nurture and
educate students is thus severely hampered.
In contrast, Type III schools also tend to be effective in terms of attendance and
the accumulation of credits (Gold and Mann 1984). Despite their success, Type III
programs tend to be costly. First, Type III schools are costly--they maintain low teacher-
-to-student ratios that increases operating costs. Second, their success is short term, and
when students return to their main school many tend to revert to their initial problematic
behaviors (Frazer and Baenen 1988). There are at least two reasons why students return
to their old behaviors. First, the attention and care they receive at type III alternative
schools is absent in traditional schools. They become just another student in their old
school (and probably are stigmatized for being placed temporarily in an alternative
school). Second, they return to an environment and peers that are not conducive to their
continued academic achievement.
It should be pointed out that in the alternative schools literature there is no
consensus about what is meant by effective. School systems have used a variety of
indicators or goals to assess the success of their programs. Examples of such indicators
are graduation rates for students sent to alternative environments, school performance,
and rates at which students are returned to their home-based schools. Clearly, one
important topic for further research would be to relate this body of research to the
effective schools research.
6
C. Race, Discipline, and Alternative Schools
A disproportionate percentage of minority students are punished by school
officials (Children's Defense Fund 1975). Although the CDF study is 25 years old and its
data are even older, Skiba and his colleagues substantiate these results (Skiba et al. 1997).
For example, while African American students are overrepresented among those
receiving corporal punishment and expulsions, they are less likely to receive milder
sanctions (Skiba et al. 1997; Skiba et al. 2000). Race and ethnicity appear to be key
factors in zero tolerance policies.
An important way to examine the issue is by studying expulsions and
suspensions by race and ethnicity. These data may be found in Table 4. Black and
Hispanic students are more likely than White students of being expelled or suspended
from school. For example, in 2000 Black students comprised 17 percent of total
enrollment in K-12 public schools, yet they were 38.6 percent of total corporal
punishments, 34 percent of out-of-school suspensions, 29.6 percent of expulsions, and 29
percent of expulsions with no educational services. In 2002, the percent facing corporal
punishment remained the same, out-of-school suspensions climbed to 36.3 percent,,
expulsions rose to 31.6 percent, and expulsions with no educational services rose to 34.3
percent. The similar data for whites in 2000 were 62 percent of enrollment, 53.1 percent
corporal punishment, 47.6 percent out-of-school suspensions, 49.1 percent expulsions,
and 56.5 percent expelled with no educational services. In 2002, the figures were 59.4
percent enrollment, 52.9 percent corporal punishment, 44.2 percent out-of-school
suspensions, 44.3 percent expulsions, and 50.5 percent expelled with no educational
services. For Hispanic students, the figures aren’t as dramatic, but they also appear to be
overrepresented in terms of expulsions. Thus, in 2000, Hispanics represented 16 percent
of the total student population but 17.6 percent of expulsions; and by 2002 they
represented 17 percent of enrollment but 19.9 percent of expulsions.
Table 4 about here
Critics offer two arguments about the relation between race/ethnicity and zero
tolerance policies. First, the argument is made that race and ethnicity are not as
important as socioeconomic status, and, second, that the higher rates of punishment for
7
minorities are due to their higher rates of inappropriate behavior. On the first issue,
research has shown that after controlling for socioeconomic status, race is still related to
such discipline as suspension (Shi-Chang C. Wu et al. 1982). Secondly, research has
found that when comparing rates of misbehavior for African American and other students
differences are minor. Student misbehavior has a weak effect on the observed
discrepancies in suspension/expulsion rates between Black and White students (Shi-
Chang C. Wu et al. 1982; McCarthy and Hoge 1987). Race not only continues to be
related to discipline even after controlling for other important factors, but there are race-
biased differences in the disciplining of students.
Minority overrepresentation in school punishment is by no means a new issue.
Extensive investigations of school punishments over the past 25 years have consistently
raised questions about socioeconomic and racial disproportionality in the administration
of school discipline (e.g., Children’s Defense Fund, 1975; McCarthy & Hoge, 1987;
Skiba, Peterson, & Williams, 1997; Thornton & Trent, 1988; Wu, Pink, Crain, & Moles,
1982). The meaning of those statistics remains unclear, however. Despite extensive
documentation of the existence of racial, socioeconomic, and gender disparities in school
discipline, there has been little systematic exploration of possible explanations for this
disproportionality.
1. Socioeconomic Status and School Discipline
Studies of school suspension have consistently documented disproportionality by
socioeconomic status (SES). Students enrolled in free school lunch programs are at
greater risk of being suspended from school (Skiba et al., 1997; Wu et al., 1982). Wu et
al. (1982) also found that students whose fathers did not have a full-time job were
significantly more likely to be suspended than students whose fathers were employed
full-time.
In a qualitative study of student reactions to school discipline, Brantlinger (1991)
interviewed adolescent students from both high- and low-income residential areas about
their views on about school climate and school discipline. Both low- and high-income
adolescents agreed that low-income students were more likely to be unfairly disciplined.
There also appeared to be differences in the kind of punishment given to students of
different social classes. While high-income students more often reported receiving mild-
8
to-moderate sanctions (e.g., teacher reprimand, seat reassignment), low-income students
reported receiving more severe sanctions, sometimes delivered in a less than-professional
manner (e.g., yelled at in front of class, made to stand in hall all day, search of personal
belongings).
2. Minority Group Status and Discipline
The overrepresentation of minorities, especially African American students, in
the use of exclusionary and punitive consequences is of great concern. In one of the
earliest studies of school suspension, the Children’s Defense Fund (1975) studied
national data on school discipline provided by the U.S. Department of Education’s Office
for Civil Rights (OCR), and reported rates of school suspension for black students that
exceeded white students on a variety of measures. Indeed, rates of suspension for black
students were two and three times higher than suspension rates for white students at the
elementary, middle, and high school levels. Also, while 29 states suspended over 5
percent of their total black enrollment, only 4 states suspended 5 percent or more of white
students. Finally, black students were more likely than white students to be suspended
more than once. It should be noted, though, that there were no racial differences in the
length of suspension.
Since that report, racial disproportionality in the use of school suspension has
been a consistent finding (Costenbader & Markson, 1994; Costenbader & Markson,
1998; Glackman et al., 1978; Gregory, 1997; Kaeser, 1979; Lietz & Gregory, 1978;
Massachusetts Advocacy Center, 1986; McCarthy & Hoge, 1987; McFadden, Marsh,
Price, & Hwang, 1992; Skiba et al., 1997; Streitmatter, 1986; Taylor & Foster, 1986;
Thornton & Trent, 1988; Wu et al., 1982). African American students are also more
likely to receive harsher discipline sanctions, such as corporal punishment (Gregory,
1996; Shaw & Braden, 1990), and are less likely to receive mild disciplinary sanctions
for some school infraction (McFadden et al., 1992). The overrepresentation of African
American students in school suspension and expulsion appear to increase as those sorts of
punishments are more frequently used (Advancement Project, 2000; Massachusetts
Advocacy Center, 1986). Finally, recent studies of recently desegregated schools have
found that disproportionality in school suspension appears to increase immediately after
9
schools have been desegregated, especially in high socioeconomic status schools (Larkin,
1979; Thornton & Trent, 1988).
It has been suggested that the interpretation of disproportionality data depends
upon how the data are presented (MacMillan & Reschly, 1998; Reschly, 1997). Reschly
(1997) notes that disproportionality data are often reported in two different ways. The
first method compares the baseline distribution of the target group in the population with
the distribution of that group in the category under study (e.g., African Americans
represent 16% of general enrollment, but 24% of the enrollment in classes for students
with mild mental retardation); the second strategy is to use the absolute proportion of a
population being served in a category (e.g., of the entire population of African American
students, 2.1% are enrolled in programs for students with mild mental retardation).
Reschly goes on to note that studies of disproportionality have used different criteria in
assessing over-or-under representation. The lack of clear reporting leads to much
confusion. However, it is not clear whether changing how data are reported will affect
the conclusions made from the data.
Many scholars have studied the overrepresentation of minorities in school
suspension and expulsion decisions since the Children’s Defense Fund (1975) report
(Costenbaqder and Markson 1998; Gordon, Della, Piana, and Kelher 2000;
Massachussetts Advocacy Center 1986; Mc Fadden, Marsh, Price, and Hwang 1992;
Taylor and Foster 1986; Thornton and Trent 1988; Kaeser 1979; Wu, Pink, Crain, and
Moles 1982).1 This body of work has used “ten percent of the population” standard in
determining whether a group is over-represented in such disciplinary decisions (Reschly,
1997). A subpopulation may be considered over-or-underrepresented if its proportion in
the target classification exceeds its representation in the population by 10% or more.
Thus, if Hispanic students constitute 10% of the population, they will be considered to be
over-represented in terms of suspended disproportionately if more than 22% or less than
18% of students who were suspended were Hispanic. Nearly all studies comparing
proportion of population and proportion of students suspended report disproportionality
statistics that meet or exceed this standard. These studies find overrepresentation of
African Americans, regardless of the statistical criteria used, yet fewer investigations
have explored disciplinary disproportionality among students of other ethnic
10
backgrounds. While there appears to be overrepresentation of Latino students in some
studies, the finding is not universal across locations or studies (see Gordon et al., 2000).
Gender is also a factor in school discipline decisions. The evidence of boys
being overrepresented in school disciplinary decisions is universally consistent (Lietz &
Gregory, 1978; McFadden et al., 1992; Shaw & Braden, 1990; Skiba et al., 1997; Taylor
& Foster, 1986). Indeed, research has found that boys are four times more likely than
girls to be referred to the office, suspended, or subjected to corporal punishment (Bain &
MacPherson, 1990; Cooley, 1995; Gregory, 1996; Imich, 1994). There appears to be a
gender-race interaction in the probability of being disciplined. Using U.S. Office for
Civil Rights data from 1992, Gregory (1996) found that black males were 16 times more
likely than white females to be subjected to corporal punishment. At both the junior and
senior high school levels, Taylor and Foster (1986) reported the following ranking in the
likelihood of suspension from most to least: black males, white males, black females,
white females.
These results on race-based over-representation of minorities in school discipline
decisions and the use of alternative schools as a strategy for dealing with disruptive
students suggests to us the following hypothesis:
H1: The greater the percent minority in a school district, the greater the likelihood of an
alternative school being present in the school district.
In addition to examining this hypothesis, we conduct some exploratory analysis of
alternative schools in districts with high percentages of minority students. The two
questions we examine are: (1) Is the focus of alternative schools with high percents of
minorities disciplinary, vocational, or educational?; and (2) are alternative schools with
high percentages of minorities more likely to form collaborations with police and the
juvenile justice system?
11
III. Methods
A. Data
Data for this study are from the 2001 public alternative schools and programs
for students at risk of education failure survey. The data refer to 1,540 schools districts
with alternative educational environments and are representative of alternative schools in
the United States. A short description of the districts may be found in Table 5.
Table 5 about here
B. Variables
1. Dependent Variables
The dependent variable throughout our analysis is the presence of alternative schools
in a school district. In our QCA analysis, 1 = present, and 0 = absent.
2. Independent Variables
a. Urban. Three codes are used to identify urbanicity. These are urban, suburban, and
rural areas. We collapsed the item to two statuses: suburban/urban combined, and rural.
b. Percent Minority. Percent minority is based on the following two categories:
thirty-three percent or more, and less than 33 percent.
c. Poverty. The percent in poverty in a school district is based on the following two
categories: if the percent at or below the poverty level is 20 percent or more, and less than
20 percent. The dichotomy is, of course, arbitrary.
C. Qualitative Comparative Analysis (QCA)
QCA’s Boolean techniques analyze dichotomous data on specified outcomes (O)
and the hypothesized preconditions ( C ) for them. Initially, data are arrayed in a Truth
Table that consists of logical combinations of Cs and the corresponding value of the
outcomes. Ideally, all theoretically possible combinations of Cs are included.
Next, the data are simplified into rows of Primitive Terms. Then if these terms
are solvable (no contradictions, e.g., Cs lead to O and not-Os), the terms are reduced into
the most parsimonious logical expression that equals O via the application of Boolean
12
algorithms. In this logic, “+” equals or, and “x” equals and. Also, in the QCA language,
uppercase letters refer to the presence of a concept, while lowercase letters mean that the
concept is absent. In our analysis, for example, we expect A = U + P + V. That is,
suburban/urban residence (U), poverty (V), and percent minority in a district greater than
33 percent (P) to be linked to the presence of alternative schools (A).
IV. Findings
A. The Presence of Alternative Schools
Our hypothesis is that alternative schools are more likely to be present in districts
with high percentages of minority students. School districts with higher rates of minority
students also tend to have higher rates of alternative schools. Indeed, in districts where
the percent minority is less than thirty-three percent, 47 percent have alternative schools.
In contrast, in districts where minority students represent 33 percent or more, 76 percent
have alternative schools. (See Figure 2.)
There is a relationship between a district’s rate of poverty and the presence of
alternative schools. Districts in which the percent below the poverty line is less then 20
percent have an alternative school rate of 52 percent. In contrast, where the poverty rate
is 20 percent or more, the alternative school rate is 62 percent.
Alternative schools are only slightly more likely to be present in suburban/urban
than in rural areas. In rural areas, the alternative school rate is 54 percent, and the rate in
suburban and urban districts is 57 percent.
Table 6 presents the truth table for our QCA results. We will use the data from
this table to generate a picture of how urban/suburban (U), poverty (V), and percent
minority (P) are associated with the likelihood of an alternative school (A) being present
in a school district.
Table 6 about here
Before continuing, note that in this particular truth table there are sixteen (16)
possible outcomes and eight (8) profiles. As it stands, the additional eight rows are
contradictions because logically, there should only be 2k possible rows in a truth table
13
using Boolean logic, where k = the number of predictor variables. In our case, there
should only be 23 = 8 rows. In reality, though, the same profiles can and do lead to
different outcomes of the dependent variable, alternative schools (A). Ragin (1987) has
suggests two solutions to such a problem, neither of which, we would argue, is
completely satisfying. The first solution is to look for other variables to be included in
the model. A second strategy is to model the contradiction into the QCA model.
However, both suggested strategies add other variables to the equation which adds to the
complexity of the analysis. Since the number of profiles increases at 2k, it would be wise
to keep the number of variables to a minimum. Our strategy computes probabilities for
all sixteen profiles and uses them in making decisions about which profile to keep in the
final analysis. Thus, consider the same profile with two different outcomes:
UVP = 0 and UVP = 1
When A = 0 there are 19 cases, and when A = 1 there are 59 cases, for a total of 78 cases
for the UVP profile (Fuvp,0 + Fuvp,1 = 78). In essence, the likelihood function of Ψ(F0) = 0
is, FUVP,0 /(FUVP, 0 + FUVP, 1 ) = 19/78 = 24.4, and the likelihood of Ψ(F1) = 75.6 or 100 -
Ψ(F0). So, FUVP,1 > FUVP,0 . Theoretically, then, FUVP,1 has a greater likelihood of an
outcome of 1 than of 0. Since our concern is with theoretical development, we choose to
accept those similar profiles (arguments) where P (A=1) with the greater likelihoods
Ψ(Fi).
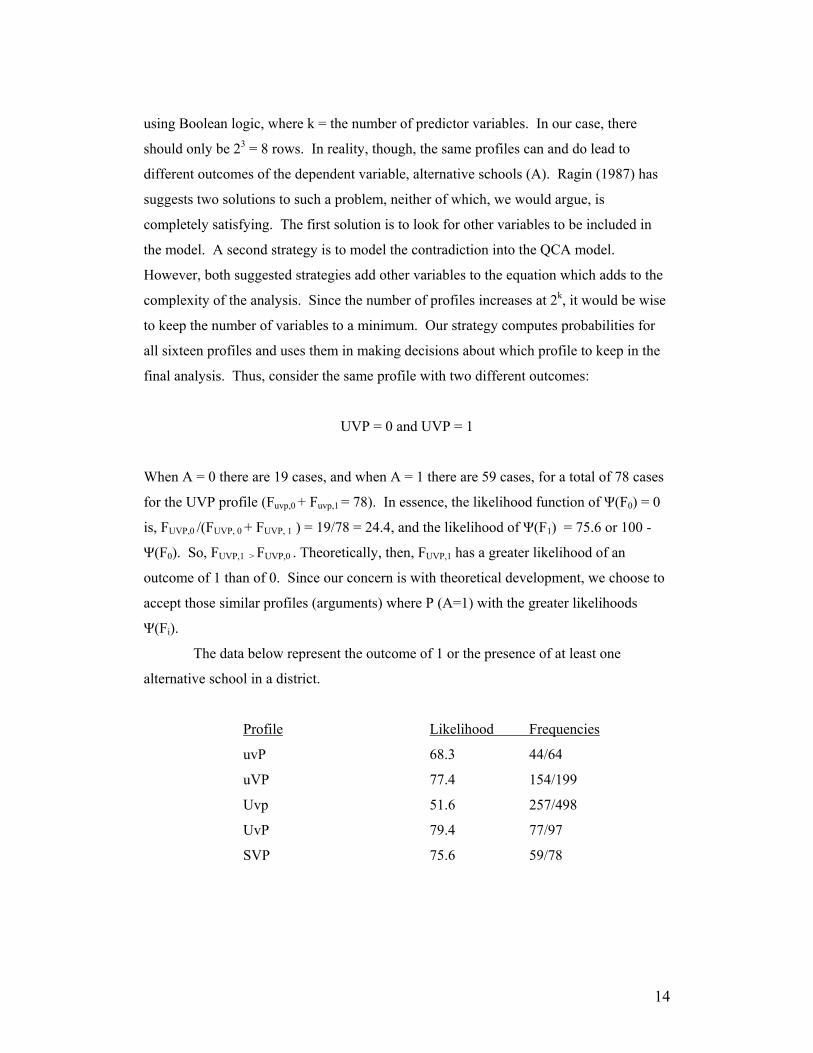
The data below represent the outcome of 1 or the presence of at least one
alternative school in a district.
Profile Likelihood Frequencies
uvP 68.3 44/64
uVP 77.4 154/199
Uvp 51.6 257/498
UvP 79.4 77/97
SVP 75.6 59/78
14
Thus, the primitive terms are: A = uvP + uVP + Uvp + UvP + UVP. We can further
minimize these terms into something more manageable. Minimization is based on the
notion that if two terms share two elements but not one and lead to the same outcome,
then a new term would simply represent these two terms. For example, uvP and uVP can
be minimized to uP because both terms lead to P(A= 1), and both terms share u and P,
but not V. Thus, after further minimization we are left with—
A = uP + Uv +UP + VP
And further minimization leads to the final equation:
A = P + U
In other words, the presence of at least one alternative school in a school district
is more likely to occur when the percent minority is greater than 33 percent (P), or when
the district in an urban/suburban area (U).
B. Alternative Schools, Race, and Other Factors
In this section we examine a selected number of traits associated with alternative
schools, especially as these traits are related to the percent minority in a school district.
The model we use in helping us with our analysis is presented in Figure 3.
Figure 3 about here
By reasons (R ) we mean the reasons students are sent to alternative schools in
the first place. Program (P) refers to the sort of education, training, and curriculum
available to students in alternative schools. Some alternative schools collaborate (C )
with a number of community organizations, such as juvenile justice, child care, police,
business, etc., and we examine the kind of community organizations with whom
alternative schools collaborate. Finally, many alternative schools send students back to
their home schools after some criteria are met. We examine (1) if students are sent back,
15
and if they are (2) what benchmarks must be met in order for students to be sent back.
We also examine these topics by the percent minority in a district.
1. Reasons Students are Sent to Alternative Schools
Students are sent to alternative schools for a number of reasons. Some are based
on life styles, some on the academic needs of students, and others are based on discipline
issues. School officials were asked to list the number of reasons students are sent to
alternative schools in their districts. Data are also presented by percent minority. Table 7
presents these data.
Table 7 about here
There are eleven listed reasons for sending students to an alternative school
environment. Of these eleven reasons, the top three are: the use/distribution of drugs or
alcohol, fighting or assault, use of a weapon, and continual truancy. The least likely
reasons are: mental health, pregnancy/parenthood, and arrest or involvement in the
juvenile justice system.
Percent minority in a school district appears to affect the reasons students are
sent to an alternative school environment. We only discuss those differences that are 10
percent or greater. Of the eleven reasons listed for sending a student to an alternative
school six meet the 10 percent standard: possession of a firearm, other weapons
possession, drug/alcohol possession, an arrest, fighting/assault, and verbal abuse. Of
these differences, drugs/alcohol, other weapons possession, and verbal abuse are the most
significant. In all six cases, districts in which minorities are 33 percent or more of the
total student population, the more likely are they to be sent to alternative schools.
2. Programs Available in Alternative Schools
Table 8 presents data on the programs alternative schools have available for
students. Alternative schools offer a variety of programs for students. The top three
programs are: (1) a curriculum leading to a regular high school diploma; (2) academic
counseling; and (3) small classes. The least offered programs include—offering
evening/weekend classes, extended day or year school, and preparation for the GED.
16

Table 8 about here
Since alternative schools are often used for disruptive students, the question we
ask is “what percent of alternative schools offer programs addressing disruptive
students?” Data in table 8 exhibit information on programs that might address such
issues: psychological counseling (59.8%); crisis/behavior intervention (79.4%); social
work services (54.6%); and peer mediation (36.3%).
Once students are sent to an alternative school, how likely are they to receive
academic and other services? And are there differences in services when the district’s
student population is thirty-three percent or more minority? While percent minority
accounts for only small differences in the programs offered in alternative schools, two are
significant. Alternative schools in districts where the percent minority is 33 percent or
more are more likely to offer social work services, and are more likely to have security
personnel on site.
3. Collaboration with the Community
Collaboration with community organizations is an important factor in making
schools safer. These collaborations are indicators of the concerns and services being
provided by alternative schools, so they are important windows for viewing what
alternative schools are actually doing. We suspect that most alternative schools work
with many community organizations. Data in Table 9 present such information.
Table 9 about here
The top three organizational types with whom alternative schools collaborate are:
(1) juvenile justice agencies; (2) the police; and (3) child protective services. Alternative
schools are least likely to collaborate with (1) parks and recreation, (2) job placement
centers, and with (3) family planning agencies.
Percent minority does not generally appear to affect the kinds of collaborations
being sought by alternative schools. There are, however, three collaborations that are
significantly different. Alternative schools where the percent minority in a district is
17
equal to or greater than thirty-three percent are more likely to form collaborations with
family planning organizations, community organizations, family organizations, and with
parks and recreations. Note, also, that such alternative schools are more likely to form
collaborations with police departments—eight percent more likely than alternative
schools in districts with less than thirty-three percent minority.
4. Alternative School Exits
Finally, in many alternative schools students are allowed to return to their home
schools. These “exit” plans, however, tend to be contingent on a number of factors, such
as improved grades, better behavior and attitudes. What kinds of standards do alternative
schools use in determining how students are sent back to their home schools, if, in fact,
they are allowed to do so. Generally, though, about ten percent of alternative schools do
not allow students to return to their home school.
Table 10 presents data on the criteria alternative schools set for returning
students to their home schools. A majority of these standards are based on
behavior/attitude, and academic improvement.
Table 10 about here
The most important reasons for sending students back to their home schools are:
student wants to return (93%), approval of alternative school administrator/teachers
(92%), and improved attitude/behavior of student (88%). The two least important criteria
are the availability of space at the home school (5%), and a student’s score on a
standardized readiness assessment (38%).
Based on the percent minority (PM) in a school district, there is considerable
variation in the criteria alternative schools use for sending students back to their regular
schools. An examination of these differences is very informative. To begin with, grades
are somewhat important for alternative schools in districts where minorities are less than
thirty-three percent of the student population, but very important in alternative schools in
districts where the minority population is equal to or greater than thirty-three percent.
There are also differences in terms of a student wanting to return to his/her regular
school: somewhat important when PM is less than thirty-three percent, and very
important when PM is equal to or greater than thirty-three percent. Other important
18
factors, though they are not as significantly different, are improved behavior, a readiness
assessment, and the approval of the home school administrator or counselor. In the first
case, an assessment is somewhat important when PM is equal to or greater than thirty-
three percent. Secondly, the approval of the regular school administrator or counselor is
both somewhat and very important in districts when PM is thirty-three percent or less.
V. Conclusion
There is an emerging sense that ethnic/racial minority students are more likely
than non-minority students to be disciplined. In addition, it appears that alternative
schools are becoming an important strategy for dealing with disruptive students. It is,
therefore, somewhat reasonable to expect that alternative schools might be places that
school districts send minority students at greater rates than non-minority students. In this
paper we attempted to examine the association between minority group status and
alternative schools. We also sought to identify the traits of alternative schools with a
high likelihood of minority students.
Our results indicate that race is a factor in the presence of alternative schools.
We found that the likelihood of such presence is related to the percent minority in a
school district. In addition, we found that alternative schools are more likely to be
present in suburban/urban areas. Note that these are also areas with high concentrations
of minority students.
We then embarked on an analysis of alternative schools. Our examination
focused on four topics based on a model of entrance and exit from alternative schools.
These topics were: the reasons students are sent to alternative school environments, the
kind of programs available in alternative schools, the collaborative efforts alternative
schools make with community organizations and the criteria for sending students back to
their home schools. Our results indicate that most students are sent to alternative schools
for weapons, drugs/alcohol, fighting, and chronic truancy; in other words, for detrimental
behavior. A variety of programs are provided in alternative schools for students, and it
would appear that most alternative schools make important adjustments for their students.
For example, alternative schools offer smaller classes, academic counseling, remedial
instruction, and various other sorts of counseling and programs that attempt to educate
students in alternative school environments.
19
In terms of collaborations, there appears to be an emphasis on collaborating with
protective agencies (e.g., juvenile justice, the police, and with mental health services). In
contrast, there is less collaboration with organizations that can help students with life
after school or organizations that lead to greater community involvement, e.g., family
planning, community organizations, and job placement centers.
There are two conclusions that can be drawn from our analyses. First, race and
ethnicity appear to be related to the presence of alternative schools and it may be that
such environments are being used to house minority students. Second, we need better
data to get a more detailed sense of what alternative schools with high percents of
minority schools look like.
20
References
Bain, A. and A. MacPherson. 1990. An examination of the system-wide use of
exclusion with disruptive students. Australia and New Zealand Journal of
Developmental Disabilities,16, 109-23.
Brantlinger, E. (1991). Social class distinctions in adolescents’ reports of problems
and punishment in school. Behavioral Disorders, 17, 36-46.
Children’s Defense Fund (1975). School suspensions: Are they helping children?
Cambridge, MA: Washington Research Project.
Cooley, S. (1995). Suspension/expulsion of regular and special education students in
Kansas: A report to the Kansas State Board of Education. Topeka, KS: Kansas State
Board of Education.
Costenbader, V., & Markson, S. (1998). School suspension: A study with secondary
school students. Journal of School Psychology, 36, 59-82.
Costenbader, V. K., & Markson, S. (1994). School suspension: A survey of current
policies and practices. NASSP Bulletin, 78, 103-107.
Glackman, T., Martin, R., Hyman, I., McDowell, E., Berv, V., & Spino, P. (1978).
Corporal punishment, school suspension, and the civil rights of students: An analysis of
Office for Civil Rights school surveys. Inequality in Education, 23, 61-65.
Gold, M., and R. W. Mann. 1984. Expelled to a Friendlier Place: A Study of Effective
Alternative Schools. Michigan: University of Michigan Press.
21
Gordon, R., Della Piana, L., & Keleher, T. (2000). Facing the consequences: An
examination of racial discrimination in U. S. Public Schools. Oakland, CA: Applied
Research Center.
Gregory, J. F. (1997). Three strikes and they’re out: African American boys and
American schools’ responses to misbehavior. International Journal of Adolescence and
Youth, 7(1), 25-34.
Gregory, J. F. (1996). The crime of punishment: Racial and gender disparities in the use
of corporal punishment in the U.S. Public Schools. Journal of Negro Education, 64, 454-
462.
Imich, A. J. (1994). Exclusions from school: Current trends and issues. Educational
Research, 36(1), 3-11.
Kaeser, S. C. (1979). Suspensions in school discipline. Education and Urban Society, 11,
465-484.
Kleiner, B., R. Porch, E. Farris, and B. Greene. 2002. Public Alternative Schools and
Programs for Students At Risk of Educational Failure: 2000-01. Washington, DC: US
Department of Education.
Lietz, J. J., & Gregory, M. K. (1978). Pupil race and sex determinants of office and
exceptional education referrals. Educational Research Quarterly, 3(2), 61-66.
MacMillan, D. L., & Reschly, D. J. (1998). Overrepresentation of minority students: The
case for greater specificity or reconsideration of the variables examined. Journal of
Special Education, 32, 15-24.
Massachusetts Advocacy Center (1986). The way out: Student exclusion practices in
Boston Middle Schools. Boston, MA: Author.
22
McCarthy, J. D., & Hoge, D. R. (1987). The social construction of school punishment:
Racial disadvantage out of universalistic process. Social Forces, 65, 1101-1120.
McFadden, A. C., Marsh, G. E., Price, B. J., & Hwang, Y. (1992). A study of race and
gender bias in the punishment of handicapped school children. Urban Review, 24, 239-
251.
Ragin, C. 1987. The Comparative Method: Moving Beyond Qualitative and Quantitative
Strategies. Berkleley, California: University of California Press.
Raywid, MA. 1994. Community: An alternative school accomplishment. In G. A. Smith
(ed.), Public Schools that Work: Creating Community. New York: Routledge.
__________. 1982. The Current Status of Schools of Choice in Public Secondary
Education. Hempstead, NY: Project on Alternatives in Education, Hofstra University.
Reschly, D. J. (1997). Disproportionate minority representation in general and special
education: Patterns, issues, and alternatives. Des Moines, IA: Mountain Plains Regional
Resource Center, Drake University.
Schwartz, P. 1993. Dear Students, Parents and Staff. Newsletter #31 (May 17). Central
Park East Secondary School.
Shaw, S. R., & Braden, J. P. (1990). Race and gender bias in the administration of
corporal punishment. School Psychology Review, 19, 378-383.
Skiba, R. J., R. S. Michael, A. C. Nardo, and R. Peterson. 2000. The Color of
Discipline: Sources of Racial and Gender Disproportionality in School Punishment.
Bloomington, IN: Indiana Education Policy Center, University of Indiana.
23
Skiba, R. J., Peterson, R. L., & Williams, T. (1997). Office referrals and suspension:
Disciplinary intervention in middle schools. Education and Treatment of Children, 20(3),
295-315.
Streitmatter, J. L. (1985-86). Ethnic/racial and gender equity in school suspensions. The
High School Journal, 68, 139-143.
Taylor, M.C., & Foster, G. A. (1986). Bad boys and school suspensions: Public policy
implications for black males. Sociological Inquiry, 56, 498-506.
Thornton, C. H., & Trent, W. (1988). School desegregation and suspension in East Baton
Rouge Parish: A preliminary report. Journal of Negro Education, 57, 482-501.
Verdugo, R. R., N. M. Greenberg, R. D. Henderson, O. Uribe, and J. M. Schneider.
1997. School governance regimes and teachers’ job satisfaction: bureaucracy,
legitimacy, and community. Educational Administration Quarterly, 33, 38-66.
Wehlage, G. G., R. A. Rutter, G. A. Smith, N. Lesko, and R. R. Fernandez. 1989.
Reducing the Risk: Schools as Communities of Support. London: The Falmer Press.
Wood, F. N. 1989. Individualized education programs for seriously emotionally
disturbed adolescents. In G. Brown, R. L. McDowell, and J. Smith (eds.), Education
Adolescents with Behavior Disorders. Columbus: Charles E. Merrill Publisher.
Wu, S. C., Pink, W. T., Crain, R. L., & Moles, O. (1982). Student suspension: A critical
reappraisal. The Urban Review, 14, 245-303.
24
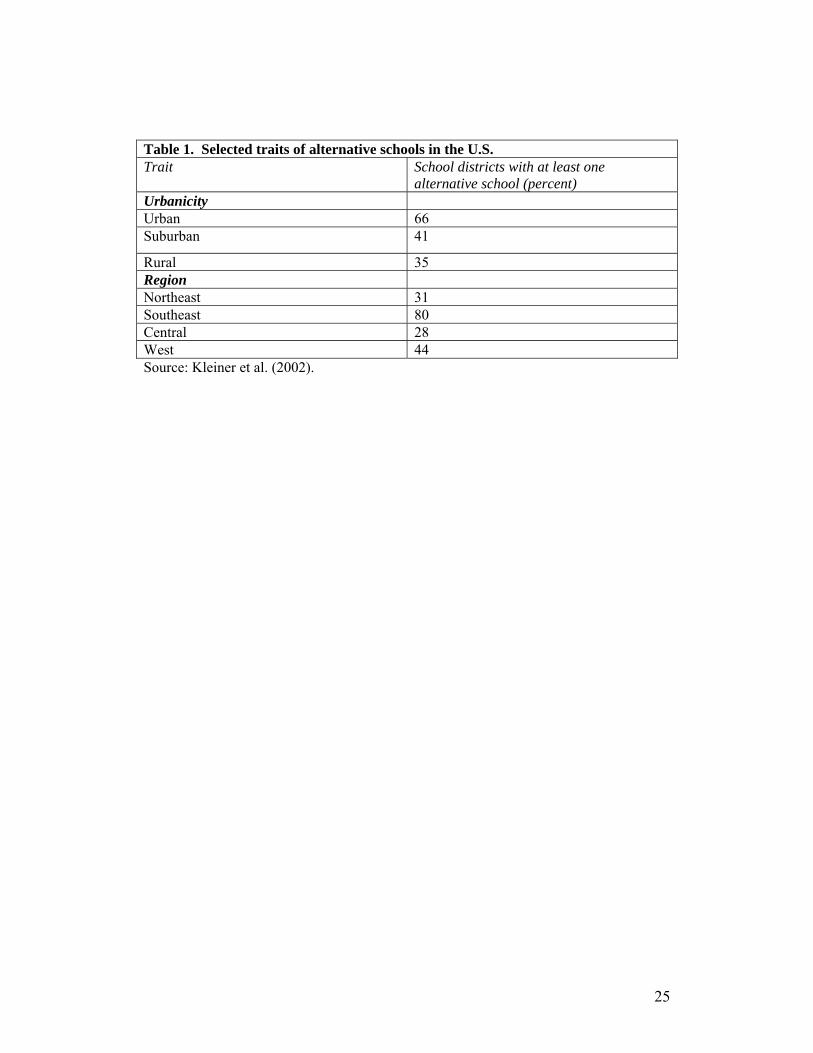
Table 1. Selected traits of alternative schools in the U.S. Trait School districts with at least one
alternative school (percent) Urbanicity Urban 66 Suburban 41
Rural 35 Region Northeast 31 Southeast 80 Central 28 West 44 Source: Kleiner et al. (2002).
25
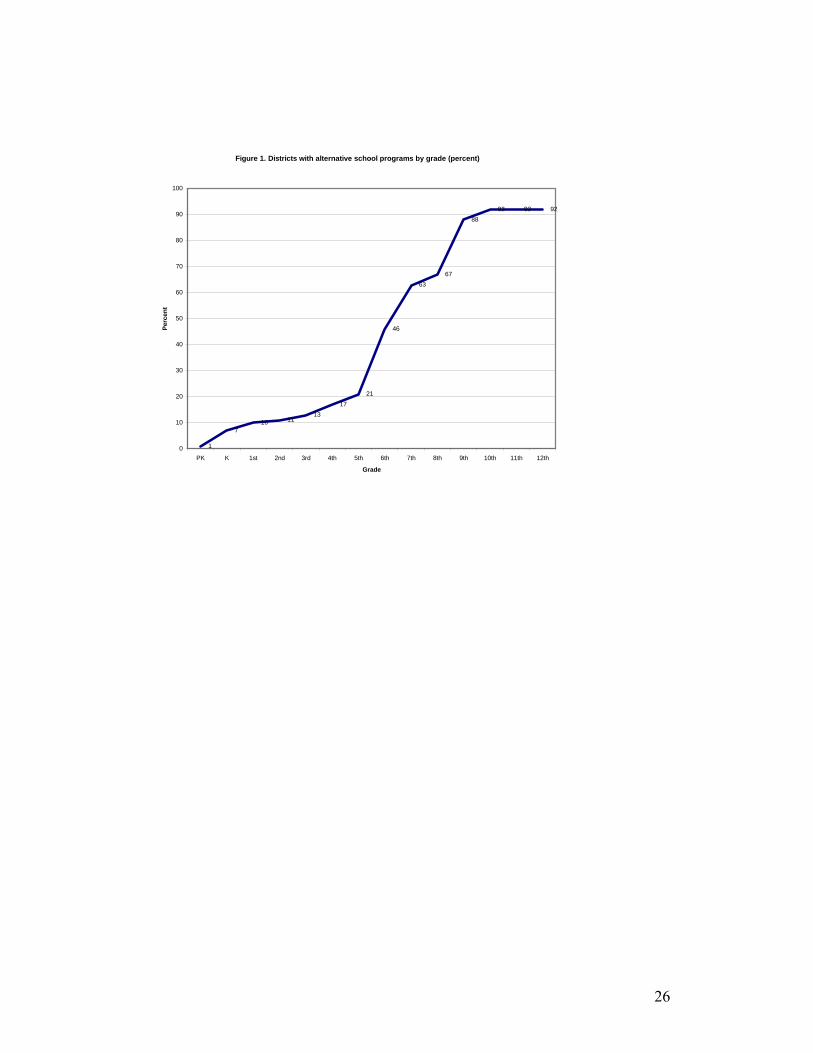
Figure 1. Districts with alternative school programs by grade (percent)
1
710 11
1317
21
46
6367
8892 92 92
0
10
20
30
40
50
60
70
80
90
100
PK K 1st 2nd 3rd 4th 5th 6th 7th 8th 9th 10th 11th 12th
Grade
Perc
ent
26
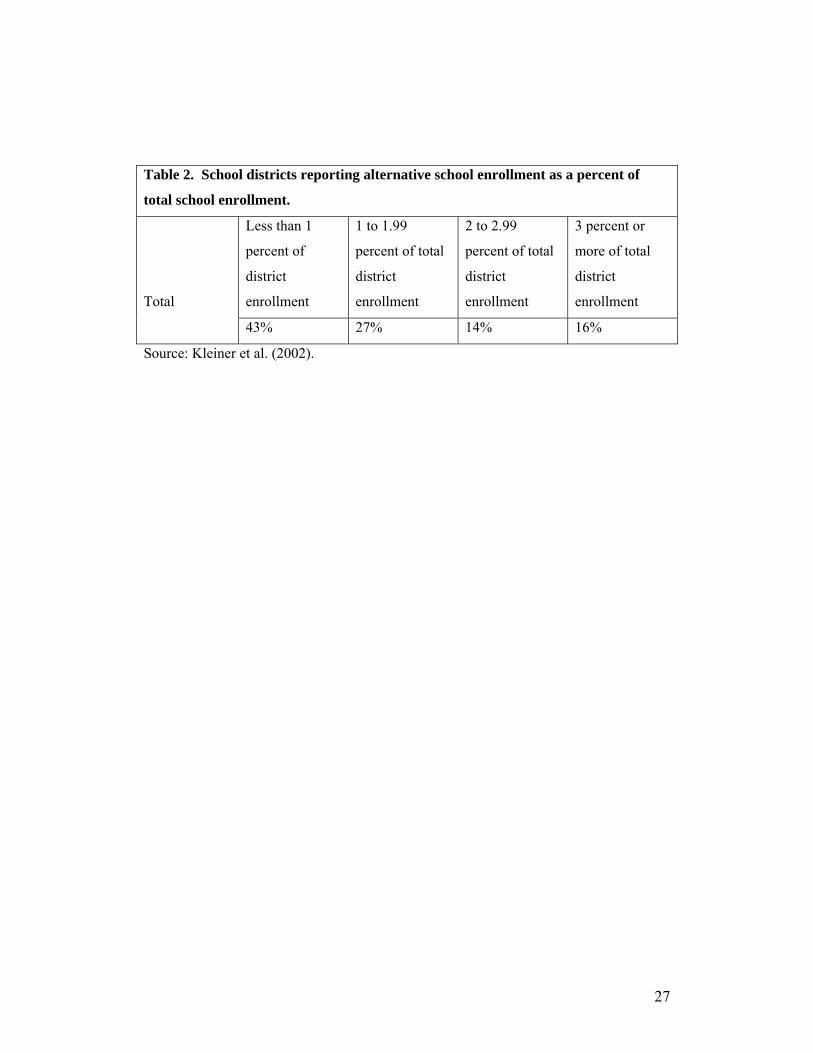
Table 2. School districts reporting alternative school enrollment as a percent of
total school enrollment.
Less than 1
percent of
district
enrollment
1 to 1.99
percent of total
district
enrollment
2 to 2.99
percent of total
district
enrollment
3 percent or
more of total
district
enrollment
Total
43% 27% 14% 16%
Source: Kleiner et al. (2002).
27
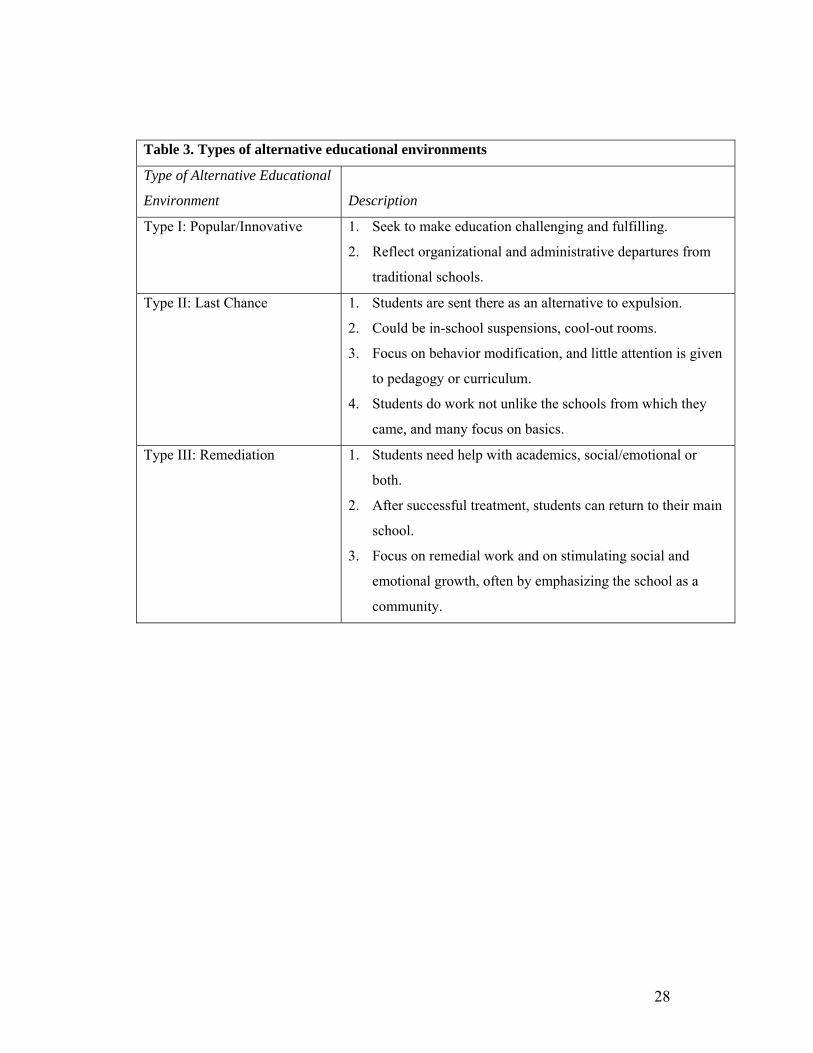
Table 3. Types of alternative educational environments
Type of Alternative Educational
Environment
Description
Type I: Popular/Innovative 1. Seek to make education challenging and fulfilling.
2. Reflect organizational and administrative departures from
traditional schools.
Type II: Last Chance 1. Students are sent there as an alternative to expulsion.
2. Could be in-school suspensions, cool-out rooms.
3. Focus on behavior modification, and little attention is given
to pedagogy or curriculum.
4. Students do work not unlike the schools from which they
came, and many focus on basics.
Type III: Remediation 1. Students need help with academics, social/emotional or
both.
2. After successful treatment, students can return to their main
school.
3. Focus on remedial work and on stimulating social and
emotional growth, often by emphasizing the school as a
community.
28
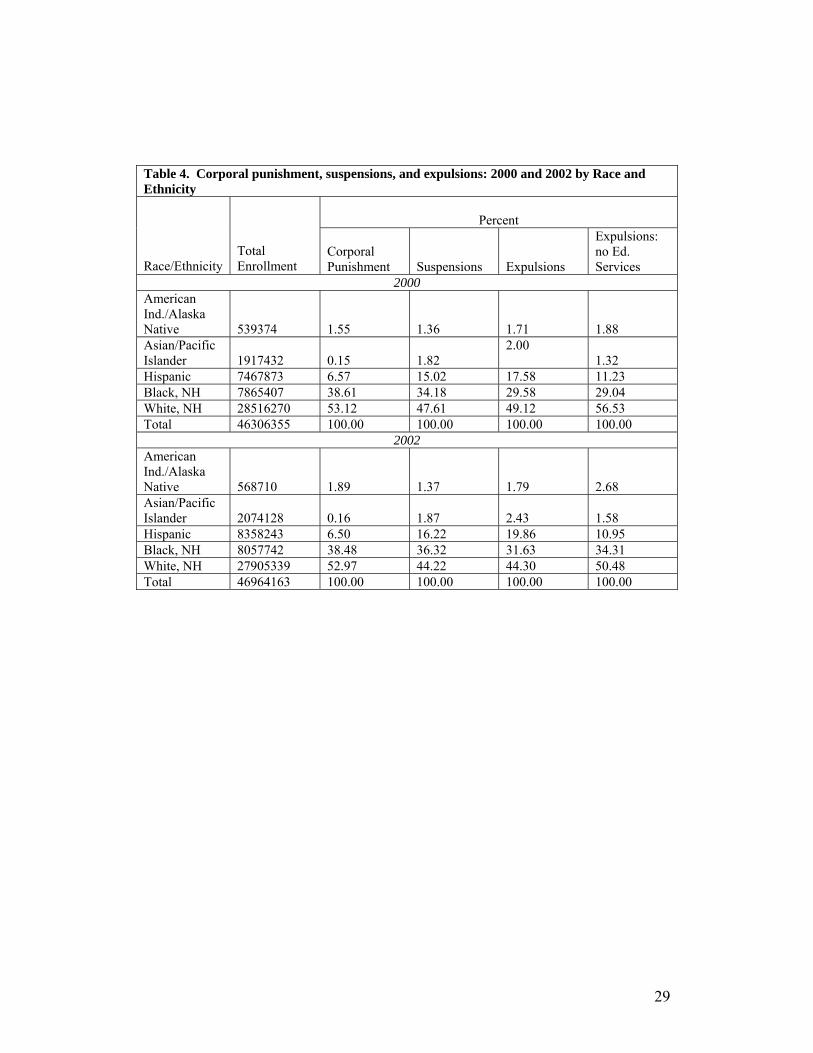
Table 4. Corporal punishment, suspensions, and expulsions: 2000 and 2002 by Race and Ethnicity
Percent
Race/Ethnicity
Total Enrollment
Corporal Punishment
Suspensions
Expulsions
Expulsions: no Ed. Services
2000 American Ind./Alaska Native
539374
1.55
1.36
1.71
1.88
Asian/Pacific Islander
1917432
0.15
1.82
2.00 1.32
Hispanic 7467873 6.57 15.02 17.58 11.23 Black, NH 7865407 38.61 34.18 29.58 29.04 White, NH 28516270 53.12 47.61 49.12 56.53 Total 46306355 100.00 100.00 100.00 100.00
2002 American Ind./Alaska Native
568710
1.89
1.37
1.79
2.68
Asian/Pacific Islander
2074128
0.16
1.87
2.43
1.58
Hispanic 8358243 6.50 16.22 19.86 10.95 Black, NH 8057742 38.48 36.32 31.63 34.31 White, NH 27905339 52.97 44.22 44.30 50.48 Total 46964163 100.00 100.00 100.00 100.00
29
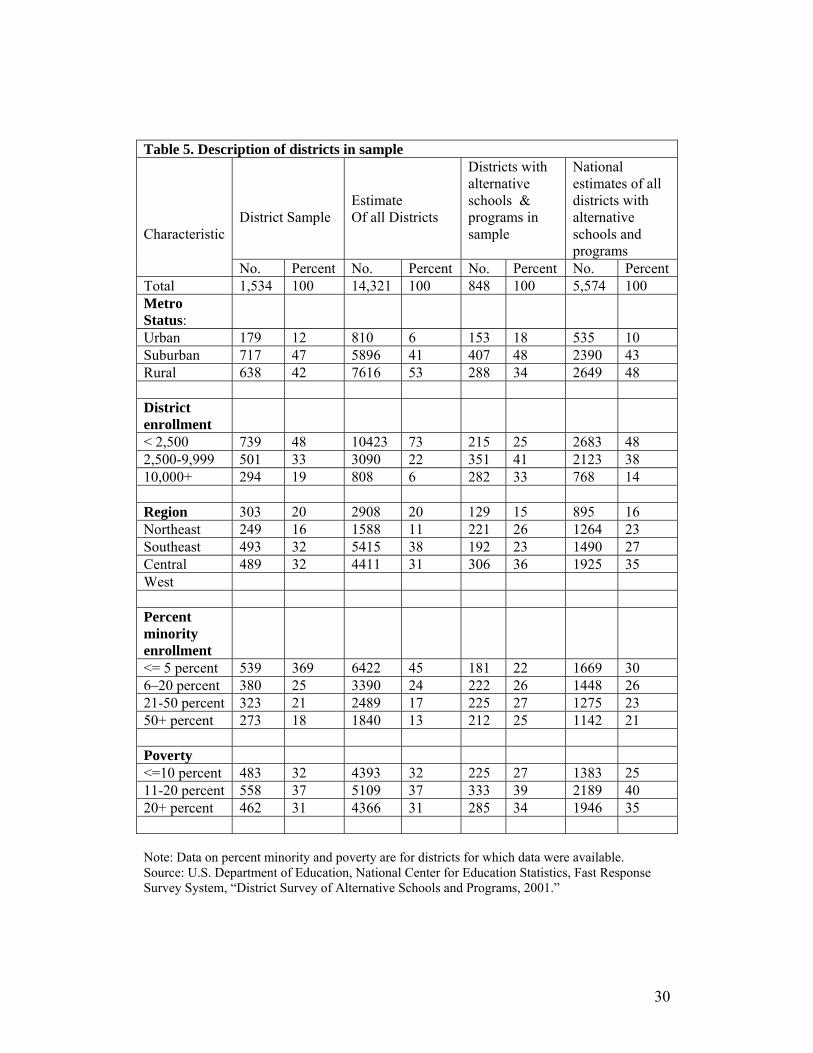
Table 5. Description of districts in sample District Sample
Estimate Of all Districts
Districts with alternative schools & programs in sample
National estimates of all districts with alternative schools and programs
Characteristic
No. Percent No. Percent No. Percent No. Percent Total 1,534 100 14,321 100 848 100 5,574 100 Metro Status:
Urban 179 12 810 6 153 18 535 10 Suburban 717 47 5896 41 407 48 2390 43 Rural 638 42 7616 53 288 34 2649 48 District enrollment
< 2,500 739 48 10423 73 215 25 2683 48 2,500-9,999 501 33 3090 22 351 41 2123 38 10,000+ 294 19 808 6 282 33 768 14 Region 303 20 2908 20 129 15 895 16 Northeast 249 16 1588 11 221 26 1264 23 Southeast 493 32 5415 38 192 23 1490 27 Central 489 32 4411 31 306 36 1925 35 West Percent minority enrollment
<= 5 percent 539 369 6422 45 181 22 1669 30 6–20 percent 380 25 3390 24 222 26 1448 26 21-50 percent 323 21 2489 17 225 27 1275 23 50+ percent 273 18 1840 13 212 25 1142 21 Poverty <=10 percent 483 32 4393 32 225 27 1383 25 11-20 percent 558 37 5109 37 333 39 2189 40 20+ percent 462 31 4366 31 285 34 1946 35 Note: Data on percent minority and poverty are for districts for which data were available. Source: U.S. Department of Education, National Center for Education Statistics, Fast Response Survey System, “District Survey of Alternative Schools and Programs, 2001.”
30
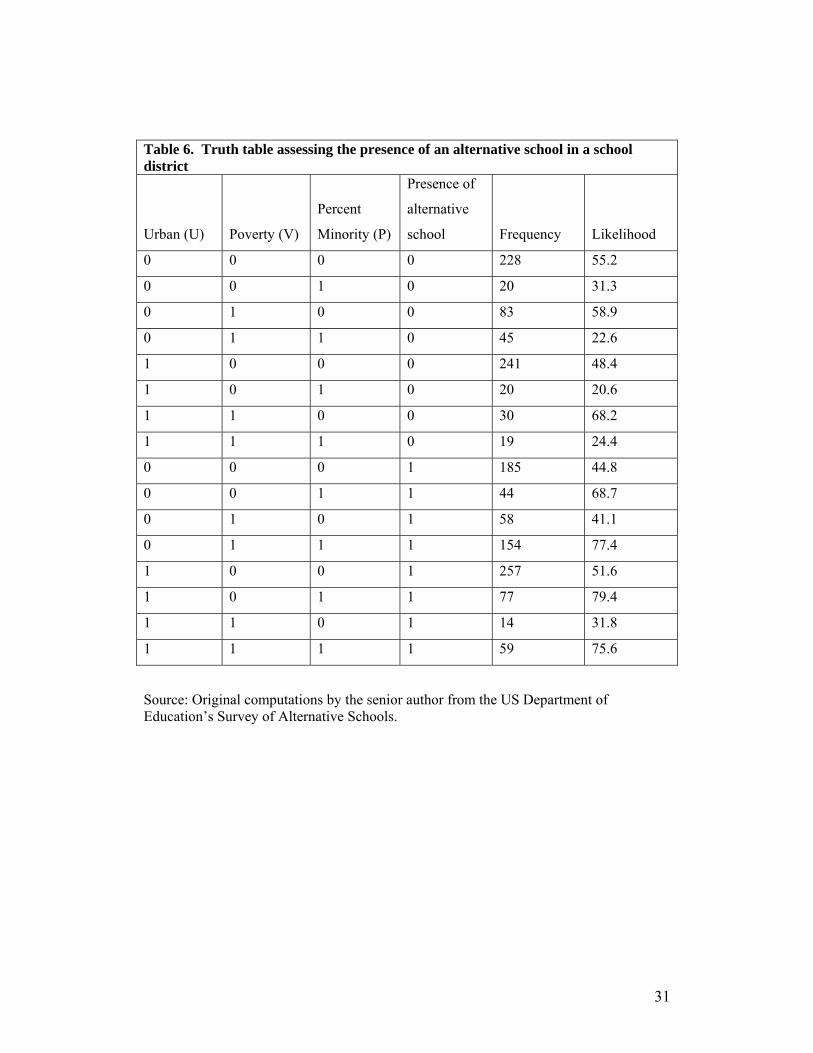
Table 6. Truth table assessing the presence of an alternative school in a school district
Urban (U)
Poverty (V)
Percent
Minority (P)
Presence of
alternative
school
Frequency
Likelihood
0 0 0 0 228 55.2
0 0 1 0 20 31.3
0 1 0 0 83 58.9
0 1 1 0 45 22.6
1 0 0 0 241 48.4
1 0 1 0 20 20.6
1 1 0 0 30 68.2
1 1 1 0 19 24.4
0 0 0 1 185 44.8
0 0 1 1 44 68.7
0 1 0 1 58 41.1
0 1 1 1 154 77.4
1 0 0 1 257 51.6
1 0 1 1 77 79.4
1 1 0 1 14 31.8
1 1 1 1 59 75.6
Source: Original computations by the senior author from the US Department of Education’s Survey of Alternative Schools.
31
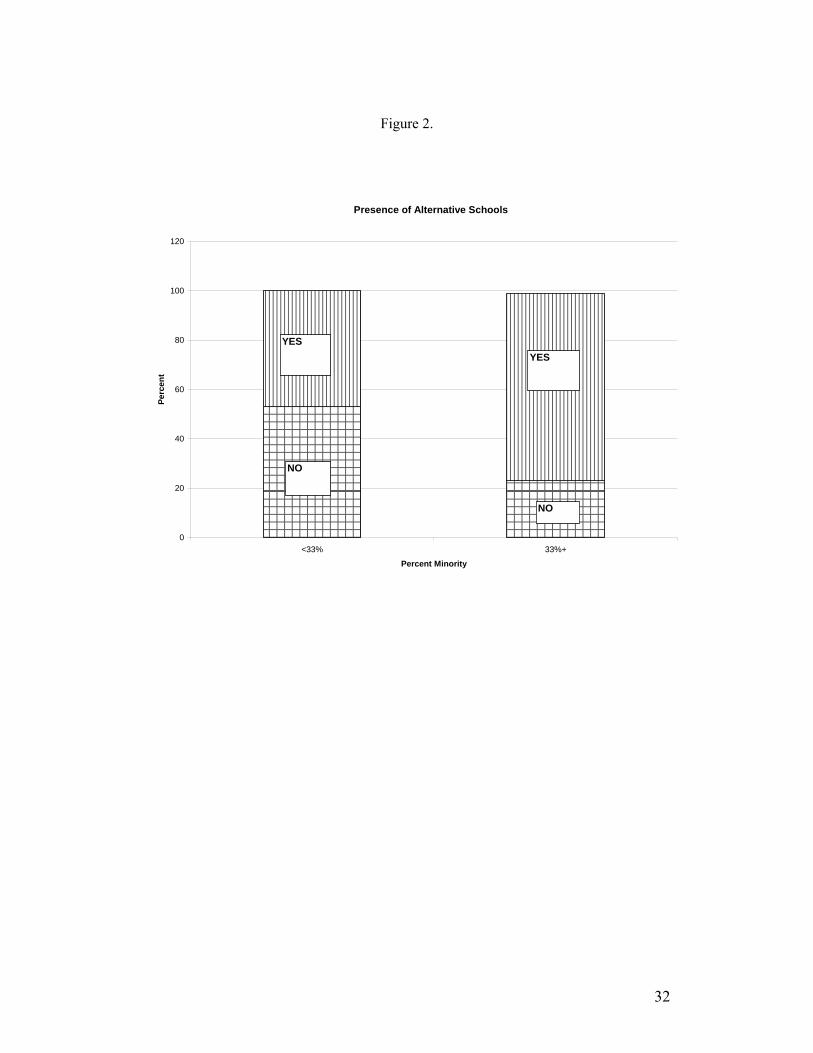
Figure 2.
Presence of Alternative Schools
0
20
40
60
80
100
120
<33% 33%+
Percent Minority
Perc
ent Yes
YESYES
NO
NO
32
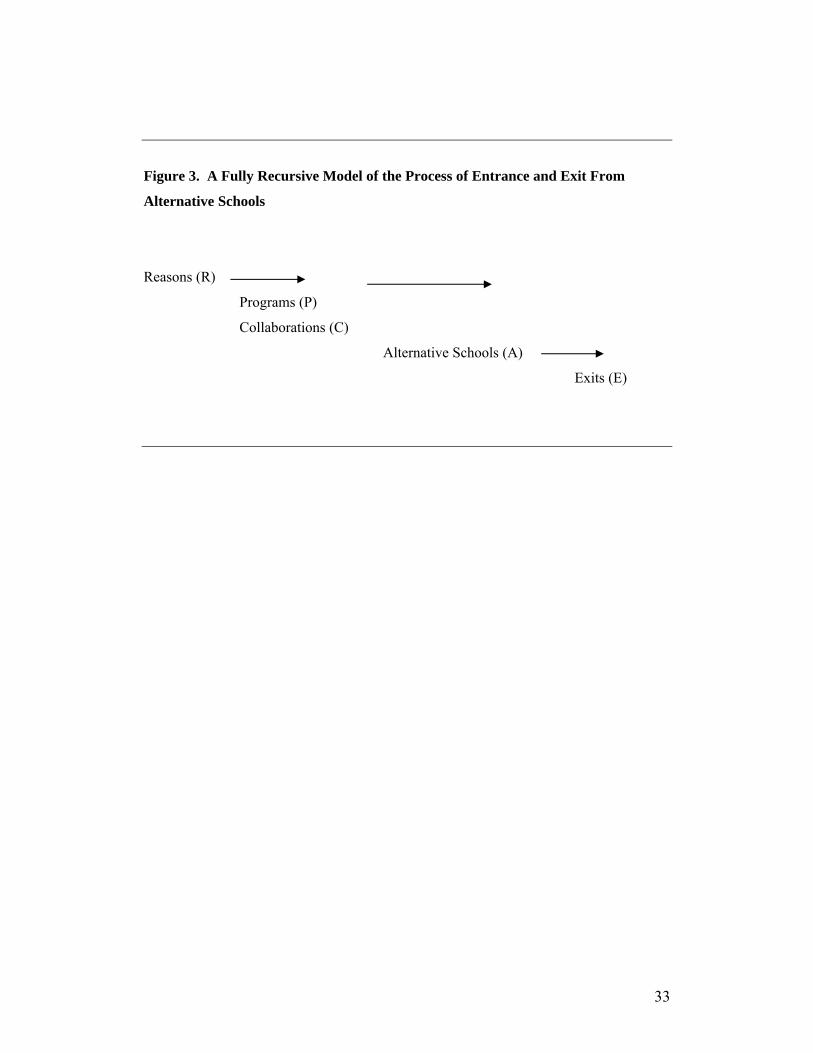
Figure 3. A Fully Recursive Model of the Process of Entrance and Exit From
Alternative Schools
Reasons (R)
Programs (P)
Collaborations (C)
Alternative Schools (A)
Exits (E)
33
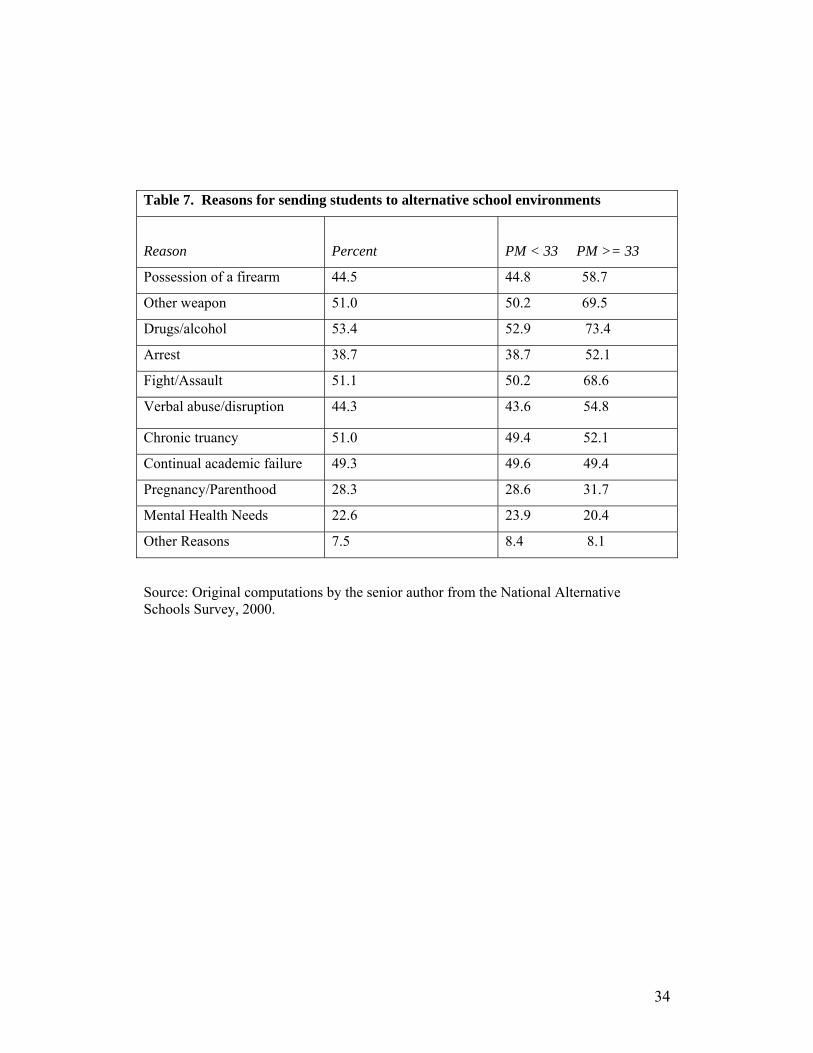
Table 7. Reasons for sending students to alternative school environments
Reason
Percent
PM < 33 PM >= 33
Possession of a firearm 44.5 44.8 58.7
Other weapon 51.0 50.2 69.5
Drugs/alcohol 53.4 52.9 73.4
Arrest 38.7 38.7 52.1
Fight/Assault 51.1 50.2 68.6
Verbal abuse/disruption 44.3 43.6 54.8
Chronic truancy 51.0 49.4 52.1
Continual academic failure 49.3 49.6 49.4
Pregnancy/Parenthood 28.3 28.6 31.7
Mental Health Needs 22.6 23.9 20.4
Other Reasons 7.5 8.4 8.1
Source: Original computations by the senior author from the National Alternative Schools Survey, 2000.
34
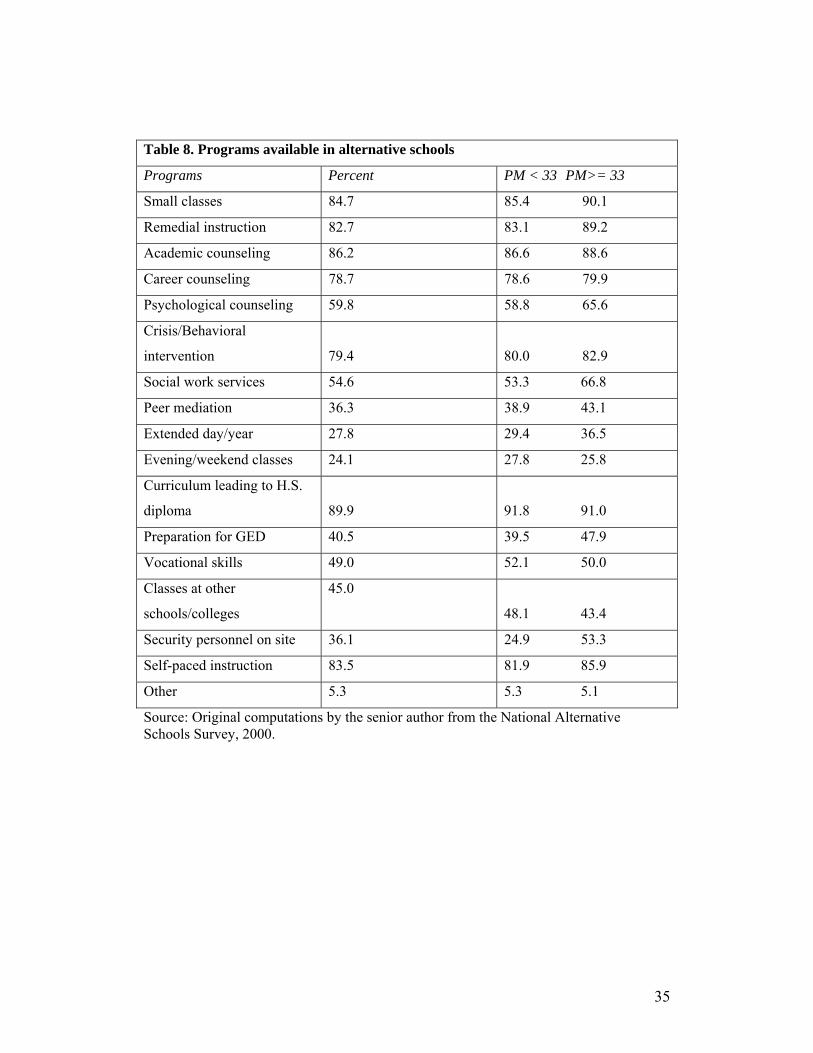
Table 8. Programs available in alternative schools
Programs Percent PM < 33 PM>= 33
Small classes 84.7 85.4 90.1
Remedial instruction 82.7 83.1 89.2
Academic counseling 86.2 86.6 88.6
Career counseling 78.7 78.6 79.9
Psychological counseling 59.8 58.8 65.6
Crisis/Behavioral
intervention
79.4
80.0 82.9
Social work services 54.6 53.3 66.8
Peer mediation 36.3 38.9 43.1
Extended day/year 27.8 29.4 36.5
Evening/weekend classes 24.1 27.8 25.8
Curriculum leading to H.S.
diploma
89.9
91.8 91.0
Preparation for GED 40.5 39.5 47.9
Vocational skills 49.0 52.1 50.0
Classes at other
schools/colleges
45.0
48.1 43.4
Security personnel on site 36.1 24.9 53.3
Self-paced instruction 83.5 81.9 85.9
Other 5.3 5.3 5.1
Source: Original computations by the senior author from the National Alternative Schools Survey, 2000.
35
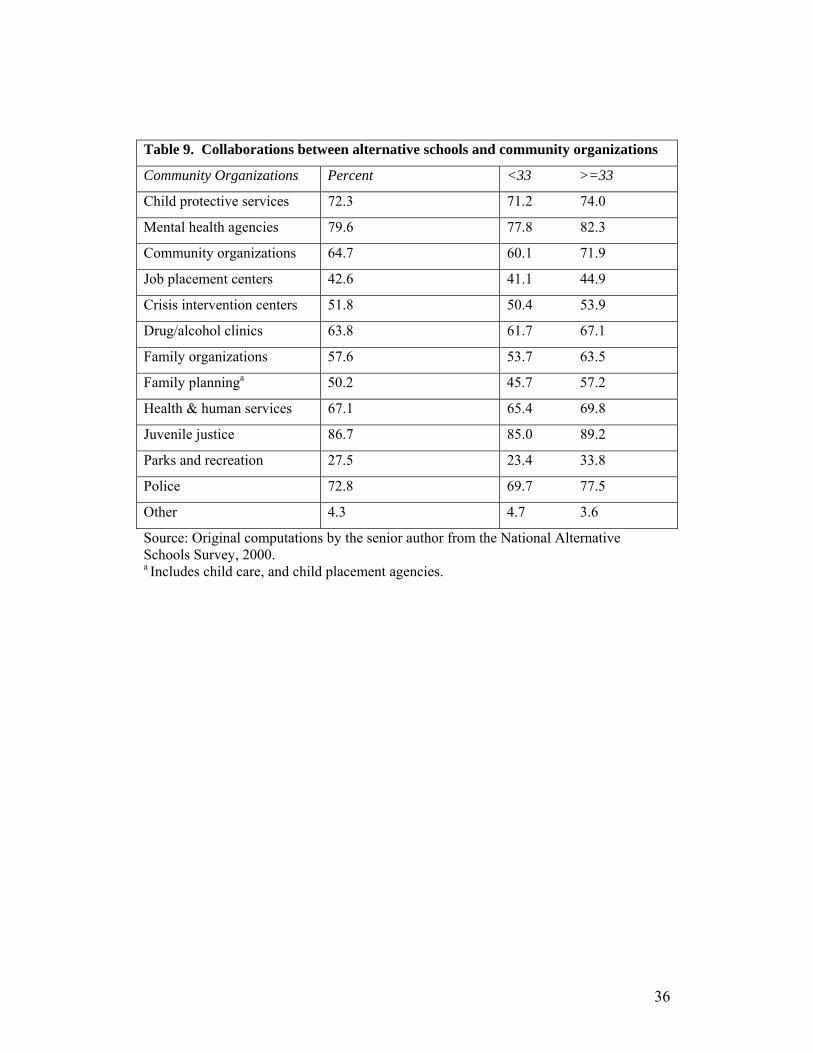
Table 9. Collaborations between alternative schools and community organizations
Community Organizations Percent <33 >=33
Child protective services 72.3 71.2 74.0
Mental health agencies 79.6 77.8 82.3
Community organizations 64.7 60.1 71.9
Job placement centers 42.6 41.1 44.9
Crisis intervention centers 51.8 50.4 53.9
Drug/alcohol clinics 63.8 61.7 67.1
Family organizations 57.6 53.7 63.5
Family planninga 50.2 45.7 57.2
Health & human services 67.1 65.4 69.8
Juvenile justice 86.7 85.0 89.2
Parks and recreation 27.5 23.4 33.8
Police 72.8 69.7 77.5
Other 4.3 4.7 3.6
Source: Original computations by the senior author from the National Alternative Schools Survey, 2000. a Includes child care, and child placement agencies.
36
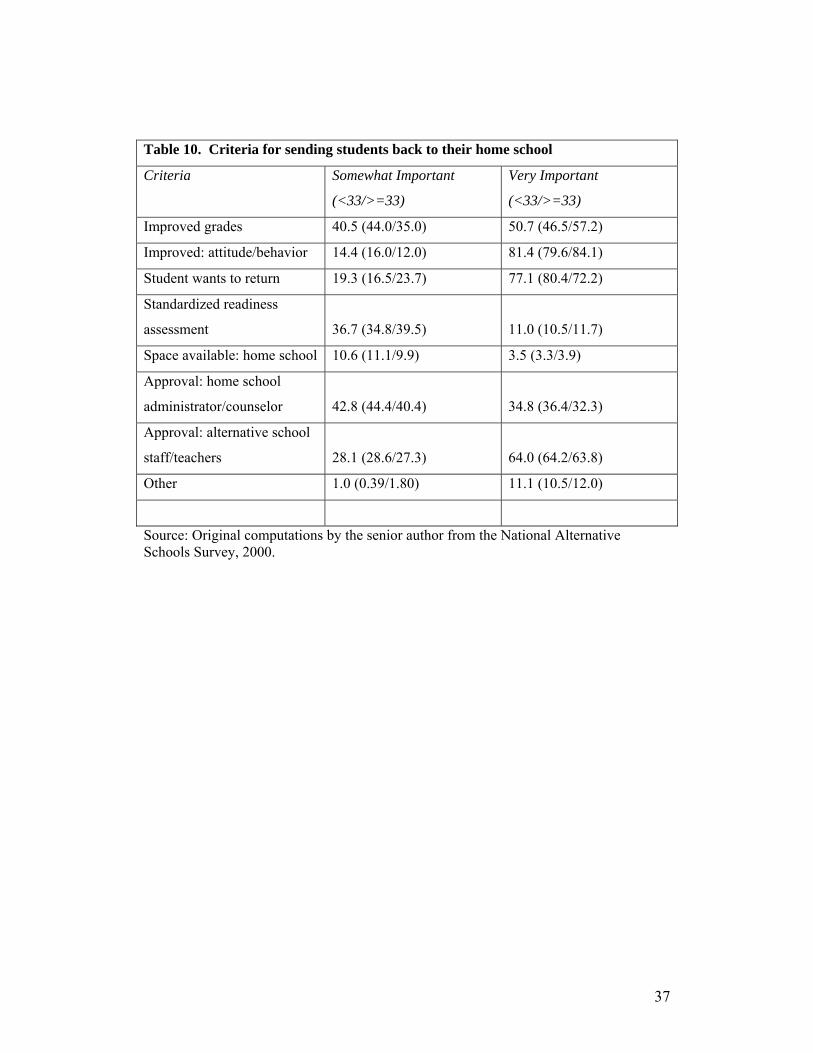
Table 10. Criteria for sending students back to their home school
Criteria Somewhat Important
(<33/>=33)
Very Important
(<33/>=33)
Improved grades 40.5 (44.0/35.0) 50.7 (46.5/57.2)
Improved: attitude/behavior 14.4 (16.0/12.0) 81.4 (79.6/84.1)
Student wants to return 19.3 (16.5/23.7) 77.1 (80.4/72.2)
Standardized readiness
assessment
36.7 (34.8/39.5)
11.0 (10.5/11.7)
Space available: home school 10.6 (11.1/9.9) 3.5 (3.3/3.9)
Approval: home school
administrator/counselor
42.8 (44.4/40.4)
34.8 (36.4/32.3)
Approval: alternative school
staff/teachers
28.1 (28.6/27.3)
64.0 (64.2/63.8)
Other 1.0 (0.39/1.80) 11.1 (10.5/12.0)
Source: Original computations by the senior author from the National Alternative Schools Survey, 2000.
37

Endnotes
1 This specific discussion draws heavily from the work by Skiiba et al. (2000).
38