Embed Size (px)
Citation preview
Geochimrca et Cosmochimica Acla Vol. 57, pp. 889-905 Copyright 0 1993 Pergamon Press Ltd. Printed in U.S.A.
0016-7037/93/$6.00 + .CNl
Rhenium behavior in molybdenite in hypogene and near-surface environments: Implications for Re-0s geochronometry
TOM E. MCCANDLESS, ’ JOAQUIN RUIZ, * and ANDREW R. CAMPBELL’
‘Department of Geosciences, University of Arizona, Tucson, Arizona 85721, USA 2Department of Geoscience, New Mexico Institute of Mining and Technology, Socorro, New Mexico 87801, USA
(Received June 1 I, 1992; accepted in revised form October 15, 1992)
Abstract-Rhenium is concentrated mainly in molybdenite (MoSz) and occurs as a major cation in only a few rare minerals. This affinity makes molybdenite an ideal mineral for Re-0s geochronometry, but research on the behavior of Re in molybdenite is limited. Infrared microscope, XRD, back-scattered electron (BSE), and microprobe techniques have been used in this study to document Re behavior in molybdenite affected by hypogene and near-surface processes. In the hypogene environment, both 3R and 2H molybdenite can experience Re loss during hydrothermal alteration, which also causes increased infrared transparency ( IR) . Alteration at temperatures as low as - 150°C can cause Re loss in the presence of advecting fluids, and will affect Re-0s dating if it occurs long after primary mineralization. Re loss in 3R and 2H molybdenite under supergene conditions does not increase IR transparency. Rhenium is not incorporated into supergene ferrimolybdite, but is enriched in K-Al-silicate intergrowths which may be illite( ?). These minute intergrowths are present in several samples and would not be detected in a simple optical examination. In the supergene environment elemental OS is stable, whereas Re is not. Rhenium in molybdenite may be removed by supergene fluids after some has decayed to ‘870s, causing erroneously old ages, or it may be adsorbed into the illite intergrowths, creating ages which are too young. In the weathering environment, Proterozoic molybdenites have altered to Re-enriched powellite, which can be detected using back-scattered electron imagery. Combined microprobe, XRD, BSE, and infrared mi- croscopy can be successfully used to detect alteration in molybdenite prior to dating. These techniques are non-destructive and should be performed before any molybdenite is dated by the Re-0s system.
INTRODUCDON
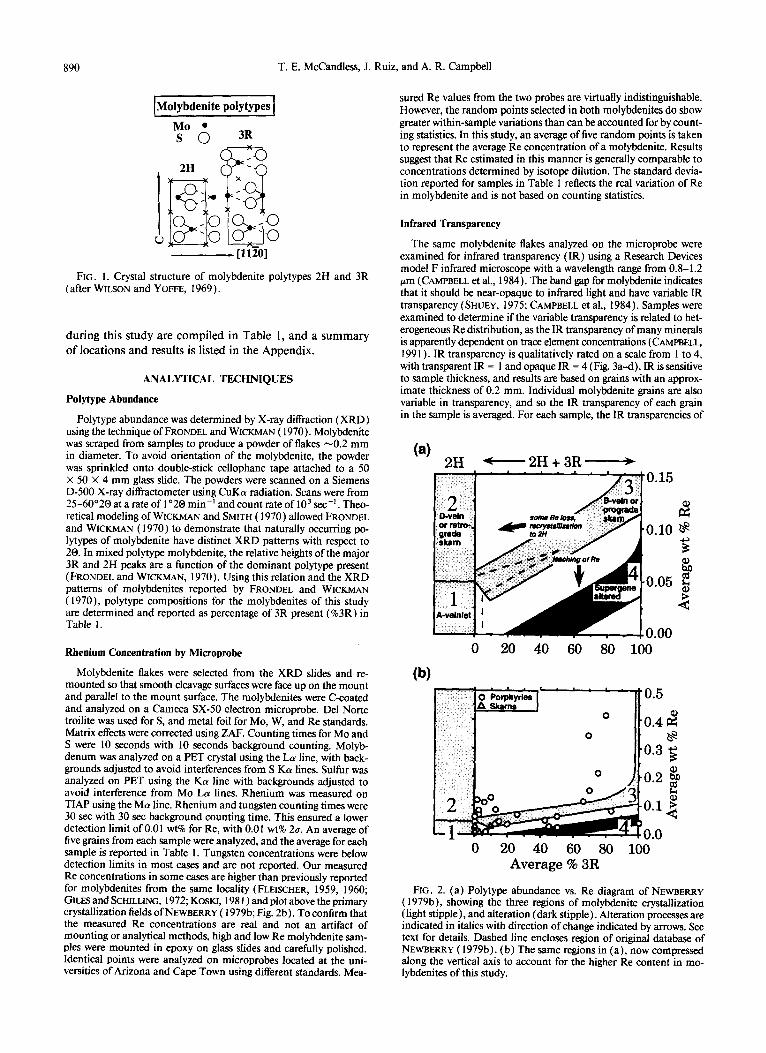
MOLYBDENITE (MO&) IS THE MAJOR source of Re, and as a dominant cation Re occurs in only a few rare minerals ( SARP et al., 1981; EKSTROM and HALENIUS, 1982; VOLBORTH, 1985; MITCHELL et al., 1989; GABELMAN, 1990; TARKIAN et al., 1991). In spite of this affinity, past studies have pro- duced limited and sometimes contradictory results regarding the distribution of Re in molybdenite (RILEY, 1967; MORGAN et al., 1968; GILES and SCHILLING, 1972; NEWBERRY, 1979a,b; FILIMONOVA et al., 1984; ISHIHARA, 1988). Mo- lybdenite is a hexagonal disulfide mineral with Mo+~ octa- hedrally coordinated by S2. Six-fold coordination in mo- lybdenite is distorted to a prismatic rather than octahedral form, and continuous MO-S layers stack one above another in simple sequence (WILSON and YOFFE, 1969). The two polytypes, 2H and 3R, differ in the manner of stacking in the c unit cell direction, in which c for 3R is 1.5 - (c) for 2H (Fig. 1). The 3R polytype is less common and is believed to form by screw dislocation, caused by the substitution of ions with ionic radii nearly similar to MO ( ZELIKMAN et al., 1969; NEWBERRY, 1979a; WATANABE and SOEDA, 1981; FILI- MONOVA et al., 1984). NEWBERRY ( 1979a,b) found a positive correlation between polytype abundance and Re concentra- tion in molybdenites. In 3R-Re space, he divided molybde- nites into four regions representing crystallization and alter- ation environments (Fig. 2a). Region 1 represents low-Re 2H molybdenites crystallized in veins dominated by K-feld- spar and quartz and with K-feldspar alteration selvages (A- veinlets). Region 2 represents high-Re 2H molybdenites crystallized with quartz in veins dominated by sulfides and
sericitic selvages (D-veins). Region 3 contains mixed polytype molybdenite with high Re associated with prograde skarns and quartz-dominant veins without alteration selvages (B- veins). NEWBERRY ( 1979b) also proposed that recrystalli- zation of high 3R molybdenite to 2H molybdenite could oc- cur at high temperatures with some loss of Re, as indicated by the left-pointing arrow in Fig. 2a. This process may not be tenable, based on results presented in this study. The fourth region contains molybdenites altered by supergene fluids which can remove Re without altering polytype structure (Fig. 2a). In this study, samples from porphyry deposits are dominantly quartz-molybdenite veins with no alteration sel- vages except when otherwise noted.
The potential application of molybdenite as a geochron- ometer in the Re-0s isotopic system has been recognized for nearly forty years, but dating attempts have been sporadic and produced mixed results (Fig. 3; HERR and MERZ, 1955, 1958; HIRT et al., 1963; LUCK and ALL~GRE, 1982; LUCK et al., 1983; ISHIHARA et al., 1989). Rhenium loss rather than OS addition may account for the poor results, and if it is possible to document postcrystallization loss of Re in mo- lybdenite, then samples suitable for dating can be selected. This study is an attempt to document the behavior of Re in molybdenite by applying microprobe, BSE, XRD, and in- frared microscope techniques to molybdenite samples from a variety of geologically well-constrained settings. The samples are from base metal porphyry deposits, pegmatites, and skams which have been exposed to processes active in hypogene, supergene, and weathering environments. These processes produce discernable effects in molybdenite, which can be de- tected prior to dating by the Re-0s method. All data collected
889
890 T. E. McCandless, J. Ruiz, and A. R. Campbell
hiiybdenite polytypes 1
MO l
so 3R -
FIG. 1. Crystal structure of molybdenite polytypes 2H and 3R (after WILSON and YOF’FE, 1969).
during this study are compiled in Table 1, and a summary
of locations and results is listed in the Appendix.
ANALYTICAL TECHNIQUES
Polytype Abundance
Polytype abundance was determined by X-ray diffraction (XRD) using the technique of FRONDEL and WICKMAN ( 1970). Molybdenite was scraped from samples to produce a powder of flakes -0.2 mm in diameter. To avoid orientation of the molybdenite, the powder was sprinkled onto double-stick cellophane tape attached to a 50 X 50 X 4 mm glass slide. The powders were scanned on a Siemens D-500 X-ray diffractometer using CuKa radiation. Scans were from 25-60”20 at a rate of I”20 min-’ and count rate of 10’ se-‘. Theo- retical modeling of WICKMAN and SMITH ( 1970) allowed FRONDEL and WICKMAN ( 1970) to demonstrate that naturally occurring po- lytypes of molybdenite have distinct XRD patterns with respect to 20. In mixed polytype molybdenite, the relative heights of the major 3R and 2H peaks are a function of the dominant polytype present ( FRONDEL and WICKMAN, 1970). Using this relation and the XRD patterns of molybdenites reported by FRONDEL and WICKMAN ( 1970), polytype compositions for the molybdenites of this study are determined and reported as percentage of 3R present (%3R) in Table 1.
Rhenium Concentration by Microprobe
Molybdenite flakes were selected from the XRD slides and re- mounted so that smooth cleavage surfaces were face up on the mount and parallel to the mount surface. The molybdenites were C-coated and analyzed on a Cameca SX-50 electron microprobe. Del Norte troilite was used for S, and metal foil for MO, W, and Re standards. Matrix effects were corrected using ZAF. Counting times for MO and S were 10 seconds with 10 seconds background counting. Molyb- denum was analyzed on a PET crystal using the La line, with back- grounds adjusted to avoid interferences from S Ka lines. Sulfur was analyzed on PET using the Kol line with backgrounds adjusted to avoid interference from MO La lines. Rhenium was measured on TIAP using the Ma line. Rhenium and tungsten counting times were 30 set with 30 set background counting time. This ensured a lower detection limit of 0.0 1 wt% for Re, with 0.0 1 wt% 2~. An average of five grains from each sample were analyzed, and the average for each sample is reported in Table 1. Tungsten concentrations were below detection limits in most cases and are not reported. Our measured Re concentrations in some cases are higher than previously reported for molybdenites from the same locality (FLEISCHER, 1959, 1960; GILES and SCHILLING, 1972; KOSKI, 198 1) and plot above the primary crystallization fields of NEWBERRY ( 1979b, Fig. 2b). To confirm that the measured Re concentrations are real and not an artifact of mounting or analytical methods, high and low Re molybdenite sam- ples were mounted in epoxy on glass slides and carefully polished. Identical points were analyzed on microprobes located at the uni- versities of Arizona and Cape Town using different standards. Mea-
sured Re values from the two probes are virtually indistinguishable. However, the random points selected in both molybdenites do show greater within-sample variations than can be accounted for by count- ing statistics. In this study, an average of five random points is taken to represent the average Re concentration of a molybdenite. Results suggest that Re estimated in this manner is generally comparable to concentrations determined by isotope dilution. The standard devia- tion reported for samples in Table 1 reflects the real variation of Re in molybdenite and is not based on counting statistics.
Infrared Transparency
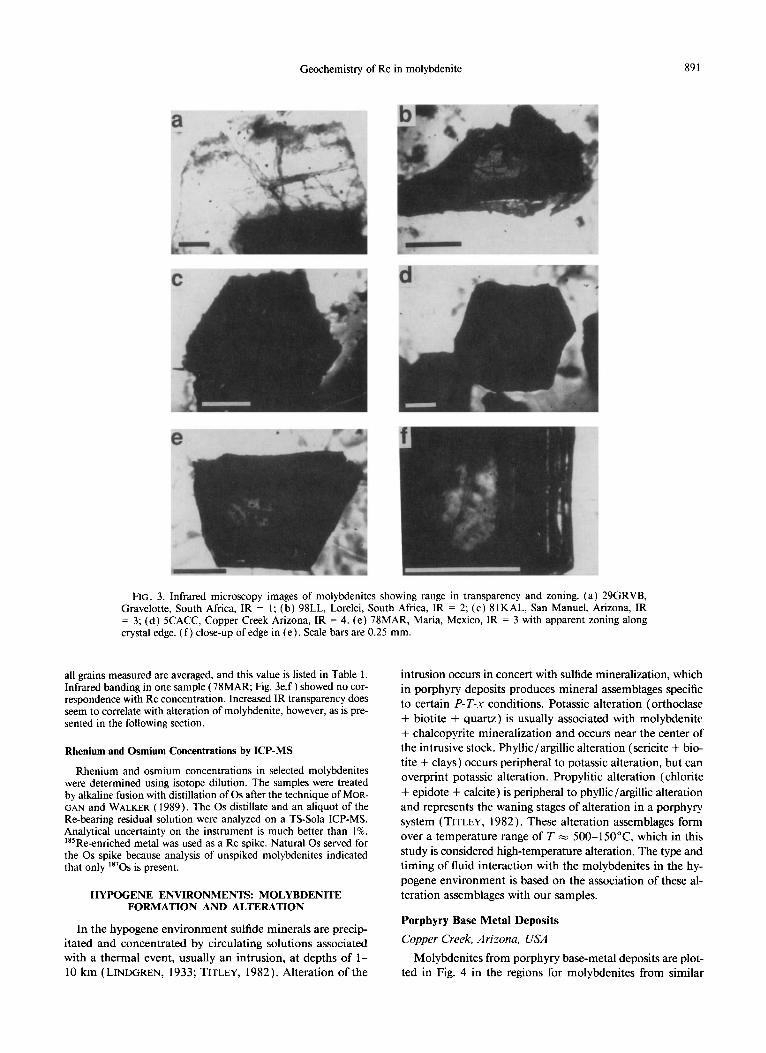
The same molybdenite flakes analyzed on the microprobe were examined for infrared transparency (IR) using a Research Devices model F infrared microscope with a wavelength range from 0.8-1.2 pm (CAMPBELL et al., 1984). The band gap for molybdenite indicates that it should be near-opaque to infrared light and have variable IR transparency ( SHUEY, 1975; CAMPBELL et al., 1984). Samples were examined to determine if the variable transparency is related to het- erogeneous Re distribution, as the IR transparency of many minerals is apparently dependent on trace element concentrations (CAMPBELL, 199 1) . IR transparency is qualitatively rated on a scale from 1 to 4, with transparent IR = 1 and opaque IR = 4 (Fig. 3a-d). IR is sensitive to sample thickness, and results are based on grains with an approx- imate thickness of 0.2 mm. Individual molybdenite grains are also variable in transparency, and so the IR transparency of each grain in the sample is averaged. For each sample, the IR transparencies of
(a) 2H -2H+3R- ‘0.15
8 ,0.05 if!
? c
0 20 40 60 80 100
(b)
0 20 40 60 80 100 Average % 3R
FIG. 2. (a) Polytype abundance vs. Re diagram of NEWBERRY ( 1979b), showing the three regions of molybdenite crystallization (light stipple), and alteration (dark stipple). Alteration processes are indicated in italics with direction of change indicated by arrows. See text for details. Dashed line encloses region of original database of NEWBERRY ( 1979b). (b) The same regions in (a), now compressed along the vertical axis to account for the higher Re content in mo- lybdenites of this study.
Geochemistry of Re in molybdenite 891
FIG. 3. Infrared microscopy images of molybdenites showing range in transparency and zoning. (a) 29GRVB, Gravelotte, South Africa, IR = 1; (b) 98LL, Lorelei, South Africa, IR = 2; (c) IIKAL, San Manuel, Arizona, IR = 3; (d) 5CACC, Copper Creek Arizona, IR = 4. (e) 78MAR, Maria, Mexico, IR = 3 with apparent zoning along crystal edge. (f) close-up of edge in (e). Scale bars are 0.25 mm.
all grains measured are averaged, and this value is listed in Table 1. Infrared banding in one sample (78MAR; Fig. 3e,f) showed no cor- respondence with Re concentration. Increased IR transparency does seem to correlate with alteration of molybdenite, however, as is pre- sented in the following section.
Rhenium and Osmium Concentrations by ICP-MS
Rhenium and osmium concentrations in selected molybdenites were determined using isotope dilution. The samples were treated by alkaline fusion with distillation of OS after the technique of MOR- GAN and WALKER ( 1989). The OS distillate and an aliquot of the Re-bearing residual solution were analyzed on a TS-Sola ICP-MS. Analytical uncertainty on the instrument is much better than 1%. ‘85Re-enriched metal was used as a Re spike. Natural OS served for the OS spike because analysis of unspiked molybdenites indicated that only ‘870s is present.
HYPOGENE ENVIRONMENTS: MOLYBDENITE FORMATION AND ALTERATION
In the hypogene environment sulfide minerals are precip- itated and concentrated by circulating solutions associated with a thermal event, usually an intrusion, at depths of l- 10 km (LINDGREN, 1933; TITLEY, 1982). Alteration of the
intrusion occurs in concert with sulfide mineralization, which in porphyry deposits produces mineral assemblages specific to certain P-T-x conditions. Potassic alteration (orthoclase + biotite + quartz) is usually associated with molybdenite + chalcopyrite mineralization and occurs near the center of the intrusive stock. Phyllic/argillic alteration (sericite + bio- tite + clays) occurs peripheral to potassic alteration, but can overprint potassic alteration. Propylitic alteration (chlorite
+ epidote + calcite) is peripheral to phyllic/argillic alteration and represents the waning stages of alteration in a porphyry system ( TITLEY, 1982). These alteration assemblages form over a temperature range of T x 500-15O”C, which in this
study is considered high-temperature alteration. The type and timing of fluid interaction with the molybdenites in the hy- pogene environment is based on the association of these al-
teration assemblages with our samples.
Porphyry Base Metal Deposits
Copper Creek, Arizona, USA
Molybdenites from porphyry base-metal deposits are plot- ted in Fig. 4 in the regions for molybdenites from similar
892 T. E. McCandless, J. Ruiz, and A. R. Campbell
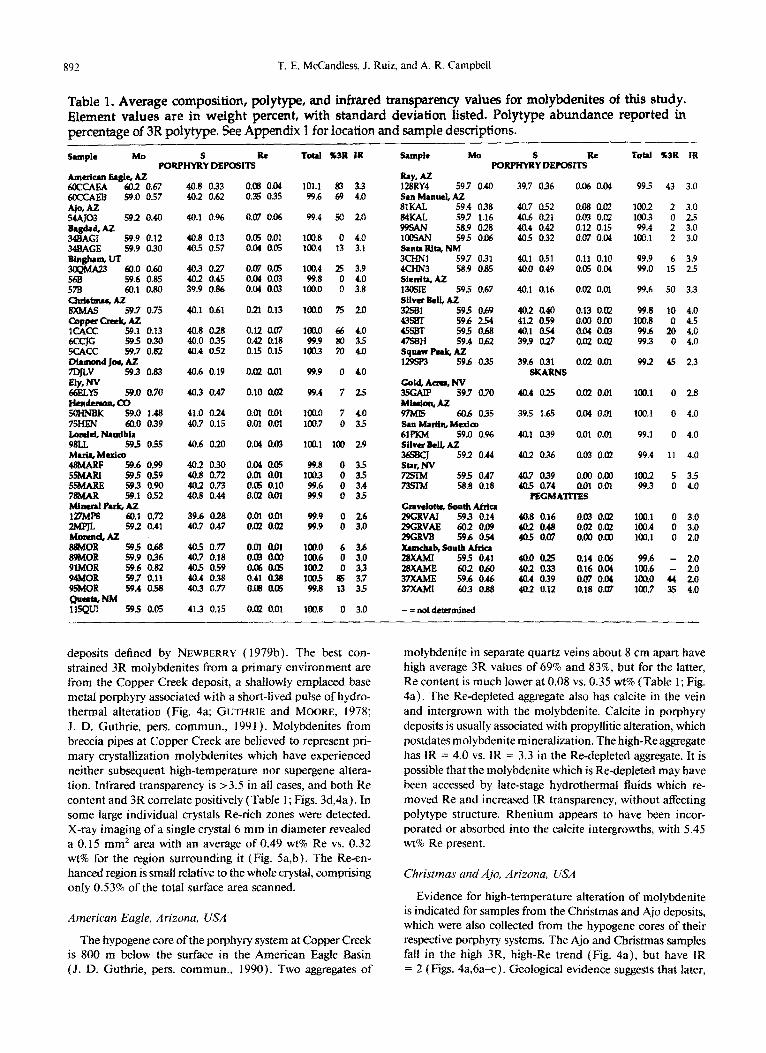
Table 1. Average composition, polytype, and infrared transparency values for molybdenites of this study. Element values are in weight percent, with standard deviation &ted. Polytype abundance reported in percentage of 3R polytype. See Appendix I for location and sample des~ptions.
Sample MO l’ORPHYl&DEPDSITS
ue TotaI X3R JR
Amerlcul Eagle? AZ 6occAEA 60.2 0.67 6KCAEB 59.0 0.57 Ajo, A.z !%AJO3 592 0.40
&!zG?llz 59.9 0.12 34EAGE 59.9 0.30 Bin@aa IJ’T gap23 g0;; ;g
575 60.1 0:80 CMstmu,~
59.7 0.75
~~~ 013
Z& 595 0:30 59.7 0.82
Dkmmd Joe, AZ 7IWV 59.3 0.83 RIY, NV
59.0 0.70 fZiZO%to 5aHNBK 59.0 1.48 ‘ISHEN 60.0 0.39 Wd, Nmdbh 9SLL 595 0.55 Mui&MexJW 48WRF 59.6 0.99
m 59.5 0.59 59.3 0.90
78MAR 59.1 0.52
~%Zpuk,Az 60.1 0.72 592 0.41
Molend# AZ 8WOR 595 0.66 89MOR 59.9 0.36 9lMOR 59.6 0.82 941UOR 59.7 0.11 9SMOR 59.4 058
595 0.05
40.8 0.33 0.06 0.04 402 0.62 0.35 035
40.1 0.96 0.07 0.06
40.8 0.13 0.05 0.01 40.5 0.57 o.op 0.05
40.3 027 0.07 0.05 402 0.45 0.04 0.03 39.9 0.86 0.04 003
r10.1 0.61 oat. 0.13
40.8 028 0.12 0.07 40.0 0.35 0.42 0.18 40.4 0.52 0.15 0.15
40.6 0.19 0.m 0.01
40.3 0.47 0.10 0.02
41.0 0.24 0.01 0.01 40.7 0.15 0.01 am
40.6 020 0.04 0.03
402 0.30 0.04 a05 40.8 0.72 0.m 0.01 402 0.73 0.s 0.10 40.8 0.44 0.m sol
39.6 028 o.ol 0.m 40.7 0.47 o.a? a02
405 0.77 0.01 am 40.7 0.18 0.00 0.00 405 0.59 0.06 aa 40.4 0.38 0.41 a38 403 0.77 0.03 a05
41.3 0.15 0.02 0.01
101.1 83 3.3 99.6 69 40
99.4 50 2.0
ml.8 0 4.0 ma4 13 3.1
100.4 25 3.9 99.8 0 4.0
100.0 0 3.8
100.0 75 20
loo.0 68 4.0 99.9 so 3.5
100.3 70 4.0
99.9 0 4.0
99.4 7 25
100.0 7 4.0 100.7 0 3.5
100.1 loo 29
99.8 0 3.5 1003 0 35 99.6 0 3.4 99.9 0 3.5
99.9 0 2.6 99.9 0 3.0
ma0 6 3.6 100.6 0 3.0 1002 0 3.3 1005 S5 3.7 99.8 13 35
100.8 0 3.0
hllpk MO S lb? PORPHYRY DEPOSITS
Jw, AZ 128RY4 59.7 0.40 39.7 0.36 0.06 o.oI
40.7 0.52 0.08 0.02 40.6 021 0.03 on2 4a4 0.42 0.12 0.15 40-S 0.32 0.07 0.04
40.1 0.51 0.11 0.10 40.0 0.49 0.05 0.04
40.1 0.16 0.02 0.01
402 a40 0.13 O.@ 412 0.59 aal 0.00 40.1 0.54 0.04 003 39.9 027 om 0.02
39.6 0.31 0.02 0.01 WARNS
San MenoeL AZ 81KAL 59.4 038 84KAL 59.7 1.16 99sAN 58.9 028 lW5AN 59.5 0.06 Smtl Rlt& NM 3-1 59.7 031 4cHN3 58.9 0.85 sicnit& AZ I3mE 595 0.67 suva &IL AZ 32sBl 595 0.69 43sBT 59.6 254 45SaT 595 0.68 47SBH 59.4 0.62 sqluw P& Ai? 129SP3 596 035
cold, Aem, NV 59.7 O?O
Miwim&AZ 9mIs 606 035 sanMentin,Mudw 61FKM 59.0 0.96 Silver lkII# AZ 36SBCJ 592 0.44 star, NV
csz 595 58.8 0.47 0.18
GnveIot@ South Africa 29GRVAI 593 0.14 2!?GRVAE 602 0.09 29GRVB 59.6 054 XmcImb, So& Afxica 28XAMI 595 0.41 28xAME 602 060
z_s 59.6 603 0.46 0.88
- = not determined
4a4 02s a02 0.01
39.5 1.65 0.09 0.01
40.1 0.39 0.01 0.01
402 0.36 0.03 0.02
40.7 039 0.00 o.a, 40.5 0.74 a01 o.ol
PEGMhlI-iES
40.8 0.16 0.03 o.oz 40,2 0.48 0.02 0.02 40.5 0.07 0.00 o.al
40.0 025 a14 0.06 40.2 0.33 a16 0.04 40.4 0.39 au7 0.04 40.2 0.12 0.18 0.m
Tobl X3R IR
99.5 43 3.0
100.2 2 3.0 100.3 0 2.5 99.4 2 3.0
100.1 2 3.0
99.9 6 3.9 99.0 15 2.5
99.6 50 3.3
99.8 10 4.0 100.8 0 4.5 99.6 20 4.0 99.3 0 4.0
992 45 2.3
Iax1 0 2.8
100.1 0 4.0
99.1 0 4.0
99.4 11 4.0
1002 5 3.5 993 0 4.0
100.1 0 3.0 loo.4 0 3.0 100.1 0 2.0
99.6 - 2.0 100.6 - 2.0 lW.0 44 2.0 100.7 35 4.0
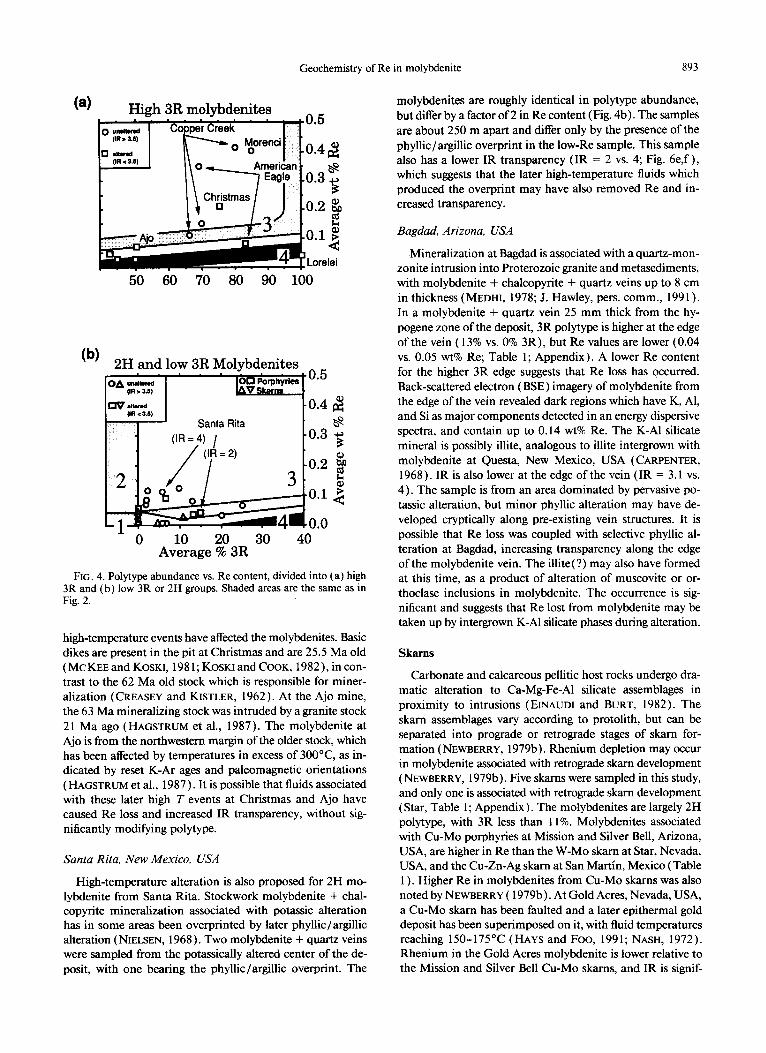
deposits defined by NEWBERRY (1979b). The best con- strained 3R molybdenites from a primary environment are from the Copper Creek deposit, a shallowly emplaced base metal porphyry associated with a short-lived pulse of hydro- thermal alteration (Fig. 4a; GUTHRIE and MOORE, 1978;
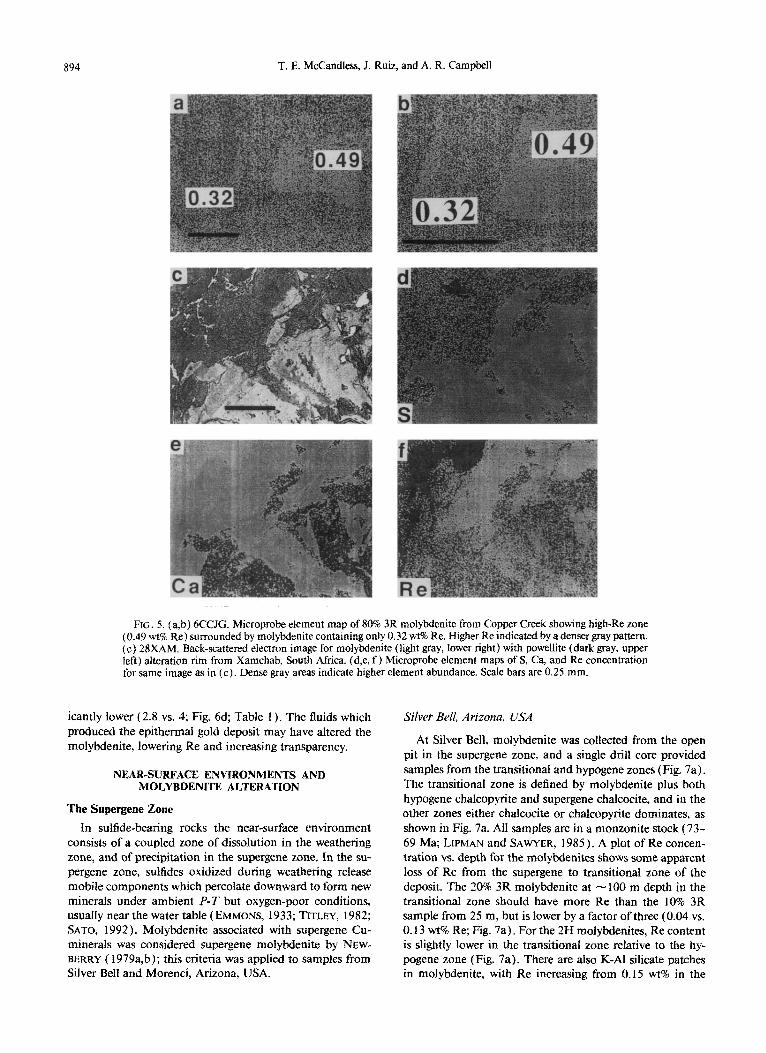
J. D. Guthrie, pers. commun., 1991). Molybdenites from breccia pipes at Copper Creek are believed to represent pri- mary crystallization molybdenites which have experienced neither subsequent hid-tem~rature nor supergene altera- tion. Infrared transparency is >3.5 in all cases, and both Re content and 3R correlate positively (Table I ; Figs. 3d,4a). In some large individual crystals Re-rich zones were detected. X-ray imaging of a single crystal 6 mm in diameter revealed a 0.15 mm2 area with an average of 0.49 wt% Re vs. 0.32 wt% for the region su~ounding it (Fig. Sa,b). The Re-en- hanced region is small relative to the whole crystal, comprising only 0.53% of the total surface area scanned.
American Eagle, Arizona, USA
The hypogene core ofthe porphyry system at Copper Creek is 800 m below the surface in the American Eagle Basin (J. D. Guthrie, pets. commun., 1990). Two aggregates of
molybdenite in separate quartz veins about 8 cm apart have high average 3R values of 69% and 83%, but for the latter, Re content is much lower at 0.08 vs. 0.35 wt% (Table 1; Fig. 4a). The Re-depleted aggregate also has calcite in the vein and intergrown with the molybdenite. Calcite in porphyry deposits is usually associated with propyllitic alteration, which postdates molybdenite mineralization. The high-Reaggregate has IR = 4.0 vs. IR = 3.3 in the Re-depleted aggregate. It is possible that the moly~enite which is Re-depleted may have been accessed by late-stage hydrothermal fluids which re- moved Re and increased IR transparency, without affecting polytype structure. Rhenium appears to have been incor- porated or absorbed into the calcite intergrowths, with 5.45 wt% Re present.
Chrislmas and Ajo, Arizona, USA
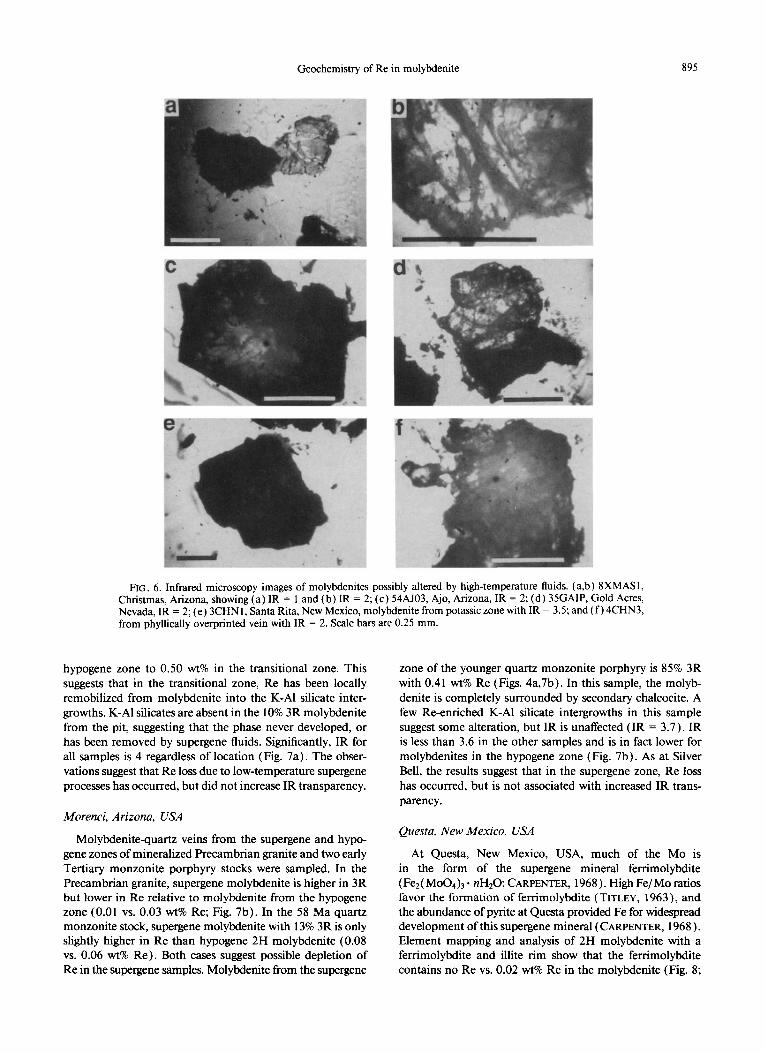
Evidence for high-temperature alteration of molybdenite is indicated for samples from the Christmas and Ajo deposits, which were also collected from the hypogene cores of their respective porphyry systems. The Ajo and Christmas samples fall in the high 3R, high-Re trend (Fig. 4a), but have IR = 2 (Figs. 4a,6a-c). Geological evidence suggests that later,
Geochemistry of Re in molybdenite 893
(a) High 3R molybdenites - cu.0
2H and low 3R Molybdenites 0.5
FIG. 4. Polytype abundance vs. Re content, divided into (a) high 3R and (b) low 3R or 2H groups. Shaded areas are the same as in Fig. 2.
high-temperature events have affected the molybdenites. Basic dikes are present in the pit at Christmas and are 25.5 Ma old (MCKEE and KOSKI, 198 1; KOSKI and COOK, 1982), in con- trast to the 62 Ma old stock which is responsible for miner- alization ( CREASEY and KISTLER, 1962 ) . At the Ajo mine, the 63 Ma mineralizing stock was intruded by a granite stock 2 1 Ma ago ( HAGSTRUM et al., 1987). The molybdenite at Ajo is from the northwestern margin of the older stock, which has been affected by temperatures in excess of 300°C as in- dicated by reset K-Ar ages and paleomagnetic orientations ( HAGSTRUM et al., 1987 ). It is possible that fluids associated with these later high T events at Christmas and Ajo have caused Re loss and increased IR transparency, without sig- nificantly modifying polytype.
Santa Rita, New Mexico, USA
High-temperature alteration is also proposed for 2H mo- lybdenite from Santa Rita. Stockwork molybdenite + chal- copyrite mineralization associated with potassic alteration has in some areas been overprinted by later phyllic/argillic alteration (NIELSEN, 1968 ) . Two molybdenite + quartz veins were sampled from the potassically altered center of the de- posit, with one bearing the phyllic/arg_illic overprint. The
molybdenites are roughly identical in polytype abundance, but differ by a factor of 2 in Re content (Fig. 4b). The samples are about 250 m apart and differ only by the presence of the phyllic/argillic overprint in the low-Re sample. This sample also has a lower IR transparency (IR = 2 vs. 4; Fig. 6e,f ), which suggests that the later high-temperature fluids which produced the overprint may have also removed Re and in- creased transparency.
Bagdad, Arizona, USA
Mineralization at Bagdad is associated with a quartz-mon- zonite intrusion into Proterozoic granite and metasediments, with molybdenite + chalcopyrite + quartz veins up to 8 cm in thickness ( MEDHI, 1978; J. Hawley, pers. comm., 199 1). In a molybdenite + quartz vein 25 mm thick from the hy- pogene zone of the deposit, 3R polytype is higher at the edge of the vein ( 13% vs. 0% 3R), but Re values are lower (0.04 vs. 0.05 wt% Re; Table 1; Appendix). A lower Re content for the higher 3R edge suggests that Re loss has occurred. Back-scattered electron (BSE) imagery of molybdenite from the edge of the vein revealed dark regions which have K, Al, and Si as major components detected in an energy dispersive spectra, and contain up to 0.14 wt% Re. The K-Al silicate mineral is possibly illite, analogous to illite intergrown with molybdenite at Questa, New Mexico, USA (CARPENTER, 1968). IR is also lower at the edge of the vein (IR = 3.1 vs. 4). The sample is from an area dominated by pervasive po- tassic alteration, but minor phyllic alteration may have de- veloped cryptically along pre-existing vein structures. It is possible that Re loss was coupled with selective phyllic al- teration at Bagdad, increasing transparency along the edge of the molybdenite vein. The illite(?) may also have formed at this time, as a product of alteration of muscovite or or- thoclase inclusions in molybdenite. The occurrence is sig- nificant and suggests that Re lost from molybdenite may be taken up by intergrown K-Al silicate phases during alteration.
Skarns
Carbonate and calcareous pellitic host rocks undergo dra- matic alteration to Ca-Mg-Fe-Al silicate assemblages in proximity to intrusions (EINAUDI and BURT, 1982). The skarn assemblages vary according to protolith, but can be separated into prograde or retrograde stages of skarn for- mation ( NEWBERRY, 1979b). Rhenium depletion may occur in molybdenite associated with retrograde &am development ( NEWBERRY, 1979b). Five skams were sampled in this study, and only one is associated with retrograde skarn development (Star, Table 1; Appendix ). The molybdenites are largely 2H polytype, with 3R less than 11%. Molybdenites associated with Cu-MO porphyries at Mission and Silver Bell, Arizona, USA, are higher in Re than the W-MO skam at Star, Nevada, USA, and the Cu-Zn-Ag skarn at San Martin, Mexico (Table 1). Higher Re in molybdenites from Cu-MO skarns was also noted by NEWBERRY ( 1979b). At Gold Acres, Nevada, USA, a Cu-MO skarn has been faulted and a later epithermal gold deposit has been superimposed on it, with fluid temperatures reaching 150-175°C (HAYS and Foo, 1991; NASH, 1972). Rhenium in the Gold Acres molybdenite is lower relative to the Mission and Silver Bell Cu-MO skams, and IR is signif-
894 T. E. McCandless. J. Ruiz, and A. R. Campbell
FIG. 5. (a&) 6CCJCi. Microprobe element map of 80% 3R molybdenite from Copper Creek showing high-Re zone (0.49 wt% Re) surrounded by moly~eni~e cont~ning only 0.32 wt% Re. Higher Re indicated by a denser gray pattern. (c) 28XAM. Back-scattered electron image for molybdenite (light gray, lower right) with powellite (dark gray, upper left) alteration rim from Xamchab, South Africa. (d,e, f ) Microprobe element maps of S, Ca, and Re concentration for same image as in (c). Dense gray areas indicate higher element abundance. Scale bars are 0.25 mm.
icantly lower (2.8 vs. 4; Fig. 6d, Table 1). The fluids which produced the epithermal gold deposit may have altered the molybdenite, lowering Re and increasing transparency.
NEAR-SURFACE ENVIRONMENTS AND MOLYBDENITE ALTERATION
The Supergene Zone
In sulfide-bearing rocks the near-surface environment consists of a coupled zone of dissolution in the weathering zone, and of precipitation in the supergene zone. In the su- pergene zone, sulfides oxidized during weathering release mobile components which percolate downward to form new minerals under ambient P-T but oxygen-poor conditions, usualIy near the water table ( EMMONS, 1933; TITLEY, 1982; SATO, 1992). Molybdenite associated with supergene Cu- mineraIs was considered supergene moly~enite by NEW- BERRY ( 1979a,b); this criteria was applied to samples from Silver Bell and Morenci, Arizona, USA.
Silver Bell, Arizona, USA
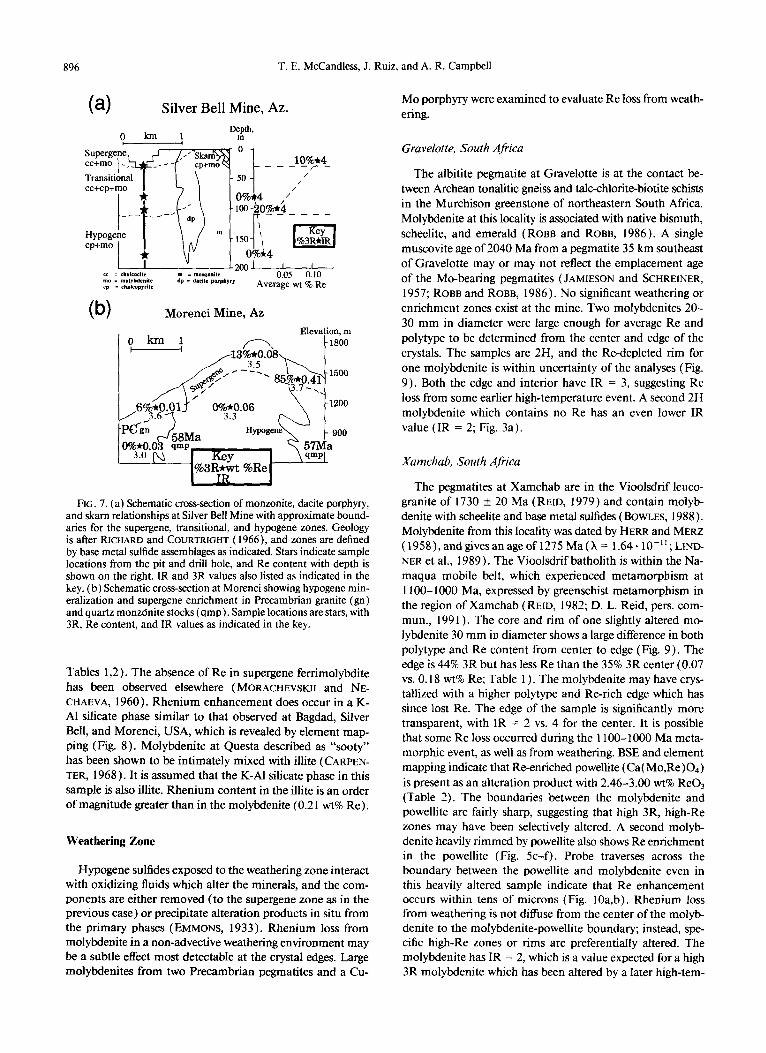
At Silver Bell, molybdenite was coIIected from the open pit in the supergene zone, and a single drill core provided samples from the transitional and hypogene zones (Fig. 7a). The transitional zone is defined by molybdenite plus both hypogene chalcopyrite and supergene chalcocite, and in the other zones either chalcocite or chal~py~te dominates, as shown in Fig. ?a. All samples are in a monzonite stock (73- 69 Ma; LIPMAN and SAWYER, 1985). A plot of Re concen- tration vs. depth for the molybdenites shows some apparent loss of Re from the supergene to transitional zone of the deposit. The 20% 3R molybdenite at - 100 m depth in the transitional zone should have more Re than the 10% 3R sample from 25 m, but is lower by a factor of three (0.04 vs. 0.13 wt% Re; Fig. 7a). For the 2H molybdenites, Re content is slightly lower in the transitional zone relative to the hy- pogene zone (Fig. 7a). There are also K-AI silicate patches in molybdenite, with Re increasing from 0.15 wt% in the
Geochemistry of Re in molybdenite 895
FIG. 6. Infrared microscopy images of molybdenites possibly altered by high-temperature fluids. (a,b) 8XMAS 1, Christmas, Arizona, showing (a) IR = 1 and (b) IR = 2; (c) 54AJ03, Ajo, Arizona, IR = 2; (d) 35GAIP, Gold Acres, Nevada, IR = 2; (e) 3CHN1, Santa Rita, New Mexico, molybdenite from potassic zone with IR = 3.5; and ( f) 4CHN3, from phyllically overprinted vein with IR = 2. Scale bars are 0.25 mm.
hypogene zone to 0.50 wt% in the transitional zone. This suggests that in the transitional zone, Re has been locally remobilized from molybdenite into the K-Al silicate inter- growths. K-Al silicates are absent in the 10% 3R molybdenite from the pit, suggesting that the phase never developed, or has been removed by supergene fluids. Significantly, IR for all samples is 4 regardless of location (Fig. 7a). The obser- vations suggest that Re loss due to low-temperature supergene processes has occurred, but did not increase IR transparency.
Morenci, Arizona, USA
Molybdenitequartz veins from the supergene and hypo- gene zones of mineralized Precambrian granite and two early Tertiary monzonite porphyry stocks were sampled. In the Precambrian granite, supergene molybdenite is higher in 3R but lower in Re relative to molybdenite from the hypogene zone (0.01 vs. 0.03 wt% Re; Fig. 7b). In the 58 Ma quartz monzonite stock, supergene molybdenite with 13% 3R is only slightly higher in Re than hypogene 2H molybdenite (0.08 vs. 0.06 wt% Re). Both cases suggest possible depletion of Re in the super-gene samples. Molybdenite from the supergene
zone of the younger quartz monzonite porphyry is 85% 3R with 0.4 1 wt% Re (Figs. 4a,7b). In this sample, the molyb- denite is completely surrounded by secondary chalcocite. A few Re-enriched K-Al silicate intergrowths in this sample suggest some alteration, but IR is unaffected (IR = 3.7). IR is less than 3.6 in the other samples and is in fact lower for molybdenites in the hypogene zone (Fig. 7b). As at Silver Bell, the results suggest that in the supergene zone, Re loss has occurred, but is not associated with increased IR trans- parency.
Questa, New Mexico, USA
At Questa, New Mexico, USA, much of the MO is in the form of the supergene mineral fenimolybdite (Fez( MoO~)~ - nH20; CARPENTER, 1968). High Fe/MO ratios favor the formation of fenimolybdite ( TITLEY, 1963), and the abundance of pyrite at Questa provided Fe for widespread development of this supergene mineral (CARPENTER, 1968). Element mapping and analysis of 2H molybdenite with a ferrimolybdite and illite rim show that the fenimolybdite contains no Re vs. 0.02 wt% Re in the molybdenite (Fig. 8;
896 T. E. McCandless. J. Ruiz, and A. R. Campbell
Morenci Mine, AZ
%BR*wt %Re IR
FOG. 7. (a) Schematic cross-section of monzonite, dacite porphyry, and skarn relationships at Silver Bell Mine with approximate bound- aries for the supergene, transitional, and hypogene zones. Geology is after RICHARD and COURTRIGHT ( 1966), and zones are defined by base metal sulfide assemblages as indicated. Stars indicate sample locations from the pit and drill hole, and Re content with depth is shown on the right. IR and 3R values also listed as indicated in the key. (b) Schematic cross-section at Morenci showing hypogene min- eralization and supergene enrichment in Precambrian granite (gn) and quartz monzo‘nite stocks (qmp). Sample locations are stars, with 3R, Re content, and IR values as indicated in the key.
Tables 1,2). The absence of Re in supergene ferrimolybdite has been observed elsewhere (MORACHEVSKII and NE- CHAEVA, 1960). Rhenium enhancement does occur in a K- Al silicate phase similar to that observed at Bagdad, Silver Bell, and Morenci, USA, which is revealed by element map- ping (Fig. 8). Molybdenite at Questa described as “sooty” has been shown to be intimately mixed with illite ( CARPEN- TER, 1968 ). It is assumed that the K-Al silicate phase in this sample is also illite. Rhenium content in the illite is an order of magnitude greater than in the molybdenite (0.2 1 wt% Re).
Weathering Zone
Hypogene sulfides exposed to the weathering zone interact with oxidizing fluids which alter the minerals, and the com- ponents are either removed (to the supergene zone as in the previous case) or precipitate alteration products in situ from the primary phases ( EMMONS, 1933). Rhenium loss from molybdenite in a non-advective weathering environment may be a subtle effect most detectable at the crystal edges. Large molybdenites from two Precambrian pegmatites and a Cu-
MO porphyry were examined to evaluate Re loss from weath- ering.
Gravelotte, South Africa
The albitite pegmatite at Gravelotte is at the contact be- tween Archean tonalitic gneiss and talc-chlorite-biotite schists in the Murchison greenstone of northeastern South Africa. Molybdenite at this locality is associated with native bismuth, scheelite, and emerald (ROBB and ROBB, 1986). A single muscovite age of 2040 Ma from a pegmatite 35 km southeast of Gravelotte may or may not reflect the emplacement age of the MO-bearing pegmatites ( JAMIESON and SCHREINER, 1957; ROBB and ROBB, 1986 ). No significant weathering or enrichment zones exist at the mine. Two molybdenites 20- 30 mm in diameter were large enough for average Re and polytype to be determined from the center and edge of the crystals. The samples are 2H, and the Re-depleted rim for one molybdenite is within uncertainty of the analyses (Fig. 9). Both the edge and interior have IR = 3, suggesting Re loss from some earlier high-temperature event. A second 2H molybdenite which contains no Re has an even lower IR value (IR = 2; Fig. 3a).
Xamchab, South Africa
The pegmatites at Xamchab are in the Vioolsdrif leuco- granite of 1730 + 20 Ma (REID, 1979) and contain molyb- denite with scheelite and base metal sulfides ( BOWLES, 1988 ). Molybdenite from this locality was dated by HERR and MERZ (1958),andgivesanageof1275Ma(X= 1.64.10-“;L1~~- NER et al., 1989). The Vioolsdrif batholith is within the Na- maqua mobile belt, which experienced metamorphism at 11 OO- 1000 Ma, expressed by greenschist metamorphism in the region of Xamchab (REID, 1982; D. L. Reid, pers. com- mun., 199 1) . The core and rim of one slightly altered mo- lybdenite 30 mm in diameter shows a large difference in both polytype and Re content from center to edge (Fig. 9). The edge is 44% 3R but has less Re than the 35% 3R center (0.07 vs. 0.18 wt% Re; Table 1). The molybdenite may have crys- tallized with a higher polytype and Re-rich edge which has since lost Re. The edge of the sample is significantly more transparent, with IR = 2 vs. 4 for the center. It is possible that some Re loss occurred during the 1100-l 000 Ma meta- morphic event, as well as from weathering. BSE and element mapping indicate that Re-enriched powellite (Ca( Mo,Re)04) is present as an alteration product with 2.46-3.00 wt% Re03 (Table 2). The boundaries between the molybdenite and powellite are fairly sharp, suggesting that high 3R, high-Re zones may have been selectively altered. A second molyb- denite heavily rimmed by powellite also shows Re enrichment in the powellite (Fig. 5c-f). Probe traverses across the boundary between the powellite and molybdenite even in this heavily altered sample indicate that Re enhancement occurs within tens of microns (Fig. lOa,b). Rhenium loss from weathering is not diffuse from the center of the molyb- denite to the molybdenite-powellite boundary; instead, spe- cific high-Re zones or rims are preferentially altered. The molybdenite has IR = 2, which is a value expected for a high 3R molybdenite which has been altered by a later high-tem-

Geochemistry of Re in molybdenite 897
FIG. 8. (a) 11 SQU. Back-scattered electron image of molybdenite (white) altered to ferrimolybdite (light gray) and illite( ?) (dark gray) from Questa. Microprobe element maps for (b) S, (c) MO, (d) Fe, (e) Al, ( f) Si, (g) K, and (h) Re abundances. High concentrations indicated by white areas. Scale bar is 0.25 mm.
perature event. However, mixtures of molybdenite and pow- Lorelei Cu-MO porphyry, Namibia ellite can increase transparency, as powellite is transparent to infrared radiation.
Table 2. Representative analyses of powellite and ferrimolybdite alteration products of molybdenite. All values in weight percent.
Xam-372 Xam-37 Xam-28 1150112 CaO 25.6 24.5 26.7 -- &2@ __ -_ __ 25.2 Moo3 71.3 72.1 70.9 65.9 R&3 3.00 2.46 2.77 0.00 Total 99.9 99.1 loo.4 91.1’ Key: Xam-372,37,28, powellite in molybdenite 37j<AM (Table 1); 115&2, ferrimolybdite in molybdenite 115QU. -- = not determined; *H20 content not determined.
The Lorelei porphyry Cu-MO deposit in Namibia is part of the Haib volcanic group and has a primary crystallization age of 1960 Ma (REID, 1979; REID et al., 1987; VILJOEN et al., 1986). The molybdenite has been exposed to supergene alteration and the same metamorphic events as at Xamchab. It is 100% 3R, but very low in Re (0.04 wt% Re; Fig. 4a).
IR is 2.9 (Fig. 3b), suggesting that early Re loss occurred during greenschist metamorphism as suggested at Xamchab, with further loss likely from supergene and weathering pro- cesses.
DISCUSSION
Molyhdenite in the Hypogene Environment
In contrast to the prediction of NEWBERRY ( 1979b), high- temperature fluids appear to cause Re loss and increased

898 T. E. McCandless, J. Ruiz, and A. R. Campbell
FIG. 9. Polytype-Re plot of large single molybdenite crystals from Precambrian pegmatites at Gravelotte and Xamchab, South Africa, with approximate ages for mineralization as indicated.
transparency in both 3R and 2H molybdenites without sig- nificantly changing polytype. The critical IR value is -3.5; molybdenites below this have probably experienced alteration from high-temperature fluids. In porphyry systems, fluids move largely along fractures, which are intermittently sealed off by precipitating minerals ( TITLEY, 1982). Late-stage hy- drothermal fluids can therefore remove Re from molybdenite in one vein, whereas molybdenite in a nearby vein may escape alteration because it is sealed. This may explain why quartz- molybdenite veins only centimeters apart from American Eagle differ greatly in IR and Re content. Similar late-stage phyllic/argillic alteration along vein edges at Bagdad pro- duced Re-enriched K-Al silicate intergrowths in molybdenite, which are detectable only by BSE imagery. On a larger scale Re-depleted 2H molybdenite at Santa Rita occurs in late- stage phyllic/argillic alteration envelopes within the potass- ically altered hypogene core of the system. Molybdenite from the skam at Gold Acres is more transparent than molybdenite from other Cu-MO skarns and appears to have lost Re to fluids associated with later epithermal Au mineralization. These observations imply that Re loss can occur in fluids associated with phyllic/argillic to propylitic alteration, at temperatures as low as 150°C. Infrared microscopy, coupled with microprobe, BSE, and XRD analysis of molybdenites, can document Re loss from alteration associated with high- temperature thermal events.
Molyhdenite in the Near-Surface Environment
Field and theoretical studies suggest that MoS2 should be unstable in supergene settings and that Re may be more mo- bile than MO (VINOGRADOV, 1957a,b; TITLEY and AN- THONY, 196 I), Some molybdenites in the supergene zone at Silver Bell and Morenci were Re-depleted relative to samples in the hypogene zone, but others appeared to be unaffected. As with the hypogene environment, supergene processes are also fracture-controlled ( TITLEY, 1982)) and some molyb- denites may escape alteration due to restricted fluid access. This cannot explain the apparent stability of 3R molybdenite surrounded by supergene chalcocite at Morenci. At most base metal porphyry deposits, and in this study, the supergene zone is defined by the presence of chalcocite after chalcopyrite ( NEWBERRY, 1979b). Theoretical studies suggest that con- ditions favorable for increased Cu solubility are not consan- guinous with increased MO solubility, so fluids which alter
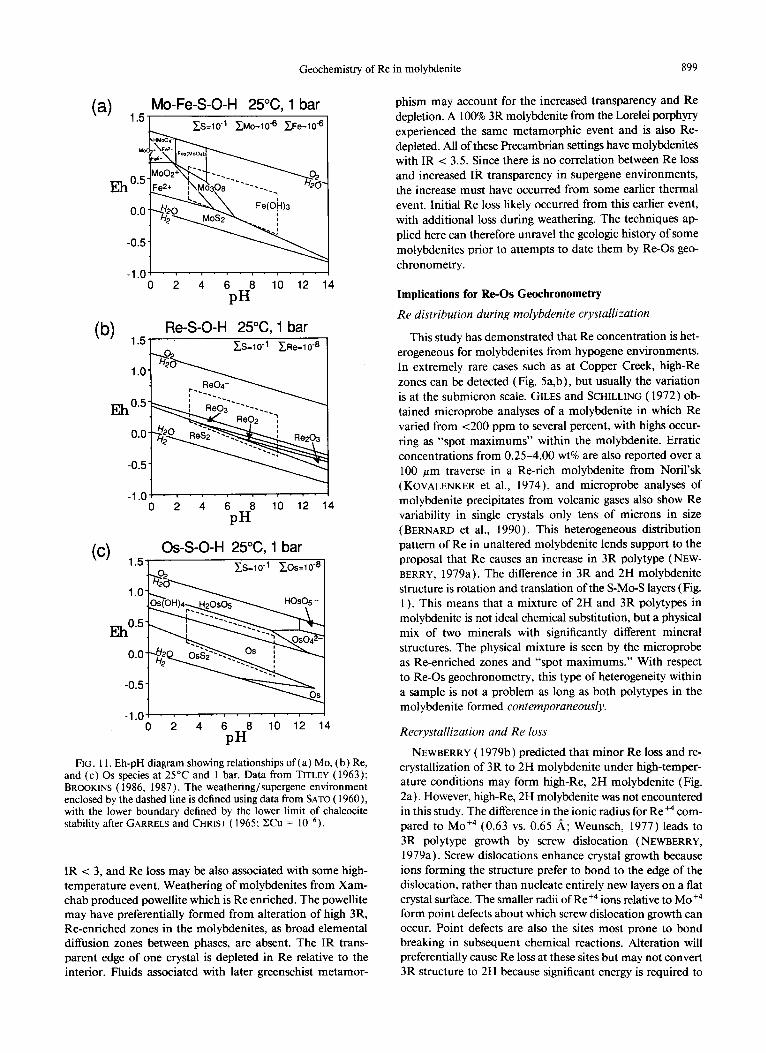
chalcopyrite may not affect molybdenite ( HANSULD, 1966 ) . In Eh-pH space, this is supported by the observation that the lower limit of chalcocite stability just overlaps with the upper limits of Re!$ and MoSz stability (Fig. 1 la,b). Hence, fluids capable of altering chalcopyrite and precipitating chalcocite may be unreactive with molybdenite. An alternate possibility is that the metastable chalcocite + molybdenite assemblage exists because molybdenite alteration is hindered by a high activation energy barrier ( SATO, 1992). High Fe/ MO ratios do produce favorable conditions for supergene alteration of molybdenite at Questa, and 2H molybdenite partially altered to ferrimolybdite is low in Re and may have suffered some Re loss. Rhenium is not enriched in the ferrimolybdite, but in a K-Al silicate phase. Rhenium can form insoluble rhenates in the presence of K which often absorb onto clays ( BOYKO and MILLER, 1980). This observation, and the association of molybdenite with illite at Questa (CARPENTER, 1968), leads us to suspect that the K-Al-silicate phase detected at Questa, Bagdad, Morenci, and Silver Bell, USA, is illite. Mo- lybdenites from the supergene zone are generally opaque with IR > 3.5, making infrared microscopy an ineffective means of detecting Re loss under these conditions.
In the weathering environment, a single molybdenite from Gravelotte appears to have slight Re depletion at the edge, though the difference relative to the interior of the crystal is within analytical error. Molybdenites from Gravelotte have
(a) 50 28XAM - Xamchab
0 -100 -50 0 50 100 ,500
microns
04 3_ 28XAM - Xamchab
powellite / molybdenite -70
2-
Re
C 60
.Mo -50
o+ ’ : ’ ’ + -100 -50 0 50 100 1503O
microns FIG. IO. 28XAM. Microprobe element traverses of (a) Ca, S, and
(b) MO, Re, across the molyhclenite/powellite boundary in Fig. 5c. Note the absence of diffusion gradients. Values are in wt% of element.
Geochemistry of Re in molybdenite 899
(a> 1.5- Mo-Fe-S-O-H 25X, 1 bar
-1.01 - 'I 8 '8' - '8.
0 2 4 6 8 10 12 14
PH
lb) 1.5- Re-S-O-H 25X, 1 bar
&=io-’ ~~e=10-6
-1.0, ’ r ’ ’ ’ ’ 0 2 4 6 8 10 12 14
PH
@) 1.5- OS-S-O-H 25%, 1 bar
zs=10-' ~os=lo-*
-1.0, 8 . ’ ’ 8 7 I 0 2 4 6 8 10 12 14
PH
FIG. I 1. Eh-pH diagram showing relationships of (a) MO, (b) Re, and (c) OS species at 25°C and 1 bar. Data from TITLEY ( 1963); BROOKINS ( 1986, 1987). The weathering/supergene environment enclosed by the dashed line is defined using data from SATO ( 1960), with the lower boundary defined by the lower limit of chalcocite stability after CARRELS and CHRIST ( 1965; ZCu = 10m6).
IR < 3, and Re loss may be also associated with some high- temperature event. Weathering of molybdenites from Xam- chab produced powellite which is Re enriched. The powellite may have preferentially formed from alteration of high 3R, Re-enriched zones in the molybdenites, as broad elemental diffusion zones between phases, are absent. The IR trans- parent edge of one crystal is depleted in Re relative to the interior. Fluids associated with later greenschist metamor-
phism may account for the increased transparency and Re
depletion. A 100% 3R molybdenite from the Lorelei porphyry experienced the same metamorphic event and is also Re- depleted. All of these Precambrian settings have molybdenites with IR < 3.5. Since there is no correlation between Re loss
and increased IR transparency in supergene environments,
the increase must have occurred from some earlier thermal event. Initial Re loss likely occurred from this earlier event, with additional loss during weathering. The techniques ap-
plied here can therefore unravel the geologic history of some molybdenites prior to attempts to date them by Re-0s geo-
chronometry.
Implications for Re-0s Geochronometry
Re distribution during molybdenite crystallization
This study has demonstrated that Re concentration is het-
erogeneous for molybdenites from hypogene environments. In extremely rare cases such as at Copper Creek, high-Re
zones can be detected (Fig. 5a,b), but usually the variation is at the submicron scale. GILES and SCHILLING ( 1972) ob- tained microprobe analyses of a molybdenite in which Re varied from ~200 ppm to several percent, with highs occur-
ring as “spot maximums” within the molybdenite. Erratic
concentrations from 0.25-4.00 wt% are also reported over a 100 Frn traverse in a Re-rich molybdenite from Noril’sk (KOVALENKER et al., 1974), and microprobe analyses of
molybdenite precipitates from volcanic gases also show Re variability in single crystals only tens of microns in size (BERNARD et al., 1990). This heterogeneous distribution pattern of Re in unaltered molybdenite lends support to the proposal that Re causes an increase in 3R polytype (NEW-
BERRY, 1979a). The difference in 3R and 2H molybdenite structure is rotation and translation of the S-Mo-S layers (Fig. 1). This means that a mixture of 2H and 3R polytypes in
molybdenite is not ideal chemical substitution, but a physical mix of two minerals with significantly different mineral structures. The physical mixture is seen by the microprobe as Re-enriched zones and “spot maximums.” With respect
to Re-0s geochronometry, this type of heterogeneity within a sample is not a problem as long as both polytypes in the molybdenite formed contemporaneously.
Recrystallization and Re loss
NEWBERRY ( 1979b) predicted that minor Re loss and re-
crystallization of 3R to 2H molybdenite under high-temper- ature conditions may form high-Re, 2H molybdenite (Fig.
2a). However, high-Re, 2H molybdenite was not encountered in this study. The difference in the ionic radius for Re+4 com- pared to Mo+~ (0.63 vs. 0.65 A; Weunsch, 1977) leads to
3R polytype growth by screw dislocation (NEWBERRY,
1979a). Screw dislocations enhance crystal growth because ions forming the structure prefer to bond to the edge of the
dislocation, rather than nucleate entirely new layers on a flat crystal surface. The smaller radii of Re+4 ions relative to Mo+~ form point defects about which screw dislocation growth can occur. Point defects are also the sites most prone to bond breaking in subsequent chemical reactions. Alteration will preferentially cause Re loss at these sites but may not convert 3R structure to 2H because significant energy is required to

900 T. E. McCandless, J. Ruiz, and A. R. Campbell
rotate S-MO-S layers. If sufficient energy is available, it is not likely that high-Re, 3R molybdenite will recrystallize to a high-Re, 2H polytype because Re present in solution would again be drawn to molybdenite and nucleate by screw dis- location. Only the advective removal of Re by hydrothermal fluids would allow 3R to recrystallize as 2H molybdenite. Thus, polytype transformation without Re loss (left-pointing arrow, Fig. 2a) is geochemically unreasonable. The results of this study suggest that Re loss occurs with little or no polytype transformation (downward-pointing arrow, Fig. 2a). Eval- uating suitable molybdenites for dating based solely on the diagram of NEWBERRY ( 1979b; Fig. 2a), a possibility alluded to in previous dating attempts (LUCK and ALLI?GRE, 1982; ISHIHARA et al., 1989), is ineffective for these reasons.
High-temperature alteration and Re loss
Molybdenites which have experienced high-temperature alteration evidenced by geologic criteria have also shown in- creased transparency. Infrared microscopy may be an addi- tional tool in evaluating Re loss for molybdenites under these conditions. Molybdenite affected by high-temperature alter- ation can still give a reasonable age, if the alteration is as- sociated with the same thermal event responsible for min- eralization. The Re-depleted molybdenites from American Eagle and Santa Rita may have been altered soon after crys- tallization and may give ages that are within error of the measurement. At the Ajo and Christmas mines, geologic ev- idence supports the possibility that increased transparency and Re loss in 3R molybdenite may be related to alteration from thermal events which are much later than the alteration associated with the mineralizing event, and erroneous ages may be expected from these samples. Infrared microscopy cannot distinguish when the increased transparency devel- oped, and ages obtained on any molybdenites with IR < 3.5 may be erroneous.
Re loss in the supergene environment
In the supergene environment, molybdenite may experi- ence Re loss, although it is possible that some molybdenite may be unaffected by supergene fluids. In the weathering environment, significant Re may be concentrated into sec- ondary phases such as powellite or illite. Molybdenite in either setting would typically not be selected for dating, except in cases where no other samples are available. The most effective method of detecting molybdenite affected by weathering or supergene processes is examination using BSE imagery for the presence of zones of alteration and replacement by sec- ondary minerals.
The most significant detriment to the successful application of molybdenite Re-0s geochronometry is the presence of Re- enriched K-Al-Si (illite?) phases in molybdenite. The illite inclusions in molybdenite from Bagdad, Questa, Morenci, and Silver Bell, USA, typically have an order of magnitude more Re relative to their molybdenite host. Illite may be identified by XRD in molybdenites which appear “sooty” (CARPENTER, 1968 ) . The small amounts of illite in samples of this study were not detected using XRD and would be overlooked in a simple optical examination prior to dating.
The presence of this phase in a dated sample is significant, because in Eh-pH space, Re and MO share roughly similar stability fields in the system M-S-O-H and can be complexed under supergene conditions, whereas OS is stable as an ele- mental species (Fig. 11 c) , Rhenium in molybdenite may be removed by supergene fluids after some has decayed to ‘*‘OS, causing erroneously old ages, or it may be enriched in the illite intergrowths, creating ages which are too young.
Re-0s Molybdenite Ages
Following the evaluative techniques outlined above, Re- OS ages for selected molybdenites were determined (Table 3; Fig. 12 ) . Molybdenites from the Copper Creek and Maria porphyries, and the Mission skam, are unaltered and plot within uncertainty of the K-Ar ages for the mineralizing in- trusions (Fig. 12b). Molybdenite from the center of the 25- mm-thick vein at Bagdad also has a Re-0s age in agreement with the stock age. In contrast, molybdenite from the vein edge is more transparent, contains Re-enriched K-Al silicates, and has a younger age. High 3R molybdenite from the su- pergene zone at Morenci also contains a few Re-enriched K- Al silicates, but gives an age within error of the 57-Ma stock. Rhenium in this molybdenite is five times greater than the molybdenite from the vein edge at Bagdad (204 1.9 vs. 465.6 ppm; Table 3). It is likely that the intergrowths in the Morenci molybdenite are insufficient in number, or contain too little Re, to have an effect on the Re-0s age.
Molybdenite from the Gold Acres Cu-MO skam was clearly affected by fluids associated with later epithermal gold min- eralization. The molybdenite is transparent, Redepleted, and gives an age of 168.3 Ma vs. 99.0 Ma for the associated stock (Fig. 12a). Molybdenite from the Lorelei deposit was pre- dicted to have lost Re from later thermal events, with further loss during weathering. The Re-0s is younger than predicted, however, which requires either Re addition or OS loss (Fig. 12a). The stability of OS in near-surface environment has been demonstrated previously (Fig. 11 c). It is possible that Re-enriched weathering products similar to those observed at nearby Xamchab were also present in the Lorelei molyb- denite, but escaped detection by BSE imagery. Rhenium content is similar to the altered Bagdad molybdenite (349.5 ppm), and small amounts of Re-enriched phases could sig- nificantly shift the Re-0s age toward a younger value.
Table 3. Rhenium and osmium concentrations and Re-0s ages for molybdenites, with K-Ar ages for stocks attributed to molybdenite crystallization at each location. See Appendix 1 for K-Ar age references and sample descriptions.
Re, OS, Re-Os* K-Ar &W&Location m maee.Maaae.Ma 34BAGI Bagdad, AZ 618.6 0.452 70.8 72.6 34BAGE Bagdad, AZ 465.8 0.322 67.0 72.6 1CACC Copper Creek, AZ 856.3 0.503 56.9 59.0 35GAIP Gold Acres. NV 61.0 0.106 168.3 99.0 98LL Lorelei, S. Africa 349.5 5.733 1570.9 196ot 48MARF Maria, Mexico 413.8 0.245 57.4 58.0 97Mrs Mission, AZ 427.1 0.265 60.2 60.0 94MOR Morenci, AZ 2041.9 1.175 55.8 57.0
*&=1.64~10-6 yrl (Lindner et al., 1989) tRbSr age
Geochemistry of Re in molybdenite 901
(a)
1oy “‘.“’ “““’ -4 10 100 1000 10000
&-OS sge, Ma
(b)
50 60 70 80 Re-0s age, Ma
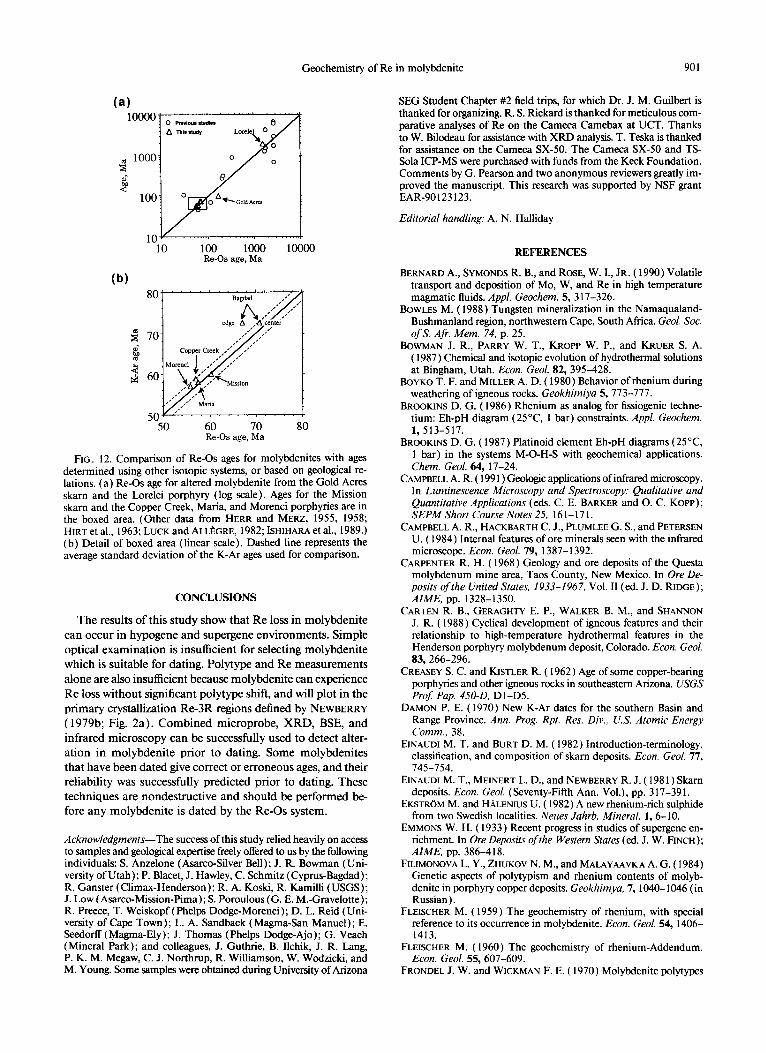
FIG. 12. Comparison of Re-0s ages for molybdenites with ages determined using other isotopic systems, or based on geological re- lations. (a) Re-0s age for altered molybdenite from the Gold Acres skam and the Lorelei porphyry (log scale). Ages for the Mission skarn and the Copper Creek, Maria, and Morenci porphyries are in the boxed area. (Other data from HERR and MERZ, 1955, 1958; HIRT et al., 1963; LUCK and ALL~GRE, 1982; ISHIHARA et al., 1989.) (b) Detail of boxed area (linear scale). Dashed line represents the average standard deviation of the K-Ar ages used for comparison.
CONCLUSIONS
The results of this study show that Re loss in molybdenite can occur in hypogene and supergene environments. Simple optical examination is insufficient for selecting molybdenite which is suitable for dating. Polytype and Re measurements alone are also insufficient because molybdenite can experience Re loss without significant polytype shift, and will plot in the primary crystallization Re-3R regions defined by NEWBERRY ( 1979b; Fig. 2a). Combined microprobe, XRD, BSE, and infrared microscopy can be successfully used to detect alter- ation in molybdenite prior to dating. Some molybdenites that have been dated give correct or erroneous ages, and their reliability was successfully predicted prior to dating. These techniques are nondestructive and should be performed be- fore any molybdenite is dated by the Re-0s system.
Acknowledgments-The success of this study relied heavily on access to samples and geological expertise freely offered to us by the following individuals: S. Anzelone ( Asarco-Silver Bell): J. R. Bowman (Uni- versity of Utah); P. Blacet, J. Hawley, C. Schmitz (Cyprus-Bagdad); R. Ganster (Climax-Henderson); R. A. Koski, R. Kamilli (USGS); J. Low ( Asarco-Mission-Pima); S. Poroulous (G. E. M.-Gravelotte); R. Preece, T. Weiskopf (Phelps Dodge-Morenci); D. L. Reid (Uni- versity of Cape Town); L. A. Sandback (Magma-San Manuel); E. Seedorlf ( Magma-Ely); J. Thomas (Phelps Dodge-Ajo); G. Veach (Mineral Park); and colleagues, J. Guthrie, B. Ilchik, J. R. Lang, P. K. M. Megaw, C. J. Northrup, R. Williamson, W. Wodzicki, and M. Young. Some samples were obtained during University of Arizona
SEC Student Chapter #2 field trips, for which Dr. J. M. Guilbert is thanked for organizing. R. S. Rickard is thanked for meticulous com- parative analyses of Re on the Cameca Camebax at UCT. Thanks to W. Bilodeau for assistance with XRD analysis. T. Teska is thanked for assistance on the Cameca SX-50. The Cameca SX-50 and TS- Sola ICP-MS were purchased with funds from the Keck Foundation. Comments by G. Pearson and two anonymous reviewers greatly im- proved the manuscript. This research was supported by NSF grant EAR-90123123.
Editorial handling: A. N. Halliday
REFERENCES
BERNARD A., SYMONDS R. B., and ROSE, W. I., JR. ( 1990) Volatile transport and deposition of MO, W, and Re in high temperature magmatic fluids. Appl. Geochem. 5, 3 17-326.
J~OWLES M. ( 1988) Tungsten mineralization in the Namaqualand- Bushmanland region, northwestern Cape, South Africa. Geol. Sac. of S. Afr. Mem. 74, p. 25.
BOWMAN J. R., PARRY W. T., KROPP W. P., and KRUER S. A. ( 1987) Chemical and isotopic evolution of hydrothermal solutions at Bingham, Utah. Econ. Geol. 82, 395-428.
BOYKO T. F. and MILLER A. D. ( 1980) Behavior of rhenium during weathering of igneous rocks. Geokhimiya 5,773-777.
BROOKINS D. G. ( 1986) Rhenium as analog for fissiogenic techne- tium: Eh-pH diagram (25°C 1 bar) constraints. Appl. Geochem. 1,513-517.
BROOKINS D. G. ( 1987) Platinoid element Eh-pH diagrams (25°C 1 bar) in the systems M-O-H-S with geochemical applications. Chem. Geol. 64, 17-24.
CAMPBELL A. R. ( 199 1) Geologic applications of infrared microscopy. In Luminescence Microscopy and Spectroscopy: Qualitative and Quantitative Applications (eds. C. E. BARKER and 0. C. KOPP); SEPM Short Course Notes 25, 16 I- 17 1.
CAMPBELL A. R., HACKBARTH C. J., PLUMLEE G. S., and PETERSEN U. ( 1984) Internal features of ore minerals seen with the infrared microscope. Econ. Geol. 19, 1387-1392.
CARPENTER R. H. ( 1968) Geology and ore deposits of the Questa molybdenum mine area, Taos County, New Mexico. In Ore De- posits ofthe United States, 1933-1967, Vol. I1 (ed. J. D. RIDGE); AIME, pp. 1328-1350.
CARTEN R. B., GERAGHTY E. P., WALKER B. M., and SHANNON J. R. ( 1988) Cyclical development of igneous features and their relationship to high-temperature hydrothermal features in the Henderson porphyry molybdenum deposit, Colorado. Econ. Geol. 83,266-296.
CREASEY S. C. and KISTLER R. ( 1962) Age of some copper-bearing porphyries and other igneous rocks in southeastern Arizona. USGS Prof: Pap. 450-D, D 1 -D5.
DAMON P. E. ( 1970) New K-Ar dates for the southern Basin and Range Province. Ann. Prog. Rpt. Res. Div., U.S. Atomic Energy Comm., 38.
EINAUDI M. T. and BURT D. M. ( 1982) Introduction-terminology, classification, and composition of skarn deposits. Econ. Geol. 77. 745-754.
EINAUDI M. T., MEINERT L. D., and NEWBERRY R. J. ( 198 1) Skam deposits. Econ. Geol. (Seventy-Fifth Ann. Vol.), pp. 3 17-39 1.
EK~TR~M M. and HALENIUS U. ( 1982) A new rhenium-rich sulphide from two Swedish localities. Neues Jahrb. Mineral. 1, 6-10.
EMMONS W. H. ( 1933) Recent progress in studies of supergene en- richment. In Ore Deposits of the Western States (ed. J. W. FINCH); AIME, pp. 386-418.
FILIMONOVA L. Y., ZHUKOV N. M., and MALAYAAVKA A. G. ( 1984) Genetic aspects of polytypism and rhenium contents of molyb- denite in porphyry copper deposits. Geokhimya, 7,1040-1046 (in Russian).
FLEISCHER M. ( 1959) The geochemistry of rhenium, with special reference to its occurrence in molybdenite. Econ. Geol. 54, 1406- 1413.
FLEI~CHER M. ( 1960) The geochemistry of rhenium-Addendum. Econ. Geol. 55, 607-609.
FRONDEL J. W. and WICKMAN F. E. ( 1970) Molybdenite polytypes
902 T. E. McCandless, J. Ruiz, and A. R. Campbell
in theory and occurrence, II. Some naturally-occurring polytypes of molybdenite. Amer. Mineral. 55, 1857-1875.
GABELMAN J. W. ( 1990) New rhenium-mineral microlites in a por- phyry copper deposit. Explore 68, 9-12.
GARREL~ R. M. and CHRIST C. L. ( 1965 ) Solutions, Minerals, and Equilibria. Freeman, Cooper & Co.
GILES D. L. and SCHILLING J. M. ( 1972) Variation in rhenium con- tent of molybdenite. Twenty-fourth Intl. Geol. Cong. Sect. 10, 145- 152.
GU~HRIE J. G. and MOORE D. G. ( 1978) The geology ofthe Copper Creek area, Bunker Hill mining district, Galiuro Mountains, Ar- izona. Arizona Geol. Sot. Digest 11, 25-3 1.
HAGSTRUM J. T., Cox D. P., and MILLER R. J. ( 1987) Structural reinterpretation of the Ajo Mining District, Pima County, Arizona, based on paleomagnetic and geochronologic studies. Econ. Geol. 82, 1348-1361.
HANSULD J. A. ( 1966) Behavior of molybdenum in secondary dis- persion media-A new look at an old geochemical puzzle. Mineral. Eng., 73-77.
HAYS R. C., JR., and FOO S. T. ( 199 1) Geology and mineralization of the Gold Acres deposit, Lander County, Nevada. In Geology and Ore Deposits of the Great Basin (ed. G. L. RAINES et al.), pp. 677-685. Geol. Sot. Nevada.
HERR W. and MERZ E. ( 1955) Eine neue Methode zur Alterbestim- mung von Rhenium-haltigen Mineralien mittels Neutronenakti- vierung. Z. Naturforsch. lOa, 613-615.
HERR W. and MERZ E. ( 1958) Zur Bestimmung der Halbwertszeit des “‘Re. Z. Naturforsch. 13a, 231-233.
HIRT B., HERR W.. and HOFFXIEISTER W. ( 1963) Age determination by the rhenium-osmium method. Inti. Atom. Energy Agency, Ra- dioactive Dating, 35-44.
ISHIHARA S. ( 1988) Rhenium contents of molybdenites in granitoid- series rocks in Japan. Econ. Geol. 83, 1047-105 1.
ISHIHARA S., SHIBATA K., and UCHIUM~ S. ( 1989) K-Ar age of mo- lybdenum mineralization in the east-central Kitakami Mountains, northern Honshu, Japan: Comparison with the Re-0s age. Geo- them. J. 23,85-89.
JAMIESON R. T. and SCHREINER G. D. L. ( 1957) The ages of some African lepidolites determined from the “Rb-“Sr decay. Proc. Roy. Sot. B. 146,257-269.
KISTLER R. W., GHENT E. D., and O’NEIL J. R. ( 198 1) Petrogenesis of two-mica granites in the Ruby Mountains, Nevada. J. Geophys Res. 86, 10,591-10,608.
KOSKI R. A. ( 198 1) Rhenium and other trace elements in molyb- denite from the Christmas mine area, Gila County, Arizona. USGS Open File Rept. 81-154.
KOSKI R. A. and COOK D. S. ( 1982) Geology of the Christmas por- phyry copper deposit: Gila County, Arizona. In Advances in Geol- ogy of the Porphyry Copper Deposits, Southwestern North America (ed. S. R. TITLEY), pp. 353-373. University of Arizona Press.
KOVALENKER V. A., LAPUTINA 1. P., and VYAL~OV L. N. ( 1974) Rhenium-rich molybdenite from the Talnakh copper-nickel deposit (Noril’sk region). Dokl. Akad. Nauk SSSR 217, 104-106.
LANG J. R. ( 199 1) Isotopic and geochemical characteristics of Lar- amide igneous rocks in Arizona. Ph.D. dissertation, Univ. of Ar- izona.
LANG J. R. and EASTOE C. J. ( 1988) Relationships between a por- phyry Cu-MO deposit, base and precious metal veins, and Laramide intrusions, Mineral Park, Arizona. Econ. Geol. 83, 55 l-567.
LANGTON J. M. ( 1973) Ore genesis in the Morenci-Metcalf District. SME Trans. 254,247-257.
LINDGREN W. ( 1933) Mineral Deposits. McGraw-Hill. LINDNER M., LEICH D. A., Russ G. P., BAZAN J. M., and BORG
R. J. ( 1989) Direct determination ofthe half-life of “‘Re. Geochim. Cosmochim. Acta 53, 1597- 1606.
LIPMAN P. W. and SAWYER D. A. ( 1985) Mesozoic ash-flow caldera fragments in southeastern Arizona and their relation to porphyry copper deposits. Geol. 13, 652-656.
LOWELL J. D. and GUILBERT J. M. ( 1970) Lateral and vertical al- teration-mineralization zoning in porphyry ore deposits. Econ. Geol. 65, 373-408.
LUCK J.-M. and ALLZGRE C. J. ( 1982) The study of molybdenites
through the “‘Re- ‘s70s chronometer. Earth Planet. Sci. Lett. 61, 291-296.
LUCK J.-M., HAXEL G., and THEODORE T. G. ( 1983) Study of mo- lybdenites from western North America using rhenium ( ls7Re)- osmium( “‘OS) geochronometry: Unexpected old ages. Eos 64, 334 (abstr.)
MCKEE E. H. and KOSKI R. A. ( 198 1) K-Ar ages for igneous rocks and vein minerals from the Christmas Mine area, Arizona. Zso- chron/ West 32, 7- 11.
MEDHI P. K. ( 1978) Recent geological developments at the Bagdad porphyry copper deposits, Eureka mining district, Yavapai County, Arizona. Arizona Geol. Sot. Digest 11, 79 (abstr.).
MITCHELL R. H., LAFLAMME J. H. G., and CABRI L. J. ( 1989) Rhe- nium sulphide from the Coldwell complex, northwestern Ontario, Canada. Mineral. Mag. 53, 635-637.
MORACHEVSKII D. E. and NECHAEVA A. A. ( 1960) Characteristics of migration of rhenium from molybdenites. Geochem. 6, 648- 651.
MORGAN J. W. and WALKER R. J. ( 1989) Isotopic determinations of rhenium and osmium in meteorites by using fusion, distillation and ion-exchange separations. Anal. Chim. Acta 222,291-300.
MORGAN J. W., LOVERING J. F., and FORD R. J. (1968) Rhenium and non-radiogenic osmium in Australian molybdenites and other sulphide minerals by neutron activation analysis. J. Geol. Sot. Australia 15, 189-194.
NASH, J. T. ( 1972) Fluid inclusion studies of some gold deposits in Nevada. USGS. Prot: Pao. 800-C. Cl 5-C19.
NEWBERRY R. J. ( 19j9a) Polytypism in molybdenites (I): A non- equilibrium impurity-induced phenomenon. Amer. Mineral. 64, 758-768.
NEWBERRY R. J. ( 1979b) Polytypism in molybdenite (II): Rela- tionships between polytypism, ore deposition/alteration stages and rhenium contents. Amer. Mineral. 64, 768-775.
NIELSEN R. L. ( 1968) Hypogene texture and mineral zoning in a copper-bearing granodiorite porphyry stock, Santa Rita, New Mexico. Econ. Geol. 63, 37-50.
REID D. L. ( 1979) Age relationships within the mid-Protenoic Vioolsdrif batholith, lower Orange River region. Trans. Geol. Sot. South Africa 82, 305-3 11.
PHILLIPS C. H., GAMBELL N. A., and FOUNTAIN D. S. (1974) Hy- drothermal alteration, mineralization, and zoning in the Ray De- posit. Econ. Geol. 69, 1237-12.50.
PREECE R. K. III. and BEANE R. E. ( 1982) Contrasting evolutions of hydrothermal alteration in quartz monzonite and quartz diorite wall rocks at the Sierrita porphyry copper deposit, Arizona. Econ. Geol. 77, 1621-1641.
REID D. L. ( 1982) Age relationships within the Vioolsdrif batholith, lower Orange River region II. A two stage emplacement history and the extent of Kibaran overprinting. Trans. Geol. Sot. South Africa 85, 105-I 10.
REID D. L., WELKE H. J., ERLANK A. J., and MOYES A. ( 1987) The Orange River Group: A major Proterzoic calcalkaline volcanic belt in the western Namaqua Province, southern Africa. In Geo- chemistry and Mineralization of Proterozoic Volcanic Suites (ed. T. C. PHARAOH et al.); Geol. Sot. Soec. Publ. 33. 327-346. Blackie & Sons.
RICHARD K. and COURTRIGHT J. H. ( 1966) Structure and miner- alization at Silver Bell, Arizona. In Geology of the Porphyry Copper Deposits, Southwestern North America (ed. S. R. TITLEY and C. L. HICKS), pp. 175-163. University of Arizona Press.
RILEY G. H. ( 1967) Rhenium concentration in Australian molyb- denites by stable isotope dilution. Geochim. Cosmochim. Acta 31, 1489-1497.
ROBB L. J. and ROBB V. M. ( 1986) Archaean pegmatite deposits in the northeastern Transvaal. In Mineral Deposits of Southern Africa (ed. C. R. ANHAEUSSER and S. MASKE); Geol. Sot. South Africa., 437-449.
ROE R. R. ( 1976) Geology and mineralization of the Squaw Peak porphyry deposit. M. S. thesis, University of Arizona.
RUBIN J. N. and KYLE J. R. ( 1988) Mineralogy and geochemistry of the San Martin skarn deposit, Zacatecas, Mexico. Econ. Geol. 83, 1782-1801.

Geochemistry of Re in molybdenite 903
SARP H., BERTRAND J., DEFERN J., and LIEBICH B. W. ( 1981) A complex rhenium-rich titanium and iron oxide of the crichtonite- senaite group. Neues Jahrb. Mineral. 10, 433-442.
SATO M. ( 1960) Oxidation of sulphide ore bodies. I: geochemical environments in terms of Eh and pH. Econ. Geol. 55,928-96 1.
SATO M. ( 1992) Persistency-field Eh-pH diagrams for sulfides and their application to supergene oxidation and enrichment of sulfide ore bodies. Geochim. Cosrnochim. Acta, 56,3 133-3 156.
SHAFIQULLAH M., DAMON P. E., LYNCH D. J., REYNOLDS S. J., REHRIG W. A., and RAYMOND R. H. ( 1980) K-Ar geochronology and geologic history of southwestern Arizona and adjacent areas. Arizona Geol. Sot. Dig. 12, 20 I-260.
SHUEY R. T. ( 1975 ) Semiconducting ore minerals: Dev. Econ. Geol. Ser. 4. Elsevier.
TARK~AN M., HOUSLEY R. M., VOLBORTH A., GREIS O., and MOH G. H. ( 1991) Unnamed Re-Mo-Cu sulfide from the Stillwater complex, and crystal chemistry of its synthetic equivalent spine1 type (Cu,Fe) (Re,Mo)&. Eur. J. Mineral. 3,977-982.
TAYLOR R. P. and FRYER B. J. ( 1983) Strontium isotope geochem- istry of the Santa Rita porphyry copper deposit, New Mexico. Econ. Geol. 78, 170-174.
TITLEY S. R. ( 1963) Some behavioral aspects of molybdenum in the supergene environment. Sot. Min. Eng. Trans. 226, 199-204.
TITLEY S. R. ( 1982) The stvle and progress of mineralization and alteration in porphyry copper systems. In Advances in Geology of the Porphyty Copper Deposits, Southwestern North America (ed. S. R. TITLEY ), pp. 353-373. University of Arizona Press.
TITLEY S. R. and ANTHONY J. W. ( 196 1) Some preliminary obser- vations on the theoretical geochemistry of molybdenum under supergene conditions. Arizona Geol. Sot. Digest 4, 103-I 16.
VIUOEN R. P., MINNITT R. C. A., and VILJOEN M. J. ( 1986) Porphyry
copper-molybdenum mineralization at the Lorelei, South West Africa/Namibia. In Mineral Deposits of Southern Africa (ed. C. R. ANHAEUSSER and S. MASKE); Geol. Sot. South Ajkica, 1559- 1565.
VINOGRADOV V. I. ( 1957a) On the migration of the molybdenum in the supergene zone. Geoch. 2, 144- 15 1.
VINOGRADOV V. I. ( 1957b) Solubility of the secondary molybdenum minerals in the weak solutions of HzS04 and NazCOs . Geoch. 2, 279-286.
VOLBORTH A. (1985) Informal description of Pt ore, Stillwater Complex, Montana. Geotimes 30, 1.
WATANABE M. and SOEDA A. ( 198 1) Distribution of polytype con- tents of molybdenites from Japan and possible controlling factor in polytypism. Neues. Jahrb. Mineral. 141, 258-279.
WESTRA G. ( 1982) Alteration and mineralization in the Ruth por- phyry copper deposit near Ely, Nevada. Econ. Geol. 77,950-970.
WEUNSCH B. J. ( 1974) Sulfide crystal chemistry. In Surfide Miner- alogy (ed. P. H. RIBBE); Mineral. Sot. Amer. Short Course Notes, Vol. 1, W21-W43.
WICKMAN F. E. and SMITH D. K. ( 1970) Molybdenite polytypes in theory and occurrence. I. Theoretical considerations of polytypism in molybdenite. Amer. Mineral. 55, 1843- 1856.
WILSON J. A. and YOFFE A. D. ( 1969) The transition metal dichal- cogenides: Discussion and interpretation of the observed optical, electrical, and structural properties. Adv. Phys. 18, 194-325.
WODZICKI W. A. ( 1992) The Maria deposit, Sonora, Mexico: A tele- scoped porphyry system. M. S. thesis, UCLA.
ZELIKMAN A. N., CHRISTYAKOV Y. D., IDENBAUM G. V., and KREIN 0. E. ( 1969) Structural transformation in synthetic MO&. Sov. Phys-Crystallogr. 14, 687-691.
904 T. E. McCandless, J. Ruiz, and A. R. Campbell
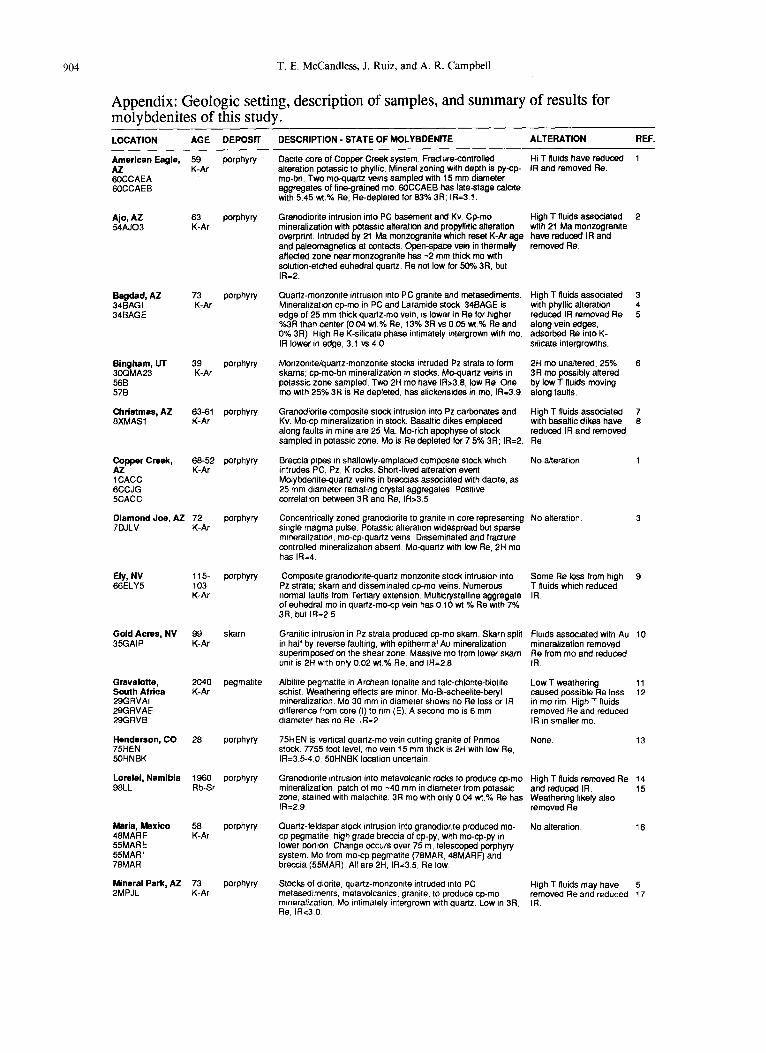
Appendix: Geologic setting, description of samples, and summary of results for molvbdenites of this studv.
LOCATION AGE DEPOSlT DESCRIPTION - STATE OF MOLYBDENITE ALTERATION REF.
Oacite core of Copper Creek system. Fracture-controlled alteration potassic to phyllic. Mineral zonmg with depth is py-cp mo-bn Two moquartz veins sampled with 15 mm diameter aggregates of linegramed mo. 6OCCAEB has late-stage calcite with 5.45 wt.% Ae. Re-depleted for 63% 3R; IR=3 1.
HI T fluids have reduced IR and removed Re.
Granodiorite intrusion into PC basement and Kv. Cp-mo mineralization with potassic alteration and propyllttic alteration overprint. Intruded by 21 Ma monzogranite which reset K-Ar age and paleomagnetics at contacts. Open-space vein in thermally affected zone near monzogranite has -2 mm thick mo with solution-etched euhadral quartz. Re not low for 50% 3R. but IR=2.
High T fluids associated with 21 Ma monzogranite have reduced IR and removed Re.
Quartz-monzonke intrusion into PC granite and metasediments. High T flutds associated Mmeraftzatron cp-mo In PC and Laramrde stock 34BAGE is with phyllic alteratton edge of 25 mm thick quartz-m0 warn, is lower in Re for hrgher reduced IR removed Re %3R than center (0.04 wt.% Re. 13% 3R vs 0.05 wt % Re and along vein edges, 0% 3R) High Re K-stkcate phase intimately intergrown wth mo. adsorbed Re into K- IR lower in edge, 3 1 vs 4.0 siltcate intergrowths
Monzonrtelquanz-monzonite stocks intruded Pz strata to form skarns; cp-mo-bn mineralization in stocks. MO-quartz vests in potassic zone sampled. Two 2H mo have IR>3 6, low Re. One mo with 25% 3R is Re depleted, has slickensides in mo, IRz3.9.
2H mo unaltered, 25% 3R mo possibly altered by low T fluids moving along faults.
Granodiorite composrte stock intrusion mto Pz carbonates and Kv. MO-cp mineralization in stock. Basaltic dikes emplaced along faults in mine are 25 Ma. MO-rich apophyse of stock sampled in potassic zone. MO is Re depleted for 7 5% 3R; IR=2.
High T fluids associated with basaltic d&es have reduced IR and removed Re
Breccta popes m shallowly-emplaced composite stock which Intrudes PC, Pz, K rocks Short-lived aiteration event Molybdenrte-quartz veins in breccias associated with dacite. as 25 mm diameter radtatmg crystal aggregates Posrtive correlatron between 3R and Re, IR>3 5
No alteration
1
2
3 4 5
6
7 6
1
No alteratton 3
Some Re loss from high T fluids which reduced IR
9
Gramtic rntrusion in Pz strata produced cp-mo skarn. Skarn split Fluids associated with Au in half by reverse faulting. with epithermal Au mineralization mineralization removad superimposed on the shear zone Massive mo from lower skarn Re from mo and reduced umt IS 2H wrth only 0 02 wt.% Re. and IFI=2 6 IR
10
Albittte pegmatite in Archean tonalile and talc-chlorite-biotite Low T weathering schist. Weathering effects are minor. Mo-Br-scheelite-beryl mineralization MO 30 mm in drameter shows no Re loss or IA
caused possrble Re loss m mo rim. Hugh T flurds
difference from core (I) to nm (E) A second mo is 6 mm removed Re and reduced dtameter has no Re, IR=2 IR rn smaller mo
11 12
None 13
Granodtonte mtrusion Into metavolcanic rocks to produce cp-mo High T flurds removed Re mineralization oatch of mo -40 mm tn diameter from ootassic zone, stained wih malachrte. 3R mo with only 0 04 wt:% Re has
and reduced IR. Weathering likely also
IR=2 9 removed Re
14 15
No alteration 16
High T fluids may have removed Re and reduced IR
5 17
American Eagle, AZ GOCCAEA 6OCCAEB
59 K-Ar
porphyry
Ajo, AZ 63 porphyry 54AJo3 K-Ar
Bagdad, AZ 34BAGI 34BAGE
73 Porphyry K-AI
Bingham, UT 3OQMA23 568 570
Christmas, AZ 6XMASl
39 wwhw K-Ar
:A? porphyry
copper creek, AZ 1 CACC GCCJG 5CACC
Concentncally zoned granodtorite to granrte m core representing stnole maoma oulse. Potassic alteranon wrdesoread but soarse mrieraliz&on,‘mo-cp-quartz veins Disseminated and fracture controlled mineralization absent. MO-quartz Hnth low Re, 2H mo has IR=4.
Diamond Joe, AZ 72 porphyry 7DJLV K-Ar
Composite granodlortte-quartz monzonite stock intrusion mto Pz strata; skarn and dissemtnated cp-mo veins. Numerous normal faults from Ternary extension Multicrystalline aggregate of euhedral mo in quartz-mo-cp vein has 0 10 wt % Re with 7% 3R, but IR=2 5
Ely, NV 66ELY5
115- porphyry 103 K-Ar
Gold Acres, NV 99 skarn 35GAIP K-Ar
Gravelotte, South Africa 29GRVAI 29GRVAE 29GRVB
Henderson, CO 75HEN 50HNBK
Lorelel, Namibia 98LL
2040 pegmatrte K-Ar
75HEN IS verncal quartz-m0 vern cutting granrte of Pnmos stock. 7755 foot level, mo vem 15 mm thick 1s 2H wrth low Re. lR=3.5-4 0 50HNRK loCation uncertain
26 porphyry
Quartz-feldspar stock intrusion into granodionte produced mo- cp pegmatite. high grade breccia of cp-py. with mo-cp-py in lower portron. Change occurs over 75 m, telescoped porphyry system MO from mo-cp pegmatite (76MAR. 46MARF) and breccia (55MAR) All are 2H, IR=3.5, Re low
Stocks of dtorite. quartz-monzonrte intruded into PC metasediments, metavolcanrcs. granite, to produce cp-mo mrneralization MO mtrmately intergrown wtth quartz Low m 3R, Re. IRc3 0
Maria, Mexico 48MARF 55MARE 55MARI 7EMAR
56 porphyry K-Ar
Mineral Park, AZ 73 PMPJL K-Ar
porphyry
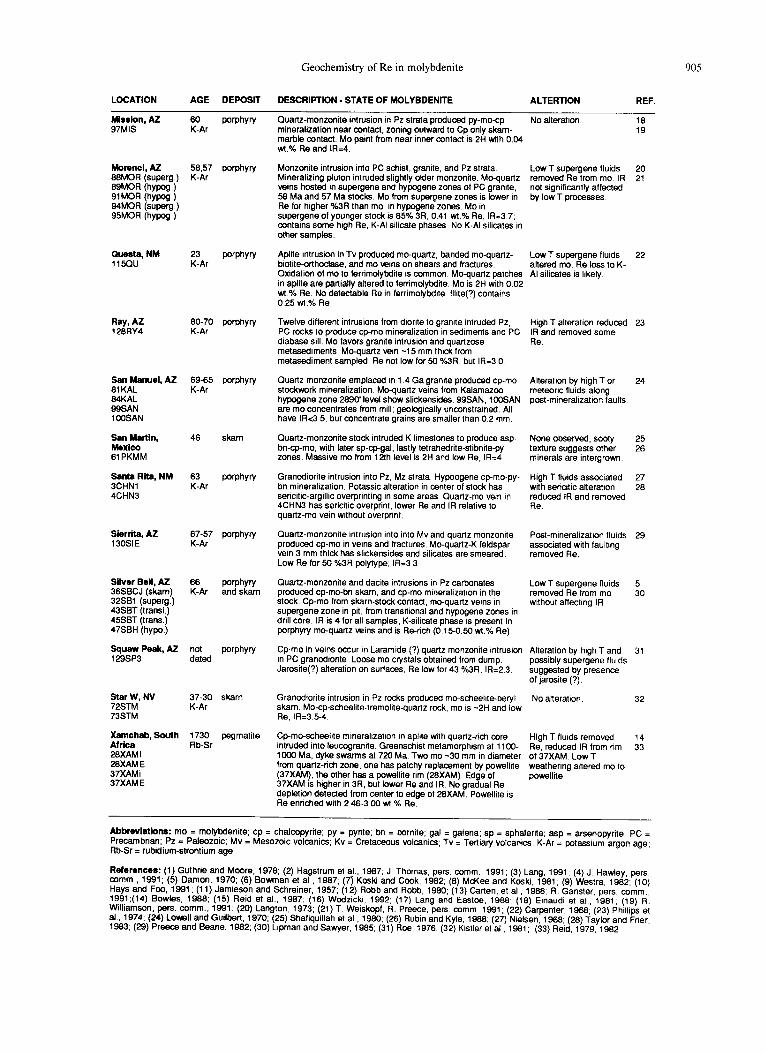
Geochemistry of Re in molybdenite 905
LOCATION AGE DEPOSIT DESCRIPTfDN - STATE OF MDLYBDENfTE ALTERTION REF.
Mirsion, AZ 80
97MIS K-Ar mWw
Morenci, AZ WMOR (superg.) 69MGR (hypog ) 91 MOR (hypog ) 94MOR (superg.) 95MOR (hypog )
GuaMa, NM 23 115Qu K-Ar
Ray, AZ 80-70 porphyry 128RY4 K-Ar
San Manuel, AZ 81 KAL 84KAL 9gSAN 1 OOSAN
San Martin, Mexico 81 PKMM
;;;;,Rita, NM
4CHN3
Siirrita, AZ 87-57 porphyry 130SIE K-Ar
Silver Ball, AZ 38SBCJ (skarn) 32SBl (superg.) 43SBT (transi.) 45SBT (trans.) 47SBH (hype)
Star W, NV 72STM 73STM
rfr7 porphyry
porphyry
48 skarn
83 K-Ar
porphyry
88 w-WY K-Ar and skarn
not porphyry dated
37-30 skarn K-Ar
Xamchab, South 1730 pegmatite Africa Rb-Sr 28XAMI 28XAM E 37XAMi 37XAME
Quartz-monzonfle mtrusion tn Pz strata produced py-mo-cp mineralization near contact, zoning outward to Cp only skam- marble contact. MO paint lrom near inner contact is 2H with 0.04 wl.% Re and IR=4
Monzonite intrusion Into PC schist, granite, and Pz strata Mineralizing pluton intruded slightly older monzonite MO-quartz veins hosted in supergene and hypogene zones of PC granite, 58 Ma and 57 Ma stocks MO from supergene zones is lower in Re for higher %3R than mo in hypogene zones. MO in supergene 01 younger stock IS 85% 3R, 0.41 wt.% Re, IR=3 7; contains some htgh Re. K-AI silicate phases No K-AI silicates m other samples.
Aplite intrusion in TV produced mo-quartz, banded mo-quartz- biotite-orthoclase. and mo veins on shears and fractures. Oxidation of mo to lerrfmolybdfte IS common. MO-quartz patches in aplite are pantally altered to ferrimolybdite MO is 2H with 0.02 wt.% Re. No detectable Rein ferrimolybdtte llltte(7) contains 0.25 wt.% Re
Twelve different intrusions from dionte to gramte Intruded Pz, PC rocks to produce cp-mo mtneralization in sediments and PC diabase sill. MO lavors granite intrusion and quartzose metasediments. f&quartz vem -15 mm thtck from metasediment sampled Re not low for 50 %3R, but IR=3 0
Quartz monzonite emplaced In 1 4 Ga granite produced cp-mo stockwork mmeralization. Mo-quartz veins from Kalamazoo hypogene zone 2890’ level show slickenstdes 99SAN. ICOSAN are mo concentrates lrom mill; geologically unconstrained All have IRc3.5, but concentrate grains are smaller than 0 2 mm.
Quartz-monzonite stock intruded K limestones to produce asp- bn-cpmo, with later sp-cp-gal, lastly tetrahedrite-stibnite-py zones Massive mo from 12th level is 2H and low Re. IR=4
Granodionte intrusion into Pz, Mz strata Hypoogene cp-mo-py- bn mineralization. Potassic alteration in center of stock has sencitic-argillic overprinting in some areas Quartz-m0 vein In 4CHN3 has sericitic overprint, lower Re and IR relative to quartz-m0 vein without overprint.
Quartz-monzomte intrusion into into Mv and quartz monzomte produced cp-mo in veins and fractures. MO-quartz-K leldspar vein 3 mm thick has slickanstdes and silicates are smeared Low Re for 50 %3R polytype; IR=3 3
Quartz-monzonite and dactte intrusfons in Pz carbonates produced cp-mo-bn skarn. and cp-mo mmeraltzatton m the stock. Co-mo from r&am-stock contact mo-auanz veins tn supergene zone in pit, from transitionai and hypogene zones fn drill core. IR is 4 for all samples, K-silicate phase is present in porphyry mo-quartz veins and is Re-rich (0 15-0.50 wt.% Re)
Cp-mo in veins occur in Laramtde (?) quartz monzonite Intrusion m PC granodtonte. Loose mo crystals obtained from dump. Jarosite(?) alteration on surfaces Re low for 43 %3R, IR=2.3
Granodtonte intrusion In Pz rocks produced mo-scheeltte-baryl skarn. Mo-cp-scheelite-tremoltte-quartz rock, mo IS -2H and low Re. lR=3.5-4
Cp-mo-scheelite mmeraltzatton tn aplite with quartz-rich core intruded into leucogranite. Greenschist metamorphtsm at 1 IOO- 1000 Ma, dyke swarms at 726 Ma. Two mo -30 mm in diameter from quartz-rich zone, one has patchy replacement by powellite (37XAM). the other has a powellite rim (28XAM). Edge of 37XAM is higher in 3R, but lower Re and IR. No gradual Re depletion detected from center to edge of 28XAM. Powelkte IS Re enriched with 2.48300 wl % Re.
No alteration
Low T supergene fluids removed Re from mo IR not significantly affected by low T processes
Low T supergene fluids altered mo Re loss to K- Al silicates is likely
High T alteration reduced IR and removed some Re
Alteration by high T or meteonc fluids along oost-mineraltzahon faults
None ObSeNed. sooty texture suggests other minerals are intergrown
High T fluids associated with sericitic afteratton reduced IR and removed Re
Post-mineralizauon fluids associated with faultmg removed Re.
Low T supergene fluids removed Re from mo without affectmg IR.
Alteration by htgh T and possibly supergene flulds suggested by presence of jarostte (?)
31
No alteratton 32
Hlgh T flutds removed Re, reduced IR from rim of 37XAM Low T weathering aftered mo to powellite
18 19
20 21
22
23
24
25 28
27 28
29
5 30
AbbfWiatiOlt3: m0 = molybdenite, Cp = chalcopyrite; py = pyrite; bn = bornite; gal = galena; sp = sphalerite; asp = arsenopyrfte, pc = Precambrian; PZ = Paleozoic; Mv = Mesozotc vokanics; Kv = Cretaceous volcanics; TV = Terfialy volcanics K-Ar = potassium argon age: Rb-Sr = rubidium-strontium age
Referencea: (1) Guthrie and Moore, 1978; (2) Hagstrum et al., 1987; J. Thomas, pers. comm 1991; (3) Lang, 1991; (4) J Hawley. pers comm., 1991; (5) Damon, 1970; (8) Bowman et al., 1987, (7) Koski and Cook, 1982; (8) McKee and Koski. 1981; (9) Westra, 1962; (10) Hays and Foo, 1991 : (11) Jamteson and Schreiner. 1957; (12) Robb and Robb, 1980, (13) Carten. et al.. 1988, R. Ganster. pers. comm 1991;(14) Bowles, 1968; (15) Reid et al., 1987: (16) Wodzickt, 1992; (17) Lang and Eestoe, 1966, (16) Einaudi et al., 1961; (19) R: Williamson. pers comm., 1991; (20) Langton, 1973; (21) T. Weiskopf, R. Preece. pers. comm 1991, (22) Carpenter, 1968; (23) Philltps et al.. 1974; (24) Lowell and Gutlbert 1970; (25) Shafiquillah et al , 1980; (26) Rubin and Kyle, 1988; (27) Nielsen, 1988; (28) Taylor and Fner. 1983; (29) Preece and Beane. 1962; (30) Lipman and Sawyer, 1985, (31) Roe, 1978; (32) Kistler et al 1981; (33) Rend, 1979. 1962