Embed Size (px)
Citation preview
1SCiEntiFiC REPORtS | 7: 16054 | DOI:10.1038/s41598-017-16380-8
www.nature.com/scientificreports
Dissecting the Re-Os molybdenite geochronometerFernando Barra1, Artur Deditius2, Martin Reich1, Matt R. Kilburn 3, Paul Guagliardo3 & Malcolm P. Roberts3
Rhenium and osmium isotopes have been used for decades to date the formation of molybdenite (MoS2), a common mineral in ore deposits and the world’s main source of molybdenum and rhenium. Understanding the distribution of parent 187Re and radiogenic daughter 187Os isotopes in molybdenite is critical in interpreting isotopic measurements because it can compromise the accurate determination and interpretation of mineralization ages. In order to resolve the controls on the distribution of these elements, chemical and isotope mapping of MoS2 grains from representative porphyry copper-molybdenum deposits were performed using electron microprobe and nano-scale secondary ion mass spectrometry. Our results show a heterogeneous distribution of 185,187Re and 192Os isotopes in MoS2, and that both 187Re and 187Os isotopes are not decoupled as previously thought. We conclude that Re and Os are structurally bound or present as nanoparticles in or next to molybdenite grains, recording a complex formation history and hindering the use of microbeam techniques for Re-Os molybdenite dating. Our study opens new avenues to explore the effects of isotope nuggeting in geochronometers.
Ore deposits are the main source of metals for society, and their efficient and sustainable exploration requires a precise understanding of the factors that control their distribution within the upper crust. Application of the Re-Os isotopic system has revolutionized ore deposit research since the 1990’s by addressing two of the most critical issues in the development of genetic models and strategic exploration plans: the source of metals and the age of mineralization1–5.
Rhenium 187 is radioactive and decays to radiogenic 187Os by beta emission. The Re-Os system follows the law of radioactivity where the total number of 187Os atoms in the sample at the present time is equal to the num-ber of atoms of 187Os incorporated in the sample at the time of mineral formation and the 187Os atoms produced by decay of the 187Re parent radionuclide. Due to their chalcophile affinity and behavior during partial melting of the mantle, Re and Os will be concentrated in sulphide phases usually at low ppb and ppt levels, respectively. However, molybdenite (MoS2) the most common molybdenum ore mineral constitutes a particular case within sulphide minerals because it contains high Re (in the ppm range) and 187Os (at ppb levels), but almost no initial or common 187Os, hence all 187Os in molybdenite is of radiogenic origin (i.e. produced from decay of 187Re)1,2,5. These unique characteristics explain why Re-Os molybdenite dating using the whole mineral approach is currently the most widely used single mineral geochronometer in ore deposits, where reliable crystallization ages have been obtained by the direct measurement of 187Re and 187Os concentrations in the mineral. Although the potential of molybdenite as a single-mineral geochronometer was recognized years ago6,7, initial studies were hampered by spurious ages that were interpreted as open system behavior of the isotopic system8,9. Furthermore, some researchers have suggested that 187Re and 187Os isotopes are not spatially linked at the micro-scale in molybdenite precluding the use of microbeam methods for Re-Os dating10–12. It has been argued that this isotopic decoupling of Re and Os is caused by radiogenic 187Os diffusion which may accumulate in crystal deformation sites11. Hence, to obtain accurate and reliable ages, whole molybdenite crystals should be analyzed in order to overcome the inferred decoupling11,12.
Here we investigate the distribution of Re and Os in molybdenite, the degree of isotopic and chemical zoning of these elements, the formation of Re-, Os-rich domains and particles in or next to molybdenite, and the pro-cesses responsible for intracrystalline/intragrain fractionation. Understanding the controls on Re and Os isotope
1Department of Geology and Andean Geothermal Center of Excellence (CEGA), FCFM, Universidad de Chile, Plaza Ercilla 803, Santiago, Chile. 2School of Engineering and Information Technology, Murdoch University, 90 South Street, Murdoch, Western Australia, 6150, Australia. 3Centre for Microscopy, Characterisation and Analysis, The University of Western Australia, 35 Stirling Highway, Perth, Western Australia, 6009, Australia. Correspondence and requests for materials should be addressed to F.B. (email: [email protected])
Received: 15 September 2017
Accepted: 6 November 2017
Published: xx xx xxxx
OPEN
www.nature.com/scientificreports/
2SCiEntiFiC REPORtS | 7: 16054 | DOI:10.1038/s41598-017-16380-8
distribution is critical in interpreting the accuracy of isotopic measurements, and thus explain spurious Re-Os ages obtained by microbeam techniques.
To understand the mineralogical form of incorporation (i.e., nanoparticles vs. solid solution) and the parame-ters that control the distribution and abundances of Re and Os in molybdenite, we investigated a suite of samples from two porphyry Cu-Mo deposits, El Alacrán (Mexico)2,13 and Miranda (Chile)14. High-resolution imaging, wavelength-dispersive spectroscopy (WDS) elemental and NanoSIMS isotopic mapping provide the first view of the distribution of the Re and Os elements and their respective isotopes at the micro to nanometer scale. The samples were previously analyzed for Re and Os using N-TIMS2,14 and were selected because of their high Re and Os content (Supplementary Table 1), which facilitate their detection by EMPA and NanoSIMS.
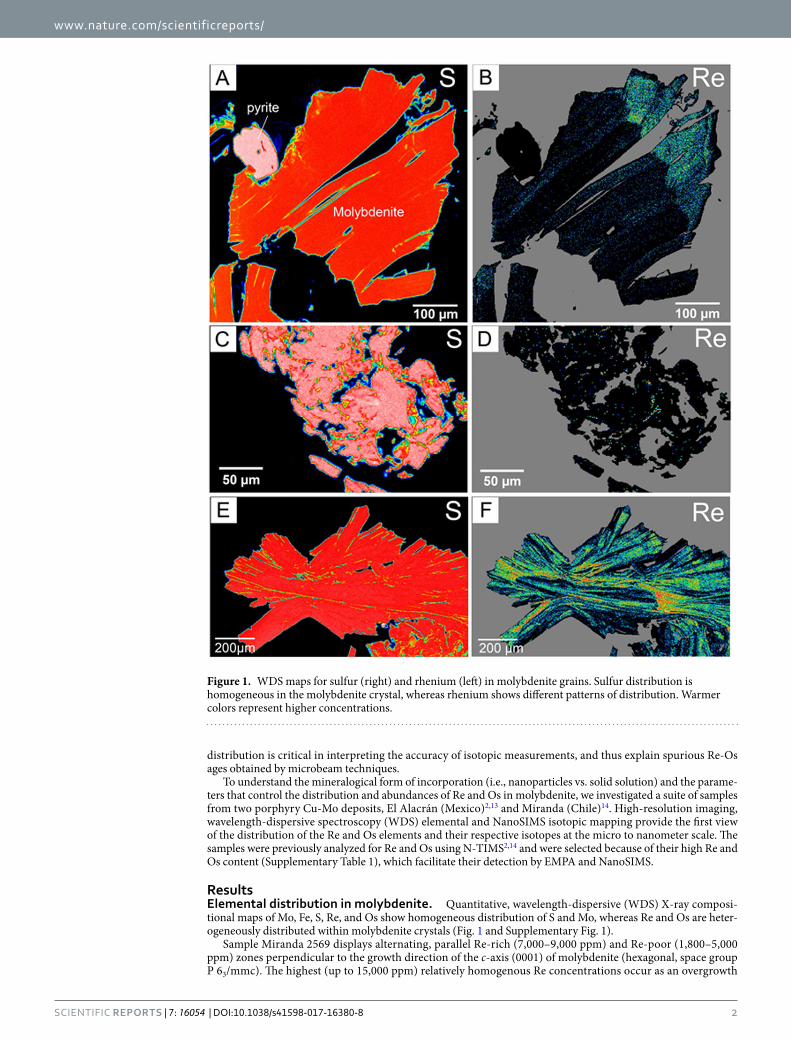
ResultsElemental distribution in molybdenite. Quantitative, wavelength-dispersive (WDS) X-ray composi-tional maps of Mo, Fe, S, Re, and Os show homogeneous distribution of S and Mo, whereas Re and Os are heter-ogeneously distributed within molybdenite crystals (Fig. 1 and Supplementary Fig. 1).
Sample Miranda 2569 displays alternating, parallel Re-rich (7,000–9,000 ppm) and Re-poor (1,800–5,000 ppm) zones perpendicular to the growth direction of the c-axis (0001) of molybdenite (hexagonal, space group P 63/mmc). The highest (up to 15,000 ppm) relatively homogenous Re concentrations occur as an overgrowth
Figure 1. WDS maps for sulfur (right) and rhenium (left) in molybdenite grains. Sulfur distribution is homogeneous in the molybdenite crystal, whereas rhenium shows different patterns of distribution. Warmer colors represent higher concentrations.
www.nature.com/scientificreports/
3SCiEntiFiC REPORtS | 7: 16054 | DOI:10.1038/s41598-017-16380-8
over the primary molybdenite indicating a second Re-rich event of crystallization (Fig. 1B). This overgrowth was formed by a later hydrothermal event and is not evident from routine optical inspection. Rhenium in molyb-denite from El Alacrán has a bimodal distribution. In sample Alacrán-B6, Re (700–7,200 ppm) accumulates in discrete micro- to nano-inclusions and or submicron zones (Fig. 1D), whereas in sample Alacrán-B9 rhenium partitions into oscillatory zoning similar to sample Miranda 2569, with primary molybdenite depleted in Re (4,000–8,000 ppm), and secondary molybdenite enriched in the element (10,000–21,500 ppm; Supplementary Data 1). Additionally, high Re concentrations are observed at the edges of the central crystal, indicating over-growths (Fig. 1F). The pattern is undisturbed by deformation and fragmentation.
The amounts of Os, which were detected in several EMPA analyses in all samples, vary from 400–700 ppm. This particulate distribution combined with single spot maxima on the Os elemental map suggests the presence of submicron Os-bearing inclusions (Supplementary Fig. 1 and Supplementary Data 1).
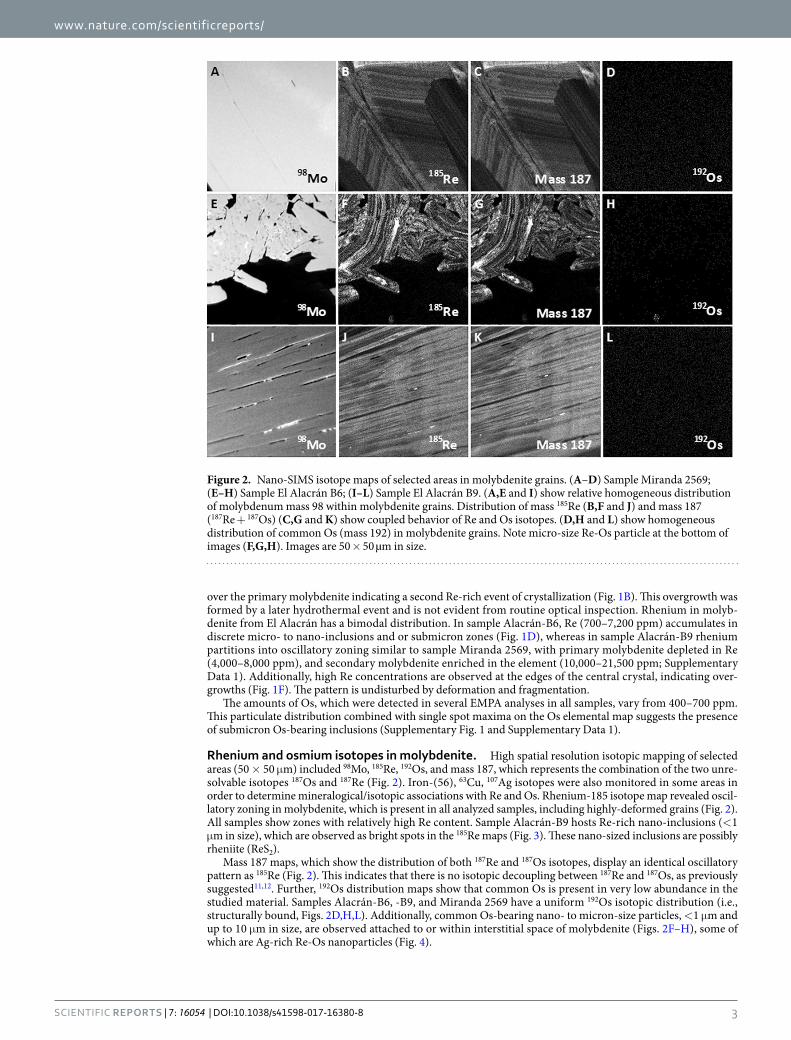
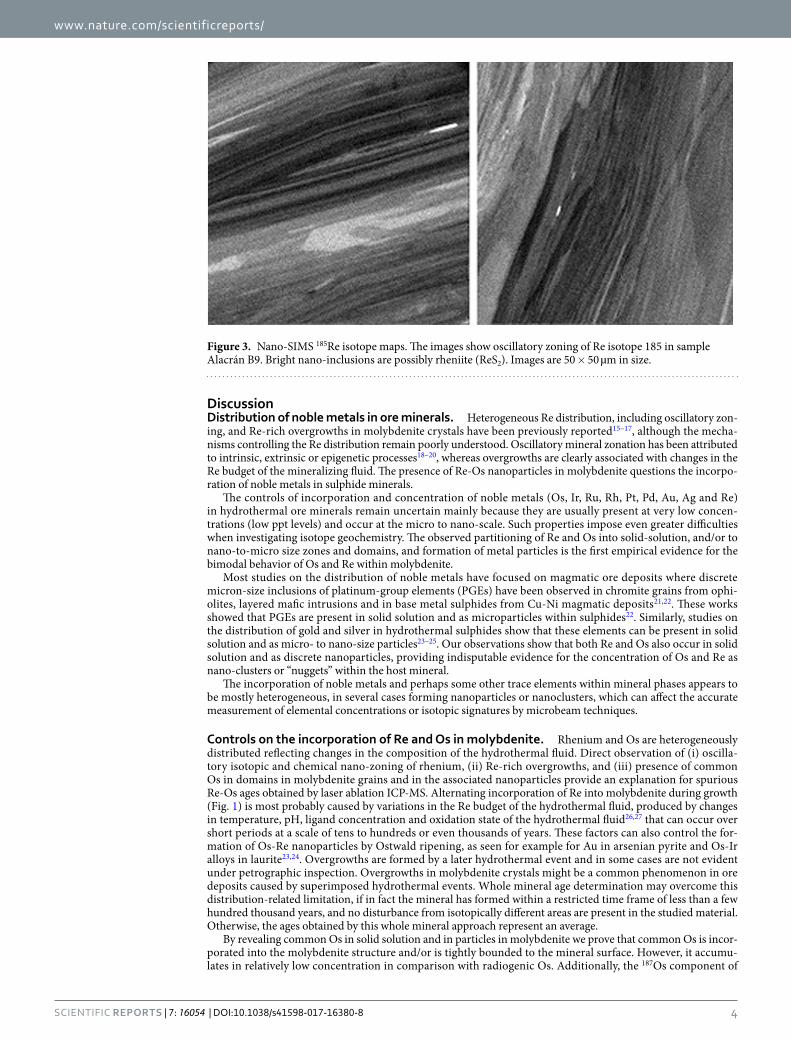
Rhenium and osmium isotopes in molybdenite. High spatial resolution isotopic mapping of selected areas (50 × 50 μm) included 98Mo, 185Re, 192Os, and mass 187, which represents the combination of the two unre-solvable isotopes 187Os and 187Re (Fig. 2). Iron-(56), 63Cu, 107Ag isotopes were also monitored in some areas in order to determine mineralogical/isotopic associations with Re and Os. Rhenium-185 isotope map revealed oscil-latory zoning in molybdenite, which is present in all analyzed samples, including highly-deformed grains (Fig. 2). All samples show zones with relatively high Re content. Sample Alacrán-B9 hosts Re-rich nano-inclusions (<1 μm in size), which are observed as bright spots in the 185Re maps (Fig. 3). These nano-sized inclusions are possibly rheniite (ReS2).
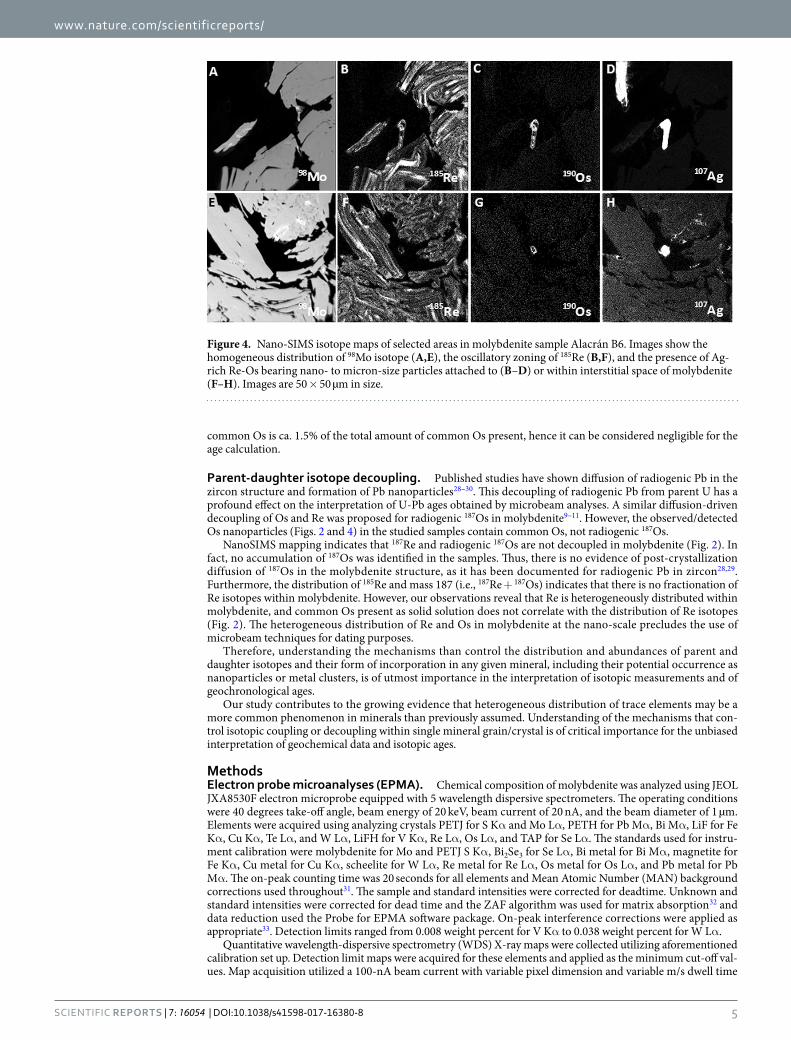
Mass 187 maps, which show the distribution of both 187Re and 187Os isotopes, display an identical oscillatory pattern as 185Re (Fig. 2). This indicates that there is no isotopic decoupling between 187Re and 187Os, as previously suggested11,12. Further, 192Os distribution maps show that common Os is present in very low abundance in the studied material. Samples Alacrán-B6, -B9, and Miranda 2569 have a uniform 192Os isotopic distribution (i.e., structurally bound, Figs. 2D,H,L). Additionally, common Os-bearing nano- to micron-size particles, <1 μm and up to 10 μm in size, are observed attached to or within interstitial space of molybdenite (Figs. 2F–H), some of which are Ag-rich Re-Os nanoparticles (Fig. 4).
Figure 2. Nano-SIMS isotope maps of selected areas in molybdenite grains. (A–D) Sample Miranda 2569; (E–H) Sample El Alacrán B6; (I–L) Sample El Alacrán B9. (A,E and I) show relative homogeneous distribution of molybdenum mass 98 within molybdenite grains. Distribution of mass 185Re (B,F and J) and mass 187 (187Re + 187Os) (C,G and K) show coupled behavior of Re and Os isotopes. (D,H and L) show homogeneous distribution of common Os (mass 192) in molybdenite grains. Note micro-size Re-Os particle at the bottom of images (F,G,H). Images are 50 × 50 µm in size.
www.nature.com/scientificreports/
4SCiEntiFiC REPORtS | 7: 16054 | DOI:10.1038/s41598-017-16380-8
DiscussionDistribution of noble metals in ore minerals. Heterogeneous Re distribution, including oscillatory zon-ing, and Re-rich overgrowths in molybdenite crystals have been previously reported15–17, although the mecha-nisms controlling the Re distribution remain poorly understood. Oscillatory mineral zonation has been attributed to intrinsic, extrinsic or epigenetic processes18–20, whereas overgrowths are clearly associated with changes in the Re budget of the mineralizing fluid. The presence of Re-Os nanoparticles in molybdenite questions the incorpo-ration of noble metals in sulphide minerals.
The controls of incorporation and concentration of noble metals (Os, Ir, Ru, Rh, Pt, Pd, Au, Ag and Re) in hydrothermal ore minerals remain uncertain mainly because they are usually present at very low concen-trations (low ppt levels) and occur at the micro to nano-scale. Such properties impose even greater difficulties when investigating isotope geochemistry. The observed partitioning of Re and Os into solid-solution, and/or to nano-to-micro size zones and domains, and formation of metal particles is the first empirical evidence for the bimodal behavior of Os and Re within molybdenite.
Most studies on the distribution of noble metals have focused on magmatic ore deposits where discrete micron-size inclusions of platinum-group elements (PGEs) have been observed in chromite grains from ophi-olites, layered mafic intrusions and in base metal sulphides from Cu-Ni magmatic deposits21,22. These works showed that PGEs are present in solid solution and as microparticles within sulphides22. Similarly, studies on the distribution of gold and silver in hydrothermal sulphides show that these elements can be present in solid solution and as micro- to nano-size particles23–25. Our observations show that both Re and Os also occur in solid solution and as discrete nanoparticles, providing indisputable evidence for the concentration of Os and Re as nano-clusters or “nuggets” within the host mineral.
The incorporation of noble metals and perhaps some other trace elements within mineral phases appears to be mostly heterogeneous, in several cases forming nanoparticles or nanoclusters, which can affect the accurate measurement of elemental concentrations or isotopic signatures by microbeam techniques.
Controls on the incorporation of Re and Os in molybdenite. Rhenium and Os are heterogeneously distributed reflecting changes in the composition of the hydrothermal fluid. Direct observation of (i) oscilla-tory isotopic and chemical nano-zoning of rhenium, (ii) Re-rich overgrowths, and (iii) presence of common Os in domains in molybdenite grains and in the associated nanoparticles provide an explanation for spurious Re-Os ages obtained by laser ablation ICP-MS. Alternating incorporation of Re into molybdenite during growth (Fig. 1) is most probably caused by variations in the Re budget of the hydrothermal fluid, produced by changes in temperature, pH, ligand concentration and oxidation state of the hydrothermal fluid26,27 that can occur over short periods at a scale of tens to hundreds or even thousands of years. These factors can also control the for-mation of Os-Re nanoparticles by Ostwald ripening, as seen for example for Au in arsenian pyrite and Os-Ir alloys in laurite23,24. Overgrowths are formed by a later hydrothermal event and in some cases are not evident under petrographic inspection. Overgrowths in molybdenite crystals might be a common phenomenon in ore deposits caused by superimposed hydrothermal events. Whole mineral age determination may overcome this distribution-related limitation, if in fact the mineral has formed within a restricted time frame of less than a few hundred thousand years, and no disturbance from isotopically different areas are present in the studied material. Otherwise, the ages obtained by this whole mineral approach represent an average.
By revealing common Os in solid solution and in particles in molybdenite we prove that common Os is incor-porated into the molybdenite structure and/or is tightly bounded to the mineral surface. However, it accumu-lates in relatively low concentration in comparison with radiogenic Os. Additionally, the 187Os component of
Figure 3. Nano-SIMS 185Re isotope maps. The images show oscillatory zoning of Re isotope 185 in sample Alacrán B9. Bright nano-inclusions are possibly rheniite (ReS2). Images are 50 × 50 µm in size.
www.nature.com/scientificreports/
5SCiEntiFiC REPORtS | 7: 16054 | DOI:10.1038/s41598-017-16380-8
common Os is ca. 1.5% of the total amount of common Os present, hence it can be considered negligible for the age calculation.
Parent-daughter isotope decoupling. Published studies have shown diffusion of radiogenic Pb in the zircon structure and formation of Pb nanoparticles28–30. This decoupling of radiogenic Pb from parent U has a profound effect on the interpretation of U-Pb ages obtained by microbeam analyses. A similar diffusion-driven decoupling of Os and Re was proposed for radiogenic 187Os in molybdenite9–11. However, the observed/detected Os nanoparticles (Figs. 2 and 4) in the studied samples contain common Os, not radiogenic 187Os.
NanoSIMS mapping indicates that 187Re and radiogenic 187Os are not decoupled in molybdenite (Fig. 2). In fact, no accumulation of 187Os was identified in the samples. Thus, there is no evidence of post-crystallization diffusion of 187Os in the molybdenite structure, as it has been documented for radiogenic Pb in zircon28,29. Furthermore, the distribution of 185Re and mass 187 (i.e., 187Re + 187Os) indicates that there is no fractionation of Re isotopes within molybdenite. However, our observations reveal that Re is heterogeneously distributed within molybdenite, and common Os present as solid solution does not correlate with the distribution of Re isotopes (Fig. 2). The heterogeneous distribution of Re and Os in molybdenite at the nano-scale precludes the use of microbeam techniques for dating purposes.
Therefore, understanding the mechanisms than control the distribution and abundances of parent and daughter isotopes and their form of incorporation in any given mineral, including their potential occurrence as nanoparticles or metal clusters, is of utmost importance in the interpretation of isotopic measurements and of geochronological ages.
Our study contributes to the growing evidence that heterogeneous distribution of trace elements may be a more common phenomenon in minerals than previously assumed. Understanding of the mechanisms that con-trol isotopic coupling or decoupling within single mineral grain/crystal is of critical importance for the unbiased interpretation of geochemical data and isotopic ages.
MethodsElectron probe microanalyses (EPMA). Chemical composition of molybdenite was analyzed using JEOL JXA8530F electron microprobe equipped with 5 wavelength dispersive spectrometers. The operating conditions were 40 degrees take-off angle, beam energy of 20 keV, beam current of 20 nA, and the beam diameter of 1 µm. Elements were acquired using analyzing crystals PETJ for S Kα and Mo Lα, PETH for Pb Mα, Bi Mα, LiF for Fe Kα, Cu Kα, Te Lα, and W Lα, LiFH for V Kα, Re Lα, Os Lα, and TAP for Se Lα. The standards used for instru-ment calibration were molybdenite for Mo and PETJ S Kα, Bi2Se3 for Se Lα, Bi metal for Bi Mα, magnetite for Fe Kα, Cu metal for Cu Kα, scheelite for W Lα, Re metal for Re Lα, Os metal for Os Lα, and Pb metal for Pb Mα. The on-peak counting time was 20 seconds for all elements and Mean Atomic Number (MAN) background corrections used throughout31. The sample and standard intensities were corrected for deadtime. Unknown and standard intensities were corrected for dead time and the ZAF algorithm was used for matrix absorption32 and data reduction used the Probe for EPMA software package. On-peak interference corrections were applied as appropriate33. Detection limits ranged from 0.008 weight percent for V Kα to 0.038 weight percent for W Lα.
Quantitative wavelength-dispersive spectrometry (WDS) X-ray maps were collected utilizing aforementioned calibration set up. Detection limit maps were acquired for these elements and applied as the minimum cut-off val-ues. Map acquisition utilized a 100-nA beam current with variable pixel dimension and variable m/s dwell time
Figure 4. Nano-SIMS isotope maps of selected areas in molybdenite sample Alacrán B6. Images show the homogeneous distribution of 98Mo isotope (A,E), the oscillatory zoning of 185Re (B,F), and the presence of Ag-rich Re-Os bearing nano- to micron-size particles attached to (B–D) or within interstitial space of molybdenite (F–H). Images are 50 × 50 µm in size.
www.nature.com/scientificreports/
6SCiEntiFiC REPORtS | 7: 16054 | DOI:10.1038/s41598-017-16380-8
per pixel. Data were processed using the Calcimage software package and output to Surfer® for further processing and enhancement.
NanoSIMS analyses. Elemental and isotopic mapping was carried out using a CAMECA NanoSIMS 50 L at the University of Western Australia. The analysis was performed with an O− beam generated by a Hyperion (H200) RF plasma oxygen ion source. The beam current was approximately 17 pA and the spot size was approx-imately 100 nm. Each area of interest was pre-sputtered with the primary beam to a dose of >1 × 10¹⁷ ions/cm2. Due to the geometry of the mass spectrometer, it was not possible to collect all the relevant isotopes simultane-ously, thus each area was mapped twice using two different configurations of the multicollection system. The magnetic field was fixed, and the electron multiplier (EM) detectors were positioned to collect signal from 56Fe, 63Cu, 98Mo, 107Ag, 185Re, 190Os during the first run, and then the last two detectors were moved to collect 187Re and 192Os during the second run. The peak positions were calibrated using pure Re and Os metal standards. As sensi-tivity was a key issue and there were no significant mass interferences, no slits were used in the mass spectrometer.
Images were acquired with a raster size of 45 or 50 μm2, at a resolution of 512 × 512 pixels, with a dwell times of 25 or 30 ms/pixel. Maps were corrected for 44 ns deadtime on each individual pixel. Images were processed using the OpenMIMS plugin for FIJI/ImageJ (https://github.com/BWHCNI/OpenMIMS).
References 1. McCandless, T. E. & Ruiz, J. Rhenium-Osmium evidence for regional mineralization in southwestern North-America. Science 261,
1282–1286 (1993). 2. Barra, F. et al. Laramide Porphyry Cu-Mo mineralization in northern Mexico: Age constraints from Re-Os geochronology in
molybdenite. Econ. Geol. 100, 1605–1616 (2005). 3. Kirk, J., Ruiz, J., Chesley, J., Walshe, J. & England, G. A major Archean, gold- and crust-forming event in the Kaapvaal craton, South
Africa. Science 297, 1856–1858 (2002). 4. Mathur, R., Ruiz, J. & Munizaga, F. Relationship between copper tonnage of Chilean base-metal porphyry deposits and Os isotope
ratios. Geology 28, 555–558 (2000). 5. Stein, H., Markey, R. J., Morgan, J. W., Hannah, J. L. & Scherstén, A. The remarkable Re-Os chronometer in molybdenite: how and
why it works. Terra Nova 13, 479–486 (2001). 6. Herr, W., H. Hintenberg, H. & Voshage, H. Half-life of rhenium. Phys. Rev. 95, 1691 (1954). 7. Luck, J. M. & Allegre, C. J. The study of molybdenites through the 187Re–187Os chronometer. Earth Planet. Sci. Lett. 61, 291–296
(1982). 8. McCandless, T. E., Ruiz, J. & Campbell, A. R. Rhenium behavior in molybdenite in hypogene and near-surface environments:
implications for Re-Os geochronology. Geochim. Cosmochim. Acta 57, 889–905 (1993). 9. Suzuki, K., Kagi, H., Nara, M., Takano, B. & Nozaki, Y. Experimental alteration of molybdenite: evaluation of the Re-Os system,
infrared spectroscopic profile and polytype. Geochim Cosmochim Acta 64, 223–232 (2000). 10. Košler, J. et al. Laser ablation ICP-MS measurements of Re/Os in molybdenite and implications for Re-Os geochronology. Can.
Mineral. 41, 307–320 (2003). 11. Stein, H., Scherstén, A., Hannah, J. & Markey, R. Subgrain-scale decoupling of Re and 187Os and assessment of laser ablation ICP-MS
spot dating in molybdenite. Geochim. Cosmochim. Acta 67, 3673–3686 (2003). 12. Selby, D. & Creaser, R. A. Macroscale NTIMS and microscale LA-MC-ICP-MS Re-Os isotopic analysis of molybdenite: Testing
spatial restrictions for reliable Re-Os age determinations, and implications for the decoupling of Re and Os within molybdenite. Geochim. Cosmochim. Acta 68, 3897–3908 (2004).
13. Dean, D. A. Geology, alteration, and mineralization of the El Alacrán area, Northern Sonora, Mexico: Unpublished M.S. Thesis, University of Arizona, Tucson Arizona, 222 pp.
14. Barra, F. et al. Timing and formation of porphyry Cu–Mo mineralization in the Chuquicamata district, northern Chile: new constraints from the Toki cluster. Miner. Deposita 48, 629–651 (2013).
15. Voudoris, P. C. et al. Rhenium-rich molybdenite and rheniite in the Pagoni Rachi Mo-Cu-Te-Ag-Au prospect, northern Greece: Implications for the Re geochemistry of porphyry-style Cu-Mo and Mo mineralization. Can. Mineral. 47, 1013–1036 (2009).
16. Ciobanu, C. L. et al. Trace element heterogeneity in molybdenite fingerprints stages of mineralization. Chem. Geol. 347, 175–189 (2013).
17. Grabezhev, A. I. & Voudoris, P. G. Rhenium distribution in molybdenite from the Vosnesensk porphyry Cu± (Mo, Au) deposit (southern Urals, Russia). Can. Mineral. 52, 671–686 (2014).
18. Shore, M. & Fowler, A. D. Oscillatory zoning in minerals: a common phenomenon. Can. Mineral. 34, 1111–1126 (1996). 19. Watson, E. B. Surface enrichment and trace-element uptake during crystal growth. Geochim. Cosmochim. Acta 60, 5013–5020
(1996). 20. Holten, T., Jamtveit, B. & Meakin, P. Noise and oscillatory zoning of mineral. Geochim. Cosmochim. Acta 64, 1893–1904 (2000). 21. O’Driscoll, B. & González-Jiménez, J. M. “Petrogenesis of platinum-group elements” in Highly Siderophile and Strongly Chalcophile
Elements in High-Temperature Geochemistry and Cosmochemistry (eds. Harvey, J. & Day M. D.) 489–578 (MSA 2016). 22. González-Jiménez, J. M. & Reich, M. An overview of the platinum-group element nanoparticles in mantle-hosted chromite deposits.
Ore Geol. Rev. 81, 1236–1248 (2017). 23. Reich, M. et al. Thermal behavior of metal nanoparticles in geologic materials. Geology. 34, 1033–1036 (2006). 24. Barker, S. L. L. et al. Uncloaking “invisible” gold: use of NanoSIMS to measure gold, trace element and sulfur isotopes in pyrite from
Carlin-type gold deposits. Econ. Geol. 104, 897–904 (2009). 25. Reich, M. et al. “Invisible” silver and gold in supergene chalcocite. Geochim. Cosmochim. Acta 74, 6157–6173 (2010). 26. Xiong, Y. & Wood, S. A. Experimental determination of the solubility of ReO2 and the dominant oxidation state of rhenium in
hydrothermal solutions. Chem. Geol. 158, 245–256 (1999). 27. Berzina, A. N., Sotnikova, V. I., Economou-Eliopoulos, M. & Eliopoulos, D. G. Distribution of rhenium in molybdenite from
porphyry Cu–Mo and Mo–Cu deposits of Russia (Siberia) and Mongolia. Ore Geol. Rev. 26, 91–113 (2005). 28. Kusiak, M. A., Whitehouse, M. J., Wilde, S. A., Nemchin, A. A. & Clark, C. Mobilization of radiogenic Pb in zircon revealed by ion
imaging: Implications for early Earth geochronology. Geology 41, 291–294 (2013). 29. Valley, J. W. et al. Hadean age for a post-magma-ocean zircon confirmed by atom-probe tomography. Nat. Geosci. 7, 219–223 (2014). 30. Kusiak, M. A. et al. Metallic lead nanospheres discovered in ancient zircons. Proc. Natl. Acad. Sci. USA 112, 4958–4963 (2015). 31. Donovan, J. J. & Tingle, T. N. An improved mean atomic number correction for quantitative microanalysis. J Micros 2, 1–7 (1996). 32. Armstrong, J. T. Quantitative analysis of silicates and oxide minerals: Comparison of Monte-Carlo, ZAF and Phi-Rho-Z procedures
in Microbeam analysis (ed. Newberry, D. E.) 239–246 (San Francisco Press, 1988). 33. Donovan, J. J., Snyder, D. A. & Rivers, M. L. An improved interference correction for trace element analysis. Microbeam Analysis 2,
23–28 (1993).
www.nature.com/scientificreports/
7SCiEntiFiC REPORtS | 7: 16054 | DOI:10.1038/s41598-017-16380-8
AcknowledgementsThis work was funded by Project Fondecyt #1140780 to F.B. and M.R. The authors also acknowledge the support of Millenium Nucleus NC 130065 and CEGA Fondap-Conicyt 15090013.
Author ContributionsF.B. designed the study. A.D. and M.P.R. performed the EMPA analysis, M.R.K. and P.G. conducted the nanoSIMS analysis. F.B., A.D., M.R. and M.R.K. discussed the results. F.B., A.D. and M.R. wrote the paper. M.R.K. and M.P.R. provided comments on the paper before submission.
Additional InformationSupplementary information accompanies this paper at https://doi.org/10.1038/s41598-017-16380-8.Competing Interests: The authors declare that they have no competing interests.Publisher's note: Springer Nature remains neutral with regard to jurisdictional claims in published maps and institutional affiliations.
Open Access This article is licensed under a Creative Commons Attribution 4.0 International License, which permits use, sharing, adaptation, distribution and reproduction in any medium or
format, as long as you give appropriate credit to the original author(s) and the source, provide a link to the Cre-ative Commons license, and indicate if changes were made. The images or other third party material in this article are included in the article’s Creative Commons license, unless indicated otherwise in a credit line to the material. If material is not included in the article’s Creative Commons license and your intended use is not per-mitted by statutory regulation or exceeds the permitted use, you will need to obtain permission directly from the copyright holder. To view a copy of this license, visit http://creativecommons.org/licenses/by/4.0/. © The Author(s) 2017