Embed Size (px)
Citation preview
©Review of the HOCG ISSN 1759-‐0108
Page 1
Review of the Hellenic Observatory of Corporate Governance
(HOCG)
Vol. 4, No. 4, December 2010 ISSN 1759-‐0108
Editorial
With a great pleasure, I submit the tenth report produced by the HOCG. Since 2007, a systematic and conscientious effort has been devoted on the issues of Corporate Governance and Board of Directors in Greece on its most important and sensitive economic and social domains. The Reviews that have been produced and freely distributed have covered extensively the Listed Companies in the Athens Stock Exchange, the majority of the State Owned Enterprises, the Listed Maritime Companies, the Football Clubs and the Hospitals.
In the midst of the recent financial crisis and the unmanageable sovereign debt that our country as well as other European countries are facing, a central theme of increased interest for corporate governance researchers is weather boards of financial –primarily-‐institutions were appropriately dealt with RISK. Although, risk taking, risk aversion or risk management in general, are issues of great importance for well-‐structured and functioning boards a more fundamental issue is the understanding of those boards; in terms of their elements, components, characteristics and overall profile. With this though in mind, the HOCG with the regular reviews that produces aims at throwing some light on the Board of Directors in Greece.
The current Review may be quite unique worldwide, having attempted to analyze and provide data on the majority of public owned hospitals in Greece for a period covering the years 2005 -‐2008. In the following months the HOCG’s research team will be expanding the above period by adding the years 2009 and 2010 as well as more hospitals if the availability of data allows it.
As a result of this effort, some interesting findings emerge for this extremely important domain of any society; that is the Health provision. Especially for Greece, where the average household spend considerable percentage of their net income on health related expenses a better understanding of how the backbone of Health provision –that is Hospitals-‐ are managed, governed, operate and deliver health related services is of paramount importance.
The provision of Health Care in Greece is facing numerous challenges. It is seems unavoidable that dramatic changes in the way we live are about to happen. Health Care provision will soon change. Hospitals and their boards should adapt to new realities. Board expertise, board decision making, boards dealing with risk management, autonomy, accountably and transparency will be words and issues that they are here to stay and be dealt with.
I hope that the current study will contribute to the ongoing discussion and
©Review of the HOCG ISSN 1759-‐0108
Page 2
challenge decision and policy makers.
Dr Dimitrios N. Koufopoulos BSc, MBA, PhD, FIC, MCMI, MCSI
Rev ed: 2011-‐05-‐09
Boards of the Greek Hospitals: Findings from the First Annual Research
1. Introduction Alfred Marshall wrote in ‘Principles of Economics’ (Book I, Preliminary Survey,
1890, p. 47) that”[the founders of modern economics] were without exception devoted to the doctrine that the wellbeing of the whole people should be the ultimate goal of all private effort and all public policy”.
Unequivocally health is the most important element of life and health care is
undoubtedly a public good. There are a variety of health care systems around the globe, i.e., i) universal systems in which public sector health care services are funded by taxation and national insurance contributions (the case of UK), ii) public health insurance funded by compulsory social health insurance contributions from employers and employees (the case of France) iii) private health care systems in which health care is provided by many private separate legal entities (the case of US) and iv) mixed systems whereas the NHS (National Health System) is a mixed system, where various social insurance funds coexist as parts of the NHS(the case of Greece).
In the last few decades medicine has made significant progress in the developed
world; medical knowledge has progressed and cutting edge technology has been introduced which enhanced quality of life and increased life expectancy. However, health care is still a controversial subject worldwide, for political, social and economic forces play an increasingly larger role in health care systems’ development and operation.
Today, in virtually every country, health care is heavily influenced by extensive
government intervention. Therefore, the NHS (National Health Systems) are frequently inflexible (due to the ‘decision making process centralisation’) and bureaucracy (i.e., medicare regulation, waiting lists, etc). Furthermore, due to current emerging pressures such as the rising costs of medical care and health insurance, the financing and control of health care spending, the increased expectations of the population on the health services supplied, -‐etc., there is a growing demand for more effective and reliable healthcare systems.
Presently, Greece is attempting to reform its’ health care system. Academics,
nongovernmental organizations (NGOs), and industry experts have made several recommendations to improve the effectiveness of the health care – either with a strong governmental role (public sector approach) or by supporting the free
©Review of the HOCG ISSN 1759-‐0108
Page 3
competitive market. Also, health related influential groups such as health suppliers, insurance companies, consumers (patients), and tax-‐payers, express their dissatisfaction publicly and demand health care reforms for they require improved quality of health services and costs reductions, -‐ so far, any improvements made have not shown positive effects. According to the World Health Report published by the World Health Organization (WHO) “rather than improving their response capacity and anticipating new challenges, health systems seem to be drifting from one short-‐term priority to another, increasingly fragmented and without a clear sense of direction” (WHO, 2008a, p. xiii). Consequently, it is important to examine all aspects of the system. In an attempt to assist in such an endeavour we present the following study.
The study of Greek hospital structure is examined and in particular the Boards of
Directors structures and organisation of hospitals are analysed. Recently, international attention has shifted toward improving the governance
arrangements of health care services providers, since it is a vital element of health care systems. According to the WHO, “governance in health is increasingly regarded as a salient theme on the development agenda. The increased interest in governance has been driven by the need for greater accountability, arising from both increased funding and a growing demand to demonstrate results” (WHO, 2008b, p. 2). 2. The NHS in Greece
The Worldwide Governance Indicators released by the World Bank (2009), place
Greece in the top 30% of 212 countries assessed, with relatively high scores for regulatory quality, voice and accountability, government effectiveness and the rule of law (Kaufmann et al., 2009). However, according to the OECD (Organization for Economic Cooperation and Development) in the Economic Survey of Greece “the governance and highly fragmented structure of the health care system should be revised… Modernisation of hospital management is required, which entails inter alia expanding their management autonomy and revising their funding system” (OECD, 2009, p. 8).
The OECD identified that the core inefficiencies of the Greek NHS are associated
with a fragmented structure of the NHS, an inadequate medical demography, deficiencies in the allocation of public health resources and the bureaucracy of public health spending. According to OECD, “Greek health outcomes compare favourably with the OECD average. However, the health care system is seen as not working well by the population. One source of dissatisfaction is the high proportion of private household spending on health, including informal payments, while public health spending relative to GDP is one of the lowest in the OECD”(OECD, 2009, p. 85).
More specifically, regarding Greek hospitals, “hospital management has been an issue in NHS since the latter’s establishment…The chairman of the board was always a political appointee
©Review of the HOCG ISSN 1759-‐0108
Page 4
and, usually, a doctor… there was an attempt to change the management structure of hospitals. Initial proposals, dating from mid-‐1996, concerning the appointment of managers with strong decision-‐making authority, met with strong resistance from doctors’ trade unions” (Ballas and Tsoukas, 2004, p. 669).
Additionally, until the 2001 reforms, the majority of Board directors had no managerial skills and were “appointed on the basis of political criteria” (Economou and Giorno, 2009, p. 27). In the past decade the Greek government has employed managers with administrative professional qualifications in the hospitals’ Boards in an attempt to bring about change toward the better practices.
In Greece, the NHS was established in 1983. The Greek NHS is directly administered
by the Greek government, funded through taxation, and provided mainly by public-‐sector institutions. Since 1983 there are numerous legislative interventions that have led to today’s regional composition of the national health system and social solidarity.
2.1. The Legal Framework of the Greek NHS The Greek NHS, was established and developed through a series of laws. The first
of which was 1397/1983, which established Regional Health Councils (P.E.SY) in each health region. The distinction among the nine health regions (Y.PE) of the country was made by the Presidential Decree 31/1986 while under the provisions of law no. 1622/1986 the Administrative health regions were set at 13. But these legislations, which intended to decentralize the health care system by creating health regions (Y.PE) and administrative health regions, had not performed as intended. Consequently, law 2071/1992 was formed which provided the establishment of the Regional Directorates of Health Services offices in each health region in an attempt to improve the NHS further.
In 2001, there was an attempt to reform the regional structure of the health
system under the provisions of law 2889/2001, were Regional Health Systems (PE.S.Y) were established and hospitals and health centres were defined as decentralized units that would be monitored by the corresponding P.E.SY. Moreover, in 2003 a new law would be put in place, (3106/2003), according to which the National Social Care System was reorganized and the Regional Health Systems PE.SY were restructured and renamed as (Regional Health and Welfare Systems) PE.S.Y.P under this new system the 13 heath regions were converged with the 13 Administrative heath regions. This was an attempt to decentralise the NHS into autonomous regional units that would be more effective and efficient, thus improving health services provided to the general public.
More recently law no. 3329/2005 was implemented under which the Regional
Health and Welfare Systems PE.S.Y.P renamed to D.Y.PE (Health Administration Regions) and remained as 13 regions. However the greater administrative health regions (Y.PE) were regrouped to consequently became 17. Finally, in 2007 law no. 3527/2007 was implemented which once again reorganised the NHS by dividing the
©Review of the HOCG ISSN 1759-‐0108
Page 5
nation into 7 areas establishing 7 heath regions (Y.PE) and accordingly 7 D.Y.PE (Health Administration Regions). These regions are the following: 1) Attica, 2) Piraeus and Aegean, 3) Central Macedonia, 4) Macedonia and Thrace, 5) Thessaly and Central Greece, 6) Peloponnese, Ionian, Epirus and West Greece and 7) Crete. Furthermore, under the provisions of law 3329/2005, D.Y.PE’s is responsible for the implementation of the policies that are developed by the Ministry of Health. Additionally, D.Y.PE’s tasks are to plan, coordinate, supervise and monitor the operation of all the health and welfare providers (F.P.Y.Y.K.A.).are broken into 3 categories, which are 1) hospitals, health centres, and social health centres 2) mental health and rehabilitation centres and 3) other legal entities and.
2.2. The Greek Hospitals and Corporate Governance Issues One of the principle health care providers in Greece are public hospitals. Hospitals
were initially centralized units under the control of PE.S.YP; yet the provisions of law 3329/2005 converted them to public entities (NPDD) and are controlled by the Governor of the corresponding DYPE. Moreover, hospitals are classified under two main categories:
A. General hospitals – which provide medical treatment to patients that are
subsumed and handle all types of medical cases B. Expert hospitals – that handle nursing patients back to health which are cases
that the hospital specializes in. According to law 3329/2005 article 7 paragraph 4, the governing body of a hospital
comprises of the Board of Directors (BoDs) and the Governor, while Board size is dependent on a hospital’s capacity. Consequently a board comprises of 7 members when a hospital has a capacity of up to 399 beds, while hospitals that have a capacity of 400 or more beds have a BoD of up to 9 members.
The Governor of the Hospital is also the Chairman of the Board of Directors. Then there is a Vice Chairman, the Director of Nursing Services, a Representative of the medical staff, a representative of non-‐medical staff, and depending on a hospital’s capacity it may have 2 to 4 additional members of the board. Hospitals that have a capacity over 400 beds have 10 members on the BoD one being the Alternative Governor.
Furthermore according to law 3329/2005 all Board members are appointed by the Minister of Health and Social Solidarity. Moreover for every member appointed there is also an alternate member appointed as well. Subsequently, every board has a substitute board of equal size. Please note: although data on alternate board members was collected, it is not presented in this research
The tenure of board members is two years and can be renewed by the Ministry of
Health and Social Solidarity. Moreover, the Governor and Alternate Governor are full time members, while all other members are part –time members.
©Review of the HOCG ISSN 1759-‐0108
Page 6
Additionally, the Governor is responsible for the development of a business plan, the organization, coordination, monitoring and functioning of the hospital, etc. Furthermore, the Governor as previously mentioned acts as Chairman of the BoD and as such, must convene the Board and preside at meetings. Hence, the Governor of the hospital has dual responsibilities, both as Governor and Chairman of the BoD. Meetings are scheduled at least twice a month, and the Governor can call for additional “extraordinary” meetings.
Remuneration of Board Members is also determined under law 3229/2005.
According to which Governors of hospitals with a capacity greater than 400 beds receive a monthly payment of €5.195, while Governors whose hospital capacity is from 200 to 299 beds receive €4.402 per month, and those whose hospital capacity is up to 199 beds receive €3.669 per month. Alternate Governors remuneration is €3.669 per moth regardless of hospital capacity. While the rest of the members of the board are remunerated on the basis of the number of meetings they attend per month. Specifically, Vice Chairman’s remuneration is €175 per meeting not to exceed €700 a month and the rest of the board members receive €50 for every meeting they attend while not exceeding €200 a month
The legal framework under which Greek Public Hospitals operate was presented for
it pertains to Corporate Governance Practices followed by the hospitals. The aim of this issue is to examine and analyse these practises, with particular focus on the Board of Directors and its characteristics.
3. Methodology
3.1. Sample
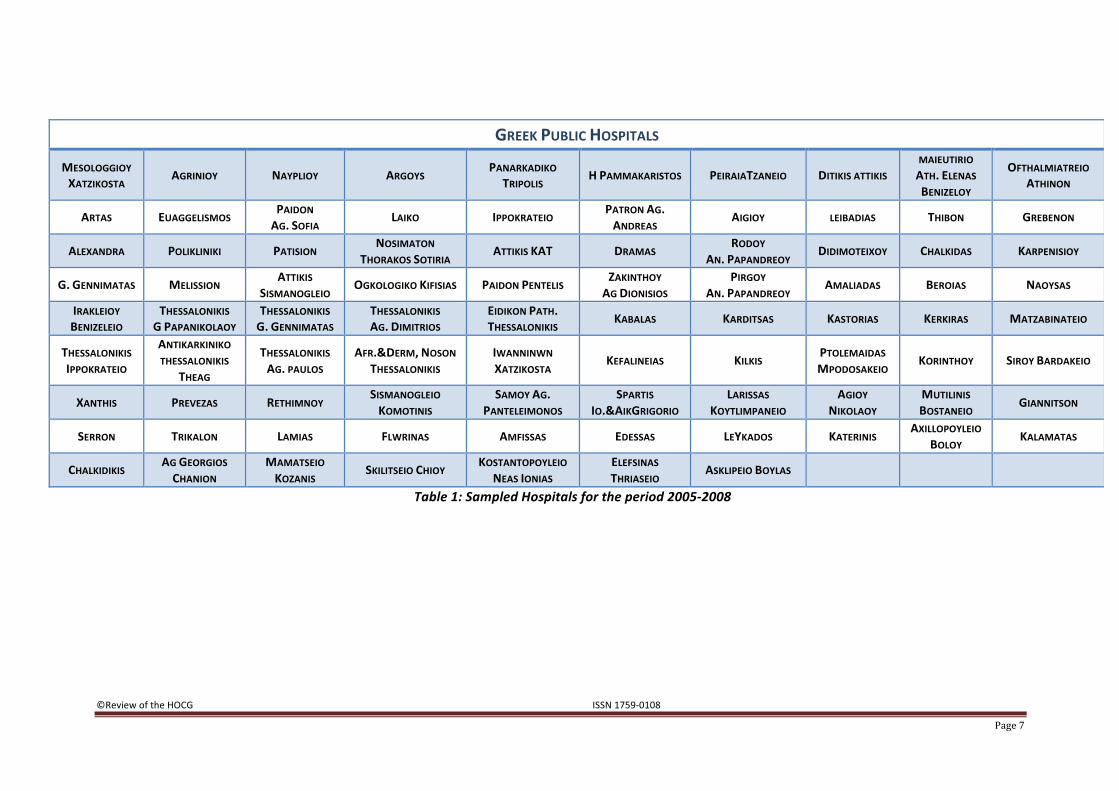
The current study focuses on the board characteristics of 87 public hospitals in Greece. Data was collected from the NPDD and YODD issues of the Governmental Gazette, published in the National Printing House (www.et.gr) for the years 2005-‐2008. The data collection process took place during the third quarter of 2009. Table 1 presents all hospitals that were used in the analysis while Diagram 1 illustrates the geographic location of these 87 hospitals. The geographical location is in accordance with the 7 health regions (Y.PE) throughout Greece.
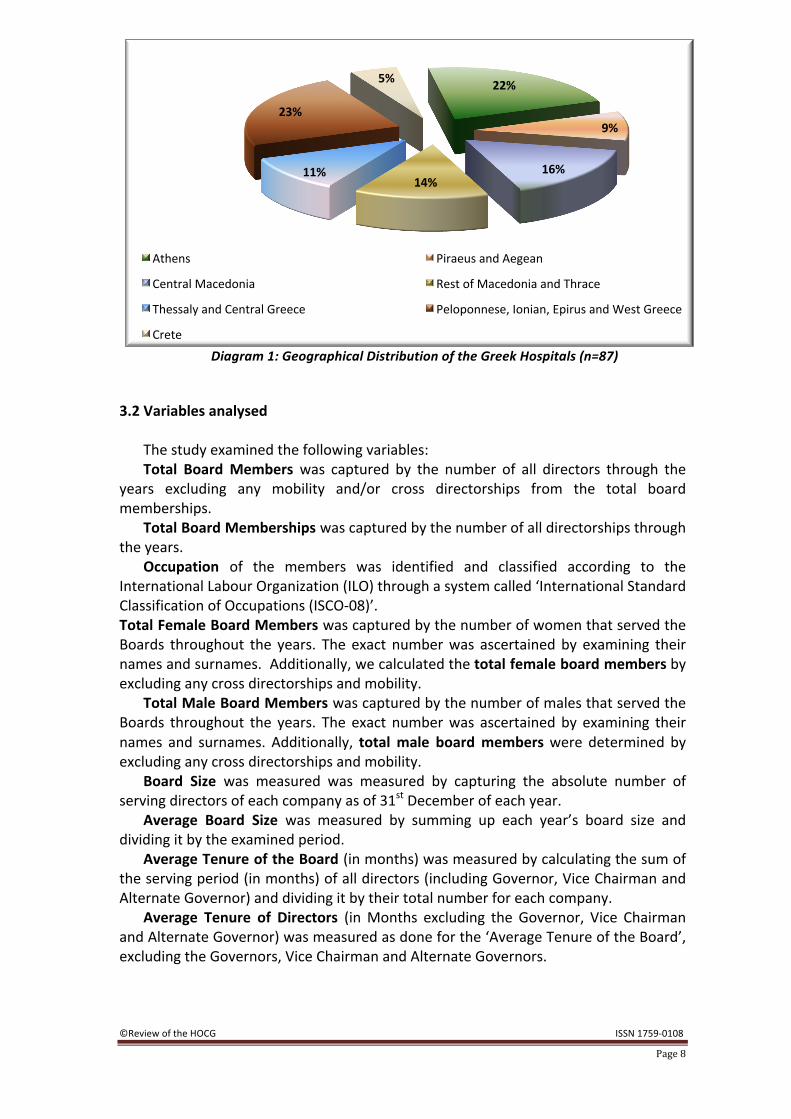
As shown in Diagram 1, the majority of the hospitals are located in the regions of Peloponnese, Ionian, Epirus and West Greece (20 or 23%) and Attica (19 or 22%); 14 (or 16%) have their base in Central Macedonia. Furthermore, 12 (14%) are situated in the Macedonia and Thrace. Also, 10 (11%) are located in the district of the Thessaly and Central Greece and 8 (9%) in Piraeus and Aegean. Last, there are 4 (5%) hospitals out of the 87 situated in Crete.
©Review of the HOCG ISSN 1759-‐0108
Page 7
GREEK PUBLIC HOSPITALS
MESOLOGGIOY XATZIKOSTA AGRINIOY NAYPLIOY ARGOYS PANARKADIKO
TRIPOLIS H PAMMAKARISTOS PEIRAIATZANEIO DITIKIS ATTIKIS MAIEUTIRIO ATH. ELENAS BENIZELOY
OFTHALMIATREIO ATHINON
ARTAS EUAGGELISMOS PAIDON AG. SOFIA LAIKO IPPOKRATEIO PATRON AG.
ANDREAS AIGIOY LEIBADIAS THIBON GREBENON
ALEXANDRA POLIKLINIKI PATISION NOSIMATON THORAKOS SOTIRIA ATTIKIS KAT DRAMAS RODOY
AN. PAPANDREOY DIDIMOTEIXOY CHALKIDAS KARPENISIOY
G. GENNIMATAS MELISSION ATTIKIS SISMANOGLEIO OGKOLOGIKO KIFISIAS PAIDON PENTELIS ZAKINTHOY
AG DIONISIOS PIRGOY
AN. PAPANDREOY AMALIADAS BEROIAS NAOYSAS
IRAKLEIOY BENIZELEIO
THESSALONIKIS G PAPANIKOLAOY
THESSALONIKIS G. GENNIMATAS
THESSALONIKIS AG. DIMITRIOS
EIDIKON PATH. THESSALONIKIS KABALAS KARDITSAS KASTORIAS KERKIRAS MATZABINATEIO
THESSALONIKIS IPPOKRATEIO
ANTIKARKINIKO THESSALONIKIS
THEAG
THESSALONIKIS AG. PAULOS
AFR.&DERM, NOSON THESSALONIKIS
IWANNINWN XATZIKOSTA KEFALINEIAS KILKIS PTOLEMAIDAS
MPODOSAKEIO KORINTHOY SIROY BARDAKEIO
XANTHIS PREVEZAS RETHIMNOY SISMANOGLEIO KOMOTINIS
SAMOY AG. PANTELEIMONOS
SPARTIS IO.&AIKGRIGORIO
LARISSAS KOYTLIMPANEIO
AGIOY NIKOLAOY
MUTILINIS BOSTANEIO GIANNITSON
SERRON TRIKALON LAMIAS FLWRINAS AMFISSAS EDESSAS LEYKADOS KATERINIS AXILLOPOYLEIO BOLOY KALAMATAS
CHALKIDIKIS AG GEORGIOS CHANION
MAMATSEIO KOZANIS SKILITSEIO CHIOY KOSTANTOPOYLEIO
NEAS IONIAS ELEFSINAS THRIASEIO ASKLIPEIO BOYLAS
Table 1: Sampled Hospitals for the period 2005-‐2008
©Review of the HOCG ISSN 1759-‐0108
Page 8
Diagram 1: Geographical Distribution of the Greek Hospitals (n=87)
3.2 Variables analysed The study examined the following variables: Total Board Members was captured by the number of all directors through the
years excluding any mobility and/or cross directorships from the total board memberships.
Total Board Memberships was captured by the number of all directorships through the years.
Occupation of the members was identified and classified according to the International Labour Organization (ILO) through a system called ‘International Standard Classification of Occupations (ISCO-‐08)’. Total Female Board Members was captured by the number of women that served the Boards throughout the years. The exact number was ascertained by examining their names and surnames. Additionally, we calculated the total female board members by excluding any cross directorships and mobility.
Total Male Board Members was captured by the number of males that served the Boards throughout the years. The exact number was ascertained by examining their names and surnames. Additionally, total male board members were determined by excluding any cross directorships and mobility.
Board Size was measured was measured by capturing the absolute number of serving directors of each company as of 31st December of each year.
Average Board Size was measured by summing up each year’s board size and dividing it by the examined period.
Average Tenure of the Board (in months) was measured by calculating the sum of the serving period (in months) of all directors (including Governor, Vice Chairman and Alternate Governor) and dividing it by their total number for each company.
Average Tenure of Directors (in Months excluding the Governor, Vice Chairman and Alternate Governor) was measured as done for the ‘Average Tenure of the Board’, excluding the Governors, Vice Chairman and Alternate Governors.
22%
9%
16% 14%
11%
23%
5%
Athens Piraeus and Aegean
Central Macedonia Rest of Macedonia and Thrace
Thessaly and Central Greece Peloponnese, Ionian, Epirus and West Greece
Crete
©Review of the HOCG ISSN 1759-‐0108
Page 9
The number of Governor Positions, Vice-‐Chairpersonships and Alternate Governors positions was calculated by counting the number of all positions for each throughout the years.
Average Tenure of Governors, Vice-‐Chairpersonships and Alternate Governors were measured by calculating the sum of the serving period (in months) for the Governors, Vice-‐Chairpersons, Alternate Governors of each hospital, divided by the total number of Governors, Vice Chairpersons, Alternate Governors that served in each of these hospitals.
The gender of Governors, Vice Chairman and Alternate Governors was identified by their full names.
Cross Directorates: the directors that were serving in more than one board of the sample have been identified and recorded along with the corresponding hospitals.
4. Findings
4.1 Total Board Memberships, gender and occupation issues The total number of directorships during the years 2005-‐2008 was 994, while the
total number of Directors was 972, if we exclude the cross directorships and mobility -‐ the directors who served in different boards throughout the years. On average, there were 11.43 directors in each hospital for this period, with a standard deviation of 2.56. The minimum number of the hospitals’ directors was 7 and the maximum 18.
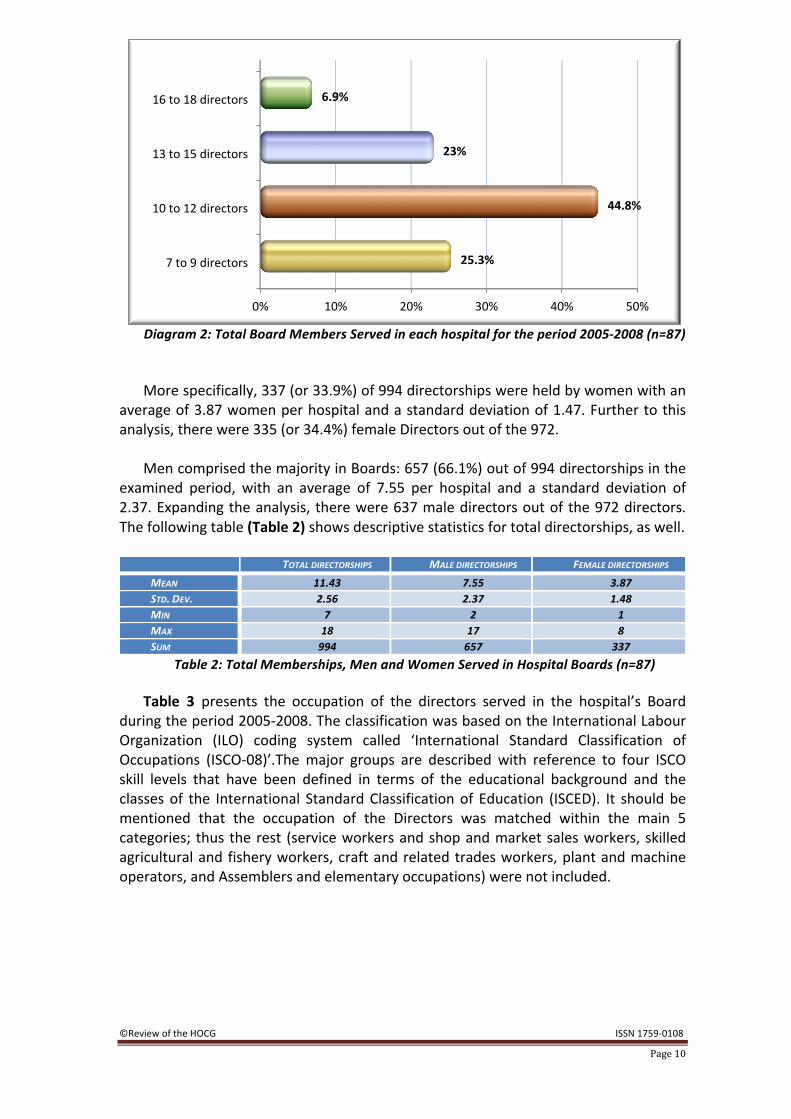
Diagram 2 illustrates the number of directors that served in the sampled hospitals
throughout the years. As it can be seen, the majority of the hospitals -‐ (39 or 44.8%, almost half) -‐ had from 10 to 12 directors in their boards implying that there were 1 to 5 new Directors appointed throughout the years depending on the Board size (7 or 9) as indicated by the corresponding law, whilst boards of 7 up to 9 members were 22 (25.3%). 26 hospitals or 29.9% had boards comprising of 13 up to 18 members throughout the examined period suggesting that there was mobility – either resignations or new appointments-‐ of the Board members.
It is worth mentioning that the total number of directors was 18 for three hospitals
(Sotiria, Amalia Fleming and Asklipieio Boulas) for the examined period. Surprisingly, women representation in boards was not scarce as it was documented in the Greek Listed companies, SOEs, maritime and football companies according to previous researches conducted by HOCG (2007, 2008, 2009 and 2010).
©Review of the HOCG ISSN 1759-‐0108
Page 10
Diagram 2: Total Board Members Served in each hospital for the period 2005-‐2008 (n=87) More specifically, 337 (or 33.9%) of 994 directorships were held by women with an
average of 3.87 women per hospital and a standard deviation of 1.47. Further to this analysis, there were 335 (or 34.4%) female Directors out of the 972.
Men comprised the majority in Boards: 657 (66.1%) out of 994 directorships in the
examined period, with an average of 7.55 per hospital and a standard deviation of 2.37. Expanding the analysis, there were 637 male directors out of the 972 directors. The following table (Table 2) shows descriptive statistics for total directorships, as well.
TOTAL DIRECTORSHIPS MALE DIRECTORSHIPS FEMALE DIRECTORSHIPS MEAN 11.43 7.55 3.87 STD. DEV. 2.56 2.37 1.48 MIN 7 2 1 MAX 18 17 8 SUM 994 657 337
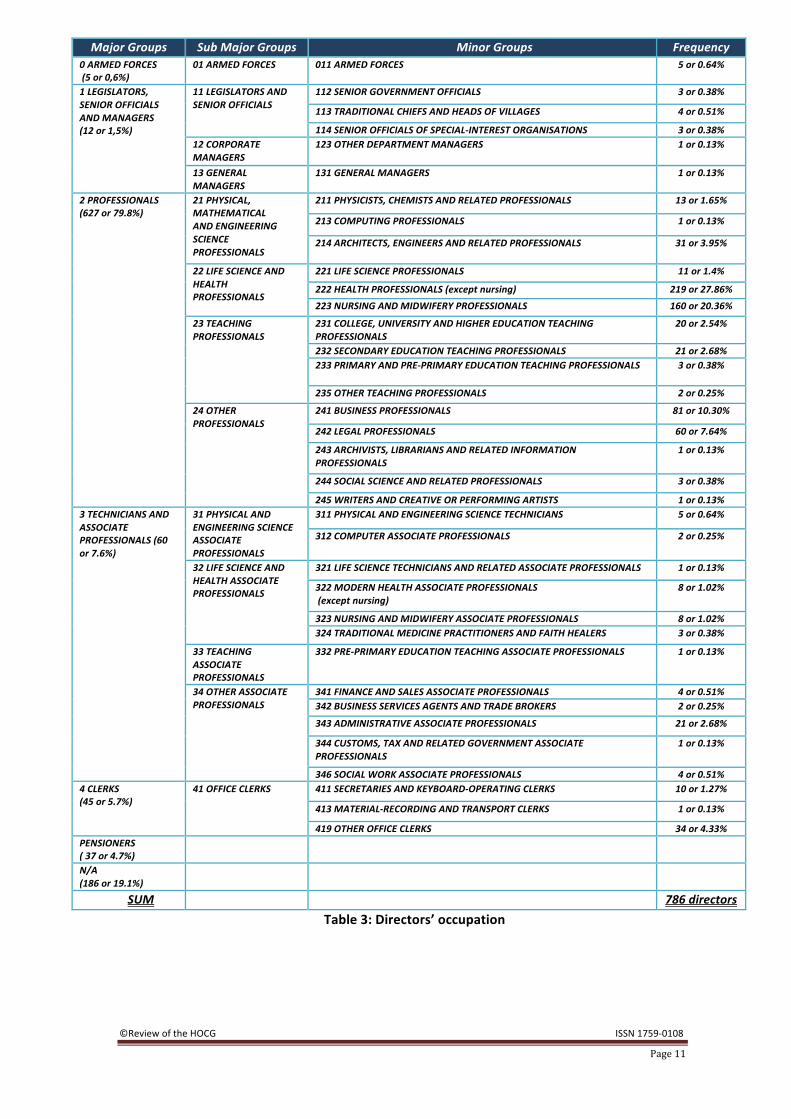
Table 2: Total Memberships, Men and Women Served in Hospital Boards (n=87) Table 3 presents the occupation of the directors served in the hospital’s Board
during the period 2005-‐2008. The classification was based on the International Labour Organization (ILO) coding system called ‘International Standard Classification of Occupations (ISCO-‐08)’.The major groups are described with reference to four ISCO skill levels that have been defined in terms of the educational background and the classes of the International Standard Classification of Education (ISCED). It should be mentioned that the occupation of the Directors was matched within the main 5 categories; thus the rest (service workers and shop and market sales workers, skilled agricultural and fishery workers, craft and related trades workers, plant and machine operators, and Assemblers and elementary occupations) were not included.
0% 10% 20% 30% 40% 50%
7 to 9 directors
10 to 12 directors
13 to 15 directors
16 to 18 directors
25.3%
44.8%
23%
6.9%
©Review of the HOCG ISSN 1759-‐0108
Page 11
Major Groups Sub Major Groups Minor Groups Frequency 0 ARMED FORCES (5 or 0,6%)
01 ARMED FORCES 011 ARMED FORCES 5 or 0.64%
1 LEGISLATORS, SENIOR OFFICIALS AND MANAGERS (12 or 1,5%)
11 LEGISLATORS AND SENIOR OFFICIALS
112 SENIOR GOVERNMENT OFFICIALS 3 or 0.38%
113 TRADITIONAL CHIEFS AND HEADS OF VILLAGES 4 or 0.51%
114 SENIOR OFFICIALS OF SPECIAL-‐INTEREST ORGANISATIONS 3 or 0.38% 12 CORPORATE MANAGERS
123 OTHER DEPARTMENT MANAGERS 1 or 0.13%
13 GENERAL MANAGERS
131 GENERAL MANAGERS 1 or 0.13%
2 PROFESSIONALS (627 or 79.8%)
21 PHYSICAL, MATHEMATICAL AND ENGINEERING SCIENCE PROFESSIONALS
211 PHYSICISTS, CHEMISTS AND RELATED PROFESSIONALS 13 or 1.65%
213 COMPUTING PROFESSIONALS 1 or 0.13%
214 ARCHITECTS, ENGINEERS AND RELATED PROFESSIONALS 31 or 3.95%
22 LIFE SCIENCE AND HEALTH PROFESSIONALS
221 LIFE SCIENCE PROFESSIONALS 11 or 1.4%
222 HEALTH PROFESSIONALS (except nursing) 219 or 27.86% 223 NURSING AND MIDWIFERY PROFESSIONALS 160 or 20.36%
23 TEACHING PROFESSIONALS
231 COLLEGE, UNIVERSITY AND HIGHER EDUCATION TEACHING PROFESSIONALS
20 or 2.54%
232 SECONDARY EDUCATION TEACHING PROFESSIONALS 21 or 2.68% 233 PRIMARY AND PRE-‐PRIMARY EDUCATION TEACHING PROFESSIONALS 3 or 0.38%
235 OTHER TEACHING PROFESSIONALS 2 or 0.25%
24 OTHER PROFESSIONALS
241 BUSINESS PROFESSIONALS 81 or 10.30%
242 LEGAL PROFESSIONALS 60 or 7.64%
243 ARCHIVISTS, LIBRARIANS AND RELATED INFORMATION PROFESSIONALS
1 or 0.13%
244 SOCIAL SCIENCE AND RELATED PROFESSIONALS 3 or 0.38%
245 WRITERS AND CREATIVE OR PERFORMING ARTISTS 1 or 0.13% 3 TECHNICIANS AND ASSOCIATE PROFESSIONALS (60 or 7.6%)
31 PHYSICAL AND ENGINEERING SCIENCE ASSOCIATE PROFESSIONALS
311 PHYSICAL AND ENGINEERING SCIENCE TECHNICIANS 5 or 0.64%
312 COMPUTER ASSOCIATE PROFESSIONALS 2 or 0.25%
32 LIFE SCIENCE AND HEALTH ASSOCIATE PROFESSIONALS
321 LIFE SCIENCE TECHNICIANS AND RELATED ASSOCIATE PROFESSIONALS 1 or 0.13%
322 MODERN HEALTH ASSOCIATE PROFESSIONALS (except nursing)
8 or 1.02%
323 NURSING AND MIDWIFERY ASSOCIATE PROFESSIONALS 8 or 1.02% 324 TRADITIONAL MEDICINE PRACTITIONERS AND FAITH HEALERS 3 or 0.38%
33 TEACHING ASSOCIATE PROFESSIONALS
332 PRE-‐PRIMARY EDUCATION TEACHING ASSOCIATE PROFESSIONALS 1 or 0.13%
34 OTHER ASSOCIATE PROFESSIONALS
341 FINANCE AND SALES ASSOCIATE PROFESSIONALS 4 or 0.51% 342 BUSINESS SERVICES AGENTS AND TRADE BROKERS 2 or 0.25%
343 ADMINISTRATIVE ASSOCIATE PROFESSIONALS 21 or 2.68%
344 CUSTOMS, TAX AND RELATED GOVERNMENT ASSOCIATE PROFESSIONALS
1 or 0.13%
346 SOCIAL WORK ASSOCIATE PROFESSIONALS 4 or 0.51% 4 CLERKS (45 or 5.7%)
41 OFFICE CLERKS 411 SECRETARIES AND KEYBOARD-‐OPERATING CLERKS 10 or 1.27%
413 MATERIAL-‐RECORDING AND TRANSPORT CLERKS 1 or 0.13%
419 OTHER OFFICE CLERKS 34 or 4.33% PENSIONERS ( 37 or 4.7%)
N/A (186 or 19.1%)
SUM 786 directors Table 3: Directors’ occupation
©Review of the HOCG ISSN 1759-‐0108
Page 12
Data was found for 786 (80.9%) out of the 972directors. In more detail, 627 (or 79.8%) directors were grouped as ‘Professionals’, occupations that require skills at the superior fourth ISCO skill level. Most of them belonged to the sub category ‘Life Science and Health Professionals’, whereas 379 (or 48.2%) were mainly doctors and nurses, a finding that indicates that almost half of the Board members were health professionals. Also, 81 (or only 10.3%) were ‘Business Professionals’ and 60 (or 7.6%) were ‘Legal Professionals’; these findings indicate that the percentage of board members that had business or legal academic background is small.
Moreover, 60 (7.6%) directors were incorporated in the major group ‘Technicians
and Associate Professionals’ and 45 Directors (or 5.7%) were distributed in the major Group – lower case ‘Clerks’. These professions are associated with individuals that perform mostly technical tasks and various clerical duties, require skills at the third and second ISCO skill level among the four ISCO skill levels.
Finally, only 12 Directors (1.5%) were distributed within the major group
‘Legislators, Senior Officials and Managers’ whereas, 37 (or 4.7%) were pensioners and 5 were grouped as armed force professionals.
It should be noted, that data on the occupation of 186 (19.1%) directors was not
available. It is also worth pointing out that the occupation of the majority of the hospital’s Governors was not mentioned in the issues NPDD and YODD of the Governmental Gazette. 4.2 Average Tenure of Board
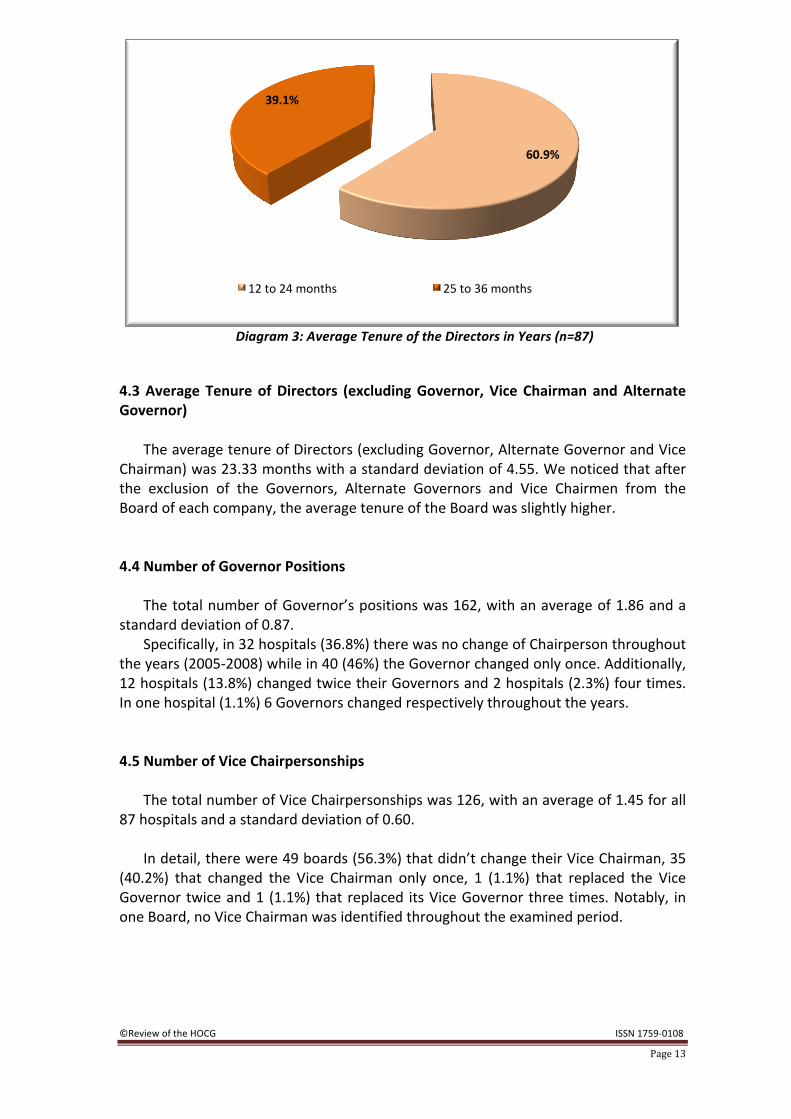
The average tenure of all directors in a board was 21.28 months with a standard
deviation of 3.26. In 53 (60.9%) hospitals the directors served the board from 1 to 2 years while in 34
or 39.1%, the members served for more than 2 years but they quit or got replaced in less than 36 months. Additionally, the minimum time that a board member had served was 13.9 months and the maximum 32.1 months (Diagram 3).
This finding is in agreement with the legislative framework–under the provisions of
the law 3329/2005, the tenure of all board members is two years. After the above mentioned period of two years, the employment of the members is ended automatically if it is not renewed by the relevant Ministry.
©Review of the HOCG ISSN 1759-‐0108
Page 13
Diagram 3: Average Tenure of the Directors in Years (n=87)
4.3 Average Tenure of Directors (excluding Governor, Vice Chairman and Alternate Governor)
The average tenure of Directors (excluding Governor, Alternate Governor and Vice
Chairman) was 23.33 months with a standard deviation of 4.55. We noticed that after the exclusion of the Governors, Alternate Governors and Vice Chairmen from the Board of each company, the average tenure of the Board was slightly higher. 4.4 Number of Governor Positions
The total number of Governor’s positions was 162, with an average of 1.86 and a
standard deviation of 0.87. Specifically, in 32 hospitals (36.8%) there was no change of Chairperson throughout
the years (2005-‐2008) while in 40 (46%) the Governor changed only once. Additionally, 12 hospitals (13.8%) changed twice their Governors and 2 hospitals (2.3%) four times. In one hospital (1.1%) 6 Governors changed respectively throughout the years. 4.5 Number of Vice Chairpersonships
The total number of Vice Chairpersonships was 126, with an average of 1.45 for all
87 hospitals and a standard deviation of 0.60. In detail, there were 49 boards (56.3%) that didn’t change their Vice Chairman, 35
(40.2%) that changed the Vice Chairman only once, 1 (1.1%) that replaced the Vice Governor twice and 1 (1.1%) that replaced its Vice Governor three times. Notably, in one Board, no Vice Chairman was identified throughout the examined period.
60.9%
39.1%
12 to 24 months 25 to 36 months
©Review of the HOCG ISSN 1759-‐0108
Page 14
4.6 Number of Alternate Governors According to the law 3329/2005, only hospitals with capacity of 400 organic beds
or above have Alternate Governors; hence, the hospitals that had Alternate Governors serving the Board were 27 (32.2%) out of the 87 hospitals examined.
The total number of Alternate Governors positions was 47. There were 10 boards
(11.5%) that didn’t change their Alternate Governor, 14 (16.1%) that changed the Alternate once and 3 (3.4%) that replaced their Alternate Governor twice. 4.7 Average Tenure of the Governors
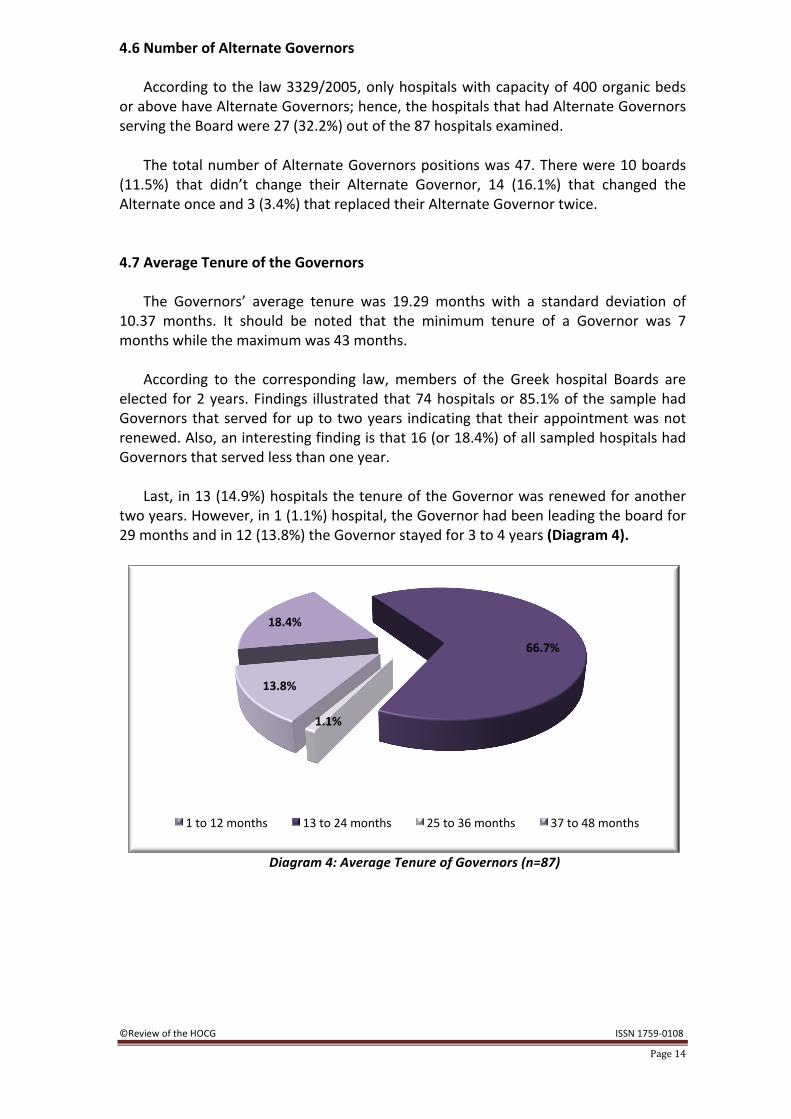
The Governors’ average tenure was 19.29 months with a standard deviation of
10.37 months. It should be noted that the minimum tenure of a Governor was 7 months while the maximum was 43 months.
According to the corresponding law, members of the Greek hospital Boards are
elected for 2 years. Findings illustrated that 74 hospitals or 85.1% of the sample had Governors that served for up to two years indicating that their appointment was not renewed. Also, an interesting finding is that 16 (or 18.4%) of all sampled hospitals had Governors that served less than one year.
Last, in 13 (14.9%) hospitals the tenure of the Governor was renewed for another
two years. However, in 1 (1.1%) hospital, the Governor had been leading the board for 29 months and in 12 (13.8%) the Governor stayed for 3 to 4 years (Diagram 4).
Diagram 4: Average Tenure of Governors (n=87)
18.4%
66.7%
1.1%
13.8%
1 to 12 months 13 to 24 months 25 to 36 months 37 to 48 months
©Review of the HOCG ISSN 1759-‐0108
Page 15
4.8 Average Tenure of Vice Chairman
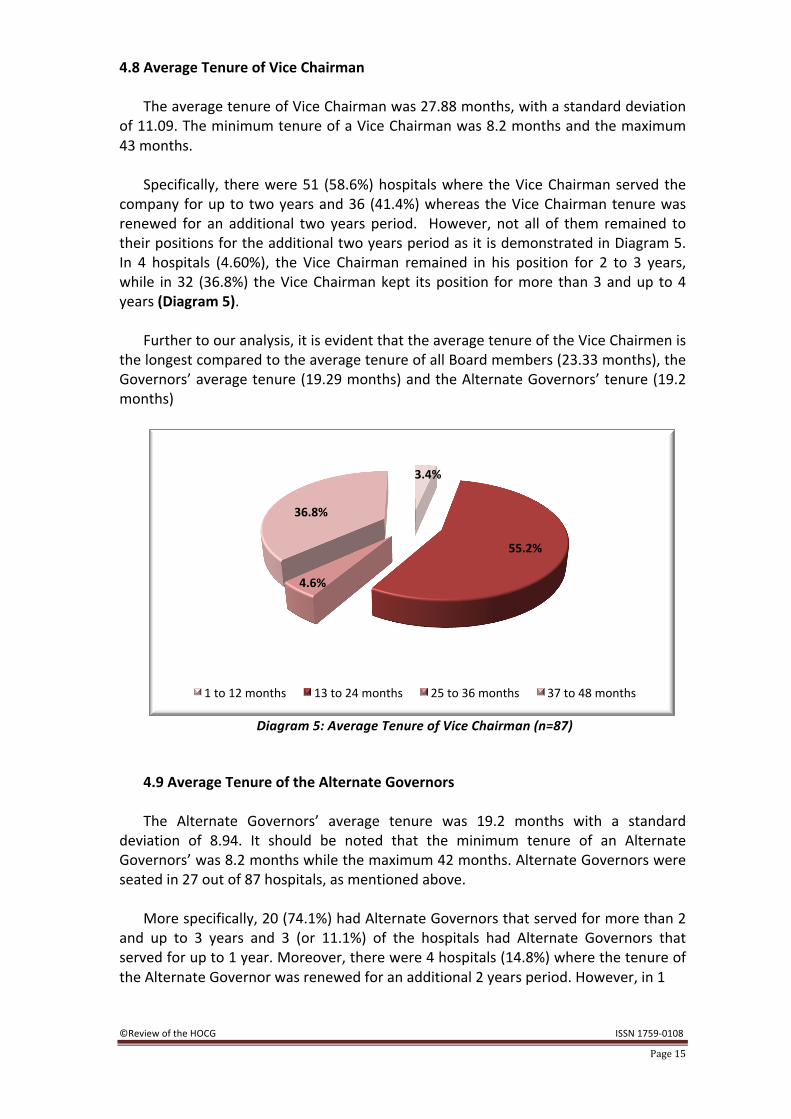
The average tenure of Vice Chairman was 27.88 months, with a standard deviation
of 11.09. The minimum tenure of a Vice Chairman was 8.2 months and the maximum 43 months.
Specifically, there were 51 (58.6%) hospitals where the Vice Chairman served the
company for up to two years and 36 (41.4%) whereas the Vice Chairman tenure was renewed for an additional two years period. However, not all of them remained to their positions for the additional two years period as it is demonstrated in Diagram 5. In 4 hospitals (4.60%), the Vice Chairman remained in his position for 2 to 3 years, while in 32 (36.8%) the Vice Chairman kept its position for more than 3 and up to 4 years (Diagram 5).
Further to our analysis, it is evident that the average tenure of the Vice Chairmen is
the longest compared to the average tenure of all Board members (23.33 months), the Governors’ average tenure (19.29 months) and the Alternate Governors’ tenure (19.2 months)
Diagram 5: Average Tenure of Vice Chairman (n=87)
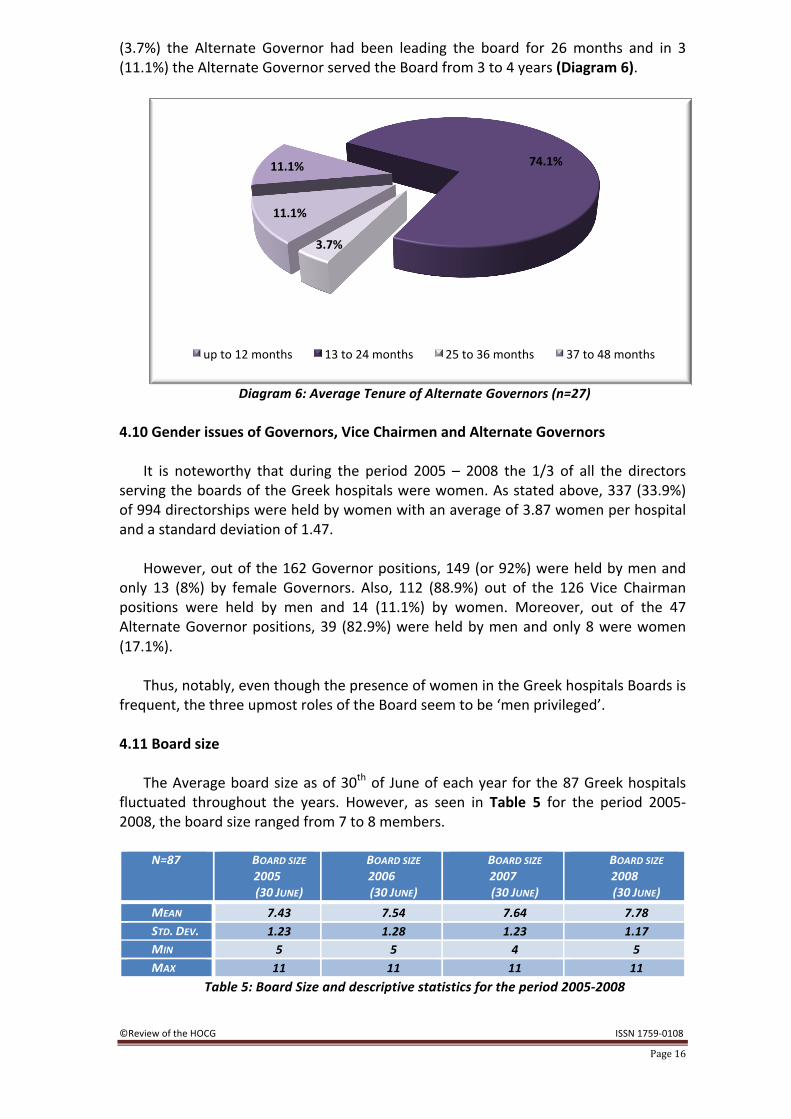
4.9 Average Tenure of the Alternate Governors The Alternate Governors’ average tenure was 19.2 months with a standard
deviation of 8.94. It should be noted that the minimum tenure of an Alternate Governors’ was 8.2 months while the maximum 42 months. Alternate Governors were seated in 27 out of 87 hospitals, as mentioned above.
More specifically, 20 (74.1%) had Alternate Governors that served for more than 2
and up to 3 years and 3 (or 11.1%) of the hospitals had Alternate Governors that served for up to 1 year. Moreover, there were 4 hospitals (14.8%) where the tenure of the Alternate Governor was renewed for an additional 2 years period. However, in 1
3.4%
55.2%
4.6%
36.8%
1 to 12 months 13 to 24 months 25 to 36 months 37 to 48 months
©Review of the HOCG ISSN 1759-‐0108
Page 16
(3.7%) the Alternate Governor had been leading the board for 26 months and in 3 (11.1%) the Alternate Governor served the Board from 3 to 4 years (Diagram 6).
Diagram 6: Average Tenure of Alternate Governors (n=27)
4.10 Gender issues of Governors, Vice Chairmen and Alternate Governors
It is noteworthy that during the period 2005 – 2008 the 1/3 of all the directors
serving the boards of the Greek hospitals were women. As stated above, 337 (33.9%) of 994 directorships were held by women with an average of 3.87 women per hospital and a standard deviation of 1.47.
However, out of the 162 Governor positions, 149 (or 92%) were held by men and
only 13 (8%) by female Governors. Also, 112 (88.9%) out of the 126 Vice Chairman positions were held by men and 14 (11.1%) by women. Moreover, out of the 47 Alternate Governor positions, 39 (82.9%) were held by men and only 8 were women (17.1%).
Thus, notably, even though the presence of women in the Greek hospitals Boards is
frequent, the three upmost roles of the Board seem to be ‘men privileged’. 4.11 Board size
The Average board size as of 30th of June of each year for the 87 Greek hospitals
fluctuated throughout the years. However, as seen in Table 5 for the period 2005-‐2008, the board size ranged from 7 to 8 members.
N=87 BOARD SIZE
2005 (30 JUNE)
BOARD SIZE 2006 (30 JUNE)
BOARD SIZE 2007 (30 JUNE)
BOARD SIZE 2008 (30 JUNE)
MEAN 7.43 7.54 7.64 7.78 STD. DEV. 1.23 1.28 1.23 1.17 MIN 5 5 4 5 MAX 11 11 11 11
Table 5: Board Size and descriptive statistics for the period 2005-‐2008
11.1% 74.1%
3.7%
11.1%
up to 12 months 13 to 24 months 25 to 36 months 37 to 48 months
©Review of the HOCG ISSN 1759-‐0108
Page 17
These findings are relatively similar to the average of the Board Size of the Greek listed companies in ATHEX, which was 7.8 for 2006 and 7.9 for both 2007 and 2008 (see HOCG 2007; 2008; 2009). 4.12 Average Board Size
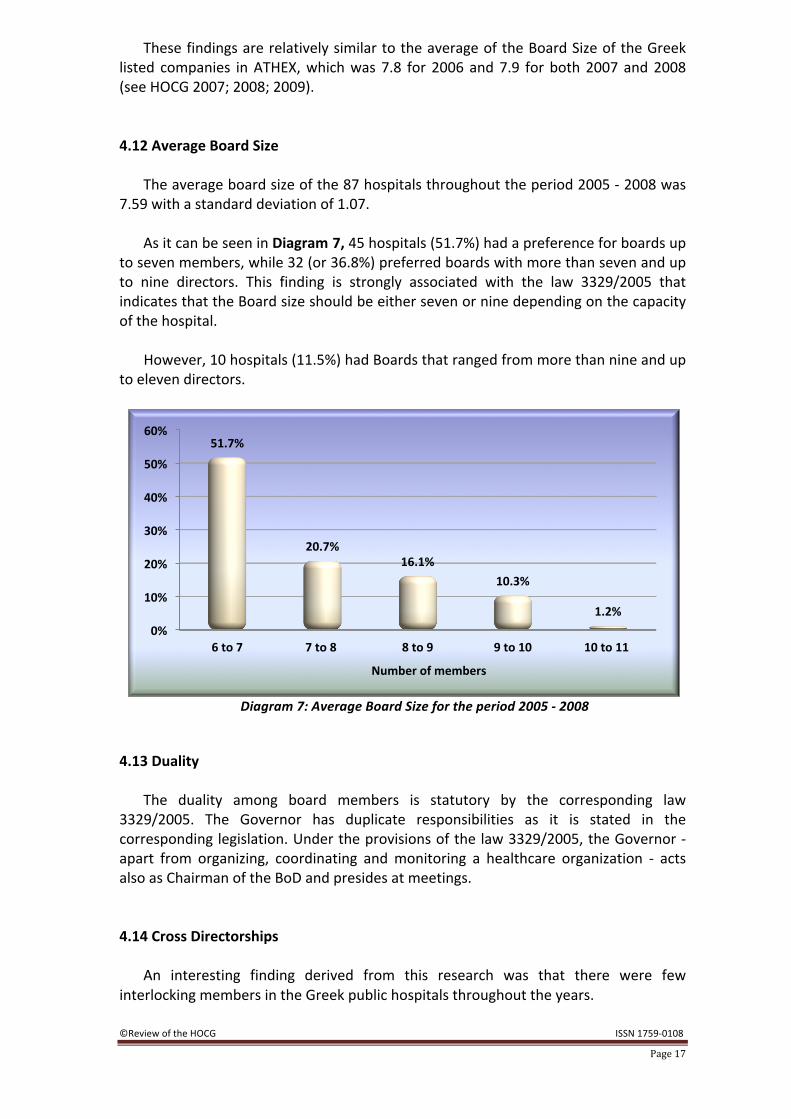
The average board size of the 87 hospitals throughout the period 2005 -‐ 2008 was
7.59 with a standard deviation of 1.07. As it can be seen in Diagram 7, 45 hospitals (51.7%) had a preference for boards up
to seven members, while 32 (or 36.8%) preferred boards with more than seven and up to nine directors. This finding is strongly associated with the law 3329/2005 that indicates that the Board size should be either seven or nine depending on the capacity of the hospital.
However, 10 hospitals (11.5%) had Boards that ranged from more than nine and up
to eleven directors.
Diagram 7: Average Board Size for the period 2005 -‐ 2008
4.13 Duality
The duality among board members is statutory by the corresponding law
3329/2005. The Governor has duplicate responsibilities as it is stated in the corresponding legislation. Under the provisions of the law 3329/2005, the Governor -‐ apart from organizing, coordinating and monitoring a healthcare organization -‐ acts also as Chairman of the BoD and presides at meetings. 4.14 Cross Directorships
An interesting finding derived from this research was that there were few
interlocking members in the Greek public hospitals throughout the years.
0%
10%
20%
30%
40%
50%
60%
6 to 7 7 to 8 8 to 9 9 to 10 10 to 11
51.7%
20.7% 16.1%
10.3%
1.2%
Number of members
©Review of the HOCG ISSN 1759-‐0108
Page 18
Some extreme findings were evident. Out of the 994 directorships, 10 directorships were held by 4 directors who possessed simultaneously two or more positions in different hospital’s boards. More specifically, 1 director held positions in 4 different boards, while the other 3 directors served in two hospitals.
Last but not least, mobility among different Boards was identified. There were 15
directors who served in several different hospital Boards throughout the examined period. It is worth mentioning that one of them had served in three and the other 14 in two different Boards.
In total, these 19 Directors were holding 43 Directorships in 28 hospitals. According
to these facts, it is revealed that the total number of Directors was 972. 5. Summary
This study’s main aim is to reveal some important elements of the corporate
governance practices and characteristics of the Board of Directors of Greek public hospitals during the period 2005-‐2008. As mentioned in the introduction, the BoDs of the hospitals comprised of: the Governor (acting as Chairman of the BoDs), the Vice Chairman, the Alternate Governor and the various members. The Governor and the Alternate Governor are full time members, while the Vice Chairman and all other members are part time members.
Results show that the turnover of board members was on average 22 months,
while the average tenure of Governors was 19.29 months, of Vice Chairman 27.88 and of Alternate Governors 19.2 months.
Notably, the most significant finding is the presence of female directors. The
percentage of women serving as members of Hospitals’ Boards is the highest compared to all other types of Boards studied by the HOCG; nearly 1/3 of all board members are women. However, even though the presence of women in Greek hospital Boards is significant, the positions of Governor, Vice Chairman, and Alternate Governor of the Board are still held only by men.
Despite a slight increase, the average board size of hospitals has not significantly
changed from 2005 to 2008. This finding implies that the hospitals have complied with the provisions of law no: 3329/2005 relating to board size, which according to the law is dependent on hospital bed capacity.
Another important element of the governing body of the hospitals is the duplicate
role of the Governor who acts as Chairman of the Board; a role that has been set by legislative framework.
In conclusion, the current hospital governance mechanism in Greece is highly regulated; government intervention is severe. The approaches to improve hospitals performance including access to services and the quality of health care are many. As to which practises ought to be used is a debated issue in Greece.

©Review of the HOCG ISSN 1759-‐0108
Page 19
In an attempt to improve board performance, we ought to consider allowing boards operating as independent entities which are fully responsible for their actions. Members to be chosen based on their abilities rather than their associations who operate with clear hospital performance measures in mind and who in the end are evaluated by the people who use hospital services.
Note: It is essential to clarify the terms of ‘directorship’ and ‘director’. When we refer to a ‘director’ we mean
the individual who serves the Board, while by using the word ‘directorship’ we state the position held by the director.
References
Ballas, A. and H. Tsoukas, (2004) “Measuring nothing: The case of the Greek National Health System”, Human Relations, Vol. 57 (6), pp. 661-‐690 Economou, C. and Giorno, C (2009), “Improving the Performance of the Public Health Care System in Greece”, OECD Economics Department Working Papers, No. 722, OECD Publishing HOCG (2007), “Review of the Hellenic Observatory of Corporate Governance, 1st Annual Study of Greek Listed Companies”, Vol. 1 (1), pp. 1-‐14, Available from: http://www.hocg.eu/ HOCG (2008), “Review of the Hellenic Observatory of Corporate Governance, 2nd Annual Study of Greek Listed Companies”, Vol. 2 (1), pp. 1-‐17, Available from: http://www.hocg.eu/ HOCG (2008), “Review of the Hellenic Observatory of Corporate Governance, 1st Annual Study of Greek SOEs”, Vol. 2 (2), pp. 1-‐15, Available from: http://www.hocg.eu/ HOCG (2008), “Review of the Hellenic Observatory of Corporate Governance, 3rd Annual Study of Greek Listed Companies”, Vol. 3 (1), pp. 1-‐22, Available from: http://www.hocg.eu/ HOCG (2008), “Review of the Hellenic Observatory of Corporate Governance, 2nd Annual Study of Greek SOEs”, Vol. 3 (2), pp. 1-‐16, Available from: http://www.hocg.eu/ HOCG (2008), “Review of the Hellenic Observatory of Corporate Governance, 1st Annual Study of Greek Maritime Companies”, Vol. 3 (3), pp. 1-‐16, Available from: http://www.hocg.eu/ HOCG (2008), “Review of the Hellenic Observatory of Corporate Governance, 1st Annual Study of Greek Football Clubs”, Vol. 4 (1), pp. 1-‐17, Available from: http://www.hocg.eu/ Kaufmann, D, Kraay, A, and Mastruzzi, M. (2009), “Governance Matters VIII, Aggregate and Individual Governance Indicators 1996–2008”, World Bank Policy Research Working Paper, No. 4978. Washington, D.C. Available from: http://papers.ssrn.com/sol3/papers.cfm?abstract_id=1424591 Marshall, A. (1890). Principles of Economics, First edition. London: Macmillan Organization for Economic Co-‐operation and Development OECD, (2009), “OECD Economic Surveys: Greece”, OECD, ParisAvailable from: http://www.oecd-‐ilibrary.org/economics/oecd-‐economic-‐surveys-‐greece_19990286;jsessionid=a05esa9hnfci.delta

©Review of the HOCG ISSN 1759-‐0108
Page 20
The World Health Organization (WTO), (2008a), “The World Health Report 2008, Primary Health Care, Now More than Never”, World Health Organization, Geneva Available from: http://www.who.int/whr/2008/en/index.html The World Health Organization (WTO), (2008b), “Health System Governance, Tooklit on monitoring health systems strengthening”, World Health Organization, Geneva Available from: http://www.who.int/healthinfo/statistics/toolkit_hss/en/index.html
Dr. Dimitrios N. Koufopoulos of Brunel Business School is the Scientific Director of the HOCG and Editor of the Review (www.hocg.eu)
Project Leader: Evdokia Ch. Tsoni Project Members: Vasilios Th. Zoumbos, Niki Agalioti, Ioannis P. Gkliatis, Antonios Kallias, Maria Argyropoulou, Kotsas Kallias and Aspasia Pastra have been assisting in the collection and analysis of the data.
Disclaimer: The views expressed in this newsletter are those of the authors of the research and not those of the Brunel University, Brunel Business School and the Federation of the Greek Industries and Enterprises.