Embed Size (px)
Citation preview

GreeSE Papers
Hellenic Observatory Discussion Paperson Greece and Southeast Europe
Paper No. 135
April 2019
Financing economic activity in Greece:Past challenges and future prospects
Helen Louri and Petros Migiakis

All views expressed in this paper are those of the authors and do not necessarily represent the views of the Hellenic Observatory or the LSE ©Helen Louri, Petros Migiakis
Financing economic activity in Greece: Past challenges and future prospects
Helen Louri and Petros Migiakis
GreeSE Paper No.135
Hellenic Observatory Papers on Greece and Southeast Europe

ii
Contents
Abstract __________________________________________________________________iii
1. Introduction_____________________________________________________________1
2. The Greek banking sector: some stylised facts__________________________________2
2.1 Greek banks’ balance sheets before and after the Global Financial Crisis _______ 2
2.2 Official support: recapitalisation and central bank liquidity provision __________5
2.3 NPLs and effects on credit provision and on the Greek economy______________10
3. Bank soundness and credit provision________________________________________14
3.1 The empirical setup__________________________________________________14
3.2 Findings ___________________________________________________________16
4. Bank credit, market financing and growth ____________________________________19
4.1 The empirical setup__________________________________________________19
4.2. Findings___________________________________________________________22
5. Concluding Remarks and Policy Implications __________________________________26

iii
Financing economic activity in Greece: Past challenges and future prospects
Helen Louri* and Petros Migiakis
ABSTRACT
We examine the existence of a feedback loop between the resilience of the financial sector and Greek economic activity. A sequence of structural VARs is employed using data for bank credit, liquidity, capital, asset quality and private demand in 2001-2018in two data sets. One in monthly frequency with which we examine the determinants of credit provision by Greek banks, and another in quarterly frequency with which we examine the finance-growth nexus for the Greek economy. We find that (a) the deterioration in the quality of Greek banks’ balance sheets affected negatively the provision of credit to the economy, (b) central bank liquidity and recapitalisations of Greek banks provided only a partial remedy and (c) the decline in credit significantly weakened economic activity. Also, we find that there is a role for market financing of the economy but this cannot substitute for the predominantly bank-based financing. Therefore, as the Greek economy starts bouncing back Greek banks have an important role to play, first by solving the high NPLs problem and providing the necessary credit and second by improving the efficiency of capital allocation towards a sustainable growth model.
Keywords: Greek crisis; credit provision; finance-growth nexus; financial stability; NPLs.
Acknowledgement: We wish to thank participants at the “Greece and the Euro: From Crisis to Recovery” conference (Tufts University, Boston, April 2019) for their insightful comments and suggestions. Research support from the Research Centre of the Athens University of Economics and Business (EP-2225) is gratefully acknowledged. The views expressed are our own and not necessarily shared by the institutions we are affiliated with. Any errors remain our responsibility. ___________________________ * Athens University of Economics and Business, Department of Economics & London School of Economics EI/HO; [email protected] Bank of Greece, Economic Analysis and Research Department; [email protected]

1
1. Introduction
The Schumpeterian view that the financial system may promote economic growth was neglected in the standard econometric modeling, but also in the policy-making setup before the Global Financial Crisis (GFC). Analytical tools used for providing input to economic policy all but ignored the role of finance for the economy. For instance, the Taylor rule dictates that interest rates should be determined by a neutral real rate, a target for the inflation rate, the output gap and the deviation of inflation from the target, with error-correction properties; no role for bank credit or market financing. Likewise, financial variables were not incorporated in economic activity models; at best, as is the case of New-Keynesian DSGE models which dominated the toolboxes of central banks and other policy-making institutions, standard modeling practices allowed for financial effects on economic activity to be accommodated just as constraints or accelerators, termed ‘financial frictions’, of established macroeconomic relationships (Bernanke et al. 1999; Iacoviello 2005).
All in all, mainstream theory paid no attention to views arguing for an important role of finance for the economy, nor was it adjusted according to pre-GFC empirical evidence provided by several studies about the existence of a ‘finance-growth nexus’ (Beck et al. 2000; Caldéron and Liu, 2003; Beck and Levine, 2004). Then came the crisis and finance made its way into macroeconomic modeling with a burst. It was the burst of the subprime mortgage market that set off the crisis in the US. After that, the slowdown in the American economy intensified to a degree that could not be explained by standard macroeconomic models, even if they were adjusted to capture global spillover effects.
In the wake of the GFC empirical evidence started building up doubts on fundamental assumptions of workhorses of macroeconomic analysis. Thus, the usefulness of a Taylor rule without financial variables has been questioned (BIS, 2016, pp. 78-79). Likewise, the working of the Philips curve (among others, Farmer and Nicolò, 2018), the concept of a potential level of output (Williams, 2017) and even the tool used for anticipating that the economy will adjust to its trend (Hamilton, 2018) they have all been questioned and put under scrutiny. On the other hand, using financial variables for forecasting economic ones has started to be considered a standard practice (Espinoza et al., 2012), while the DSGE modeling framework has been adjusted for effects (more important than simple frictions) stemming from finance to the economy (Galvaoet al., 2016, Christiano et al.,2014, Clerc et al. 2015). So, the concept that financial variables are significantly related to economic activity by preceding or even causing growth has been one of the net gainers of the GFC.
At present, empirical research focuses on assessing the impact of financial variables on economic activity, but also on revealing the mechanism(s) through which economic activity is affected. Borio (2014) provides evidence on the effects of finance on the economy: fluctuations in economic activity may either be smoothed down by anti-cyclical financial flows or be intensified, if a slowdown in the economy is coupled with a deceleration of funding or even a burst of financial imbalances. In the same context, credit-to-GDP is also found to have a significant cyclical component which is attributed to financial cycles that are found to exceed in length economic cycles. Finally, the case of a sovereign debt crisis that resulted in credit

2
contraction and a slowdown to economic activity has already been documented in the empirical literature following the GFC (Bofondi et al. 2018).
In light of the recent reconsideration of the link between finance and growth we make an attempt in this study to examine the role of financing for economic activity in Greece. We deal mainly with two questions: (a) whether and by how much the resilience of banks determines credit provision to the economy and (b) how net inflows/outflows of bank credit or market financing weigh on economic activity. We examine these questions with regard to the Greek economy before and after the GFC aiming to draw conclusions that could be useful to policy makers, especially with respect to achieving objectives such as the restructuring of the Greek economy towards a higher value added and extrovert production model.
We rely on reduced form vector autoregressions (VARs) with structural characteristics, i.e. we form a sequence of structural VAR (SVAR) models for addressing our questions. In a nutshell, we show that the bank-dominated Greek economy has indeed been impaired by the lack of bank credit along with impairments brought about by the crisis on banks’ balance sheets. In particular, we find that (a) the hike in non-performing loans dampened credit provision, while the central bank partially cured this negative effect with the provision of ample liquidity and (b) bank credit positively affects private demand and its effect on investment is even more pronounced. Moreover, we find that market financing is a weak remedy for the lack of bank credit. As a result our evidence supports policy proposals for an effective and fast treatment of the problem of the high stock of NPLs in Greek banks’ balance sheets through the creation of asset management companies or asset protection schemes (Bank of Greece, 2019). Such policy actions may contribute to a permanent positive shock on Greek GDP.
The rest of the paper is structured as follows. Section 2 outlines milestones as well as important details with regard to developments in the Greek financial sector since 2001, the time Greece joined the euro area. Section 3 presents results from an empirical examination of the relationship between the quality of banks’ balance sheets and bank credit. Section 4 presents empirical evidence on the relationship between bank credit, market financing and economic activity. Section 5 outlines the policy implications of our findings and concludes.
2. The Greek banking sector: some stylised facts
2.1 Greek banks’ balance sheets before and after the Global Financial Crisis
Greece experienced by far the most intensive domestic crisis in the aftermath of the GFC. Although the Greek crisis followed the GFC it was not a result of the same causes. The Greek financial sector was resilient, whereas the position of the Greek public sector, and in particular the outlook of refinancing the Greek public debt, worsened initially along with other sovereigns’ and then deteriorated much more. In particular, the GFC sparked a re-pricing of risks worldwide (Malliaropulos and Migiakis, 2018) which found the Greek state with high fiscal deficits and high public debt within an environment of pessimistic self-fulfilling expectations (de Grauwe and Ji, 2013).

3
With the Greek economy being predominantly a bank-based one the banking sector was, by and large, considered a national champion. Greek banks in 2008-2009, had a wide enough deposit base (more than €245 bln in deposits, i.e. around 100% of the GDP at that time), which was transformed to longer-term assets, such as houses and equipment, via credit provision to the economy and a healthy stream of income (net interest income at 4.4% of the risk-weighted assets or around 3% of total assets). Also, they were among the best capitalised banks in Europe with a capital adequacy ratio of around 12% (Table 1), while they were not exposed to credit derivatives, such as CDOs, and securitisations to the same degree as the average European bank. Moreover, they had differentiated their operations and earnings sources by expanding their activities to South Eastern European countries while in 2008 private debt-to-GDP at around 100%was significantly lower than the EU average (150%). So, at the onset of the GFC Greek banks looked healthy and resilient.1
Table 1: Key figures of the Greek banking sector 2001-2018, %
Year
Market structure
CR(5)
Capital adequacy
Quality of assets Performance Liquidity
CtA CAR Provisions NPLs Margin NII RoA Loans-to-Deposits
Liquidity coverage
2001 66.7 8.5 - 3.5 - - 2.3 1.4 56.6 -
2007 67.7 6.1 11.3 3.3 6.0 3.9 3.2 1.0 82.2 47.9
2009 69.2 5.0 11.9 2.7 8.1 2.4 2.5 0.3 81.6 47.9
2012 79.5 3.8 6.5 8.0 24.9 2.7 1.8 -2.6 118.6 85.0
2015 95.2 8.4 11.1 17.5 44.6 4.2 1.8 -0.3 117.5 40.5
2018 97 11.1 17.2* 21.6 46.7 4.8 1.9* -0.3* 114.4 25.3
Note: ‘CR(5)’ is the concentration ratio estimated based on the market shares of total assets of the 5 largest banks; ‘CtA’ refers to the ratio of capital to total assets (broad definition); ‘CAR’ refers to the group capital adequacy ratio; ‘Provisions’ is the ratio of provisions for bad debts as percentage of the loans to the non-financial sector; ‘NPLs’ is non-performing loans as a ratio of total loans; ‘Margin’ refers to the difference between accrued interest in loans to the non-financial sector and the accrued interest in deposits of the non-financial sector; ‘NII’ refers to the net interest income as percentage of total assets; ‘RoA’ refers to the return on assets based on earnings, without one-off operations; ‘LtD’ is the loans-to-deposits ratio of the non-financial private sector; ‘Liquidity coverage’ refers to the ratio of liquid assets (broad definition) to short-term liabilities. Data accompanied with an asterisk (*) refer to the end of 2017, as Greek banks’ income statements data are not yet available for end-2018. Source: Bank of Greece.
While the fundamentals of Greek banks remained resilient during the GFC, the Greek banking sector was eventually impaired by the Greek public debt crisis. In particular, the crisis that hit the Greek banks initially was a result mainly of the wide re-pricing of risks and the sovereign- 1 However, between 1999 and 2009 the debt-to-GDP ratio was increasing at a rate almost double the euro area average (ECB, 2017).

4
bank negative feedback loop.2These factors were enough to freeze interbank money market activity (Engler and Steffen, 2015) even for the largest and most creditworthy banks globally. At the same time uncertainty over the future of Greece in the euro area increased the ‘redenomination risk’ as perceived by depositors who started withdrawing deposits from Greek banks. Between 2009 and 2012 banks lost almost 40% of their deposits (around €90 bln) mostly to banks outside Greece.
However, what followed was not in line with developments in other euro area or developed economies. On top of the weaknesses in interbank lending, the outbreak of the Greek public debt crisis provided the ground for a series of rating downgrades that drifted downwards both the ratings of assets provided as collateral by Greek banks in ECB’s monetary policy operations and the banks’ own ratings, due to ‘country ceiling’ limits. Therefore, the public debt crisis that unfolded in Greece led to credit rating downgrades of both the Greek state and Greek banks. On the other hand, as shown in Figure 1, due to the good fundamentals of Greek banks their ratings became higher than the ratings of the Greek state between 2010 and 2013. This unusual development indicates that, at least at the initial phase of the Greek crisis, Greek banks’ rating downgrades were mostly the result of the lower country ceiling due to the high country-specific risk rather than due to a worsening of idiosyncratic, i.e. bank-specific or sector-specific factors.
Figure 1: Ratings of Greece and Greek banks, 2001-2018
Note: The chart shows the development of the rating of Greece and the cross-section average of ratings of the four systemic Greek banks (NBG, Alpha, Eurobank and Piraeus Bank). Each line represents the average of ratings assigned by S&P’s, Moody’s and Fitch, at the end of the year. Source: Thomson Reuters.
2 Gennaioli et al. (2018) document the functioning of the sovereign-bank nexus for 191 countries and 20 cases of sovereign defaults; Dell’ Aricciaet al. (2018) and Fratzscher and Rieth (forthcoming), among others, provide evidence for euro-area countries.

5
In 2011-2012 the effect of the Greek public debt crisis became even more intensive as uncertainty about the viability of Greece’s membership in the euro area accumulated and peaked during the period from the announcement to the implementation of the Greek debt restructuring.3Although the PSI and PSI+ eventually helped alleviate the pressure on Greek sovereign bond yields4 the total losses reported on Greek banks’ balance sheets were severe (around €45bln).For instance, as shown in Table 1 above, the return-on-assets of Greek banks stood at -2.6% for the fiscal year 2012, while their capital adequacy was undermined, as capital-to-total assets fell on average by more than 50% in 2012.
2.2 Official support: recapitalisation and central bank liquidity provision
The restructuring of the Greek public debt undermined the capital adequacy of Greek banks. Therefore, they had to be recapitalised by using the funds foreseen in the Memorandum of Understanding (MoU) for the 2nd Economic Adjustment Program of Greece, which was agreed between the Greek government and the European Financial Stability Facility (EFSF) in March 2012. For this purpose an amount of €50 bln had been earmarked to support the Greek banking sector. The recapitalisation (using half of the total foreseen amount together with some private funds) resulted in bringing the capital ratios of Greek banks back to among the highest in the euro area. Another €18 bln were used for the resolution of capital-deprived non-systemic banks.
However, what was not possible at the time to be adequately taken into account in the funding agreement between the Greek government and its lenders was the continuation of the deterioration of the quality of assets held by Greek banks. Non-performing loans rose during the crisis and almost doubled between 2012 and 2018.5 That meant that the legacy of the crisis, the ensuing deep recession and the political uncertainty together with the opportunistic behavior of strategic defaulters eroded further the capital base of Greek banks. Thus, while in February 2015 €11 bln were returned to the EFSF, as they were deemed unnecessary for the purpose of recapitalising Greek banks, €10 bln were eventually ‘earmarked’ again in the European Stability Mechanism Program of August 2015 (3rd Program) and used for another recapitalisation.6
Although deposits which were the main source of liquidity for Greek banks since 2001were flying away from the Greek banking system and despite the systemic hurdles in the money market across the globe, Greek banks remained active as borrowers in the interbank money market during the GFC. Eventually, since the Greek debt crisis erupted interbank lending to
3The initial announcement of the intension to make private investors pay for holding Greek sovereign debt was officially made in spring 2011, while the debt restructuring was realised in two phases: the first, in February to April 2012, with the PSI (private sector involvement) in the restructuring of GGBs and the second with the buyback (PSI+) of December 2012. 4 For instance, 10-year GGB yields declined from 16.4% in January 2012 to 6.2% in January 2013. 5For the issue of NPLs in the euro area interested readers may refer to Anastasiouet al. (2019), while for the issue of strategic default in Greece, see Asimakopoulos et al. (2016). 6 On 29 August 2018, the amount that had been used for the purposes of bank recapitalisation stood at €5.4 bln (see: https://www.esm.europa.eu/sites/default/files/greece_exit_factsheet.pdf, retrieved on 5 March 2019).
6
Greek banks followed an almost uninterrupted downward trend, to stabilise only as of mid-2016 (Figure 2).
Figure 2: Interbank liquidity borrowed by Greek banks 2001-2018
Source: Bank of Greece.
Under these conditions, a potential lack of liquidity could build up to a full-scaled bank run, as demands for deposit withdrawals escalated especially in periods of increased uncertainty about the country’s participation in the euro area, (fear of Grexit). In this context, Greek banks resorted heavily to borrowing liquidity from the central bank. As shown in Figure 3 the provision of central bank liquidity was mainly used to cover the reduction of the deposit base of Greek banks and has been a crucial factor for avoiding the escalation of instability. Deposit withdrawals stabilised to a large extent following the implementation of capital controls in June 2015.Since then, the provision of liquidity by the ECB to Greek banks has been downsized and in 2018 fallen to the lowest level since Greece joined the euro area.
The provision of liquidity to the Greek banking system by the ECB (through monetary policy operations) and the Bank of Greece (through emergency liquidity assistance) has been a crucial factor for avoiding the intensification of the banking crisis. What has not been documented yet is that there was also a negative feedback loop from the crisis to the ability of Greek banks to borrow from the Eurosystem. In particular, the Greek public debt crisis and the ensuing recession undermined the quality of assets held by the Greek banks. This development was directly worsening the prospect of Greek banks to resort to central bank liquidity. The reason was that the deterioration in quality and the decrease in market value of assets held by Greek banks also meant that both the quality and the value of the respective collateral, which was

7
Figure 3 The deposit flight and central bank liquidity provision to Greek banks 2009-2018
Source: Bank of Greece.
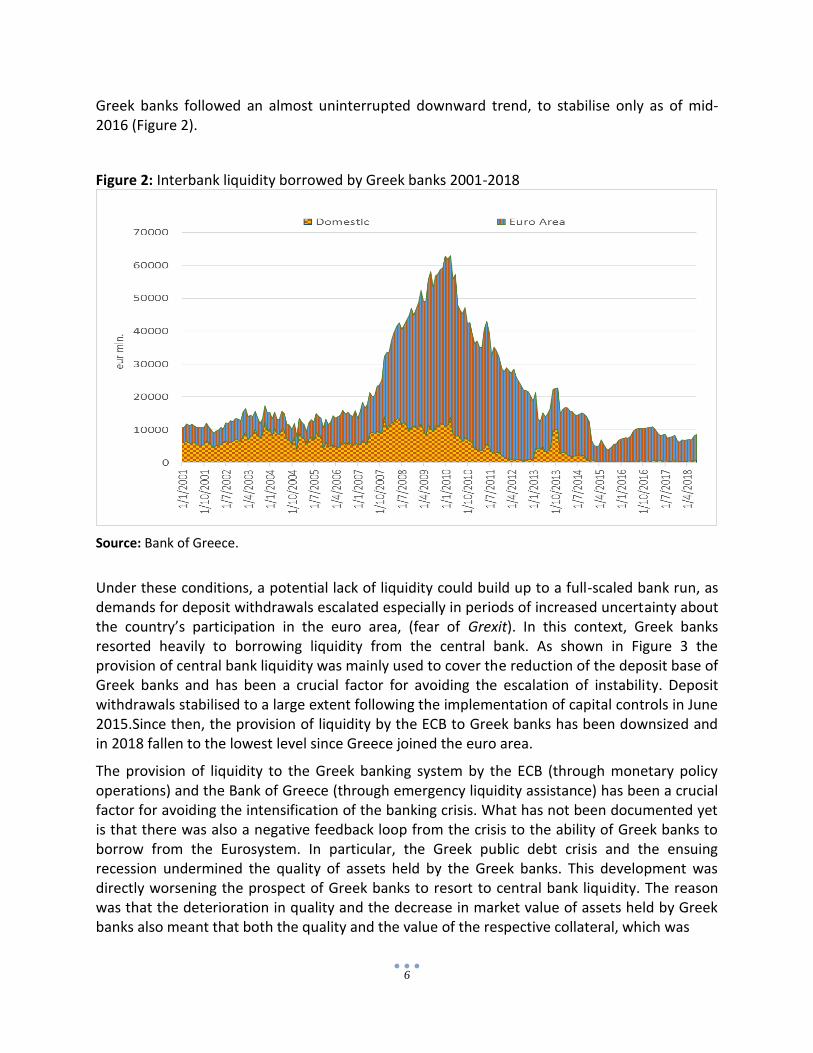
used for borrowing in the Eurosystem monetary policy operations, suffered likewise. This is shown by the blue bars in the bottom panel of Figure 4.
The effect of market developments on Greek banks’ ability to absorb central bank liquidity through monetary policy operations intensified with the restructuring of the Greek public debt. The PSI eroded not only the capital base of Greek banks as we have already mentioned, but also the value of Greek government bonds that could be used as collateral to cover monetary policy operations. As a result, loans to the private non-financial sector comprised the main pool of assets that remained in Greek banks’ balance sheets in order to be pledged for liquidity absorption by the central bank. However, according to the standing rules for collateral in monetary policy operations these assets did not meet various thresholds, apart from being of appropriately good credit quality, in order to cover liquidity borrowing from the ECB.7 So, Greek banks rapidly increased their resort to the more expensive emergency liquidity assistance (ELA) from the Bank of Greece.
7 Assets used as collateral must meet minimum value thresholds, originate from specific types of borrowers and be of specific categories of assets (see, ECB 2015).
8
Figure 4: Eurosystem liquidity provision to Greek banks 2009-2018
Source: Bank of Greece, monthly financial statements.
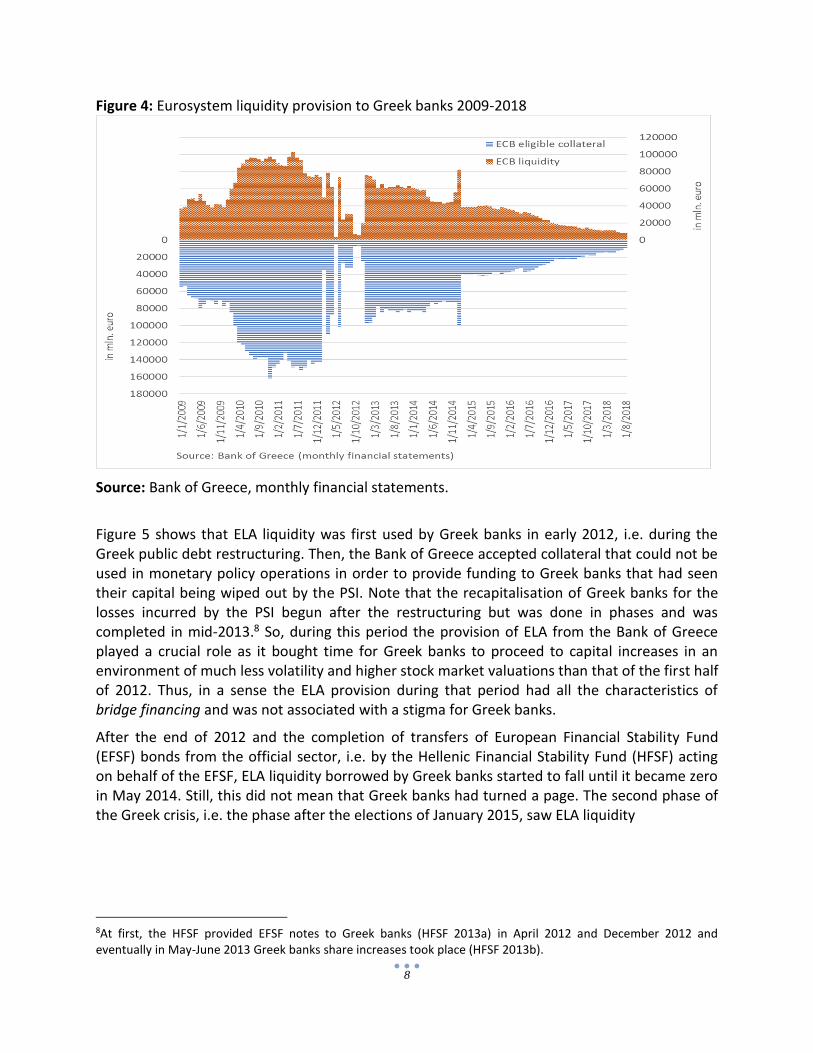
Figure 5 shows that ELA liquidity was first used by Greek banks in early 2012, i.e. during the Greek public debt restructuring. Then, the Bank of Greece accepted collateral that could not be used in monetary policy operations in order to provide funding to Greek banks that had seen their capital being wiped out by the PSI. Note that the recapitalisation of Greek banks for the losses incurred by the PSI begun after the restructuring but was done in phases and was completed in mid-2013.8 So, during this period the provision of ELA from the Bank of Greece played a crucial role as it bought time for Greek banks to proceed to capital increases in an environment of much less volatility and higher stock market valuations than that of the first half of 2012. Thus, in a sense the ELA provision during that period had all the characteristics of bridge financing and was not associated with a stigma for Greek banks.
After the end of 2012 and the completion of transfers of European Financial Stability Fund (EFSF) bonds from the official sector, i.e. by the Hellenic Financial Stability Fund (HFSF) acting on behalf of the EFSF, ELA liquidity borrowed by Greek banks started to fall until it became zero in May 2014. Still, this did not mean that Greek banks had turned a page. The second phase of the Greek crisis, i.e. the phase after the elections of January 2015, saw ELA liquidity
8At first, the HFSF provided EFSF notes to Greek banks (HFSF 2013a) in April 2012 and December 2012 and eventually in May-June 2013 Greek banks share increases took place (HFSF 2013b).
9
Figure 5: Provision of ELA liquidity from the Bank of Greece to the Greek banks 2012-2018
Source: Bank of Greece, monthly financial statements. skyrocketing as soon as the waiver of collateral quality threshold that had been provided by the ECB at the end of 2012 was pooled back.9
Combined with the intensified concerns about the prospects of the country as a member of the euro area, it resulted in a complete loss of investor and depositor confidence towards Greek banks. Eventually, in order to avert the prospect of a run on banks’ deposits, the government had to impose controls on capital outflows in late-June 2015. The banks had already lost another €40 bln of deposits between January and June 2015 and deposits were close to €120 bln almost half of their value in 2009. At least as far as liquidity needs are concerned, this time marks the darkest hour of the Greek banking system, as Greek banks found themselves owing vast amounts of money to the central bank. But this time there was no more official support that could ensure the continuation of liquidity provision. Actually, the banks had hit their ELA ceiling. No further liquidity could be available.
In August 2015 the new government agreed to continue on a fiscally prudent path under the 3rd Economic Adjustment Program. Ever since, the liquidity and capital base of Greek banks have been strengthened although capital controls are still in place. What is clear, though, is how the official sector interventions have provided support in the form of liquidity and capital in order to safeguard deposits and other banking operations in Greece.
9In October 2012, the ECB waived the quality threshold for accepting Greek government bonds as collateral. This act also worked as a signal of support to the effort of re-normalisation of the Greek economic and financial activity.
10
2.3. NPLs and effects on credit provision and on the Greek economy
Nevertheless, the performance of Greek banks’ assets could not be enhanced by official interventions. The return on assets (RoA) of Greek banks remains negative as the stock of non-performing loans is the highest in Europe. Non-performing loans are the most important problem for Greek banks and a challenge for the authorities, as they weaken motives for lending to the economy.
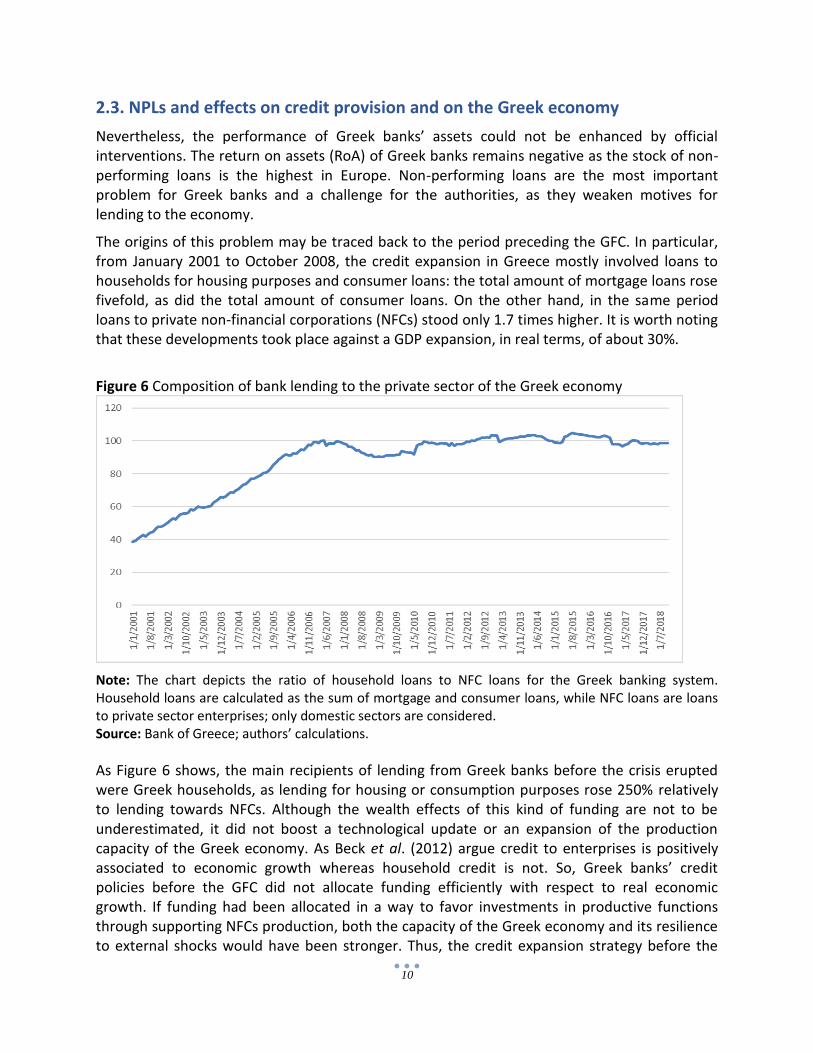
The origins of this problem may be traced back to the period preceding the GFC. In particular, from January 2001 to October 2008, the credit expansion in Greece mostly involved loans to households for housing purposes and consumer loans: the total amount of mortgage loans rose fivefold, as did the total amount of consumer loans. On the other hand, in the same period loans to private non-financial corporations (NFCs) stood only 1.7 times higher. It is worth noting that these developments took place against a GDP expansion, in real terms, of about 30%.
Figure 6 Composition of bank lending to the private sector of the Greek economy
Note: The chart depicts the ratio of household loans to NFC loans for the Greek banking system. Household loans are calculated as the sum of mortgage and consumer loans, while NFC loans are loans to private sector enterprises; only domestic sectors are considered. Source: Bank of Greece; authors’ calculations.
As Figure 6 shows, the main recipients of lending from Greek banks before the crisis erupted were Greek households, as lending for housing or consumption purposes rose 250% relatively to lending towards NFCs. Although the wealth effects of this kind of funding are not to be underestimated, it did not boost a technological update or an expansion of the production capacity of the Greek economy. As Beck et al. (2012) argue credit to enterprises is positively associated to economic growth whereas household credit is not. So, Greek banks’ credit policies before the GFC did not allocate funding efficiently with respect to real economic growth. If funding had been allocated in a way to favor investments in productive functions through supporting NFCs production, both the capacity of the Greek economy and its resilience to external shocks would have been stronger. Thus, the credit expansion strategy before the

11
GFC possibly served the goal of myopic profitability of Greek banks, but it was procyclical and leaning towards expanding consumption more than upgrading the production base of the Greek economy. This would have been the case if credit was linked to investments in production and exports (e.g. upgrades of machinery, investments in expansion of activities abroad and investments in R&D and new technology).
Figure 7: Credit provision to Greek non-financial corporations (NFCs) 2001-2018
Note: The figure illustrates the total sum of flows of credit to NFCs in Greece, in the form of either bank loans or debt securities since 2001. In order to estimate the level implied by flows of new credit, during this period, we have taken the level of loans and debt securities outstanding in January 2001 and added the net flows of new loans or the net issues of new debt securities respectively. Source: Bank of Greece.
Also, the sources of funding of the private sector of the Greek economy were not diversified. If households were to be affected by a credit contraction, as their only source of finance is bank credit, this is not equally true for companies. NFCs have the opportunity to borrow from the corporate bond market as well. However, as shown in Figure 7, the funding of NFCs was also relying predominantly on bank lending in the period before the GFC. The sum of lending to NFCs had reached around €115 bln at the onset of the Greek debt crisis in 2010, whereas debt securities rose to a little less than €21 bln. Note, however, that even in the case of debt securities credit was provided again by domestic banks, due to the clauses governing the domestic ‘bond-loans’10 and only a very small part, of this amount corresponds to eventual market financing in the form of corporate bond issuance.
10i.e. securities issued on a bilateral basis between a lender and a borrower, without the obligation of being introduced in a regulated market (Law 3156/2003).

12
In this context, we examine the following two questions: (a) how have liquidity, capital and asset quality contributed to bank credit towards the Greek economy and (b) what has been the impact of both bank credit and market financing on economic activity in Greece.
On the one hand, the capacity of Greek banks to lend to the Greek economy during the crisis was undermined by shortages in liquid assets. As discussed in the previous section, this led Greek banks to resort to central bank emergency liquidity amid an environment of collateral constraints. At the same time the bank credit provision to the Greek economy became negative in net terms. This is reflected in the decline of the loans to the private sector, which by and large came as a result of both the weak capital position of Greek banks and also because of the scarce liquidity (Figure 8).
Figure 8: Loans and deposits of the Greek private sector 2001-2019
Source: Bank of Greece.
Therefore, we argue that there may be a chain of causal effects linking liquidity shortages with lower credit and resulting in weaker economic activity:
Liquidity Bank credit Economic activity
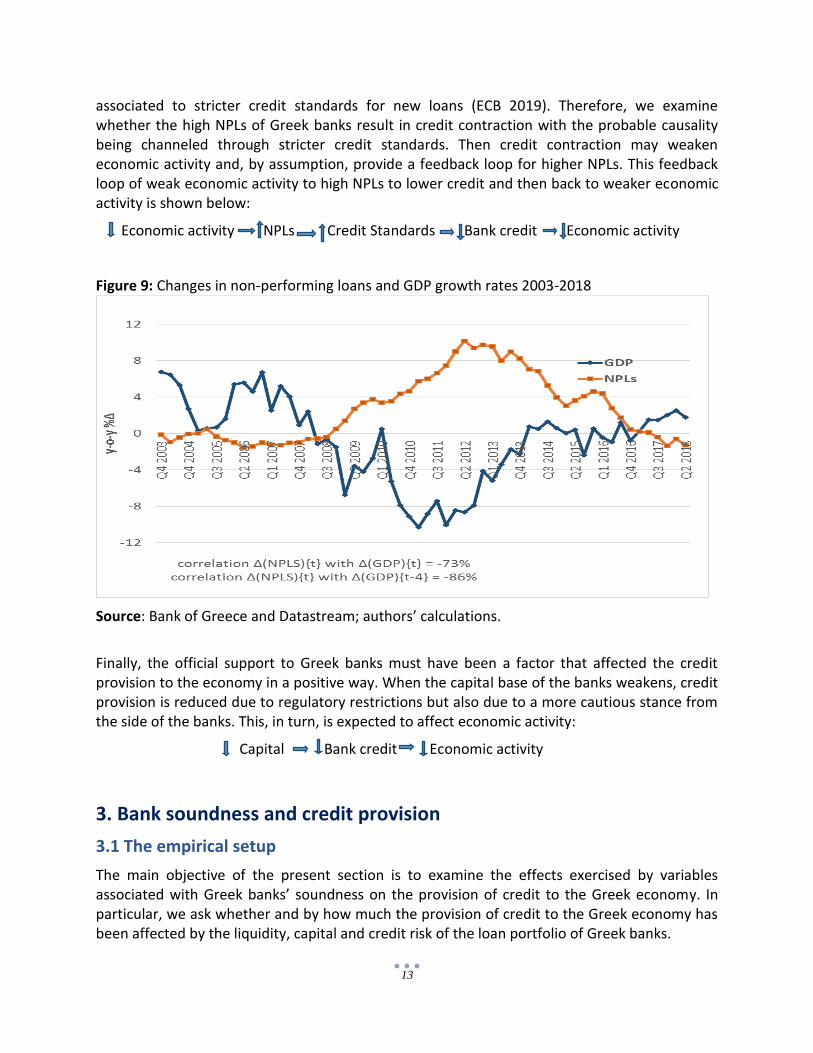
At the same time weak economic growth rates do not permit the healthy expansion of the asset side of the balance sheets of Greek banks. Figure 9 shows that the evolution of non-performing loans is strongly correlated to the growth rate of GDP, while the lead-lag relationship seems to run from GDP growth rates to NPLs.
A channel through which the worsening of the banks’ balance sheets due to the high NPL ratios results in lower bank credit (and then to lower economic activity) could be stricter credit standards. In particular, the NPL ratio of euro area banks has been shown to be positively
13
associated to stricter credit standards for new loans (ECB 2019). Therefore, we examine whether the high NPLs of Greek banks result in credit contraction with the probable causality being channeled through stricter credit standards. Then credit contraction may weaken economic activity and, by assumption, provide a feedback loop for higher NPLs. This feedback loop of weak economic activity to high NPLs to lower credit and then back to weaker economic activity is shown below:
Economic activity NPLs Credit Standards Bank credit Economic activity
Figure 9: Changes in non-performing loans and GDP growth rates 2003-2018
Source: Bank of Greece and Datastream; authors’ calculations.
Finally, the official support to Greek banks must have been a factor that affected the credit provision to the economy in a positive way. When the capital base of the banks weakens, credit provision is reduced due to regulatory restrictions but also due to a more cautious stance from the side of the banks. This, in turn, is expected to affect economic activity:
Capital Bank credit Economic activity
3. Bank soundness and credit provision
3.1 The empirical setup
The main objective of the present section is to examine the effects exercised by variables associated with Greek banks’ soundness on the provision of credit to the Greek economy. In particular, we ask whether and by how much the provision of credit to the Greek economy has been affected by the liquidity, capital and credit risk of the loan portfolio of Greek banks.

14
The data we use in this section involve financial ratios and credit provision and the series in our sample are in monthly frequency for the period from January 2001 to January2018. For measuring credit provision we take into account only net flows of credit. The annual change of the amount of net credit flows as a ratio to the total credit provided to the Greek economy reflects the credit expansion/contraction better than a gross measure of credit that would contain a roll-over andre-classifications of past loans. Financial ratios reflect capital, liquidity and credit risk of the entire Greek banking sector. Capital is measured by the ratio of capital to total assets, liquidity by the ratio of cash and cash equivalents to short-term liabilities and asset quality or credit risk in Greek banks’ balance sheets is measured by the ratio of provisions to total assets. Note that this measure is very closely related to the evolution of NPLs as shown in Figure 10.
Figure 10: Provisions for loans vis-à-vis non-performing loans of Greek banks 2002-2018
Note: The figure above presents the evolution of non-performing loans and provisions as ratios to total assets of Greek banks. The correlation coefficient is the simple Pearson correlation. Source: Bank of Greece; authors’ calculations.
In order to examine the effects of the three soundness indicators on bank credit we form a vector autoregressive model (Sims 1980) in which all variables are endogenous. This model allows us to examine whether the data indeed confirm the relationship of bank credit with liquidity, capital and asset quality of Greek banks as described in the previous section. By including lags of the dependent variables as well as by taking into account their variance-covariance, it has been shown (Stock and Watson 2001) that VARs capture the properties of the data accurately and provide robust estimations. Therefore, this setup will provide evidence related to the first sequence of the feedback loops that were described earlier. The model is denoted by the reduced form equation:
(1)

15
In the above setup Yj (Yjt= y1t, y2t, …, yjt) stands for the vector of the endogenous variables j, A(L) stands for the vectors of the coefficients of the autoregressive and explanatory variables and Σ is the variance-covariance matrix. The number of lags appropriate for a robust estimation is chosen based on a combination of the Akaike (AIC), the Bayesian (SC) and the Hannan-Quinn (HQ) information criteria. If there is no unanimous agreement in the number of lags, we choose the lag structure dictated by two out of the three criteria.
VAR models are purely empirical setups that make use of data properties with the only restriction being that of a covariance stationary process. They are seen as superior for extracting forecasts of the expected path of the variables in question, but disadvantageous in the sense that they are not based on structural forms of relationships between the variables, so their results pose interpretation difficulties in the policy making process. On the one hand, this is the main reason for using Dynamic Stochastic General Equilibrium (DSGE) models for inferring the effects of policies on economic variables. On the other hand, these formulations are also subject to criticism for being stylised and over-restrictive. Interestingly however, a balance between theory and empirical results is proposed, as it has been shown that DSGE models can have finite VAR representation when several conditions are met (Ravenna, 2007; Morris, 2016).
To proceed we form a structure of relationships by introducing restrictions in our variables. In this way we produce structural shocks by transforming the reduced form VAR to a VAR with a specific structure. So, the representation of the innovations from this setup is
and ,
where and .
The structural VAR model must be either exactly identified or over-identified, in order to be estimated. A precondition for exact identification is the existence of an identical number of parameters in A0 as there are in Σ, i.e. the covariance matrix from the reduced form. The reason is that this allows for recovering the structural parameters from the reduced form model. Finally, we assume that the model satisfies the rank condition based on Hamilton (1994).On that account, we incorporate the following structural restrictions for the estimation of the impulse response functions:
u1 = C(1)*e1+ C(2)*e2+ C(3)*e3 + C(4)*e4
u2 = C(4)*e1 + C(5)*e2
u3 = C(6)*e1 + C(7)*e3+C(8)*e4
u4 = C(9)*e1 + C(10)* e3+C(11)*e4
With the following notations for the residuals estimated by the VAR in equation (1):
e1, for Δ(bank credit),
e2, for Δ(liquidity),

16
e3, for Δ(credit risk),
e4, for Δ(capital),
Thus, in the 1st shock we assume that banks decide to provide credit based on a ‘full information’ scheme, i.e. taking into account developments in liquidity, asset quality and capital with the autoregressive factor reflecting all other factors that affect credit. The 2nd shock stems from liquidity, which we assume to be affected by credit and from its own lags, which again reflect all other factors. The 3rd shock reflects developments related to credit risk (provisions) of Greek banks and relates to credit and capital as well as to its autoregressive structure. Finally, we assume that developments related to capital adequacy, on top of the factors captured by own lags, relate also to the asset quality of Greek banks, i.e. the ratio of provisions to total assets, and to credit. The former affects the numerator and the latter the denominator of the ratio of capital-to-total assets.
3.2 Findings
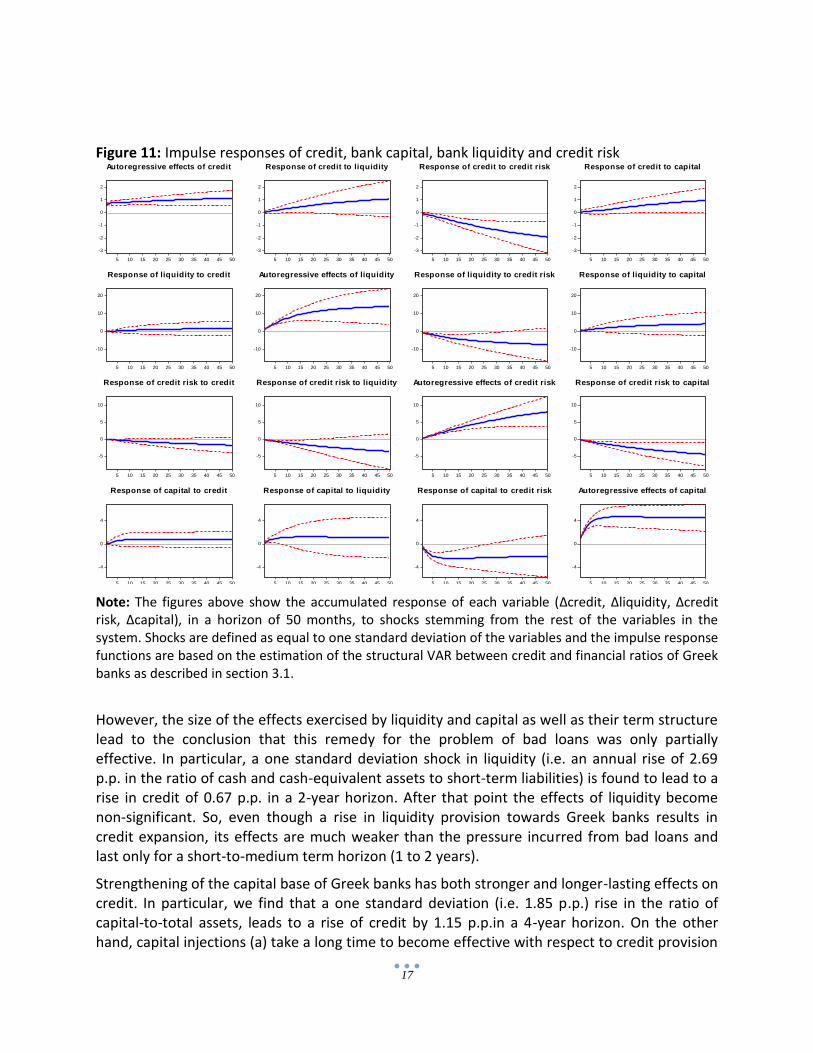
First, we specify the number of lags that are necessary in our estimation. For this purpose we make use of the information criteria (AIC, SC and HQ). The values of the criteria are reported in Table A1 in the Appendix. From these criteria we conclude that the optimal number of lags lies between 1 and 3, depending on which of the criteria is used. So, we choose to specify a VAR(2), i.e. a vector autoregression with variables being lagged twice. Also, the stability of the VAR is indeed confirmed as no roots lie outside the unit circle, as shown in Figure A1 in the Appendix. Figure 11 illustrates the effects that a shock in each of the variables will have on the rest of the variables of the VAR, according to the restrictions described in Section 3.1.
We begin with the variable of interest, i.e. changes in credit. Our results show that all ratios considered have the anticipated results on credit. In particular, the most profound effect on credit contraction is exercised by credit risk as measured by the ratio of provisions-to-total assets. We find that (a) the relationship between developments in credit risk and credit is negative, (b) the effect of credit risk passes-through changes in credit fast and (c) it has long-lasting effects as innovations produced at a given time (t) continue to exercise statistically significant effects even 25 months later (t+25). So, this finding suggests that the sharp deterioration of the quality of Greek banks’ balance sheets as captured by the sharp rise in provisions explains a significant proportion of the credit contraction witnessed post-crisis. Provisions for bad loans during our sample period have a standard deviation of 1.45 percentage points (p.p.) annually. This is estimated to result in a drop in the annual rate of change of credit by 2 p.p., at a4-year horizon. These findings suggest that the large rise of non-performing loans, which led to rises in provisions for bad loans in Greek banks’ balance sheets, is a significant and sizeable factor explaining credit deterioration towards the Greek economy.
On the other hand, liquidity and capital counterbalance the negative pressure exercised by risk on credit. A positive shock in liquidity or in capital is found to exercise positive effects on the rate of change of credit. So, both the ample liquidity provision by the central bank and the capital injections mainly by the official sector that helped recapitalise Greek banks have provided a relief for the reduction in credit due to the deterioration of Greek banks’ assets.
17
Figure 11: Impulse responses of credit, bank capital, bank liquidity and credit risk
-3
-2
-1
0
1
2
5 10 15 20 25 30 35 40 45 50
Autoregressive effects of credit
-3
-2
-1
0
1
2
5 10 15 20 25 30 35 40 45 50
Response of credit to liquidity
-3
-2
-1
0
1
2
5 10 15 20 25 30 35 40 45 50
Response of credit to credit risk
-3
-2
-1
0
1
2
5 10 15 20 25 30 35 40 45 50
Response of credit to capital
-10
0
10
20
5 10 15 20 25 30 35 40 45 50
Response of liquidity to credit
-10
0
10
20
5 10 15 20 25 30 35 40 45 50
Autoregressive effects of liquidity
-10
0
10
20
5 10 15 20 25 30 35 40 45 50
Response of liquidity to credit risk
-10
0
10
20
5 10 15 20 25 30 35 40 45 50
Response of liquidity to capital
-5
0
5
10
5 10 15 20 25 30 35 40 45 50
Response of credit risk to credit
-5
0
5
10
5 10 15 20 25 30 35 40 45 50
Response of credit risk to liquidity
-5
0
5
10
5 10 15 20 25 30 35 40 45 50
Autoregressive effects of credit risk
-5
0
5
10
5 10 15 20 25 30 35 40 45 50
Response of credit risk to capital
-4
0
4
5 10 15 20 25 30 35 40 45 50
Response of capital to credit
-4
0
4
5 10 15 20 25 30 35 40 45 50
Response of capital to liquidity
-4
0
4
5 10 15 20 25 30 35 40 45 50
Response of capital to credit risk
-4
0
4
5 10 15 20 25 30 35 40 45 50
Autoregressive effects of capital
Note: The figures above show the accumulated response of each variable (Δcredit, Δliquidity, Δcredit risk, Δcapital), in a horizon of 50 months, to shocks stemming from the rest of the variables in the system. Shocks are defined as equal to one standard deviation of the variables and the impulse response functions are based on the estimation of the structural VAR between credit and financial ratios of Greek banks as described in section 3.1.
However, the size of the effects exercised by liquidity and capital as well as their term structure lead to the conclusion that this remedy for the problem of bad loans was only partially effective. In particular, a one standard deviation shock in liquidity (i.e. an annual rise of 2.69 p.p. in the ratio of cash and cash-equivalent assets to short-term liabilities) is found to lead to a rise in credit of 0.67 p.p. in a 2-year horizon. After that point the effects of liquidity become non-significant. So, even though a rise in liquidity provision towards Greek banks results in credit expansion, its effects are much weaker than the pressure incurred from bad loans and last only for a short-to-medium term horizon (1 to 2 years).
Strengthening of the capital base of Greek banks has both stronger and longer-lasting effects on credit. In particular, we find that a one standard deviation (i.e. 1.85 p.p.) rise in the ratio of capital-to-total assets, leads to a rise of credit by 1.15 p.p.in a 4-year horizon. On the other hand, capital injections (a) take a long time to become effective with respect to credit provision

18
and (b) while they have larger effects than liquidity on credit, they cannot fully counterbalance the strain on credit exercised by the bad loans problem.
The historical decomposition of the effects exercised on credit by the three financial ratios examined reveal certain interesting findings. Figure 12 shows the impact of the rise in bad loans during the crisis period on credit. Increases in credit risk (i.e. provisions for bad loans) which are negatively associated to changes in credit, explain most of the negative change in credit provision to the Greek economy. On the other hand, a lack of liquidity during 2011-2012 (i.e. the PSI period) is also found to have dampened credit but this has only been temporary and limited, while capital rises during the crisis period have had a positive but limited effect due to the recurrent deterioration of the capital base.
Figure 12: Historical decomposition of the stochastic component of Δ(credit) 2002-2018
-2
-1
0
1
2
3
4
2002
2004
2006
2008
2010
2012
2014
2016
2018
Total stochastic component of credit
Liquidity
Liquidity
-2
-1
0
1
2
3
4
2002
2004
2006
2008
2010
2012
2014
2016
2018
Total stochastic component of credit
Credit risk
Credit risk
-2
-1
0
1
2
3
4
2002
2004
2006
2008
2010
2012
2014
2016
2018
Total stochastic component of credit
Capital
Capital
Finally, although our main focus is on effects exercised on credit by liquidity, capital and asset quality, some interesting results are for the first time reported by our empirical framework. Specifically, we find that, while none of these variables is affected significantly by credit, a significant feedback loop exists between credit risk and liquidity and credit risk and capital. Thus, we find first that liquidity exercises a short-term dampening effect on credit risk, while credit risk has a sizeable and lasting negative effect on liquidity. This finding supports the anecdotal evidence that the deterioration of the quality of assets used as collateral in liquidity-provision operations by the central bank exercised a downward push on liquidity available to Greek banks. At the same time, liquidity had a constraining, albeit limited, effect on the further deterioration of the quality of assets. This could be the case if banks rolled over loans of Greek NFCs that would otherwise become non-performing takin advantage of the liquidity provided by the central bank.
Second, we find that strengthening the capital base of Greek banks provided a partial backstop for avoiding further deterioration in the quality of their loans, whereas at the same time the deterioration in the quality of assets of Greek banks led to impairments of their capital base. This is a well-anticipated chain of effects. Greek banks’ capital was impaired by the high level of

19
NPLs, while recapitalisation of Greek banks provided some remedy for curing the low quality of assets by raising the proportion of good loans with new credit.
4. Bank credit, market financing and growth
4.1 The empirical setup
The quantification of interactions between financial and economic activity should be done carefully avoiding mixing stocks with flows. Biggs et al. (2010) argue that the statistical evidence on the link between credit and growth is weak due to the use of stocks data (credit) to explain flows (GDP), which also is the reason for finding that the financial cycle lasts longer than the business cycle. Thus, they propose to use the annual change in flows of bank credit to the private sector as a ratio to GDP in order to predict GDP growth, instead of the usually employed changes of outstanding credit or the credit-to-GDP measure for financial cycles. They support this claim (a) by noting that GDP is a flow variable, so its changes (i.e. GDP growth rates) are the first derivative of a flow variable, which is equivalent to the partial derivative of GDP related to flows of credit and (b) by providing evidence that fluctuations in the credit impulse around zero lead to fluctuations in GDP growth around its trend (Biggs and Mayers, 2009).
Distilling from these works, we may draw some conclusions useful both for the theoretical priors and for the empirical setup: credit is expected to contribute to economic activity and this relationship should involve credit flows in order to avoid measurement biases in our estimation. Following Biggs et al. (2010) we focus (a) on private demand for assessing economic activity and (b) on credit impulse for examining the effects of credit to NFCs on private demand. In particular,
Private demand = private investment + private consumption (2)
Starting from (2) we may observe the growth rate of private demand by taking annual changes in investment and consumption. Thus, for private investment we take the annual percentage change of the gross-fixed capital formation (GFCF) and for private consumption the annual percentage change of the private consumption expenditure (PCE). So, changes on private demand may be approximated as shown below:
%Δyoy(Private demand) = k%Δyoy(GFCF) + (1-k)%Δyoy(PCE) (3)
Where, k is the ratio of GFCF to total private demand and (1-k) is the ratio of private consumption to total private demand.
Our measure of economic activity in Greece closely follows the real GDP growth rate (Figure 13). The deviation between the two relates mostly to the public sector’s contribution to economic activity. As the focus of our research is on the private sector this deviation is not a problem. On the contrary, it provides a considerable degree of comfort as we do not deal with the direct effects of the Greek sovereign debt crisis, nor have we to touch on complex issues such as fiscal multipliers. The two components of private demand are shown in Figure 14.

20
Figure 13: Economic activity in Greece 1996-2018
Note: The series depicted are in real values. Source: Datastream; authors’ calculations.
Figure 14: Components of private demand 1996-2018
Note: The series depicted are in real values. Source: Datastream; authors’ calculations.
Similarly to our approach to economic activity, we only consider financial flows to the non-financial sector of the Greek economy. We do so by taking into account net flows of bank credit to Greek NFCs as a share of Private Demand as reflected in (4):

21
Credit impulse = %y-o-yΔ(Net flows of bank credit)/Private Demand (4)
We examine the effects of bank and market financing both on the percentage annual growth rate of private demand and, separately, on its investment component. This is an issue of particular interest to the Greek economy, as investment expenditure is a significant contributor to GDP growth and has multiplier effects on long-term growth, as it leads to permanent rises of the production capacity. Also, in a similar vein, we construct the market financing variable of interest, which we call ‘market impulse’, with which we examine the effects of equity and debt securities both combined and separately:
Market impulse = %y-o-yΔ(Net issuance of securities)/Private Demand (5)
The series in our sample are in quarterly frequency for the period 2001Q1 to 2018Q1. As indicators of economic activity we have collected data for gross fixed capital formation, private consumption and GDP from Data stream. Financial activity reflects flows of Greek banks’ credit to NFCs as well as issuances of new equity and debt securities by Greek NFCs. All financial variables are net of redemptions.
Our basic model examines the effects of bank and market financing to changes in private demand and its components. Again, we form a vector autoregressive model (VAR) in which we treat all variables as endogenous taking into account in our empirical set up structural features. In particular, a known limitation of VARs is that they provide weak structural inference and, thus, make it difficult to assess the effects of policy interventions. Incorporating structural features in vector autoregressive models is both robust in its estimation and policy-relevant (Sims and Zha, 1995). Therefore, we use a SVAR model in order to examine the effects of bank credit and market financing on private economic activity in Greece. More specifically, we impose a structure on the model’s relationships based on assumptions related to the sequence of effects expected between our variables (Dimelis et al., 2017). First, we assume that market financing is exogenous to bank financing as it depends on broader market conditions. Second we assume that bank credit is exogenous to domestic economic activity. Third we make domestic economic activity dependent on both market and bank financing.
In order to produce structural shocks, we transform the unrestricted VAR model by conditioning the responses of private demand and its components to the endogenous factorisation of the rest of the variables. To describe the structural factorisation consider the
following: let , denote the reduced-form VAR setup from the previous section for each endogenous variable examined. Then, the innovations from this setup are:
and
Where and .
For the estimation of the impulse response functions we incorporate the following structural restrictions:
u1 = C(1)*e1+ C(2)*e3
u2 = C(3)*e2 + C(4)*e3
u3 = C(5)*e1 + C(6)*e2 + C(7)*e3

22
With the following notations for the residuals estimated by the VAR:
e1, for bank credit (credit impulse),
e2, for market financing (market impulse),
e3, for economic activity (%yoyΔ(private demand), %yoyΔ (GFCF), %yoyΔ(PCE))
Thus, the first shock stems from bank credit and describes the feedback from economic activity to credit on top of the latter’s autoregressive effects. Similarly, in the second shock we assume that investors’ decisions shaping market financing while reflecting domestic economic activity are exogenous based on broader market conditions. Finally, in the third shock a broader structure is anticipated to be reflected by economic activity, as it relates to bank credit, market financing and other factors captured by its own lag structure.
4.2. Findings
The first relationship we explore is the one between financing (bank and market) sources and changes in private demand. So, we first choose the lag structure of our model relying on information criteria such as the Akaike (AIC), Bayesian (SIC) and Hannan-Quinn (HQ). As our data are in quarterly frequency the finding that inserting two lags in each equation provides sufficient information is reasonable. This implies that movements of the variables of our model exercise effects on each dependent variable within a horizon of one semester.
Figure 15: Impulse responses of bank credit, market financing and private demand
-1
0
1
2
2 4 6 8 10 12 14 16
Autoregressive effects of bank credit
-1
0
1
2
2 4 6 8 10 12 14 16
Response of bank credit to market financing
-1
0
1
2
2 4 6 8 10 12 14 16
Response of bank credit to private demand
-0.4
0.0
0.4
0.8
2 4 6 8 10 12 14 16
Response of market financing to bank credit
-0.4
0.0
0.4
0.8
2 4 6 8 10 12 14 16
Autoregressive effects of market financing
-0.4
0.0
0.4
0.8
2 4 6 8 10 12 14 16
Reponse of market financing to private demand
0
10
20
30
2 4 6 8 10 12 14 16
Response of private demand to bank credit
0
10
20
30
2 4 6 8 10 12 14 16
Response of private demand to market financing
0
10
20
30
2 4 6 8 10 12 14 16
Autoregressive effects of private demand

23
Note: The figures above show the accumulated response of each variable in a horizon of 16 quarters (i.e. four calendar years) to a one standard deviation shock stemming from the rest of the variables in the system.
We rely on the output of the impulse response functions (IRFs) in order to draw evidence for and quantify the effects of bank and market financing on economic activity (private demand). These IRFs are shown in Figure 15and measure the accumulated impact of a shock in one of the system’s variables on each dependent variable for a period of 16 quarters, i.e. four calendar years.
We find that both bank credit, measured as the change in credit flows of one quarter vis-à-vis the respective quarter of the previous year as a ratio to private demand and market financing, which is measured in a similar fashion, are positively and significantly related to changes in private demand.11 In particular, a shock on credit impulse equal to one standard deviation (i.e. a 2.7 p.p. annual change in net flows of credit as a ratio to total private demand) results to a rise of 10.5 p.p. in private demand after four years. That means that the reduction of credit has had sizeable effects on private demand. Although translating the development in net credit flows into total credit provision is not straightforward, this result indicates that the credit contraction since 2010weakened private demand and, as a consequence, deepened the recession.
A similar weakening of economic activity is found to have resulted from the lack of market financing for Greek NFCs. Specifically, market financing is found to exercise effects on private demand which are comparable to those exercised by bank credit, i.e. a one standard deviation shock (equal to 0.89 p.p.) on market financing produces a 5.1p.p. change in private demand after four years, although with reduced statistical significance. But as the Greek economy has been predominantly bank-based with respect to its funding sources, the historical effects of market financing on economic activity have been less pronounced than those of bank credit.
Additionally, we find that there is a feedback loop between economic activity and bank credit. The pass-through of the change of net bank credit flows, as captured by the credit impulse, to a change in private demand is found to be almost one-to-one after two quarters. This means that banks take into account the direction of economic activity when they supply credit to the economy. A positive/negative change in private demand results to an equally sized positive/negative effect on flows of bank credit as a ratio to private demand.
Therefore, credit contraction led to a deepening of the recession during the crisis period, whereas this also fed into credit provision by further weakening credit. As a result, a self-feeding chain of interactions between bank credit and economic activity has worked in the direction of intensifying the economic conditions underlying the Greek crisis. At the same time market financing could not provide a remedy to this vicious circle as it has been much smaller in volume than bank credit towards the Greek economy.
However, a restriction to our results in relation to market financing is that we have taken into account only the domestic bond issuance. Large Greek NFCs, mainly industrial companies with
11Note that we have also used the definition of credit and market impulses, as ratios to GDP; the results of the respective estimations are very similar to the ones reported here.

24
export orientation, have managed to tap the international bond market for more than €8.5 bln since 2013. These amounts have been used mainly for paying back expensive bank loans, as the bond issuance came at a gradually decreasing yield benefitting from the overall trends in the European corporate bond market. So the effects of market financing may eventually be amplified for the Greek economy, should this trend continue. There is scope to wait for such a development, if we consider (a) the ongoing initiative about establishing a true Capital Market Union in the EU and (b) the support provided by ECB’s quantitative easing.
In order to explore further into the mechanism of the effects exercised by financing to economic activity in Greece, we have examined separately the effects exercised by bank credit and market funding to private sector investment. The variable used for capturing investment is the year-on-year change of gross fixed capital formation in real terms. Therefore, we have formed a separate VAR to examine the effects exercised on private investment by bank credit and market financing. Figure 16illustrates the IRFs estimated from this VAR.
Figure 16: Impulse responses of bank credit, market financing and investment
0
20
40
60
80
2 4 6 8 10 12 14 16
Response of inv estment to market financing
0
20
40
60
80
2 4 6 8 10 12 14 16
Response of inv estment to bank credit
0
20
40
60
80
2 4 6 8 10 12 14 16
Autoregressiv e effects of inv estment
Note: The figures above show the accumulated response of private investment to a one standard deviation shock in market financing and bank credit within a horizon of 16 quarters (i.e. 4 calendar years).
Overall these findings indicate that the effects of bank credit and market financing on private investment are more pronounced than the ones exercised on private demand. Recalling that the latter contains an investment and a consumption component we may provide a possible interpretation of the mechanism through which finance affects Greek economic activity: mainly through investment. Thus, our results show that the weakening of bank credit during the crisis intensified the recession by reducing investment.
The historical decomposition of the stochastic component of private investment, i.e. y-o-y %Δ (GFCF) illustrated in Figure 17, confirms this intuitive result. Especially, during the periods 2009Q1-2010Q1, 2013Q4-2014Q1 and in 2016Q4 negative bank credit flows are shown to explain the contraction in investment. On top of this effect, the negative flows of market financing provide an additional explanation to the contraction of investment in 2008Q4-2009Q3 and 2011Q1-2011Q3. Another interesting aspect of this finding is that bank credit and market

25
financing, if directed towards productive investment, would not only have significant effects for the growth of the Greek economy but also of the desired structural quality.
Figure 17: Historical decomposition of the stochastic component of y-o-y %Δ(GFCF)
-60
-40
-20
0
20
40
60
2001
2002
2003
2004
2005
2006
2007
2008
2009
2010
2011
2012
2013
2014
2015
2016
2017
2018
Total stochastic component of investment
Market financing
Market financing
-60
-40
-20
0
20
40
60
2001
2002
2003
2004
2005
2006
2007
2008
2009
2010
2011
2012
2013
2014
2015
2016
2017
2018
Total stochastic component of investment
Bank credit
Bank credit
5. Concluding remarks and policy implications
Greece entered the GFC with a large reliance on public sector borrowing and spending. After all, the Greek public debt was the main origin of the Greek crisis which was triggered by the broad re-pricing of risks across the globe following the GFC. Although Greek banks (the most crucial source of financing for the Greek economy) were initially considered to be resilient to shocks as their fundamentals were in good shape, eventually they did not escape the crisis, which was partly enhanced by their lending policies. The direct impairments of their balance sheets as a result of the sovereign debt crisis and the ensuing deterioration in the quality of their loans due to the recession that followed were disastrous. Several lessons can be been learnt from the crisis.
First, as Greece relies predominantly on bank credit, direct market financing has a long way to go before it can replace the banking sector as the primary source of funding for the Greek economy. Several European initiatives, with that of the Capital Market Union being the most important, are under way in order to enlarge and deepen market financing of the real economy. At present market financing has benefitted greatly by the asset purchase programs of the ECB, but this should be considered as a temporary and not a structural condition. As a result, the policy maker can expect that the Greek economy in the medium-term will continue to rely predominantly on bank credit for financing economic activity. In this respect even a partial return of deposits would be beneficial. Hence, the completion of the European Banking Union with a European Deposit Insurance Scheme together with the recently established confidence in the market and the removal of the threat of Grexit would be reassuring.

26
Second, banks should address the debilitating problem of bad loans in order to be able to provide a healthy stream of funding to the Greek economy. As we have documented the deterioration in the quality of assets of Greek banks is a significant factor that reduces credit availability. There have been two complementary proposals by the Bank of Greece and the HFSF, which are still waiting for clearance by the DG Competition in Brussels (as they include state aid) and which could facilitate the faster reduction of NPLs. The Bank of Greece has proposed to transfer a significant part of non-performing exposures along with part of the deferred tax credits (DTCs) booked on banks’ balance sheets to a special purpose vehicle (SPV).12 The HFSF has not provided the detailed proposal but it refers to an asset management company with government guarantees following the experience of Italy.13Such government help is deemed necessary as neither recapitalisation nor liquidity provision by the central bank can remedy in full the NPL problem. Solving it is a precondition for banks to start providing new credit and, thus, contribute to future economic growth.
Third, as the Greek banking sector cannot be immune to the fundamental conditions faced either as part of the Greek economic landscape or as part of the broader global financial system, it should follow more long-sighted credit policies. In particular, providing credit to the economy through lending mainly to households may have been the most important development in Greek banks’ balance sheets before the crisis, but at the same time it did not strengthen the resilience of the Greek economy. If a healthier and more sustainable productive and export-oriented economic model is to be promoted in the future by an appropriate allocation of funds, banks should expand credit to productive investments rather than to consumption or housing.
Greek banks entered the GFC period with a seemingly more resilient position than their European peers. However, as the debt crisis in Greece and the ensuing severe domestic recession followed the GFC, Greek banks faced initially severe impairments in their capital base and, then, on their balance sheets as their assets were damaged both by the recession and the problem of strategic defaulters. During the crisis period both the official sector and the central bank provided backstops to Greek banks’ capital and liquidity problems, respectively. According
12Loans will be transferred net of loan loss provisions and the amount of the DTCs will match the additional loss, so that valuations are brought close to market prices. The DTCs will be transformed to a claim of the SPV on the Greek State with a predetermined repayment schedule. The SPV will securitise the loans, thus resulting to the issuance of notes of three classes: senior (upper), mezzanine (middle) and junior (lower). Greek banks will subscribe to the lower class of notes, together with the Greek State. The upper and middle classes of the notes will be absorbed by the market, i.e. by private investors, while third independent parties will provide the valuation of the scheme. The proceeds of the securitised loans will be serviced to the holders of the notes by private investors (Bank of Greece, 2018). 13Italy’s government introduced its GACS (Guarantee on Securitisation of Bank Non Performing Loans) in order to help banks unwind their NPL exposures. In order to stabilise the domestic financial system a private fund (Atlante) was created by the government in 2016 with the role to purchase shares in order to provide capital into banks and buy junior tranches of securitised NPLs. The Italian scheme was buoyed by an unexpected lift in economic activity in 2017, which drove investor demand for Italian NPLs high. Italian banks managed to sell the largest part of their NPLs. In the Italian plan the reduction of NPLs relied crucially on the well-functioning of the servicing platforms, which administer loans and facilitate creditor repayments. In the Greek case it is foreseen that higher fees will be paid to the servicers as the stock of NPLS relative to total assets is higher than Italy’s.

27
to our findings this valuable support only partially cured the effects of the high NPLs to the Greek banks’ ability to fund the economy.
We have documented the existence of feedback loops between primarily bank credit and secondarily market financing with private demand and even more importantly investment, thus uncovering the nexus between financing and economic activity in Greece. Briefly our findings indicate that while in the pre-crisis period financing of the economy (mainly in the form of bank credit) resulted in lifting real growth rates, in the post-crisis period the lack of credit accentuated the recession.
At present, the main problem of the Greek banking sector is dealing with NPLs. Our results indicate that the resolution of NPLs is important for curing the balance sheets of Greek banks and making them more resilient to potential shocks. Only then will banks be able to finance economic activity again and contribute to a more sustainable growth model, especially if they improve the allocation of funds between production and consumption.

28
References Anastasiou D., Louri H., Tsionas M., 2019. Nonperforming loans in the euro area: Are core–
periphery banking markets fragmented? International Journal of Finance and Economics 24(1), 97-112.
Asimakopoulos I., Avramidis P., Malliaropulos D., Travlos N., 2016. Moral hazard and strategic default: evidence from Greek corporate loans. Bank of Greece Working Paper no. 211.
Bank for International Settlements, 2016.“The financial cycle, the natural rate of interest and monetary policy”, Box IV.C in BIS 86th Annual Report.
Bank of Greece, 2018. Overview of the Greek financial system – Special Feature, November 2018.
Bank of Greece, 2019. Governor’s Annual Report for 2018, April 2019. Beck T., Levine R., Loayza N., Finance and the sources of growth. Journal of Financial Economics
58(1-2), 261-300. Beck T., Levine R., 2004. Stock markets, banks, and growth: panel evidence. Journal of Banking
and Finance 28(3), 423-442. Beck T., Berrak B., Rioja F., Neven V.T., 2012. Who gets the credit? And does it matter?
Household vs. firm lending across countries. B.E. Journal of Macroeconomics 12(1), 1-46.
Bernanke, B., Gertler, M., Gilchrist, S., 1999. The financial accelerator in a quantitative business cycle framework. In (eds. J.B. Taylor and M. Woodford) Handbook of Macroeconomics, vol. 1C, 1341-93.
Biggs M., Mayer T., Pick A., 2010. Credit and economic recovery: demystifying Phoenix miracles. SSRN Economic Journal (retrieved on 24 January 2019 from: http://dx.doi.org/10.2139/ssrn.1595980).
Biggs M., Mayer T., 2013. Bring credit back into the monetary policy framework!, Political Economy of Financial Markets Policy Brief, University of Oxford St Antony’s College.
Bofondi, M., Carpinelli L., Sette E., 2018.Credit Supply during a Sovereign Debt Crisis. Journal of the European Economic Association 16 (3), 696–729.
Borio C., 2014. The financial cycle and macroeconomics: what have we learnt? Journal of Banking and Finance 45, 182-198.
Caldéron C., Liu L., 2003. The direction of causality between financial development and economic growth. Journal of Development Economics 72(1), 321-334.
Christiano L.J., Motto, R., Rostagno, M., 2014. Risk shocks. American Economic Review 104(1), 27-65.
Clerc L., Derviz A., Mendicino C., Moyen S., Nikolov K., Stracca L., Suarez J., Vardoulakis A., 2015. Capital regulation in a macroeconomic model with three layers of default. International Journal of Central Banking 11(3), 9-63.
Dell’Ariccia G., Ferreira C., Jenkinson N., Laeven L., Martin A., Minoiu C., Popov A., 2018. Managing the sovereign-bank nexus.European Central Bank working paper no. 2177.
Dimelis, S., Giotopoulos, I. and Louri, H., 2017. Can firms grow without credit? A quantile panel

29
analysis in the euro area. Journal of Industry Competition andTrade 17(2), 153-183. ECB, 2015.The financial risk management of the Eurosystem’s monetary policy operations.
ECB, 2017.Private sector indebtedness and deleveraging in the euro area countries, Economics Bulletin, Issue 4, pp. 56-60.
ECB, 2019.Bank Lending Survey – Fourth Quarter 2018. Engler P., Steffen C.G., 2015. Sovereign risk, interbank freezes, and aggregate
fluctuations.European Central Bank working paper no. 1840. Espinoza R., Fornari F., Lombardi M.J., 2012. The role of financial variables in predicting
economic activity.Journal of Forecasting 31(1), 15-46. Farmer R.E.A., Nicolò G., 2018. Keynesian economics without the Philips curve. Journal of
Economic Dynamics and Control 89, 137-150. Fratzscher M., Rieth M., 2019. Monetary Policy, Bank Bailouts and the Sovereign-Bank Risk
Nexus in the Euro Area. Review of Finance forthcoming. Galvao A.B., Giraitis L., Kapetanios G., Petrova K., 2016. A time varying DSGE model with
financial frictions. Journal of Empirical Finance 38B, 690-716. Gennaioli N., Martin A., Rossi S., 2018. Banks, government bonds and default: what do the data
say? Journal of Monetary Economics 98, 98-113. Hamilton, J.D. 1994. Time Series Analysis. Princeton: Princeton University Press. Hamilton J., 2018. Why you should never use the Hodrick-Prescott filter. The Review of
Economics and Statistics 100(5), 831-843. Hellenic Financial Stability Fund, 2013a. Annual Financial Report for the period from
01/01/2012 to 31/12/2012. (internet source: http://www.hfsf.gr/files/hfsf_annual_report_2012_en.pdf retrieved on 6 March 2019).
Hellenic Financial Stability Fund, 2013b.Report of the Hellenic Financial Stability Fund for the period January – June 2013. (internet source: http://www.hfsf.gr/files/HFSF_activities_Jan_2013_Jun_2013_en.pdf retrieved on 6 March 2019).
Iacoviello, M., 2005. House prices, borrowing constraints and monetary policy in the business cycle. American Economic Review 95(3), 739-764.
Malliaropulos D., Migiakis P., 2018. The re-pricing of sovereign risks following the Global Financial Crisis. Journal of Empirical Finance 49C, 39-56.
Morris S.D., 2016. VARMA representation of DSGE models. Economic Letters 138, 30-33. Ravenna F., 2007. Vector autoregressions and reduced form representations of DSGE models.
Journal of Monetary Economics 54(7), 2048-2064. Sims C., 1980. Macroeconomics and reality.Econometrica 48, 1-48. Sims C., Zha T., 1995. Error bands for impulse responses.Econometrica 67, 1113-1156. Stock J.H., Watson M.W., 2001. Vector Autoregressions. Journal of Economic Perspectives
15(4), 101-115. Williams J., 2017. The perennial problem of predicting potential. FRBSF Economic Letter 2017-
32.

30
Appendix
Table 2. Lag selection for the first VAR
Number of lags AIC SC HQ
1 8.172 8.512* 8.309
2 8.102 8.713 8.349
3 7.849* 8.732 8.207*
4 7.859 9.013 8.327 Note: AIC stands for the Akaike information criterion, SC for the Bayesian and HQ for the Hannan-Quinn criterion for lag selection. The criterion for lag selection is the minimisation of the information contained by the residuals.
Figure 10. Inverse roots of the AR characteristic polynomial for the 1st VAR
-1.00
-0.75
-0.50
-0.25
0.00
0.25
0.50
0.75
1.00
-1.00 -0.75 -0.50 -0.25 0.00 0.25 0.50 0.75 1.00

31
Previous Papers in this Series
134. Vassilis Monastiriotis and Angello Martelli, Crisis, adjustment and resilience in the Greek
labour market: an unemployment decomposition approach, March 2019
133. Axioglou Christos, Christodoulakis Nicos, Which firms survive in a crisis? Corporate
dynamics in Greece 2001-2014, February 2019
132. Tsiftsoglou Anna, Greece after the Memoranda: A Constitutional Retrospective, January
2019
131. Georgiadis Andreas, Kaplanis Ioannis and Monastiriotis Vassilis, The Impact of Minimum
Wages on Wages and Employment: Evidence from Greece, December 2018
130. Pagoulatos George, Greece after the Bailouts: Assessment of a Qualified Failure,
November 2018
129. Christopoulou Rebekka and Pantalidou Maria, Who saved Greek youth? Parental support
to young adults during the great recession, October 2018
128. Lyberaki Antigoni, Tinios Platon, Long-term Care, Ageing and Gender in the Greek crisis,
September 2018
127. Zeri Persefoni, Tsekeris Charalambos and Tsekeris Theodore, Investigating the Macedonia
Naming Dispute in the Twitter Era: Implications for the Greek Identity Crisis, July 2018
126. Roumanias Costas, Skouras Spyros, Christodoulakis Nikos Crisis and Extremism: Can a
Powerful Extreme Right Emerge in a Modern Democracy? Evidence from Greece’s Golden
Dawn, June 2018
125. Christopoulou Rebekka, Monastiriotis Vassilis Did the crisis make the Greek economy less
inefficient? Evidence from the structure and dynamics of sectoral premia, May 2018
124. Glyniadaki Katerina Judge, Nudge, or Engage? Gender-related pressures and responses
among street-level bureaucrats working with migrants, April, 2018


![Hellenic Observatory Discussion Papers...vast literature on the subject, Baldwin and Taglioni [2] trace the causes of the reduction in world trade to the decreased world demand, while](https://img.pdfslide.us/doc/110x75/60d1dc04410795663d7ec2e1/hellenic-observatory-discussion-vast-literature-on-the-subject-baldwin-and.jpg)