Embed Size (px)
Citation preview

1
Review of Three Small-Satellite Cost Models
Melvin A. Broder1 and Eric M. Mahr2
The Aerospace Corporation, El Segundo, CA 90245
Daniel E.F. Barkmeyer3, Erik L. Burgess4
NRO Cost Analysis Improvement Group, Chantilly, VA 20151 , and Wilmer Alvarado
and
Samuel B. Toas5 and Gregory Hogan6
Air Force Cost Analysis Agency, Arlington, VA 22202
The problem of estimating costs for small satellites is more vexing than it would seem. Small satellites, as described here, generally weigh less than 1,000 pounds, and are sometimes much smaller and significantly different from much of what exists now. Costing these kinds of satellites is not simply a matter of scaling down from larger systems. It requires incorporation of new data sets and consideration of new modeling methods. The challenge of addressing small-satellite development is important, considering the emerging priority for developing much smaller, modular or interactive space systems. This paper introduces three related efforts to advance the state of small-satellite cost estimating. First is the Small Satellite Cost Working Group championed by the U.S. Air Force Space and Missile Systems Center to bring together the various entities and organizations that have a stake in this challenge. Second is the Small Satellite Cost Model in development by The Aerospace Corporation. Third is the Demonstration Satellite Cost Model, the National Reconnaissance Office’s (NRO) parametric tool for one-of-a-kind, short-design-life satellites. This paper summarizes efforts and discusses remaining issues, focusing on the goal of improving the capabilities for small-satellite costing, which has become of compelling and common interest. These efforts are in response, in part, to two factors. One is intense congressional pressure to have missions accomplished by smaller, lighter, and less expensive satellites. The second comprises new ways of doing business, now possible and being advanced by the space industry at large.
I. Introduction f small satellites (SmallSats) are defined as satellites with a dry mass less than 500 kg, and if weight-based cost-estimating relationships (CERs) from larger operational satellites were scalable, then there would be no need for a
SmallSat cost model. However the SmallSat definition goes beyond mass, and the fact is that weight-based CERs are rarely scalable across the wide range of satellite weights and unique acquisition strategies. These two facts forced the costing community to develop models targeted for this class of vehicle. What defines SmallSats for the technical community is not necessarily synonymous with the definition favored by the cost-estimating world. Design and cost drivers can be grouped into two broad categories, technical and programmatic. Table 1 compares these drivers using the number of check marks to show the greater impact.
1 Senior project leader, Developmental Planning and Architectures Division, The Aerospace Corporation, 2310 E. El Segundo Blvd., M1-557, El Segundo, CA 90245. 2 Engineering specialist, Space Architecture Department, The Aerospace Corporation, 2310 E. El Segundo Blvd., M1-557, El Segundo, CA 90245, AIAA Senior Member. 3 Cost analyst, Wyle Aerospace Group, 15000 Conference Drive, Suite 1007, Chantilly, VA 20151. 4 Burgess Consulting, McLean, VA 22101. 5 Operations researcher, TASC, 201 S. 12th Street, Arlington, VA 22202. 6 Senior associate, AFCAA/Booz Allen Hamilton, 8283 Greensboro Drive, McLean, VA 22102, AIAA Member.
I
Presented at the 2010 ISPA/SCEA Joint Annual Conference and Training Workshop - www.iceaaonline.com

2
Table 1. SmallSat Design vs. Cost Parameters
Technical Parameters SmallSat Range
Design Impact
Cost Impact
Size <8 cu meters
Weight < 500 kg
Power < 1000 w
Pointing Accuracy > 1 degree
Total Impulse (Delta V) 0 to < 300 m/sec
Down Link Rate < 10 Mbits/sec
Programmatic Parameters Orbit Regime LEO (or MEO)
Satellite Class (A to D) C or D
Design Life < 3 years
Redundancy Single String
Qualification Testing None
Although the ratings in Table 1 are somewhat subjective, the technical parameter list has been abridged from an ongoing study by The Aerospace Corporation to gauge spacecraft complexity. The study is referred to as the Complexity-Based Risk Assessment (CoBRA) initiative. The programmatic parameters are an abridged version of a list presented by the Air Force Cost Analysis Agency (AFCAA) in their study on Class A vs. Class C satellites which they derived from MIL-HDBK-343. Although both complexity and class are not fully correlated with the term SmallSats, their values are representative of this type of spacecraft. The rating of design impact from subjective assessments by design engineers and the cost impact is based on the level of occurrence of these values found in CERs.
Defining what makes a satellite a SmallSat from the cost perspective is important because it determines the issues that must be overcome by the cost-model builders. These issues can be summarized into four areas. First, SmallSats span a wide variety of program types including experimental, demonstration, and operational satellites. Second, there is lack of useable-reliable data, ill defined scope-of-program work, and poor cost traceability and accountability in SmallSats. Third, the customer community is going through paradigm shifts with small company culture, and the lack of a formal set of standards/testing, etc. is becoming the norm. The fourth area of issues for SmallSat model builders concerns the expectations of the customer community on what SmallSats should cost. There are customers who believe in the “faster, better, cheaper” school of thought and expect the cost models to forego the use of historical data as their basis, as well as customers who exert pressure to achieve low costs from doing business “not as usual.”
In this paper three builders discuss their models and the methods they used to adjust traditional cost-estimating methodologies to overcome SmallSat costing issues. The first model, called the Small Satellite Cost Model (SSCM) and built by The Aerospace Corporation, uses traditional CERs but focuses on a SmallSat set of programs in its database. The second model, called the Demonstration Satellite Cost Model (DSCM), was created by the NRO Cost Analysis Improvement Group (NRO CAIG) some ten years after SSCM was created. It uses an expanded database with larger spacecraft, but still meets the demonstration criteria. The third model is the ORS CAIV (cost as an independent variable) model built by the AFCAA on behalf of the Operationally Responsive Space Office (ORS) with the intent of defining the bus (and payload) parameters of a SmallSat that could be bought for a specified cost. The parametric relationships created for this model are for spacecraft and payload sizing with cost as the secondary “independent” output.
There is a linkage between the models. The DSCM uses data points in their CER development that were taken from the SSCM. And the ORS model uses CERs taken directly from the DSCM model. In this sense there are underlying data points that are in the “DNA” of all three models. The focus of these models is the spacecraft, often referred to as the bus, with just two CERs devoted to payloads in the DSCM and ORS models.
Presented at the 2010 ISPA/SCEA Joint Annual Conference and Training Workshop - www.iceaaonline.com

3
II. The Aerospace Corporation’s Small Satellite Cost Model
A. Background Beginning in the late 1980s, there was a move to small satellites to perform many types of space missions: in the
DOD for technology demonstration, at universities as hands-on experience for students, in NASA to expand scientific exploration, and in the commercial sector for communications and remote sensing applications. The use of small satellites saw a fundamental shift in how satellites were developed. SmallSat programs are characterized by the use of previously qualified space components and off-the-shelf- technology, low cost, and streamlined schedules. There was also an increased acceptance of risk.
Studies performed by The Aerospace Corporation (Aerospace) in the early 1990s found that cost models developed using the costs and technical parameters of large satellites were likely not applicable to small satellites.1,2,3
Given that the cost models in use at the time were not adequate to estimate SmallSat costs, Aerospace was funded to develop a cost model to estimate the cost of SmallSat buses. The model that was developed is known as the Small Satellite Cost Model (SSCM). The funding for the model originally came from a number of sources in DOD and NASA. The model is now funded internally. The scope of the model expanded over time based on the desires of the funding agency and the availability of data. SSCM was originally a simple system-level DOS-based PC program. It has matured to be a subsystem-level model that is an Excel-based PC and Mac program.
These studies showed that the weight-based cost-estimating relationships (CERs) employed in large-satellite cost models could not accurately reflect the SmallSat principles intended to lower cost.
B. Approach and Methodology The model estimates the development and production cost of a spacecraft bus for small (<1,000 kg total wet
mass) Earth-orbiting and near-Earth planetary missions. The CERs are derived from a database of actual SmallSat technical and cost data. The elements estimated by the model are the standard satellite subsystems: attitude determination and control subsystem (ADCS); propulsion; power; telemetry, tracking, and command (TTC)/command and data handling (CDH); structure; and thermal, along with assembly, test, and launch operations (ATLO), and program management (PM)/systems engineering (SE).
To comprehend the scope of the SSCM modeling effort and to ensure proper application of its output, it is important to understand the SmallSat industry. Table 2 lists some descriptive characteristics of SmallSats and their general impact on cost. Both technical and programmatic aspects of SmallSat programs affect cost. The first step in understanding SmallSats is to collect a body of information concerning technologies and program management techniques that affect their cost. These observations are then summarized as a general definition of a SmallSat. This definition is used as the basis for selection of satellites for the database and for model development.
The SmallSat regime constitutes many different types of organizations, including civil, commercial, university, and military, and missions, such as technology demonstrations, scientific (Earth and planetary), educational, and operational (communication and remote sensing). While all SmallSats strive to be low cost and less risk averse, the development approach can vary significantly based on organization and mission. University satellites tend to be very small and have very small budgets that make use of student labor and donations to keep costs down. Technology demonstration missions are by their very nature more risky as the objective is to mature components that have never been used. NASA science missions strive to advance scientific discovery and are therefore flying newer sensor designs which require technology development while dealing with an operational mission-like acquisition process, which tends to require more oversight and risk management. With all these competing objectives in one class of satellite, it can be difficult to develop CERs that generate valid estimates for all types of missions.
Presented at the 2010 ISPA/SCEA Joint Annual Conference and Training Workshop - www.iceaaonline.com

4
Table 2. SmallSat Characteristics and Cost-Related Observations
Characteristic
4
Cost-Related Observation Physical Light (Mass) Reduced spacecraft cost Small (Volume) Simplified systems engineering Functional Specialized design Reduce interface requirements, complexity Dedicated mission Fewer users, shorter lifetimes Procedural Short project schedule Focused design effort, minimize optimization Streamlined organization Less management overhead Developmental Existing components/facilities No development of new parts or technologies Software advances Extensive software reuse Risk Acceptance Low to moderate mission value Rely on existing technology Higher tolerance for mission risk Reduced redundancy, complexity Launch Small vehicle or piggyback Avoid launch date slips, stand-downs Ground Terminals Simplified/autonomous Need fewer personnel
C. Model Description Figure 1 shows the four main parts of SSCM:
Inputs, Estimate, Cost Risk, and Funding Profile (top to bottom). The Inputs sheet is where the user enters the parameters that are used in the CERs. The sheet also includes an area that provides feedback to the user on the validity of the inputs. Each input parameter value is compared to the parameter validity range and those outside the parameter range of validity are highlighted in red. The Estimate sheet shows the output of the CERs based on the user inputs. The results are split into recurring and non-recurring costs. The percentage cost of each subsystem with respect to the total subsystem cost is shown, and the subsystem total and system-level percentages with respect to the total spacecraft bus cost are shown. Also, any cost elements with out-of-range parameters are highlighted. The Cost Risk sheet allows the user to generate a cost distribution based on the user’s understanding of the technical difficulty of the development. The user inputs high and low percentages relative to the estimated cost for each cost element to develop cost-risk distributions that are then combined using a model developed by The Aerospace Corporation called FRISK, for Foram Risk Assessment of System Cost Estimates, to create the cost distribution. The Funding Profile
Figure 1. SSCM user worksheets.
Presented at the 2010 ISPA/SCEA Joint Annual Conference and Training Workshop - www.iceaaonline.com
5
sheet allows the user to spread the cost estimate over the development time to get an idea of the yearly funding requirements for the spacecraft bus.
Since the major flaw with traditional large-satellite cost models in relation to SmallSat cost estimation was that they were based primarily on weight, data collection efforts for SSCM have focused on all performance, configuration, technology, and programmatic aspects of SmallSat missions. With all this available data, it is possible to try many different CER forms to find the best combination of parameters to estimate the various bus elements.
The first idea is to break the data out by mission type, but that leads to the problem of not having enough available data points in each category to generate statistically valid CERs. Given this, the approach becomes to carefully review the available data and, where necessary, remove points that just don’t fit any trends. But points can’t be removed just because they don’t fit. There has to be a valid reason for removing the point, such as a known and unique technical problem that occurred during development that caused an exceptional cost overrun. If there is no reason to remove a point, it will have to be included, and an increased level of modeling error will have to be accepted.
SSCM has also had success generating CERs, not only by including technical and programmatic parameters as drivers in a single subsystem CER, but also by generating multiple CERs for a single subsystem based on the varied design implementations of the subsystem. One example of this is the ADCS subsystem, where SSCM regularly develops two CERs: one for spin-stabilized implementations and one for three-axis stabilized implementations. Other examples are basing the power subsystem on solar array design (body-mounted vs. deployed vs. articulated) and the TTC/CDH subsystems based on the communications band (S-band versus X-band).
D. Issues One problem that was encountered over multiple development cycles for SSCM was the fact that very low mass
satellites did not seem to have the same trends or drivers as larger SmallSats. This led to the exclusion of satellites with masses of less than 100 kg from the CER development. It was obvious that satellites of this size required their own set of CERs, but there wasn’t enough data to generate a distinct set of CERs for this class of SmallSat. Over time, additional data has been collected to increase the number of points for this class, and SSCM now generates two sets of CERs: small satellite CERs for the mass range of 100 to 1,000 kg, and micro satellite CERs for masses less than 100 kg.
One other stumbling block in the generation of CERs is the bookkeeping of data, which manifests itself in two ways. The first is that not every program uses the same definitions for subsystems. SSCM has a defined structure with definitions for functions included in each subsystem, but a project under investigation may not have used the same definitions. A common example is the solar array substrate. SSCM bookkeeps this element under the power subsystem, but many projects bookkeep this element under the structure subsystem. For consistency sake, the desired approach is to move both the mass and the cost for the element to the correct subsystem for CER generation. While this is usually possible for the mass, it may not always be possible for the cost, which may not have been tracked to that level of detail. Therefore the mass and cost must be kept as the project defined them, thereby providing another source of error in the CER generation process. The second issue with bookkeeping is the general availability of data. SmallSat projects don’t always have requirements to accurately track mass and cost data to the subsystem level, which can lead to some projects not having the necessary level of detail to be included.
III. The Demonstration Satellite Cost Model (DSCM)
A. Background The costs of SmallSat programs whose primary missions are to demonstrate advanced technologies or new
missions do not tend to follow the trends that have been identified and modeled for larger, high-profile spacecraft designed to perform critical missions with established users and validated requirements sets. The smaller demonstration satellites are generally designed with a greater acceptance of risk in exchange for lower costs and faster delivery of an operational vehicle. Often, they are also designed around parts available, instead of being designed to strict mission requirements. For these reasons, cost models designed to estimate operational spacecraft costs do not function well for estimating small demonstration-type satellites.
In recent years the space acquisition community (DOD, NASA, and NRO) has applied the SmallSat paradigm to more and more missions of all types, and it has proven to be cost effective in some circumstances. As a result, they have tried to extend that acquisition model to larger demonstration-type missions. The NRO Cost Analysis Improvement Group (NRO CAIG) is investigating whether the cost efficiencies demonstrated on modern SmallSats extends to larger demonstration missions, or whether some of the cost-reduction strategies employed on programs of this type tend to evaporate as program size increases.
Presented at the 2010 ISPA/SCEA Joint Annual Conference and Training Workshop - www.iceaaonline.com

6
Cost estimating tools such as the Air Force’s Unmanned Spacecraft Cost Model (USCM) and the NRO Spacecraft Cost Model (NSCM) were not designed with demonstration programs in mind, and rarely use them in their underlying datasets. The Small Satellite Cost Model (SSCM) developed by The Aerospace Corporation, focused on estimating the cost of higher-risk advanced technology satellites. The scope of the SSCM was limited to satellites weighing less than 1,000 kg (~2,200 lb), however, and the chief aim of the NRO CAIG’s work was to estimate spacecraft beyond the scope of that model.
B. Approach and Methodology The NRO CAIG chose to develop a new
parametric cost model that leverages the work breakdown structure (WBS) used in The Aerospace Corporation’s SSCM, and expand its database to include NRO Advanced Systems and Technology (AST) programs and other similar programs beyond the SSCM’s scope. Figure 2 displays the range of weights of demonstration satellites in the expanded database. This model, the Demonstration Satellite Cost Model (DSCM), is a parametric model designed to estimate the cost and schedule of advanced technology demonstration satellites of all sizes.
The model is composed of subsystem-level cost-estimating relationships (CERs) for demonstration satellite buses, system-level CERs for electro-optical demo payloads, and radio-frequency demonstration payloads. It also includes a parametric estimating relationship for schedule (bus authority to proceed [ATP] to launch) for demonstration satellites. Table 3 summarizes the DSCM estimating relationships. All of these CERs were developed using regression analysis based on a broad set of technical parameters considered as possible drivers. CERs were chosen based on the statistical quality of their fit and the reasonability, from an engineering perspective, of the drivers. Particular care was taken to ensure an accurate fit of the data across a wide range of weights. Most CERs are driven by weight and one or more technical parameters representing subsystem or system complexity.
The primary goal of the NRO CAIG study was to examine the behavior of the costs of demonstration satellites as their weights and other technical specifications approached those typically seen on operational satellites. To this end, the DSCM CERs and the NRO CAIG’s standard subsystem-level CERs for operational satellites were used to estimate each of the programs in the database of each of the two models. Since each
Table 3: DSCM Cost and Schedule Estimating
Subsystem CER / SER Form
SE / PM [Cost (FY06$K)] = 0.26 [Base (FY06$K)]1.03
I&T[Cost (FY06$K)] = 33.0 [S/C Dry Weight (lb)]0.66
* 1.32[Contract Includes Pay load Integration]
* 1.40[Optical Pay load] * 1.70[Propulsion]
Structure [Cost (FY06$K)] = 45.1 [Subsystem Weight (lb)]0.77
* 1.34[Solar Array Mechanics]
Thermal [Cost (FY06$K)] = 62.7 [Subsystem Weight (lb)]0.70
* 1.63[Optical Pay load] + 144
EPS [Cost (FY06$K)] = 37.1 [Subsystem Weight (lb)]0.89
* 1.44[Nickel-Hy drogen Battery ]
ADCS [Cost (FY06$K)] = 288 [Subsystem Weight (lb)]0.59
* [Number of Attitude Sensors]0.23
Propulsion[Cost (FY06$K)] = 398 [Propellant Weight (lb)]0.22
* [Number of Thrusters]0.37
TTC&DH [Cost (FY06$K)] = 15.5[Subsystem Weight (lb)]0.86
* [Vehicle End of Life Power (W)]0.41
Software [Cost (FY06$K)] = 16.8[TT&C Subsystem Weight (lb)]1.18
Launch Support
[Cost (FY06$K)] = 82.3[Base (FY06$K)]0.22
* [Number of Payloads]0.51 * 1.60[Hy drazine Propellant]
Optical Payload
[Cost (FY06$K)] = 760 [Payload Weight (lb)]0.69
* (log[Spectral Range (A)])0.37 * 0.28[Cry ostat]
RF Payload [Cost (FY06$K)] = 119 [Payload Weight (lb)]0.97
* [Design Life (mo)]0.28
Schedule[Time to First Launch (mo)] = 9.4 [S/C Dry Weight (lb)]0.14
* [Design Life (mo)]0.19 * 1.13[Optical Pay load]
- 5.6[Option on Extant Contract]
0
2
4
6
8
10
12
0 - 5
00
500
- 100
0
1000
- 20
00
2000
- 30
00
3000
- 40
00
4000
- 50
00
5000
- 60
00
Weight (lbs)
Num
ber o
f Pro
gram
s
New DataSSCM Data
NRO CAIG Expanded SSCM Database to Include Larger Demos from DoD, NASA and NRO
Figure 2. DSCM Database
Presented at the 2010 ISPA/SCEA Joint Annual Conference and Training Workshop - www.iceaaonline.com

7
model exhibits a near-zero bias over the programs in its own database, the behavior of the models on each other’s databases gives insight into the behavior, in a general sense, of costs of demonstration satellites vs. operational satellites.
Figure 3 shows the two datasets as estimated by the operational satellite model at the top level. The value on the vertical axis is the residual between actual costs and costs estimated using the model designed for operational satellites. A positive value of the residual indicates the program was underestimated, a negative value indicates it was overestimated. As expected, the operational vehicles are evenly distributed around a residual of 0, while the demonstration satellites are generally overestimated by the operational model. The average percent error across the demonstration satellite dataset is -79%. It can be seen, however, that the percent error tends to diminish for larger demonstration satellites. Demonstration satellites approaching sizes comparable to operational satellites are less able to take advantage of the efficiency of demonstration-like development, and tend to come closer to the cost of an equivalent operational vehicle. Even for demonstration satellites similar in size to typical operational satellites, however, some savings seems achievable.
Figures 4 and 5 show the same comparison, using only hardware cost and system engineering, integration, and test, and program management (SEITPM) cost, respectively. Similar to total cost, both tend to approach the cost of operational satellites as size increases, but at very different rates. It is clear that the savings for demonstration programs is predominantly in SEITPM. Even the largest demonstration satellites fall well below what would be expected for an operational program’s costs in this area. Hardware costs for large demonstration satellites, conversely, are in line with operational satellites, indicating a complete loss of the efficiency of demonstration-like development on the hardware portion of a vehicle of that size.
C. Model Description The model consists of the CERs as
presented in this paper. There is no generalized instantiation of the CERs into a software tool. Each user creates his/her own working model for DSCM.
D. Issues Evidence suggests that demonstration satellites do approach the cost of operational satellites as they increase in
size. But, even for the largest demonstration satellites being built today, some savings is possible by taking a more
Weight (lb)
Res
idua
l
Operational
1σ
Demo trendline
Figure 5. Residuals against operational model – SEITPM.
Demo SEITPM significantly lower across the board – proprietary data not shown
Figure 4. Residuals against operational model – hardware.
Large demo hardware costs comparable to
operational
Figure 3. Residuals against operational model – total.
Presented at the 2010 ISPA/SCEA Joint Annual Conference and Training Workshop - www.iceaaonline.com
8
risk-accepting approach to development. The majority of the savings is in systems engineering and integration, with hardware costs only able to achieve similar efficiency if the scope of the program is much less ambitious than that for a typical operational satellite.
IV. AFCAA Parametric Satellite Sizing Model
A. Background As small satellites and compressed acquisition models become more prevalent in DOD, parametric tools that can
quickly generate cost estimates based on minimal concept-level inputs will become more important. Through collaboration with the Operationally Responsive Space (ORS) office the Air Force Cost Analysis Agency (AFCAA) built a parametric sizing model to build a working technical baseline based on customer requirements, target performance, and cost objectives. Key aspects of the ORS philosophy are small, quick, low cost, low risk. The compressed model development schedule unfortunately resulted in a small amount of time dedicated to compiling detailed technical design information into a cost and requirements description (CARD), which is the typical starting point for satellite cost estimates. Even as AFCAA is reengaging the ORS program office for the ORS-1 post-CDR build decision, there remain technical unknowns that normally are determined well before CDR. The AFCAA parametric sizing model overcomes this hurdle by calculating the required mass and other technical parameters needed to calculate costs from mission-performance objectives. The AFCAA model utilizes the DMSC CERs described above.
At the time AFCAA engaged with the ORS program office in mid-2007 the known parameters were minimal: • Potential mission types (UHF communication, space situational awareness, and electro-optical) • Target recurring cost of $40 million • Limited technical specification (orbit, design life, materials)
Rather than complete point estimates for ORS, the direction shifted toward the development of a parametric model that could handle a range of inputs and payloads for the program office to complete trade studies.
B. Approach and Methodology The steps used in development of the model were as follows: 1. Determine the trade space 2. Determine applicable WBS and CERs 3. Research drivers for sizing methodology 4. Determine the interaction between subsystems and develop sizing methodology 5. Integrate sizing and cost methodology into a parametric model
For ORS, the trade space provided was limited by the following: • Small satellite, total space vehicle (SV) weight < 1,000 lbs • Design life of 1-3 years • Single-mission satellite • Programmatically and technologically similar to TACSAT-like missions and procurements • LEO orbit • Three-axis stabilized bus • State-of-the-art technology/Class D (or aircraft) components
Typically the level of detail within a WBS is driven by the current phase of the program. Since AFCAA was completing a concept phase model, a subsystem level WBS (reference MIL-HDBK-881A) was chosen. The WBS was also driven by the selection of CERs. AFCAA decided that the most appropriate CERs for ORS were the NRO CAIG Demonstration Satellite Total Cost CERs, which are based on smaller buses and experimental payloads that are similar to the TACSATs.
Researching drivers for sizing methods was the focus of most of the effort. The goal in this step was purely technical – determine the technical drivers that could be used to calculate subsystem mass properties and other required CER inputs. Sources of data and information included SAF/USA, ORS Program Office, AFRL, NRL, Aerospace, MIT/LL, USNO, MDA, AFSPC, and NSSO. Space Mission Analysis and Design (SMAD)5
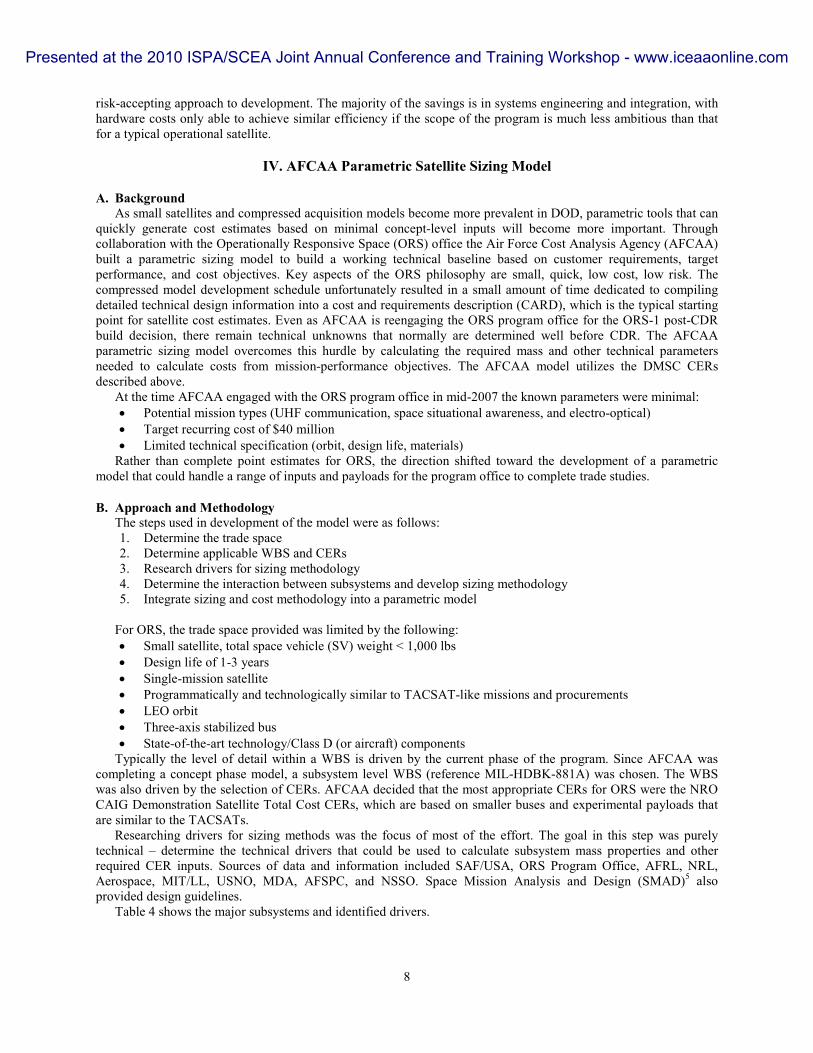
Table 4 shows the major subsystems and identified drivers.
also provided design guidelines.
Presented at the 2010 ISPA/SCEA Joint Annual Conference and Training Workshop - www.iceaaonline.com
9
Table 4. Major Subsystem Drivers
Subsystem Drivers EPS EOL Power, Design Life, Solar Array Type and Efficiency, Orbit,
Battery Type, Bus Voltage ADCS Stabilization Method, Satellite Mass, No. Sensors, Orbit Type Propulsion Satellite Mass, Delta V, ISP, Propulsion Type (XIP vs. Mono) CDH/TTC Processing Capability, Data Storage Requirement, Frequency Band STR Satellite Weight, Orbit Type TCS Satellite Weight, Orbit Type, BOL Power Optical Assembly Target Range, Resolution, Wavelength, FOV, Limiting Magnitude,
Target Velocity Simple Comm Link Range, Frequency, No. Channels, Data Rate, Required Margin
The development of a notional “working” design solution to meet each mission’s desired performance (e.g.,
resolution, link margin) requirement is the foundation for defining a solution that fits within the trade space. This step was to essentially size a complete satellite given a set of drivers. AFCAA approached this problem using the process generally outlined in SMAD. The first case was to determine the mass properties for a bus to support a given payload mass and power requirement. Because the satellite bus is a better known commodity than unique mission payloads, there generally are more data and more trends for small satellite buses.
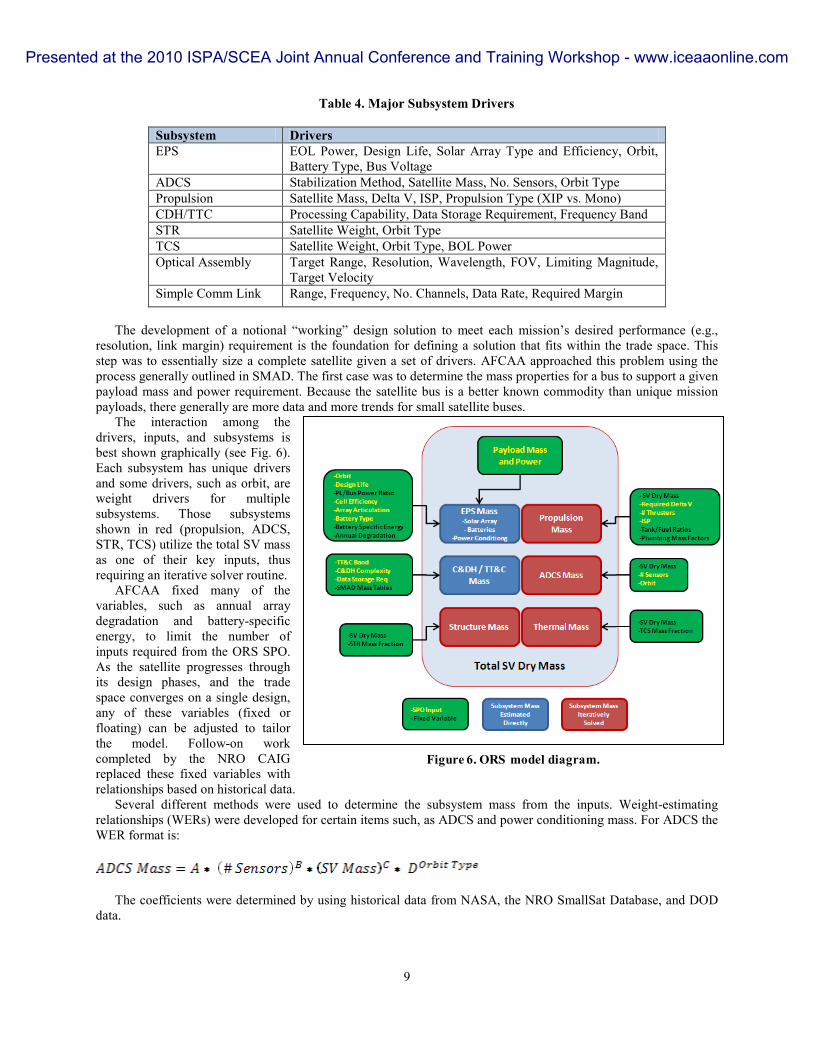
The interaction among the drivers, inputs, and subsystems is best shown graphically (see Fig. 6). Each subsystem has unique drivers and some drivers, such as orbit, are weight drivers for multiple subsystems. Those subsystems shown in red (propulsion, ADCS, STR, TCS) utilize the total SV mass as one of their key inputs, thus requiring an iterative solver routine.
AFCAA fixed many of the variables, such as annual array degradation and battery-specific energy, to limit the number of inputs required from the ORS SPO. As the satellite progresses through its design phases, and the trade space converges on a single design, any of these variables (fixed or floating) can be adjusted to tailor the model. Follow-on work completed by the NRO CAIG replaced these fixed variables with relationships based on historical data.
Several different methods were used to determine the subsystem mass from the inputs. Weight-estimating relationships (WERs) were developed for certain items such, as ADCS and power conditioning mass. For ADCS the WER format is:
The coefficients were determined by using historical data from NASA, the NRO SmallSat Database, and DOD data.
Figure 6. ORS model diagram.
Presented at the 2010 ISPA/SCEA Joint Annual Conference and Training Workshop - www.iceaaonline.com

10
Simpler mass-fraction relationships were used to estimate the structure and thermal mass as a percentage of total space vehicle mass. Sources for the thermal and structure factors include SMAD light sats data, the NRO DSCM database, and DOD data, which provided the best statistical fit.
For some subsystems the mass is calculated by using engineering design principles and historical mass data. An example of this is the EPS solar array. The required solar array area can be calculated based on end-of-life (EOL) power, cell efficiency, design life, array articulation, and degradation assumptions. Similarly the eclipse time, which drives battery mass, can be determined via orbital mechanics. AFCAA relied on certain SMAD tables, validated by subject matter experts, for those parameters where data were not available. These include TTC and CDH weights, battery-specific energies, and solar-array degradation factors. Future updates will replace these values with historical values and resultant factors.
In addition to sizing the bus, AFCAA derived a sizing methodology for two electro-optical imaging payloads and a bent-pipe communications payload. These methodologies are not as robust as the bus-sizing methodologies for several reasons:
• Payload mass and power are driven by significantly more inputs than required for bus subsystems • Less technical data exists on small satellite payloads than on the buses • More assumptions are required to estimate payload mass and power than to estimate bus requirements • Variety in payload design solutions for the same mission as compared to bus
AFCAA found that the mass of an EO imager and associated electronics could be estimated using the primary imager aperture size and required field of view (FOV). A database was compiled using open source imager payload data and DOD data to develop a weight-estimating relationship. Assuming that the resolution, range, and wavelength are known (or limiting magnitude and target velocity for SSA), the aperture can be sized and the total imager weight can be estimated using the WER.
C. Model Description All of the sizing methodologies were built into an Excel-based model. The solver function in Excel was used to
model the driver and subsystem interactions to ensure a “working design” (Fig. 6). A screenshot of the model inputs is shown in Fig. 7. Targeted recurring cost, an additional input that has not been discussed thus far, is critical for the ORS concept. At the time AFCAA was completing this model, the SPO envisioned a $40 million total recurring vehicle cost (bus + payload). The Excel solver can be customized to perform design trades on any variable. Examples are:
• Target cost is fixed, resolution (limiting magnitude) is dependent variable • Resolution is specified and cost of system is dependent • Cost and resolution are fixed, design life is dependent
A screenshot of the model output sheet is shown in Fig. 8. This is an example output assuming a target recurring cost of $40 million, one-degree FOV, and visible wavelength sensor. These values are provided for example purposes only. The solver routine converges on an aperture size and associated resolution that is shown in the top of the output sheet. All of the mass properties are solved for and shown under the dry weight column.
Figure 7. AFCAA model input screen. Figure 8. AFCAA model output screen.
Presented at the 2010 ISPA/SCEA Joint Annual Conference and Training Workshop - www.iceaaonline.com

11
Total, nonrecurring, and recurring costs are shown FY06 dollars. By changing the target cost, the user can generate notional utility curves of resolution vs. cost, orbit vs. resolution, cost vs. aperture, etc. An example of a notional utility curve is shown in Fig. 9.
D. Issues Since AFCAA initially developed this model
in December 2007, the NRO CAIG has expanded the sizing relationships with even more payload and bus data. Many of the changes focused on replacing several of the SMAD factors with relationships derived from NRO CAIG data (e.g., depth of discharge, efficiency and degradation factors). Some of the weight-estimating relationships were revised to utilize inputs that may be better known during early phases (pre Phase A / Phase A) of the program. The electo-optical payload model has also been updated with more data and a modified regression. The new sizing relationship may become available to the estimating community pending security and proprietary data review.
V. Conclusion The costing of SmallSats has made important progress during the past decade. And the continued collection of
data points by the three organizations contributing to this paper, and other agencies, will help create a set of models that satisfy the needs of many customers and projects by making possible more creditable estimates than were previously available. However, the issues identified in Section I remain and need to be solved using better costing algorithms and perhaps even new and novel methodologies. The comments presented in this paper indicate that the most difficult costing issue to be addressed is embedded in the very nature of SmallSat procurement programs. These programs exhibit tremendous variability in their missions, their scope, and their requirements. This will lead to future cost-tool development that will require more sophistication than has previously been demanded of cost modelers.
References and Bibliography 1Abramson, R. L. and D. A. Bearden, “Cost Analysis Methodology for High-Performance Small Satellites,” SPIE (The
International Society for Optical Engineering), International Symposium on Aerospace and Remote Sensing, Small Satellite Technology and Applications III, Orlando, FL, April 1993.
2Bearden, D. A. et al., “Comparison of NEAR costs with a Small-Spacecraft Cost Model,” Proceedings of the 10th Annual AIAA/USU Small Satellite Conference, Logan, Utah, September 1996.
3Bearden, D. A. and A. Lopez, “Cost Estimation of Small Satellites, A Practical Case: the MINISAT 01 Mission,” AIAA/USU Conference on Small Satellites, 16-19 September 1996.
4E. M. Mahr, “Small Satellite Cost Model 2007 (SSCM07) User’s Manual,” Aerospace Report No. ATR-2007(8617)-5, 30 September 2007.
5Wertz, J.R., and Larson, W.J. (Eds). (1999). Space Mission Analysis and Design (3rd ed.). Microcosm Press, El Segundo, CA.
6Thompson, D. W., “The Microspace Revolution,” address given at the Langley Colloquium Series, NASA, December 1991. 7Bearden, D. A. and R. L. Abramson, “Small Satellite Cost Study – Risk and Quality Assessment,” 2nd International
Symposium on Small Satellites Systems and Services, Biarritz, France, 29 June 1994. 8Harper, A. D., “Assurance Management,” NASA/GSFC/AIAA Small Satellite Subsystem Architecture Symposium,
Greenbelt, MD, 29 June 1993. 9
MIL-HDBK-343 (USAF), “Design, Construction, and Testing Requirements for One of a Kind Space Equipment,” 1 February 1986.
0
10
20
30
40
50
$- $50 $100 $150 $200 $250
Cost (FY00 $M)
Res
olu
tio
n (
m)
0
2000
4000
6000
8000
10000
Wei
gh
t (l
bs)
100 Kbps CDL100 Mbps CDL
Resolution Weight
14 m Resolution 436 lbs SV
Figure 9. Example of utility curve.
Presented at the 2010 ISPA/SCEA Joint Annual Conference and Training Workshop - www.iceaaonline.com