Embed Size (px)
Citation preview

Review and analysis of flows from ODA and HIV spending accounts: Are donor
funds additional at country level?
Presented by Charu C. Garg ([email protected])
Co-contributors: Ajay Tandon, Geir LieHuman Development Network
World Bank
Cape Town, South Africa
July 17-18, 2009

Outline1. Trends in Official Development Assistance (ODA) for health with focus on HIV/AIDS
2. . Implications of donor flows for HIV/AIDS funds at the country level
3. Additionality of aid flows in the health sector at the country level
• Experience from Kenya, Malawi, Rwanda, Tanzania, and Zambia
• Experience from Honduras, Rwanda, Thailand, and Malawi for HIV/AIDS aid flows
•Context: The global economic scenario and the financial crisis

Total ODA in 2007: US$125 billion; ODA for health in 2007: US$15 billion Increase in health’s share of ODA: 6% in 1995 to 12% in 2007.
Increasing Development Assistance for Health
Total
Health05
01
001
50U
S$
billi
ons
1995 1997 1999 2001 2003 2005 2007Year
Source: OECD-DAC
ODA commitments, 1995-2007

Rising share of external resources as share of total health spending in low-income countries, especially in sub-Saharan Africa.
Increasing Development Assistance for Health
Classification 1995 2000 2006
Low-income 4.2% 6.8% 11.3%
Sub-Saharan African 8.1% 16.3% 27.6%
Non sub-Saharan African 2.7% 3.3% 4.8%
EXTERNAL SOURCES SHARE OF TOTAL HEALTH EXPENDITURE

020
4060
8010
0Pe
rcen
tage
of h
ealth
com
mitm
ents
by co
mpo
nent
s (%
)
1995 1997 1999 2001 2003 2005 2007year
Health System Strenghtening
HIV/AIDS
Population & Reproductive Health
Infectious Disease Control
Basic Nutrition
Source: OECD DAC
Components of total ODA health commitments 1995-2007numbers in percentage (%)
ODA for HIV is increasing at a faster rate
Total Health
HIV/AIDS
050
0010
000
1500
0O
DA
com
mitt
men
ts, c
urre
nt U
S$
1995 1997 1999 2001 2003 2005 2007Year
Total Health
Health Systems Strengthening
050
0010
000
1500
0O
DA
com
mitt
men
ts, c
urre
nt U
S$
1995 1997 1999 2001 2003 2005 2007Year
Source: OECD DAC
ODA commitments for health, 1995-2007

4.0 59.7 0.4 25.7 10.2
23.5 34.7 12.6 14.6 14.6
24.7 35.5 0.7 13.2 25.9
61.2 0.7 38.1
50.5 17.7 2.3 18.5 11.0
0 20 40 60 80 100Share of health commitments by components (%)
European Commission
World Bank
United Kingdom
Global Fund
United States
Source: OECD DAC
Share of components in total ODA health commitmentsfor top 5 donors, 2005-2007, numbers in percentage (%)
HIV/AIDS
Health System Strenghtening
Basic Nutrition
Infectious Disease Control
Population & Reproductive Health
Total: 25651 US$ million
Total: 5608 US$ million
Total: 4552 US$ million
Total: 2675US$ million
Total: 1804 US$ million
Donor Prioritization

2. What happens to HIV/AIDS funds at the country level?
Disconnect between donor priorities and disease burden.
Changing composition at source and expenditure level.

NATIONAL HEALTH BUDGETS AND DONOR HIV/AIDS COMMITMENTS 2005-2007 AVERAGE
Country Population HIV prevalence (15-49 years)
National health budget
Donor HIV/AIDS commitments
Donor HIV/AIDS commitments
% national budget Ethiopia 81 million 2.1% US$360.2 million US$297.7 million 82.6% Mali 12 million 1.5% US$190.4 million US$ 27.5 million 14.4% Mozambique 21 million 12.3% US$237.5 million US$ 160.1 million 67.4% Rwanda 9 million 2.9% US$ 135.5 million US$ 95.7 million 70.6% Uganda 30 million 5.7% US$ 186.9 million US$ 181.3 million 97.0% Zambia 12 million 15.1% US$ 329.8 million US$ 148.2 million 44.9%
Sources: UNAIDS; WHO; OECD-DAC
Disconnect Between Aid Commitments, Disease Burden and national priorities
Acute respiratory infections: 25% of disease burden but only 3% of aid flows.

Spending on health and HIV/AIDS is increasing
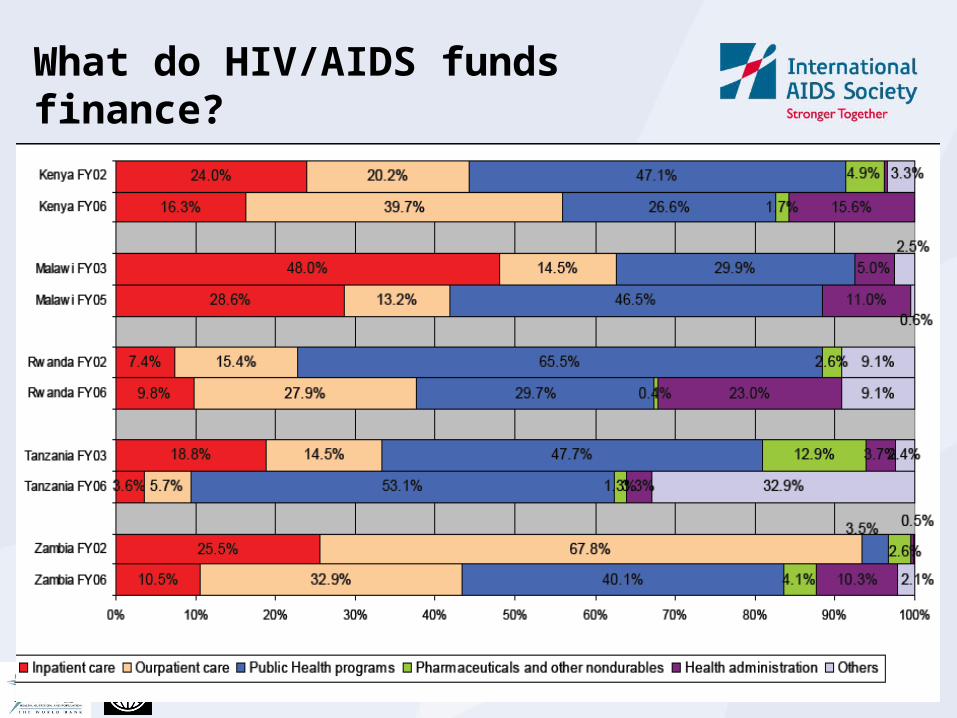
What do HIV/AIDS funds finance?
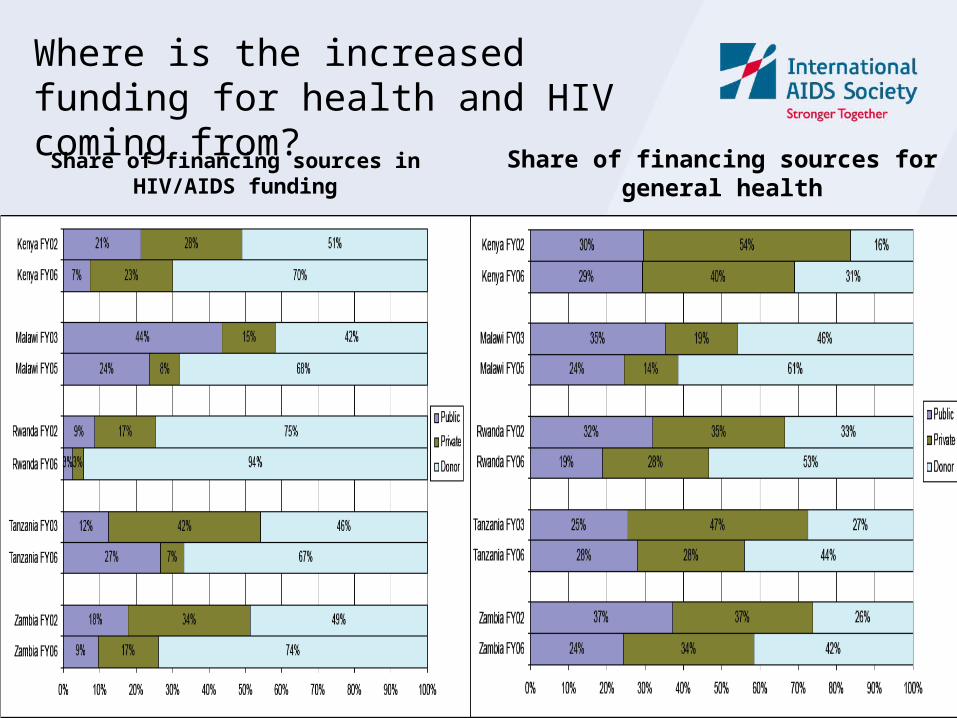
Share of financing sources in HIV/AIDS funding
Share of financing sources for general health
Where is the increased funding for health and HIV coming from?

3. Is Donor funding additional to domestic resources
1. Experience from Kenya, Malawi, Rwanda, Tanzania, and Zambia
2. Experience from Honduras, Rwanda, Thailand, and Malawi

Absolute donors contributions, and as a percentage of total spending on HIV/AIDS

Have donor contributions crowded out resources or are they additional; government spending

Have donor contributions crowded out resources or are they additional; private spending

No concrete measures available to define additionality specifically for health sector
A financial concept concerned with whether expenditures from domestic sources increased or remained same on the receipt of external funding for a specific priority, activity or for health in general
Definition of additionality:
• External resources spent on specific health priority/activity are said to be additional if they lead to increased expenditure for that priority without reducing public expenditures for that priority/activity
Additionality does not look at:
• Whether the funds are well used or the impact of expenditures on the coverage of health services or on health outcomes

Operationalized indicators for measuring additionality for HIV/AIDS
Indicator definition and level Summary definition of Indicator (c stands for the current year and b for the base year in each subscript below)
National level: (definition 2 of table 2)Does an increase in contributions from external resources or Rest of the World (ROW) funds from one donor (GFATM in this case) for HIV result in concomitant reduction of external resources from other funding agencies for HIV in that country?
If ROW (Donor 1 for HIV)c / ROW ((Donor 1 for HIV)b ≥ 1And ROW (all other donors)c / ROW(all other donors)b ≥ 1Then it implies additionality
Health Sector Level: (definition 4 of table 2)Is an increase in HIV funding from external sources/ROW in country 1 associated with a decrease in spending from external resources in other parts of the health sector (H#)?
If ROW (HIV)c / ROW (HIV)b ≥ 1And ROW (H#)c / ROW(H#)b ≥ 1Then it implies additionality
Program level (definition 5 of table 2)Is an increase in HIV spending from external resources/ROW to country 1 associated with a decrease in domestic public expenditures (PE) on HIV?
If ROW(HIV)c / ROW(HIV)b ≥ 1 and PE(HIV)c / PE(HIV)b ≥ 1Then it implies additionality
Activity level (definition 6 of table 2)Is an increase in HIV on a particular activity (A) (e.g. prevention, treatment) from external resources/ROW to country 1 associated with a decrease in spending on that activity from domestic public resources
If ROW(A)c / ROW(A)b ≥ 1and PE(A)c / PE(A)b ≥ 1Then it implies additionality
Input level (definition 7 of table 2)Is an increase in external resources/ROW on a particular input (I) (e.g. medicines, wages) associated with a decrease in spending on that input from domestic public expenditure
If ROW (I)c / ROW (I)b ≥ 1and PE(I)c / PE(I)b ≥ 1 Thenit implies additionality
Additionality of External resources at Health Sector Level:Is an increase in HIV funding from external sources/ROW in country 1 associated with a decrease in spending from external resources in other parts of the health sector (H#)?If ROW (HIV)c / ROW (HIV)b ≥ 1And ROW (H#)c / ROW(H#)b ≥ 1Then it implies additionality
Additionality of External resources at HIV/ AIDS Program levelIs an increase in HIV spending from external resources/ROW to country 1 associated with a decrease in domestic public expenditures (PE) on HIV?If ROW(HIV)c / ROW(HIV)b ≥ 1 and PE(HIV)c / PE(HIV)b ≥ 1Then it implies additionality


Honduras (last year data available is 2003)
National Level Health Sector Level Program level Activity Level Input level
Years 1. ROW (GFATM for HIV)c / ROW (GFATM for
HIV)b
2. ROW (for HIV from all donors
except GFATM)c / ROW (for HIV from
all donors except GFATM)b
1. ROW (HIV)c /
ROW (HIV)b
2. ROW (H#)c /
ROW(H#)b ?
1. ROW
(HIV)c /
ROW
(HIV)b
2. PE
(HIV)c /
PE (HIV)b
1. ROW
(prev.)c /
ROW
(prev.)b
2. PE
(prev.)c
/ PE
(prev.)b
ROW
(ARV)c /
ROW
(ARV)b
PE (ARV)
c / PE
(ARV)
b
2003/2002increased from 0
to 45 m Lempiras
naIncreased from
2002 levelna
Increased from 2002 level
0.27 na 4.98
2002/2001 0 na 0.641.40
0.64 1.01 na na
2001/2000 0 na 1.520.66
1.52 1.12na
na
2000/1999 0 na 0.280.88
0.28 1.05na
na
Rwanda (last year data available is 2002)
National Level Health Sector Level Program level Activity Level Input level
2002/2000 No GFATM grants expended in 2000 or 2002
3.13 3.13 0.51 3.13 2.24 3.14 1.62 34.43 remain 0
2000/1998 2.03 2.03 0.85 2.03 1.99 na na remain 0 remain 0
Thailand (last year data available is 2003)
National Level Health Sector Level Program level Activity Level Input level
2003/2002increased from 0
to 166 m baht0.32 0.76 1.15 0.76 1.06 0.11 0.91 remain 0 1.25
2002/2001 na na 2.20 11.18 2.20 1.28 2.10 1.10 remain 0 1.98
2001/2000 na na 4.45 0.54 4.45 0.80increased from 0 to 151m baht
0.83 remain 0 0.68
Malawi (last year data available is 2003)
National Level Health Sector Level Program level Activity Level Input level
2003/2006Increased from 0
to 1738 2.2 4 1.5 4 0.99 0.69 69.9Increased from
0 to 1331
Decreased from 59 to 0
Discussion
1. Measurement Lack of good time series data and fluctuations in aid for
health render financial projections and counterfactual difficult to estimate
External funding could lead to reduced OOP expenditures -limited regular HH surveys at country level- difficult to test
2. Interpretation Causality not always possible- Domestic funding may
already be contracting and because of hardship/ crisis
Fungibility might simply reflect a lack of ability to absorb funds, rather than decision to reallocate domestic resources
Reduction in input prices - eg pharmaceuticals may reduce HIV expenditures and may not really be implying fungibility
3. Advisability

Additionality of Health Aid
External resources seem to be negatively related to out-of-pocket spending in low-incomee countries.
02
04
06
08
01
00
Out-
of-
po
cket sh
are
of to
tal he
alth
exp
end
iture
(%
)
0 20 40 60 80 100External sources share of total health expenditure (%)
Source: WHO NHA DatabaseNote: Sub-saharan Africa countries highlighted in blue
External versus out-of-pocket sources of health financingLow-income countries, 2006

1. The global economic scenario
The current global financial crisis is affecting almost all countries at all levels of income
Current crisis differs from previous; starting in the most developed countries, and spreading to those of middle and lower income
Forecast for countries economic growth rates are falling, and the effects for countries are still emerging
The evidence on what the effects on health will be for low income countries are slim But can expect:
Households will experience reductions in employment and income
If catastrophic health events occur many people may be pushed into extreme poverty

The global economic scenario cont.

Summarizing
ODA commitments for health has increased in recent years, but the share going to HSS has been declining, the share going to HIV/AIDS has increased.
HIV/AIDS funds at country level:
Experience show total resource envelope for HIV/AIDS has increased, largely due to the influx of donor funding
Spending shifted from hospitals to health centers and administration.
Additionality:
Recipient governments were generally to be found consistent with the concept of additionality
Donors however did not seem to practice what they preached not really advisable to enforce additionality as a condition.
The current economic crisis will make donors financing vital for HIV and health system but using this money effectively is much more critical for better outcomes.

Thank you