Embed Size (px)
Citation preview
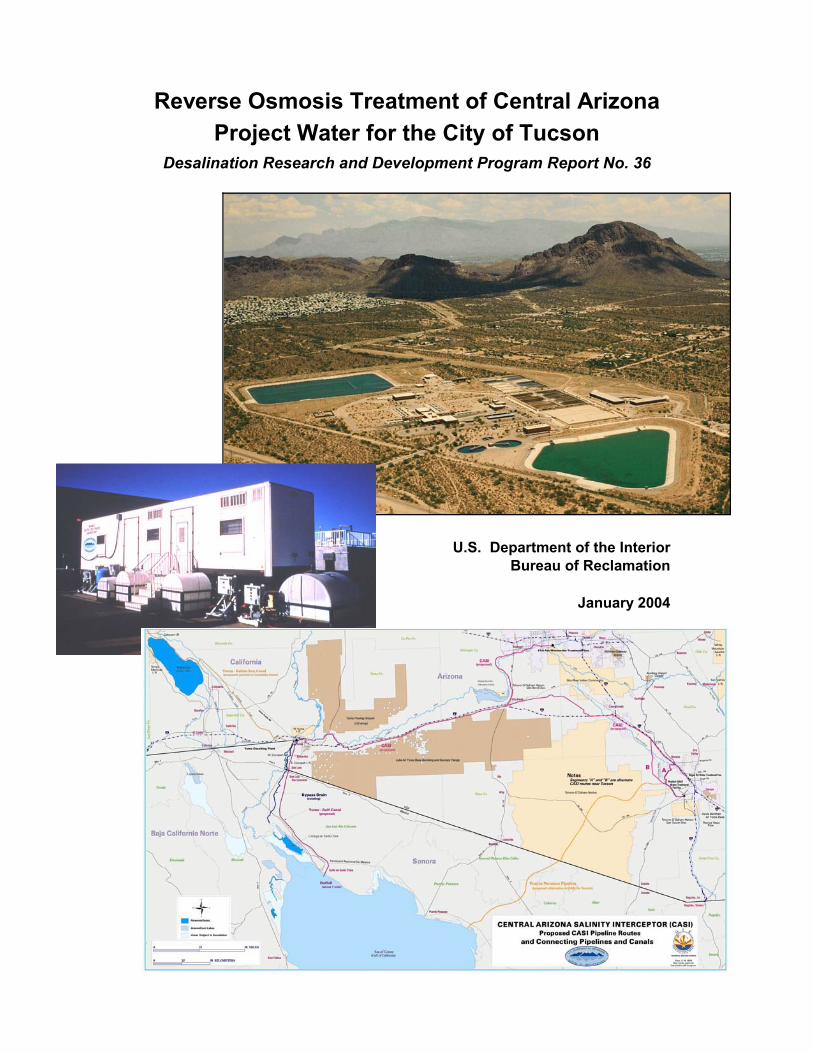
Reverse Osmosis Treatment of Central ArizonaProject Water for the City of Tucson
Desalination Research and Development Program Report No. 36
U.S. Department of the InteriorBureau of Reclamation
January 2004
Water Desalination Act of 1996
The Water Desalination Research and Development Program is authorizedby the Water Desalination Act of 1996 (Act). The Act is based on thefundamental need in the United States and world-wide for additional sourcesof water. The primary goal of this program is to develop more cost-effective,technologically efficient, and implementable means to desalinate water.
Mission Statements
The mission of the Department of the Interior is to protect and provideaccess to our Nation's natural and cultural heritage and honor ourtrust responsibilities to Indian tribes and our commitments to islandcommunities.
_______________________________
The mission of the Bureau of Reclamation is to manage, develop, andprotect water and related resources in an environmentally andeconomically sound manner in the interest of the American public.
Disclaimer
The information contained in this report regarding commercial products orfirms may not be used for advertising or promotional purposes and is not tobe construed as an endorsement of any product or firm by the Bureau ofReclamation.
The information contained in this report was developed for the Bureau ofReclamation; no warranty as to the accuracy, usefulness, or completeness isexpressed or implied.
Reverse Osmosis Treatment of Central Arizona Project Water
for the City of Tucson
Appraisal Evaluation
prepared by theBureau of Reclamation in cooperation with the
Tucson Water Department under
Cooperative Agreement LC-96-2300-02
Workgroup MembersBureau of Reclamation Tucson Water DepartmentChuck Moody Marie PearthreeScott Irvine Bruce GarrettEric Holler Jennifer GillaspieQian Zhang Ted BaileyBill Boegli Mike RingHank Kaplan Dennis Watt
Desal R&D Report No. 36
November 1998January 2004, Revision 1
U.S. Department of the InteriorBureau of Reclamation
REPORT DOCUMENTATION PAGE Form ApprovedOMB No. 0704-0188
Public reporting burden for this collection of information is estimated to average 1 hour per response, including the time for reviewing instrucitons, searching exisitng data sources, gathering and maintainingthe data needed, and completing and reviewing the collection of information. Send comments regarding this burden estimate or any other aspect of this collection of information, including suggestionsfor reducing this burden to Washington Headquarters Services, Directorate for Information Operations and Reports, 1215 Jefferson Davis Highway, Suit 1204, Arlington VA 22202-4302, and to the Officeof Management and Budget, Paperwork Reduction Report (0704-0188), Washington DC 20503.
1. AGENCY USE ONLY (Leave Blank) 2. REPORT DATE
November 20033. REPORT TYPE AND DATES COVERED
Final Revision 14. TITLE AND SUBTITLE
Reverse Osmosis Treatment of Central Arizona Project Water for the City of Tucson: Appraisal Evaluation
5. FUNDING NUMBERS
6. AUTHOR(S)
Bureau of Reclamation7. PERFORMING ORGANIZATION NAME(S) AND ADDRESS(ES)
U.S. Department of the Interior Tucson Water DepartmentBureau of Reclamation PO Box 27210Phoenix Area Office Tucson AZ 85726-7210Phoenix AZ 85069-1169andTechnical Service CenterDenver CO 80225-0007
8. PERFORMING ORGANIZATIONREPORT NUMBER
9. SPONSORING/MONITORING AGENCY NAME(S) AND ADDRESS(ES)
City of Tucson, Tucson AZBureau of Reclamation Science & Technology Program, Denver CO Phoenix Area Office, Phoenix AZ Yuma Area Office, Yuma AZ
10. SPONSORING/MONITORINGAGENCY REPORT NUMBER
11. SUPPLEMENTARY NOTES
12a. DISTRIBUTION/AVAILABILITY STATEMENT
Available from the National Technical Information Service,Operations Division, 5285 Port Royal Road, Springfield, Virginia 22161
12b. DISTRIBUTION CODE
13. ABSTRACT (Maximum 200 words)
The Bureau of Reclamation and the city of Tucson (City) evaluated conceptual designs and costs of reverse osmosis(RO) treatment of Central Arizona Project (CAP) water and disposal of the RO concentrate. RO treatment of CAPwater with a TDS of 700 mg/L recovers 85 percent of the water as product with an average annual TDS of 56 mg/L(95 to 137 mg/L after post-treatment) and discharges 15 percent as brackish concentrate waste with a TDS of 4,400mg/L. The desalted product meets the City’s target levels of 210 mg/L TDS, 84 mg/L hardness, and 0.4 mg/L TOC. Pilot tests selected polyamide RO membranes operating at 17 gfd flux on microfiltration- or ultrafiltration-treatedCAP water. For disposal of 16 MGD (18,100 af/yr) of brackish RO concentrate, the report selected discharge to theGulf of California and recommended a regional salinity interceptor to transport central Arizona brackish waters to theYuma, Arizona, area for beneficial use. For producing 33.5 billion gallons (102,500 af) per year of desalted water, thestudy estimates annual costs to upgrade the existing water treatment facility to include desalting and concentratedisposal as $33 to 41 million per year. These costs correspond to $1.00 to 1.24 per thousand gallons or, in terms ofremoved dissolved salts, $308 to 380 per ton of removed salts.
14. SUBJECT TERMS--water treatment, desalting, Colorado River, pilot tests, reverse osmosis, microfiltration,ultrafiltration, concentrate disposal, Central Arizona Salinity Interceptor, CASI
15. NUMBER OF PAGES
16. PRICE CODE
17. SECURITY CLASSIFICATIONOF REPORT
UL
18. SECURITY CLASSIFICATIONOF THIS PAGE
UL
19. SECURITY CLASSIFICATIONOF ABSTRACT
UL
20. LIMITATION OF ABSTRACT
ULNSN 7540-01-280-5500 Standard Form 298 (Rev. 2-89)
Prescribed by ANSI Std. 239-18298-102
iii
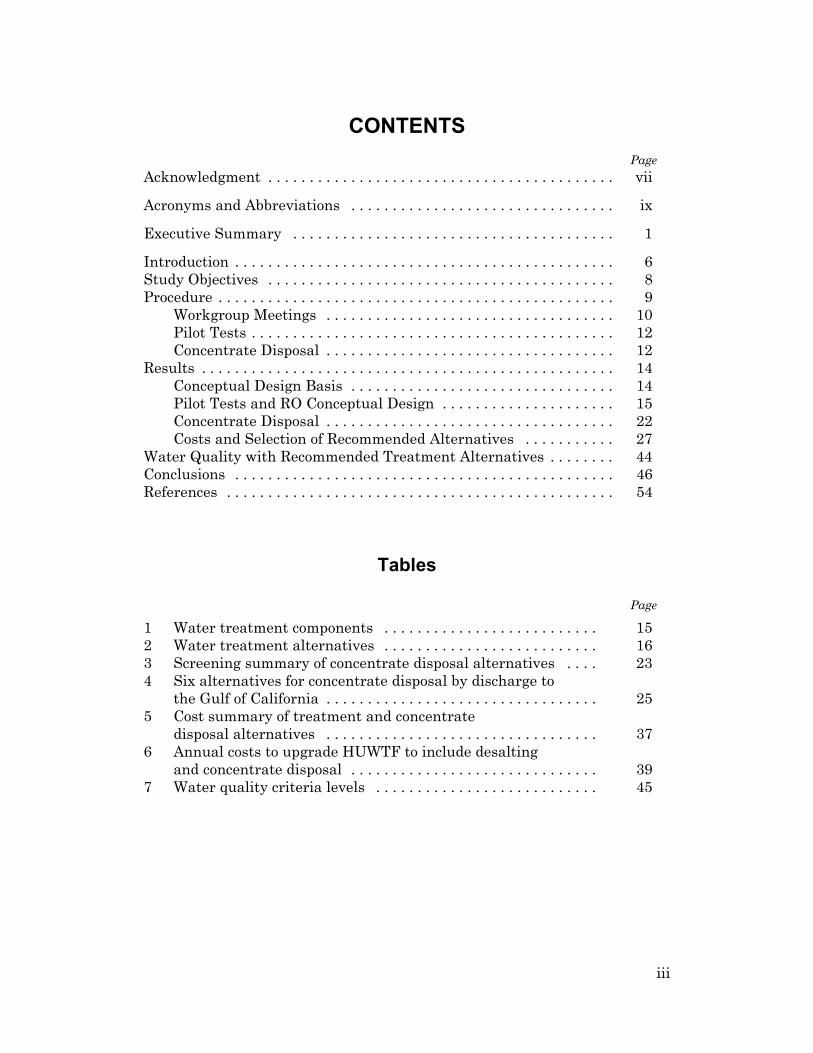
CONTENTSPage
Acknowledgment . . . . . . . . . . . . . . . . . . . . . . . . . . . . . . . . . . . . . . . . . . vii
Acronyms and Abbreviations . . . . . . . . . . . . . . . . . . . . . . . . . . . . . . . . ix
Executive Summary . . . . . . . . . . . . . . . . . . . . . . . . . . . . . . . . . . . . . . . 1
Introduction . . . . . . . . . . . . . . . . . . . . . . . . . . . . . . . . . . . . . . . . . . . . . . 6Study Objectives . . . . . . . . . . . . . . . . . . . . . . . . . . . . . . . . . . . . . . . . . . 8Procedure . . . . . . . . . . . . . . . . . . . . . . . . . . . . . . . . . . . . . . . . . . . . . . . . 9
Workgroup Meetings . . . . . . . . . . . . . . . . . . . . . . . . . . . . . . . . . . . 10Pilot Tests . . . . . . . . . . . . . . . . . . . . . . . . . . . . . . . . . . . . . . . . . . . . 12Concentrate Disposal . . . . . . . . . . . . . . . . . . . . . . . . . . . . . . . . . . . 12
Results . . . . . . . . . . . . . . . . . . . . . . . . . . . . . . . . . . . . . . . . . . . . . . . . . . 14Conceptual Design Basis . . . . . . . . . . . . . . . . . . . . . . . . . . . . . . . . 14Pilot Tests and RO Conceptual Design . . . . . . . . . . . . . . . . . . . . . 15Concentrate Disposal . . . . . . . . . . . . . . . . . . . . . . . . . . . . . . . . . . . 22Costs and Selection of Recommended Alternatives . . . . . . . . . . . 27
Water Quality with Recommended Treatment Alternatives . . . . . . . . 44Conclusions . . . . . . . . . . . . . . . . . . . . . . . . . . . . . . . . . . . . . . . . . . . . . . 46References . . . . . . . . . . . . . . . . . . . . . . . . . . . . . . . . . . . . . . . . . . . . . . . 54
Tables
Page
1 Water treatment components . . . . . . . . . . . . . . . . . . . . . . . . . . 152 Water treatment alternatives . . . . . . . . . . . . . . . . . . . . . . . . . . 163 Screening summary of concentrate disposal alternatives . . . . 234 Six alternatives for concentrate disposal by discharge to
the Gulf of California . . . . . . . . . . . . . . . . . . . . . . . . . . . . . . . . . 255 Cost summary of treatment and concentrate
disposal alternatives . . . . . . . . . . . . . . . . . . . . . . . . . . . . . . . . . 376 Annual costs to upgrade HUWTF to include desalting
and concentrate disposal . . . . . . . . . . . . . . . . . . . . . . . . . . . . . . 397 Water quality criteria levels . . . . . . . . . . . . . . . . . . . . . . . . . . . 45
iv
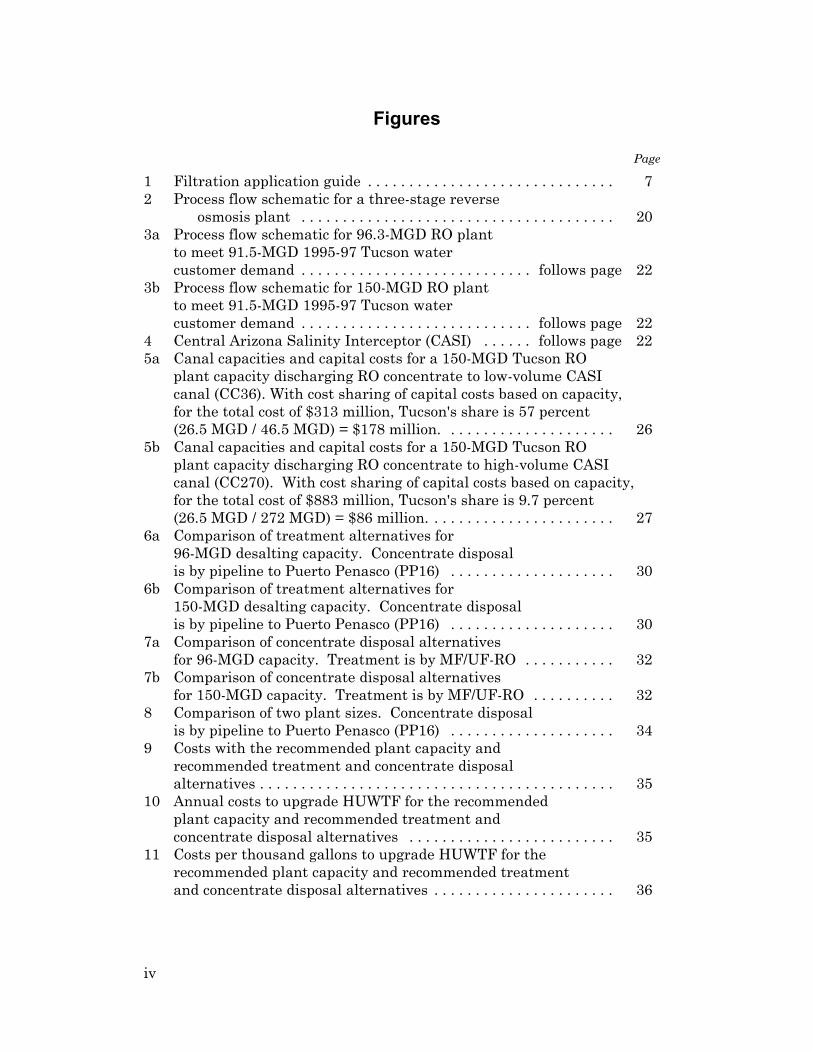
Figures
Page
1 Filtration application guide . . . . . . . . . . . . . . . . . . . . . . . . . . . . . . 72 Process flow schematic for a three-stage reverse
osmosis plant . . . . . . . . . . . . . . . . . . . . . . . . . . . . . . . . . . . . . . 203a Process flow schematic for 96.3-MGD RO plant
to meet 91.5-MGD 1995-97 Tucson water customer demand . . . . . . . . . . . . . . . . . . . . . . . . . . . . follows page 22
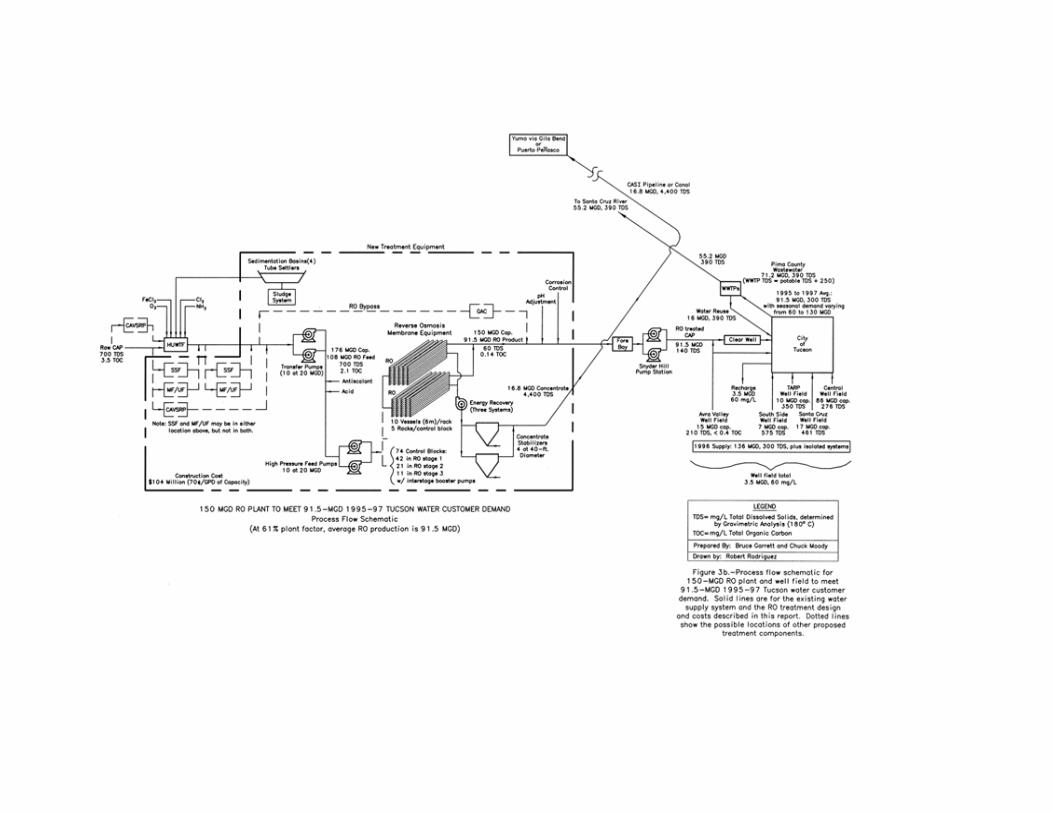
3b Process flow schematic for 150-MGD RO plant to meet 91.5-MGD 1995-97 Tucson water customer demand . . . . . . . . . . . . . . . . . . . . . . . . . . . . follows page 22
4 Central Arizona Salinity Interceptor (CASI) . . . . . . follows page 225a Canal capacities and capital costs for a 150-MGD Tucson RO
plant capacity discharging RO concentrate to low-volume CASI canal (CC36). With cost sharing of capital costs based on capacity, for the total cost of $313 million, Tucson's share is 57 percent (26.5 MGD / 46.5 MGD) = $178 million. . . . . . . . . . . . . . . . . . . . . 26
5b Canal capacities and capital costs for a 150-MGD Tucson RO plant capacity discharging RO concentrate to high-volume CASIcanal (CC270). With cost sharing of capital costs based on capacity,for the total cost of $883 million, Tucson's share is 9.7 percent (26.5 MGD / 272 MGD) = $86 million. . . . . . . . . . . . . . . . . . . . . . . 27
6a Comparison of treatment alternatives for 96-MGD desalting capacity. Concentrate disposal is by pipeline to Puerto Penasco (PP16) . . . . . . . . . . . . . . . . . . . . 30
6b Comparison of treatment alternatives for 150-MGD desalting capacity. Concentrate disposal is by pipeline to Puerto Penasco (PP16) . . . . . . . . . . . . . . . . . . . . 30
7a Comparison of concentrate disposal alternatives for 96-MGD capacity. Treatment is by MF/UF-RO . . . . . . . . . . . 32
7b Comparison of concentrate disposal alternatives for 150-MGD capacity. Treatment is by MF/UF-RO . . . . . . . . . . 32
8 Comparison of two plant sizes. Concentrate disposalis by pipeline to Puerto Penasco (PP16) . . . . . . . . . . . . . . . . . . . . 34
9 Costs with the recommended plant capacity andrecommended treatment and concentrate disposalalternatives . . . . . . . . . . . . . . . . . . . . . . . . . . . . . . . . . . . . . . . . . . . 35
10 Annual costs to upgrade HUWTF for the recommended plant capacity and recommended treatment and concentrate disposal alternatives . . . . . . . . . . . . . . . . . . . . . . . . . 35
11 Costs per thousand gallons to upgrade HUWTF for the recommended plant capacity and recommended treatment and concentrate disposal alternatives . . . . . . . . . . . . . . . . . . . . . . 36
v
12a Annual costs to upgrade HUWTF to include 96-MGDdesalting capacity for all alternatives. Average dailyproduction is 91.5 MGD . . . . . . . . . . . . . . . . . . . . . . . . . . . . . . . . . 41
12b Annual costs to upgrade HUWTF to include 150-MGD desalting capacity for all alternatives. Average dailyproduction is 91.5 MGD . . . . . . . . . . . . . . . . . . . . . . . . . . . . . . . . . 41
13a Costs per thousand gallons to upgrade HUWTF to include 96-MGD desalting capacity for all alternatives . . . . . . . . 42
13b Costs per thousand gallons to upgrade HUWTF to include 150-MGD desalting capacity for all alternatives . . . . . . . 42
AppendicesAppendix A Reverse Osmosis Treatment DesignAppendix B Pre-Appraisal Cost Estimate for Side-Stream Granular
Activated Carbon Treatment Associated with ProposedNanofiltration and Reverse Osmosis Treatment of CentralArizona Project Water
Appendix C Treatment CostsAppendix D Concentrate Disposal Alternatives and CostsAppendix E Summary of Treatment and Concentrate Disposal CostsAppendix F Pilot Plant Tests
vii
AcknowledgmentThis study has been accomplished by the participation of parties not onlywithin the Bureau of Reclamation (Reclamation) and Tucson WaterDepartment but also from other agencies and interest groups. Bureau ofReclamation's workgroup members have been Chuck Moody, Eric Holler,Hank Kaplan, Dennis Watt, Scott Irvine, and Bill Boegli, and Qian Zhang. Other Reclamation contributors include Bill Thompson and Fred Tan fordesign and costs of concentrate disposal pipelines; Mike Miller and JackCunningham for evalu-ation of deep well injection as a concentrate disposalalternative; Mike Norris and Bob Rodriguez for AutoCAD drawings; MikeNorris, Tom Bunnelle, and Michelle Chapman-Wilbert for pilot plantassistance; Qian Zhang for reverse osmosis costs; Vivian Sasser, BillCosgrove, and Terri Wilson for map preparation; Norm Edwards for right-of-way costs, Patty Gillespie for technical editing; and Patty Alexander forediting and formatting.
Tucson Water Department workgroup members have been Marie Pearthree,Jennifer Gillaspie, Bruce Garrett, Mike Ring, and Ted Bailey. Operation andmaintenance of the city of Tucson’s (City’s) and Reclamation's pilot testequipment was performed by Ed Brinson, Phil Firestone, Mike Metzinger,Bob Ornelas, Chris Kincaid, Mike Reed, Magda Thompson, Frank Aman,Laura Bouton, Laren Bunker, Diane Elwood, Keith Eagar, Larry Lopez, GaryPizzuto, Ray Arrellin, Hector Mares, Larry Romero, Jim Stanley, GaryMorey, Carlos Ballesteros, and Scott Burch. The Tucson Water ChemistryLab provided excellent analytical support.
Jim Miller of Process Optimization Services prepared the preliminary designand cost estimates for granular activated carbon (GAC) treatment. DanJohnson of Cypress Sierrita performed extensive pilot tests to assess thevalue of reverse osmosis concentrate for flotation and leaching of mineralores. Roger Jorden of Clear Corporation and John Franklin assisted withpilot tests.
Workgroup meetings were held approximately monthly. These meetingsoffered a valuable forum for public participation and included discussionsand presentations of diverse technical opinions. The following individualsparticipated with the workgroup at one or more meetings: Mohsen Belyani,Tom Jefferson, Bill Vann, Keith Eagar, Clare Conley, Dennis Rule, BillWright, Bruce Masselt, Dave Johnson, John Pagliuso, Mike Metzinger, andDiane Elwood of Tucson Water; Michael Block and Thomas Caito of theMetropolitan Domestic Water Improvement District, Jim Riley of theUniversity of Arizona Environmental Research Laboratory; Jerry Juliani of
viii
the Pure Water Coalition; Brent Cluff and Raydene Cluff of Clean WaterProducts, Mohamad Amin Saad of MASAR Technologies; Mike Caporaso and John Bodenchuk of the Arizona Department of Water Resources; KathleenChavez, Prakash Rao, and Don Armstrong of Pima County WastewaterManagement; Mike Fleury and Scott Toland of Camp Dresser and McKee; Chuck Freitas of Falcon Pools; Russ Howard and Bob Navigato of theCentral Arizona Water Conservation District; Lois Kulakowski of the TucsonRegional Water Council; Cornelius Steelink, Prof. Emeritus of Chemistry ofthe University of Arizona; Ron Wong of BKW Farms; Steve Davis, WarrenSwanson, George Maseeh, and Zaid Chowdhury of Malcolm Pirnie; JimLozier of CH2M Hill; John Bratby of Brown and Caldwell; Michael McGuireof McGuidre Environmental Consultants; Ted Curtis; Dave Gudgel; RonSoroka of U.S. Filter; Ed Lowell; Mort Seymour; Shirley Clouse; Jim King;Kevin Adam of the Office of Senator John McCain; Vicente Sanchez-Martinezof the Pima County Development Services Department.
Also, Dennis Douglas, Patti Woodcock, and Sharon Reburn of the PimaCounty Health Department; Jim Peterson, Town of Oro Valley; Kurt Frankof Carollo Engineers; Roger Jorden of Clear Corporation; Herman Bouwerand Roger Visser of the U.S. Water Conservation Laboratory; Maggie Wolfeof PerLorica; Bob Riley and Clyde Milstead of Separation SystemsInternational; Bob Ning and Chris Belli of King Lee Technologies; RandyMcIff of Thatcher Company of Arizona; Rob McCandless of HDREngineering; Mitch O’Hair of Mitchell Filtration; Brett Andrews of ChemInc.; Dan Johnson and Martin Jones of Cyprus Sierrita; Mike Goff of theSouthern Nevada Water Authority; George Miller, Mayor of the City ofTucson; Pat Wiedhopf and Rikki Heimlich of the Ward 2 Council Office,Carolyn Campbell of the Ward 4 Council Office; and Stan Hightower andMike Miller of Reclamation.
The following individuals provided additional valuable technical reviews andcomments: Peter Metcalfe of Fluid Systems; Scott Rappoport and Steve Alt ofHydranautics; Scott Beardsley and Terry Smith of DOW Chemical; JohnFranklin; John Kaakinen of Chemetek; Steve Duranceau of BoyleEngineering, Leonard Dueker of DCI; Paul Hendricks of EnvironmentalUtilities Services; and Jeff Taylor of Brown & Root.
ix
Acronyms and Abbreviations
af Acre-foot volume of water; multiply by 325,851 to convert togallons
af/yr Acre-feet per year water flow; multiply by 0.620 to convertto gallons per minute; divide by 724 to convert to cubicfeet per second
AMWUA Arizona Municipal Water Users AssociationASR Aquifer storage and recoveryAWWARF American Water Works Association Research FoundationCA Cellulose acetateCAP Central Arizona ProjectCASI Central Arizona Salinity Interceptor (proposed pipeline or
canal from Tucson and Phoenix to Yuma)CAVSRP Central Avra Valley Storage and Recovery ProjectCF Cartridge filtrationCity City of TucsonCT Conventional treatmentCRA Colorado River Aqueduct DBP Disinfection byproductDRIP Desalination Research and Innovation PartnershipGAC Granular activated carbongal/min Gallons per minutegfd Gallons per square foot per day membrane water flux;
divide by 2.12 to convert to 10-6 m/sgpd Gallons per day plant capacityHDPE High-density polyethyleneHUWTF Hayden Udall Water Treatment FacilityIBWC International Boundary and Water Commissionkgal Thousand gallonsMF MicrofiltrationMF/UF Microfiltration or ultrafiltrationMGD Million gallons per day; multiply by 1,121 to convert to
acre-feet per year; multiply by 1.547 to convert to cubicfeet per second
mg/L Milligrams per liter concentration; multiply by 0.00136 toconvert to tons per acre-foot
MTBE Methyl Tertiary-Butyl EtherNF NanofiltrationNF/RO Nanofiltration or reverse osmosisPA Polyamide
x
PP Pilot plantppt parts per thousandpsi Pounds per square inch pressure; divide by 14.5 to convert
to bars; multiply by 6.895 to convert to kPapsig Pounds per square inch gaugeReclamation Bureau of ReclamationRO Reverse osmosisSARI Santa Ana Regional InterceptorSDI Silt Density Index measurement (ASTM Method D 4189)SROG Arizona Municipal Water Users Association Subregional
Operating GroupSSF Slowsand filtrationTARP Tucson Airport Remediation ProgramTDS Total dissolved solids concentration, the measure of
salinity,mg/L. TDS is measured by evaporation at180 °C. It is also calculated from the concentrations ofsolutes in the water by the equation: TDS = 0.6*alkalinity + Na + K + CA + Mg + SO4 + SiO3 + NO3 + F
TDS, RO sum RO membrane manufacturers frequently refer to the sum of all solutes as TDS. TDS, RO sum, does not subtractany alkalinity, includes alkalinity as carbonate andbicarbonate, and includes silicon as SiO2 mg/L
TOC Total organic carbon concentration, mg/LUF UltrafiltrationWCPA Water Consumer Protection ActWQIC Bureau of Reclamation Water Quality Improvement Center
inYuma, ArizonaWTF Water treatment facilityWWTP Wastewater treatment plant
1
Executive Summary
This report addresses the feasibility and estimated costs of reverse osmosis(RO) treatment of Central Arizona Project (CAP) canal water. The study wassponsored by the Science and Technology Program and Phoenix Area Officeof the Bureau of Reclamation and by the City of Tucson.
Reverse Osmosis
RO is a water treatment process that cleans and purifies water by usingpressure to push water, but not dissolved salts and many othercontaminants, through membranes. The low-salinity RO finished productwater has economic benefits, including reduced corrosion of water fixturesand appliances. RO treatment provides public health benefits, includingserving as an effective barrier for removal of waterborne microorganisms,such as cryptosporidium and giardia, and producing water that meets allprimary and secondary drinking water standards.
Another advantage is that with the low-total organic carbon (TOC) levels inthe RO product, chlorine disinfection can be used instead of chloraminedisinfection. RO is very effective at removing TOC compounds that reactwith free chlorine to form toxic disinfection byproducts (DBPs) regulatedunder the Disinfectants/Disinfection Byproducts Rule of the Safe DrinkingWater Act. The use of free chlorine with RO-treated CAP water mayimprove its compatibility with the existing chlorinated groundwaters byavoiding mixing chloraminated and chlorinated waters. Such mixing maycreate taste and odors in the combined water supply. The ability to carry afree chlorine residual with RO-treated CAP water avoids this problem oravoids the potential need to chloraminate existing groundwater supplies.
In addition to producing high-quality, low-salinity product water, the ROprocess also produces a salty waste stream or “concentrate.” All ROdesalting plants require concentrate disposal, which is generally problematicbecause the concentrate contains all the constituents removed from thesource water.
Reverse Osmosis Treatment of CAP Water
2
Procedures
The Bureau of Reclamation (Reclamation) and the City of Tucson (City)cooperatively evaluated conceptual designs and costs of RO treatment of CAPwater and disposal of the RO concentrate. The evaluation process consistedof workgroup meetings, pilot plant water treatment tests, appraisal levelconceptual design analyses of pretreatment and desalting systems, and thedevelopment and evaluation of concentrate disposal alternatives.
The November 1998 draft report contained cost estimates for treatments andconcentrate disposal, as well as appendices A - E with design and costinformation. In May 1999, City and Reclamation representatives refined thefocus of the conceptual designs for plant size and concentrate disposal andproceeded with additional pilot tests to confirm the effectiveness andreliability of the selected treatment processes. This report applies November1998 cost information for the two plant sizes, four treatment alternatives,and six concentrate disposal alternatives selected at the May 1999 meeting,as well as results from all pilot tests. The design does not include interim(1998 - 2003) developments and information regarding water treatmenttechnologies, and costs remain in 1998 dollars.
Water Treatment ResultsPilot plant tests were used to establish acceptable conceptual designparameters, including pretreatment, RO membrane type and rejection, waterrecovery, membrane water flux, and concentrate stabilization. Based onthese tests, RO treatment of CAP water with total dissolved solids (TDS) of700 milligrams per liter (mg/L) recovers 85 percent of the water as productwith an average annual TDS of 56 mg/L and discharges 15 percent asbrackish concentrate waste with a TDS of 4,400 mg/L.
The average annual expected RO product water quality levels are 56 mg/LTDS, 5.4 mg/L hardness, and 0.14 mg/L TOC. Projected post treatmentstabilization with low-turbidity lime and carbon dioxide raises the averageannual TDS level to 95 to 137 mg/L and hardness concentration to 44 to 86mg/L (2.6 to 5.0 grains/gallon).
In the summer when salt rejection is lowest in a constant-flux RO plant, theexpected RO product water quality levels are 69 mg/L TDS, 6.9 mg/Lhardness, and 0.14 mg/L TOC. Projected post treatment stabilization withlow-turbidity lime and carbon dioxide raises the summer TDS level to 108 to166 mg/L and hardness concentration to 46 to 104 mg/L (2.7 to 6.1
Research Report
3
grains/gallon). Caustic soda can replace some of the lime to reduce theadded hardness.
These levels can meet the requirements of the City’s 1995 Water ConsumerProtection Act (WCPA) criteria of 210 mg/L TDS, 84 mg/L hardness, and 0.4mg/L TOC.
To keep RO operating costs low with low operating pressures and longmembrane lives, fouling must be kept low. To avoid fouling and coating ofthe RO membranes with particulates, the study evaluated conventionaltreatment (CT) and microfiltration or ultrafiltration (MF/UF). Because pilotstudies indicated that the CT was much less reliable than MF/UF inproducing foulant- and scalant-free water for RO operation, the studyselected MF/UF with or without existing Hayden Udall Water TreatmentFacility (HUWTF) rapid sand filters operating upstream of the MF/UFequipment.
The study evaluated treatment by granular activated carbon (GAC) inparallel to RO, but estimated that the GAC process would not result in lowercosts and would add complexity and produce lower-quality water.
To produce 33.4 billion gallons per year at a daily average of 91.5 milliongallons per day, the study considered two RO plant capacities—96.3 and 150 MGD as desalted RO product. The constant-production 96.3-MGD sizeplant incorporates existing City wells into an aquifer storage and recovery(ASR) system to meet peak demands in the summer. The variable-production 150-MGD size plant meets summer peak-day flows without ASR. The study estimates that the 96.3-MGD size plant with ASR costs less thanthe 150-MGD size plant by $9.5 million per year. This cost differencecorresponds to approximately 25 percent of the cost to incorporate a 150-MGD desalting plant with concentrate disposal. Until issues of potentialdegradation of water quality during aquifer storage and recovery (ASR) canbe resolved, however, the authors recommend the higher-cost 150-MGDplant capacity.
Concentrate Disposal ResultsDisposal of the brackish RO concentrate at Tucson's inland site presents aserious challenge. With an average RO product flow of 91.5 MGD, theaverage concentrate flow of 16.1 MGD (18,100 af/yr) contains 108,600 tons/yrof dissolved salts at a concentration of 4,400 mg/L (6.0 tons/af) TDS. Studyparticipants explored and evaluated a host of alternatives, including
Reverse Osmosis Treatment of CAP Water
4
discharge to the Gulf of California, deep well injection, reuse at a local mine,fossil fuel evaporator/crystallizer, solar ponds, evaporation ponds, halophyteirrigation, and discharge to wetlands or brackish water reservoir. Studyparticipants selected discharge to the Gulf of California as the mostpromising concentrate disposal alternative based on the criteria ofeffectiveness, implementability, and cost.
Discharge to the Gulf of California can follow either of two gravity flowroutes. With no partners to share in the disposal costs, the lower-cost routeruns from Tucson southwest to Mexico discharging into the Gulf of Californiaeast of Puerto Penasco where the brackish water is expected to have severalbeneficial uses. The estimated cost to upgrade the existing HUWTF toinclude 150-MGD of RO desalting capacity and dispose of the concentrate ina pipeline to Puerto Penasco (alternative 150:UF-RO-PP16) is $41 million peryear corresponding to $1.24 per thousand gallons of desalted product wateror $380 per ton of removed salts
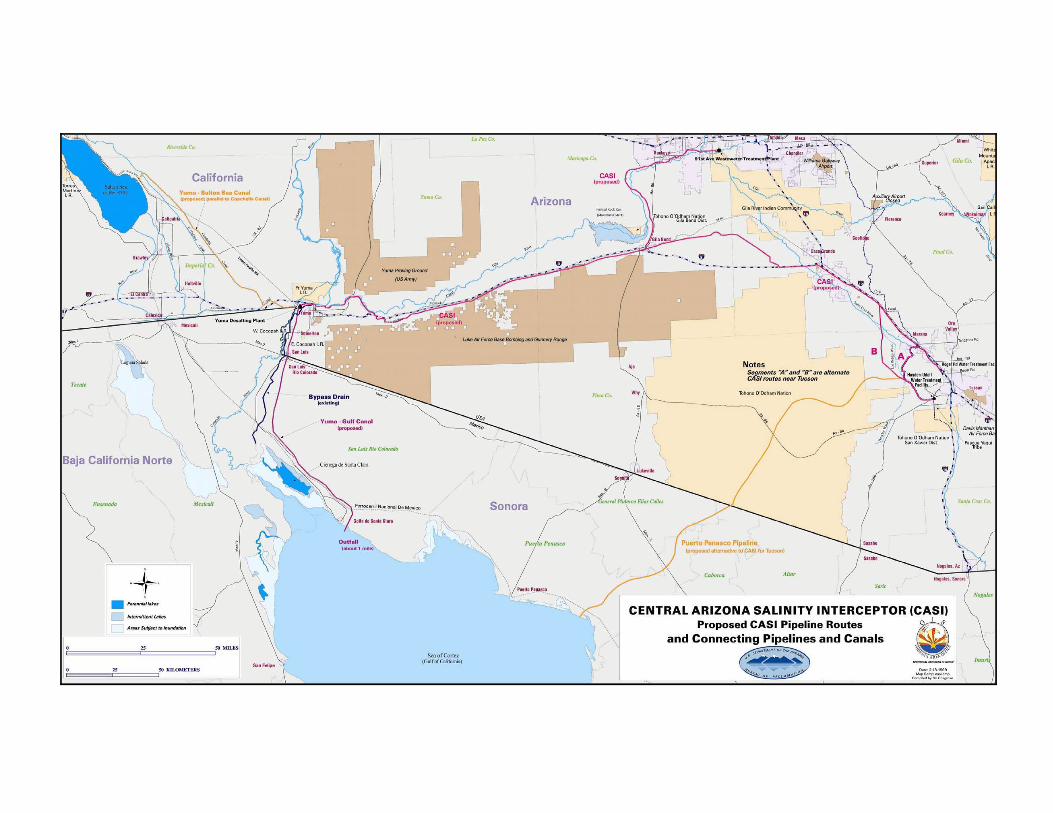
The authors recommend a second, potentially more economical, concentratedisposal alternative that offers a regional solution to projected needsthroughout central Arizona for the discharge of brackish residual watersfrom desalting plants, water reuse plants, and urban and agriculturalirrigation. The proposed Central Arizona Salinity Interceptor (CASI)consists of pipeline and canal sections to collect and transport brackishwaters by gravity from the Tucson and Phoenix areas to Yuma.
At Yuma, the brackish water has several potential beneficial uses, includingsupplying additional brackish water to the Cienega de Santa Clara (SantaClara Wetland) in Mexico, supplying additional freshwater through desaltingat the Yuma Desalting Plant, supplying relatively fresh water to lower thesalinity of the Salton Sea, and supplying brackish water to restore andmaintain the ecology of frequently-dry stretches of the Colorado River andColorado Delta in Mexico. CASI could be operated by the Central ArizonaWater Conservation District in the same manner that the Santa AnaWatershed Protection Authority operates the Santa Ana Regional Interceptor(SARI) pipeline for Los Angeles, California, and its suburbs.
With cost-sharing associated with 20-MGD or greater flow from the Phoenixarea, CASI becomes more economical than a pipeline to Puerto Penasco. With participation in a 36-MGD low-volume CASI canal, the estimated costto upgrade the HUWTF to include 150-MGD of RO desalting capacity anddispose of the concentrate (alternative 150:HU-UF-RO-CC36) is about thesame as with an unpartnered pipeline to Puerto Penasco: $41 million peryear corresponding to $1.23 per thousand gallons of desalted product water
Research Report
5
and $380 per ton of removed salts. Up to 20 percent lower costs can beachieved by participating in the construction and operation of a high-volumeCASI canal for discharging up to approximately 270 MGD (300,000 acre-feetper year), the projected accumulation of brackish water in Central Arizona.
Conclusion
In summary, the study finds that MF/UF and RO treatment withconcentrate disposal offers a technically feasible process for producing 33.5billion gallons (102,500 af) per year of desalted water. The study estimatesannual costs to upgrade HUWTF to include desalting and concentratedisposal to be $33 to $41 million per year ($1.00 to $1.24 per thousandgallons), depending on the concentrate disposal selected.
6
IntroductionThe city of Tucson (City) is evaluating nanofiltration (NF) and reverseosmosis (RO) membrane treatment as part of its efforts to use its waterresources in the most efficient manner possible and to maintain itshistorically high quality water.
The economic benefits of maintaining low salinity waters are significant. Two recent studies (Dames and Moore, 1995, and Bookman-Edmonston,1998) estimated different, but nevertheless considerable, economic benefits ofusing low salinity waters. The benefits are based on a range of effectsincluding, for example, salinity effects on the effectiveness of laundrydetergents, repairs and replacement of plumbing fixtures and homeappliances, car radiator life, and the extent to which customers individuallyseek to avoid salinity effects by installing water softeners and home filtrationsystems and purchasing bottled water.
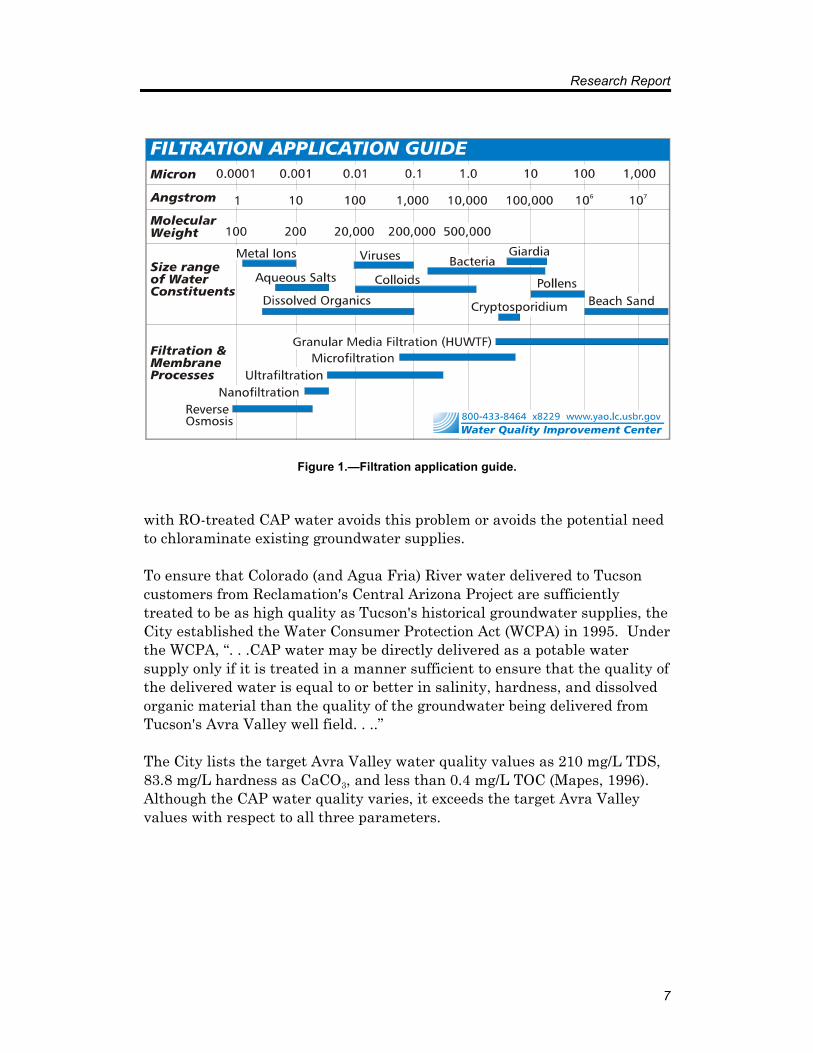
Delivery of low-total dissolved solids (TDS), low-total organic carbon (TOC)RO-treated Central Arizona Project (CAP) waters has other advantages,including providing a barrier for increased removal of waterbornemicroorganisms, including viruses, cryptosporidium, and giardia (seefigure 1); removal of organic precursors to disinfection byproducts (e.g.,trihalomethanes); and removal of many inorganic contaminants and someorganic contaminants. For example, RO effectively removes twocontaminants found in Colorado River water: perchlorate (Riley, 1998; Liang,et al. 1999) and methyl tertiary-butyl ether (MTBE) (Liang, et al. 1999).
Another advantage is that with the low-total organic carbon (TOC) levels inthe RO product, chlorine disinfection can be used instead of chloraminedisinfection. RO is very effective at removing TOC compounds that reactwith free chlorine to form toxic disinfection byproducts (DBPs) regulatedunder the Disinfectants/Disinfection Byproducts Rule of the Safe DrinkingWater Act. The use of free chlorine with RO-treated CAP water may greatlyimprove its compatibility with the existing chlorinated groundwaters byavoiding mixing chloraminated and chlorinated waters. Logsdon et al. (1999)report it inadvisable to mix waters, such as chloraminated CAP water andwell waters containing free chlorine, because at the interface of the twosupplies, the free chorine may react with the monochloramines, therebyreducing the free chlorine level and possibly forming dichloramine ornitrogen trichloride compounds. All three results may create taste and odorsin the combined water supply. The ability to carry a free chlorine residual
Research Report
7
Figure 1.—Filtration application guide.
with RO-treated CAP water avoids this problem or avoids the potential needto chloraminate existing groundwater supplies.
To ensure that Colorado (and Agua Fria) River water delivered to Tucsoncustomers from Reclamation's Central Arizona Project are sufficientlytreated to be as high quality as Tucson's historical groundwater supplies, theCity established the Water Consumer Protection Act (WCPA) in 1995. Underthe WCPA, “. . .CAP water may be directly delivered as a potable watersupply only if it is treated in a manner sufficient to ensure that the quality ofthe delivered water is equal to or better in salinity, hardness, and dissolvedorganic material than the quality of the groundwater being delivered fromTucson's Avra Valley well field. . ..”
The City lists the target Avra Valley water quality values as 210 mg/L TDS,83.8 mg/L hardness as CaCO3, and less than 0.4 mg/L TOC (Mapes, 1996). Although the CAP water quality varies, it exceeds the target Avra Valleyvalues with respect to all three parameters.
Reverse Osmosis Treatment of CAP Water
8
Study ObjectivesTo estimate the costs and viability of membrane treatment of CAP water, thestudy addresses the following questions:
1. What NF or RO membrane types are most appropriate and costeffective?
2. What is the maximum product water recovery that can be achievedwhile avoiding membrane scaling by the precipitation of low-solubilitysalts? These estimated maximum water recoveries were verified duringonsite pilot operations.
3. Do the City's existing filtration and chloramine disinfection provideadequate pretreatment for the membrane process as evaluated duringonsite pilot operations to measure membrane fouling and degradation. Ifthe City's existing treatment does not provide adequate pretreatment,what are the recommended modifications and estimated costs of thesemodifications?
4. What are the quantity and composition of the membrane concentrate? Can the membrane concentrate be utilized for beneficial use? If not,what are the estimated costs to dispose of this brackish water?
5. What are the estimated costs (per preappraisal-grade estimates withan accuracy of plus 50 and minus 30 percent) to implement this advancedtreatment option including cost of pretreatment modifications, membranetreatment, and the use or disposal of the membrane concentrate?
6. If the estimated costs appear potentially affordable, what additionalpilot plant, regulatory, and cost questions need to be answered in thenext evaluation stage of this water treatment option?
Research Report
1Attendance at this May 19, 1999, meeting were:From Tucson Water—David Modeer, John Nachbar, Marie Pearthree, Bruce Johnson,
Barbara Buus, David Cormier, Jim Lozier (CH2M Hill consultant).From Reclamation—Chuck Moody, Eric Holler, Stan Hightower, Tom Wotring
9
ProcedureIn November 1996, Tucson Water and the Bureau of Reclamation(Reclamation) entered into a cooperative agreement to evaluate the costsand viability of membrane treatment of CAP water. The evaluation processconsisted of workgroup meetings, pilot plant water treatment tests,appraisal-level conceptual design analyses, and the development andevaluation of concentrate disposal alternatives.
The initial draft report was published in November 1998. In May 19991,Tucson Water and Reclamation representatives refined the focus of andoutlined additional information needed for the conceptual designs. Theoriginal design and cost information remain as originally listed inAppendices A - E. Each appendix is followed by the first revision of thatappendix, “Revision 1,” that contains design and cost information to addressthe directions of the May 1999 meeting. To address uncertainties regardingthe effectiveness of pretreatment to RO equipment, additional pilot testswere conducted in 1999. Appendix F describes pilot tests and test results.
The revised evaluations of designs and costs include:
1. A reduction in the number of RO plant sizes from three sizes: 50, 100,and 150 million gallons per day (MGD) to two sizes: 96.3 MGD with aquiferstorage and recovery (ASR) and 150 MGD, sized to meet peak-day demand inthe summer without ASR.
2. Based on successful pilot tests, the selection of microfiltration orultrafiltration (MF/UF) as pretreatment to desalting by reverse osmosis (RO)(see table 2, treatment alternatives 7 and 10).
3. To achieve lower treatment costs, treatment designs incorporatingnondesalted “blend” water treated by granular activated carbon (GAC) toremove total organic carbon (see table 2, treatment alternatives 7a and 10a).
4. A description of and cost estimates for post-treatment stabilization of thedesalted water.
Reverse Osmosis Treatment of CAP Water
10
5. Further evaluation of the recommended concentrate disposal alternative: Discharge to the Gulf of California for six alternatives, involving two routeswith and without cost-sharing from partnering municipalities.
This report revision describes the conceptual designs and estimated costs forthe 48 combinations of two plant sizes, four treatment alternatives, and sixconcentrate disposal alternatives.
Workgroup Meetings
City and Reclamation workgroup members met 20 times (approximatelymonthly) to coordinate activities, monitor pilot tests, and review and discussprogress. Interested parties and representatives from State and localagencies were invited. Average meeting attendance included 14 nonwork-group members.
In addition to presentations and discussions by workgroup members,workgroup meetings included the following presentations and/or reports:
Jim Lozier (CH2M Hill), Plugging Factor Tests at Phoenix-Area CAPWater Plants. Silt density index (SDI) levels at four plants rangedfrom 2.3 to 5.3, low enough to consider for RO operation, whichrequires SDI levels less than 5.
Michael McGuire (McGuire Environmental Consultants), CustomerFocus on Water Quality Program.
Brent Cluff (Clean Water Products) described slowsand filtration(SSF) as pretreatment to nanofiltration (NF) and exhibited his SSF-NF pilot plant equipment.
Mohammed Amin Saad (MASAR Technologies) demonstratedsoftware for monitoring RO plant performance.
Dr. James Riley and Dr. Edward Glenn (University of ArizonaEnvironmental Research Laboratory), Acceptability of Potential WaterSupplies to the Santa Clara Wetlands with Respect to Salinity andSelenium (see appendix D for report). Water presently entering theSanta Clara Wetland in the MODE and Riito canals is beyond thesalinity optimum for the dominant vegetation, and the seleniumconcentration puts it in the high risk category for wetlands. Nevertheless, this water supports a valuable and unique wetland inthe Colorado River delta. Preserving the size, wetland values, andsafety of the wetland will require that water of equal or better quality
Research Report
11
with respect to salinity and selenium should make up the inflowsource. The models show that water of higher quality can besubstituted in lower volume for water presently entering the SantaClara Wetland at 3.1 parts per thousand (ppt) (3,100 mg/L) TDS. Conversely, water of higher salinity can substitute in higher volume,but the upper salinity limit of 6 ppt (6,000 mg/L) for the vegetationand the possibly greater selenium risk associated with higher-salinitywater, place constraints on this option (Tanner et al., 1997).
Bob Riley (Separation Systems International) described RO elementmaterials and fabrication and RO element autopsy procedures.
Steve Davis (Malcolm Pirnie), Central Avra Valley Storage andRecovery Project Task 6 - Water Quality Management Program.Bench-Scale Iron Release Testing Program: Phase I Results.
Mike Miller (Reclamation), Geological Assessment of Deep WellInjection in the Tucson and Avra Valley Basins (see appendix D forreport).
Herman Bouwer (U.S. Water Conservation Laboratory), Arizona’sLong-Term Water Outlook: From NIMTO to AMTO. Dr. Bouwerdescribed the need to remove and dispose of salts brought into theCentral Arizona area from the Colorado and Salt Rivers (Bouwer,1997).
Brett Andrews (PermaCare) described the use of antiscalants toprevent RO scaling from low solubility solutes.
Bob Ning (King Lee Technologies) described the use of antiscalants toprevent RO scaling from low solubility solutes and antifoulants toreduce RO fouling.
Maggie Wolfe (PerLorica) described Colorado River water RO pilottests being conducted by the Metropolitan Water District of SouthernCalifornia as part of the Desalination Research and InnovationPartnership (DRIP).
Dan Johnson (Cyprus Sierrita Corporation) presented results ofbench-scale evaluations of different waters (including RO concentrate)for use in the flotation recovery of copper and molybdenum frommined ores.
Reverse Osmosis Treatment of CAP Water
12
Pilot Tests
Pilot tests were conducted using Reclamation’s Mobile Treatment Plant andthe City's Hayden Udall Pilot Plant (PP), constructed during the study (seeappendix F for detailed descriptions of test and test results).
The 16-gallon per minute (gal/min) Hayden Udall PP, modeled after the full-scale Hayden Udall Water Treatment Facility (WTF), includes ozonation,coagulation, chlorine disinfection, and gravity filtration. Sedimentationtanks were added upstream of the filters to lengthen the periods betweenfilter backwashes (filter runs).
The Mobile Treatment Plant contains a pilot 6-gal/min nanofiltration/reverseosmosis (NF/RO) unit operating with 2.5-inch diameter NF/RO elements in a2:1 array. Associated chemical feed systems and controls are provided forpH, chlorine, ammonia, and antiscalants.
A 6-gallon-per-minute Zenon unit equipped with microfiltration (MF)membranes for some tests and ultrafiltration (UF) membranes for other testswas tested to evaluate the effectiveness of MF/UF pretreatment for reverseosmosis.
An automatic silt density index (SDI) instrument (Chemetek FPA-3300) wasused to monitor particulate levels in pretreatment products and ROfeedwater. SDI (by ASTM Method D 4189) uses the flow rate through0.45-µm pore size filter paper as a measure of particulate content. SDImeasurements are better than turbidity measurements for determining thepotential for colloidal and particulate fouling and simpler than particleanalysis measurements.
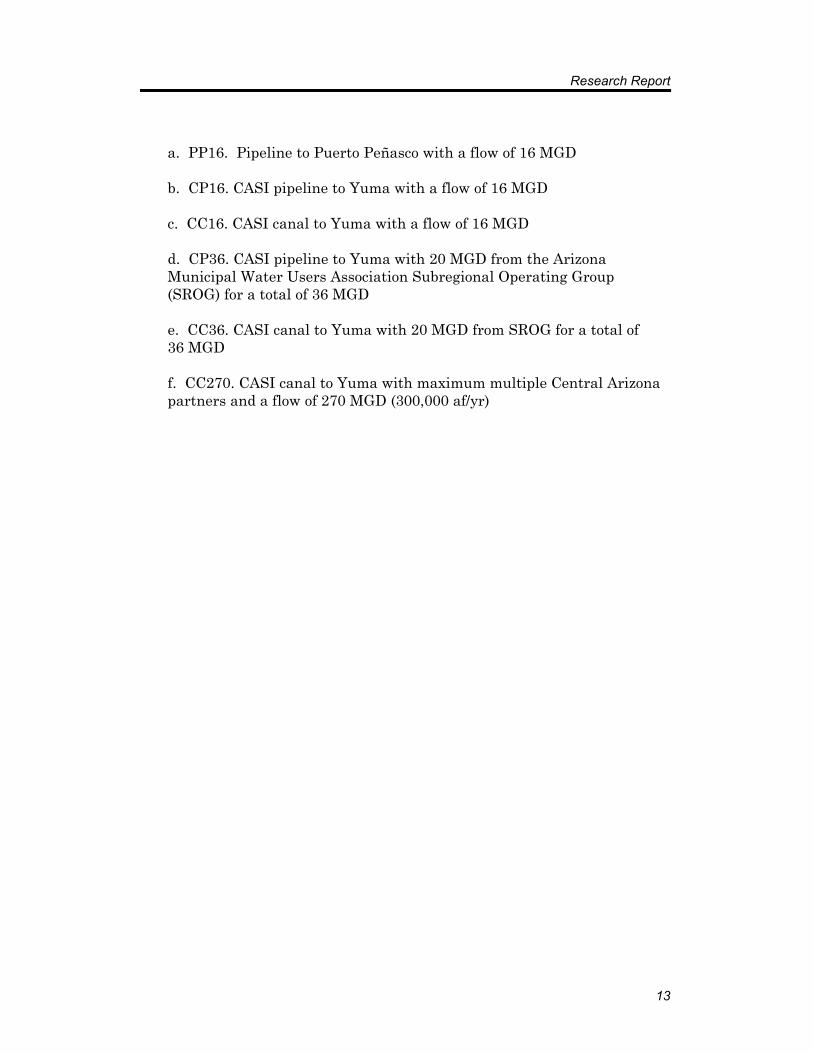
Concentrate Disposal
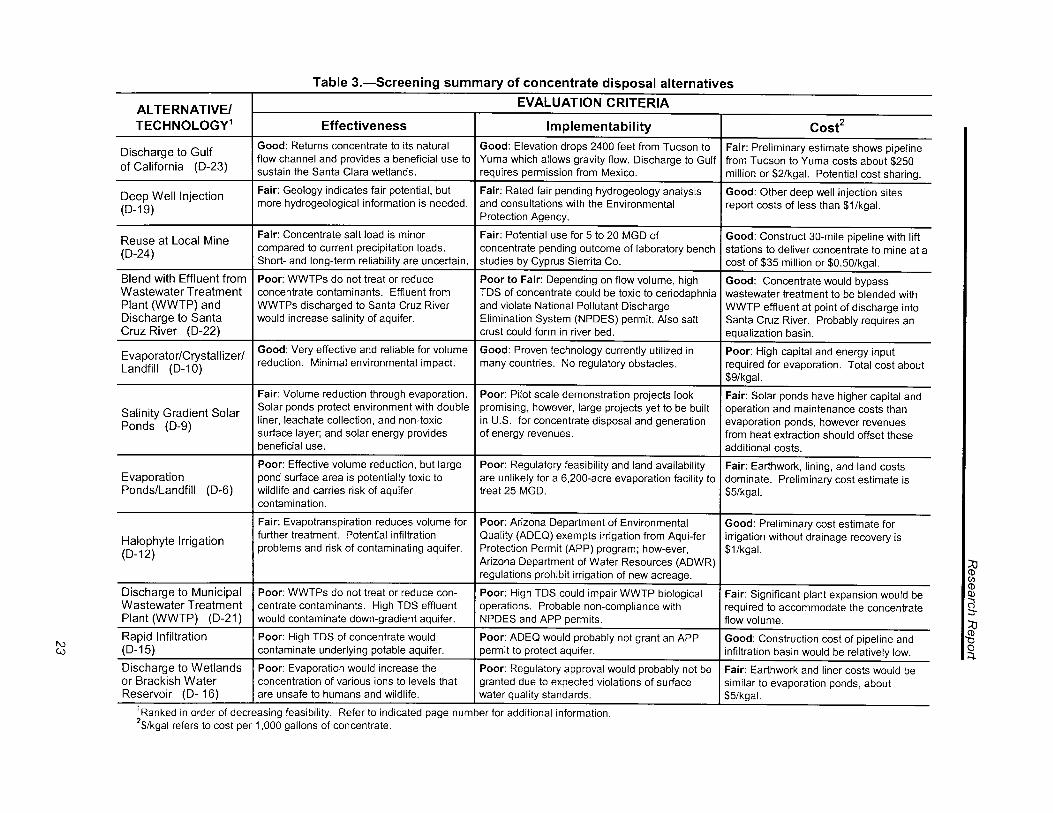
For the disposal or reuse of the concentrate flow from the RO system, theworkgroup originally developed and conducted a screening evaluation of11 alternatives (see table 3) and selected 4 alternatives for detailed analyses(see appendix D for descriptions and cost analyses of the alternatives andanalyses).
In May 1999, City and Reclamation representatives selected six concentratedisposal alternatives for cost analyses (see appendix D, revision 1). Thisreport revision presents the costs of the following six concentrate disposalalternatives.
Research Report
13
a. PP16. Pipeline to Puerto Peñasco with a flow of 16 MGD
b. CP16. CASI pipeline to Yuma with a flow of 16 MGD
c. CC16. CASI canal to Yuma with a flow of 16 MGD
d. CP36. CASI pipeline to Yuma with 20 MGD from the ArizonaMunicipal Water Users Association Subregional Operating Group(SROG) for a total of 36 MGD
e. CC36. CASI canal to Yuma with 20 MGD from SROG for a total of36 MGD
f. CC270. CASI canal to Yuma with maximum multiple Central Arizonapartners and a flow of 270 MGD (300,000 af/yr)
Reverse Osmosis Treatment of CAP Water
14
ResultsThe results are summarized in this section and presented in detail in theappendices.
Conceptual Design Basis
Tucson Water Deliveries
For the period 1995-97, Tucson Water Department delivered an average of33.4 billion gallons (104,300 acre-feet) of water each year (Tucson WaterDepartment, 1996, 1997, 1998). The average monthly water deliveries rangefrom 64 million gallons per day (MGD) in March to 123 MGD in July.
Projected future annual deliveries to the city of Tucson are 55.6 billiongallons (173,900 acre-feet) (Bureau of Reclamation [Reclamation], 1998a). The average projected future monthly deliveries range from 109.6 MGD inJanuary to 177.5 MGD in September.
The average daily flows are 91.5 MGD for 1995-97 and 155.1 MGD in thefuture.
Reverse Osmosis Plant Capacities
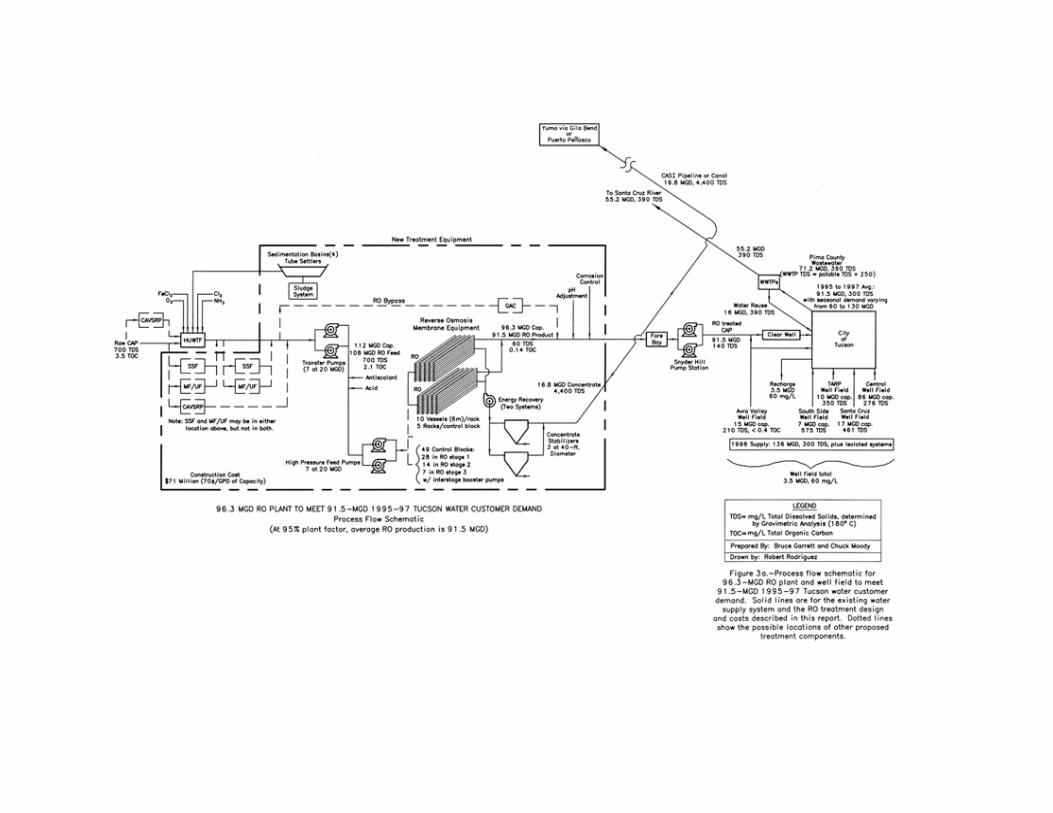
This report considers two reverse osmosis (RO) plant sizes: 96.3 and150 MGD as RO product water.
The 96.3-MGD capacity plant operates year-round at an assumed plantfactor of 95 percent at constant production of 91.5 MGD. Incorporatingaquifer storage and recovery, from October through May excess RO productis conveyed through the existing water distribution systems to recharge wellsin the central wellfield. From June through September, the water isrecovered to supplement the RO plant production and meet peak demand.
The 150-MGD capacity plant is sized to meet the peak day demand needs inthe summer. At other times of the year, it operates at less-than-full capacitywith an average operating factor of 61 percent. Both RO plant sizes producean average of 91.5 MGD and a total annual production of 33.4 billion gallons.
Research Report
15
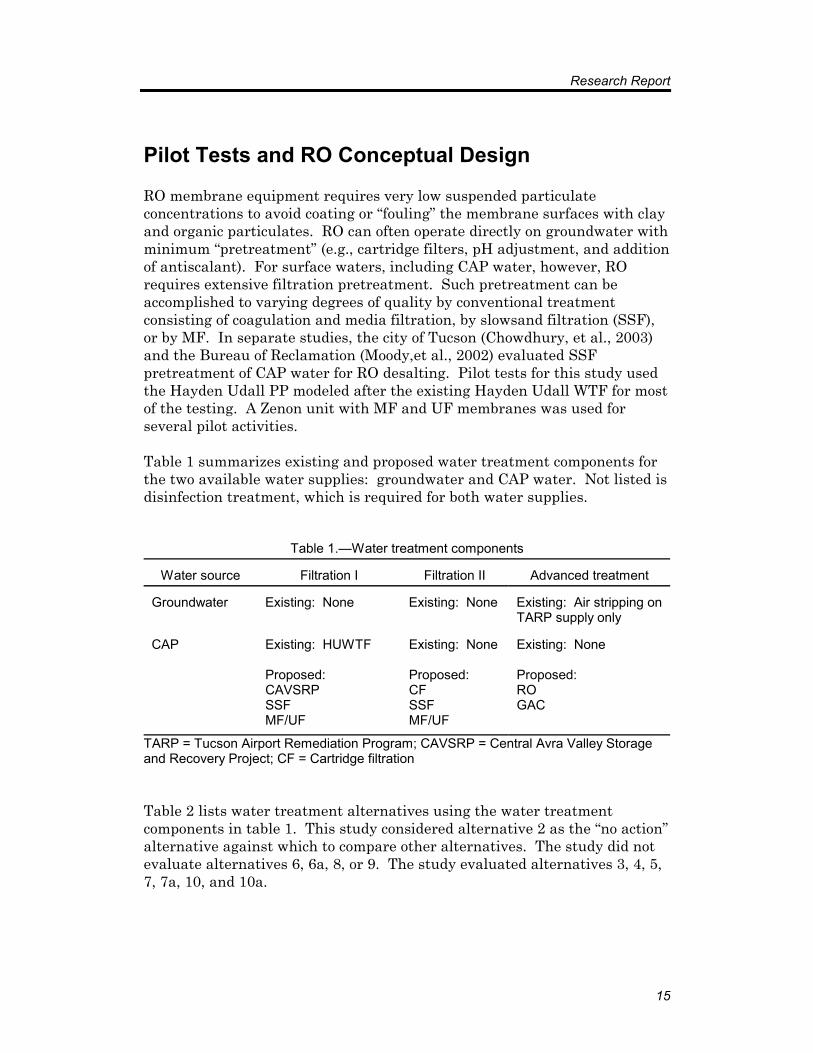
Pilot Tests and RO Conceptual Design
RO membrane equipment requires very low suspended particulateconcentrations to avoid coating or “fouling” the membrane surfaces with clayand organic particulates. RO can often operate directly on groundwater withminimum “pretreatment” (e.g., cartridge filters, pH adjustment, and additionof antiscalant). For surface waters, including CAP water, however, ROrequires extensive filtration pretreatment. Such pretreatment can beaccomplished to varying degrees of quality by conventional treatmentconsisting of coagulation and media filtration, by slowsand filtration (SSF),or by MF. In separate studies, the city of Tucson (Chowdhury, et al., 2003)and the Bureau of Reclamation (Moody,et al., 2002) evaluated SSFpretreatment of CAP water for RO desalting. Pilot tests for this study usedthe Hayden Udall PP modeled after the existing Hayden Udall WTF for mostof the testing. A Zenon unit with MF and UF membranes was used forseveral pilot activities.
Table 1 summarizes existing and proposed water treatment components forthe two available water supplies: groundwater and CAP water. Not listed isdisinfection treatment, which is required for both water supplies.
Table 1.—Water treatment components
Water source Filtration I Filtration II Advanced treatment
Groundwater Existing: None Existing: None Existing: Air stripping onTARP supply only
CAP Existing: HUWTF
Proposed: CAVSRPSSFMF/UF
Existing: None
Proposed:CFSSFMF/UF
Existing: None
Proposed:ROGAC
TARP = Tucson Airport Remediation Program; CAVSRP = Central Avra Valley Storageand Recovery Project; CF = Cartridge filtration
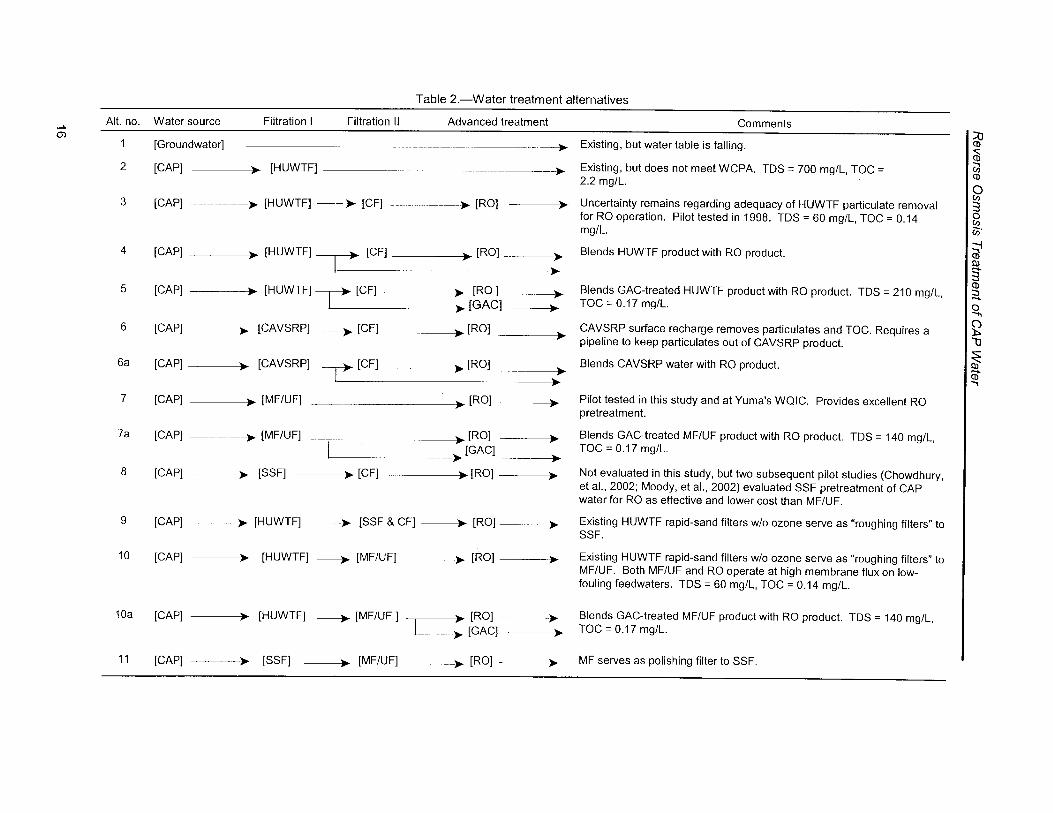
Table 2 lists water treatment alternatives using the water treatmentcomponents in table 1. This study considered alternative 2 as the “no action”alternative against which to compare other alternatives. The study did notevaluate alternatives 6, 6a, 8, or 9. The study evaluated alternatives 3, 4, 5,7, 7a, 10, and 10a.
Research Report
17
In these alternatives, the term “MF/UF” refers to either of the two similarmicrofiltration (MF) or ultrafiltration (UF) processes (refer to figure 1 for MFand UF particulate removal ranges). For brevity, the abbreviated notation uses “UF.” All selected alternatives use MF/UF pretreatment. Alternatives 10 and 10a use the existing HUWTF rapid-sand filters asroughing filters, and 7a and 10a add GAC treatment parallel to RO so that“blended” water has low TOC levels. Appendices A and C describeconceptual designs and costs of these treatment alternatives. Alternatives7a and 10a include an evaluation of cost savings with granulated activatedcarbon (GAC) filters.
Pilot tests evaluated treatment alternatives 3, 7, and 9. Seven pilot testactivities were conducted from October 1997 to September 1998 and fromFebruary 1999 to August 1999 (see appendix F).
All pilot tests utilized reverse osmosis (RO) treatment to produce desaltedwater that meets the City of Tucson’s Water Consumer Protection Act fortotal dissolved solids (TDS), hardness, and total organic carbon (TOC).
The pilot test activities evaluated the effects of the following major designcomponents: RO pretreatment (HUPP [coagulation, flocculation, and mediafiltration], MF/UF, and HUPP together with MF/UF), RO membrane type(cellulose acetate (CA) and polyamide (PA)), and water recovery (70 to 90percent). The major performance criteria were RO fouling and RO scaling.
The table below summarizes the operating conditions and performances forthese criteria as well as including a general evaluation of costs.
Pilot test summary ratings
Activityno.
Treatment alternative number andpilot process components
HUPPCoagulant
Evaluation criteria
Fouling Scaling Cost
1 3. CAP - HUWTF - CF - RO (CA) Alum good poor fair
2,3,4 3. CAP - HUWTF - CF - RO (PA) Alum poor good good
51 7. CAP - MF - CF - RO (PA) n/a good good fair
6 3. CAP - HUWTF - CF - RO (PA) Ferric chloride poor tbd good
7a1 7. CAP - UF - CF - RO (PA) n/a good good fair
7b - 7e1 10. CAP - HUPP - UF - CF - RO(PA) Ferric chloride good good fair1 Best combinations of performance and cost for full-scale desalting.Fouling—Good = Little or no RO fouling; Poor = Severe particulate fouling observed requiring highpressure to maintain RO product flowScaling—Good = No scaling observed; Poor = Significant scaling observed requiring high pressureto maintain RO product flow; Cost—Good = Uses existing water treatment facilities to supply RO feedwater; Fair = Adds MF orUF to supply RO feedwater
Reverse Osmosis Treatment of CAP Water
18
The study initially focused on the use of processes in the existing watertreatment facility in treatment alternative 3: CAP-HUWTF-CF-RO and 4: CAP-HUWTF-CF-(RO & GAC). Pilot tests produced mixed results (seeappendix F) but were generally unsuccessful in demonstrating that theexisting HUWTF processes would adequately and consistently produce waterthat would not coat and plug the fouling-sensitive polyamide RO equipmentwith particulates or scale from alum or iron coagulants.
In contrast, alternatives 7 and 10 produced water with low RO fouling ratesboth during 1999 pilot tests (refer to Appendix F) and in pilot treatment ofColorado River water at Reclamation’s Water Quality Improvement Center(WQIC) in Yuma AZ (McAleese, et al., 1999).
Based on these pilot tests, the authors recommend CAP treatment witheither of the following alternatives:
Treatment alternative 7. CAP - MF/UF - ROTreatment alternative 10. CAP - HUWTF - MF/UF - RO
In May 1999, City and Reclamation representatives selected the followingfour treatment alternatives for the purposes of preparing conceptual designsand preappraisal cost estimates.
Selected treatment alternatives
Treatmentalternative
number Symbolic process description on Table 2Abbreviated symbolic
process notation for figures
7 CAP - MF/UF - RO UF-RO
7a CAP - MF/UF - (RO & GAC) UF-RO&GAC
10 CAP - HUWTF - MF/UF - RO HU-UF-RO
10a CAP - HUWTF - MF/UF - (RO & GAC) HU-UF-RO&GAC
RO conceptual design information obtained in large part from the 1997-99pilot tests at the Hayden Udall WTF include:
1. Selecting polyamide (PA) membranes over cellulose acetate (CA)membranes to minimize adding sulfuric acid that increasessupersaturation levels of barium sulfate.
2. Selecting RO membranes instead of NF membranes becauseNF membranes (with sodium chloride rejections less than 80 percent) donot meet the target product TDS level of 210 mg/L in the summer.
Research Report
19
3. Selecting a design water recovery of 85 percent. Water recovery iscritical because a water recovery of 85 percent means that 85 percent ofthe water is converted to low-TDS product and 15 percent remains asbrackish concentrate to be disposed. The pilot unit operated successfullyat 90-percent recovery on MF pretreatment (and the absence of alum) butat a lower feedwater TDS than the CAP design. At Reclamation's WaterQuality Improvement Center in Yuma, a pilot RO unit operated with MFpretreatment on Colorado River water at 85 percent recovery for severalmonths with no evidence of scaling (McAleese, et al., 1999).
4. Selecting a conceptual design RO membrane flux of 17 gallons persquare foot per day (gfd) based on successful pilot test operation withMF/UF pretreatment. Membrane water flux is important because thenumber of RO elements and capital costs vary inversely with water flux.
5. Selecting barium sulfate crystallization as a potentially effective andeconomical process for removing supersaturated barium sulfate from thebrackish concentrate. Preliminary jar tests indicate that, by usingbarium sulfate seed crystals, a crystallizer can remove barium sulfatethat might scale pipelines or canals used for concentrate disposal. (Seeappendix D, figures 5 and 6). Although preliminary pilot test effortsfound no removal and although barium sulfate removal may not benecessary, to provide a conservative and comprehensive cost estimate,the design presented in this report includes the estimated size and costsof barium sulfate crystallizers.
6. Calibrating three manufacturers’ conceptual design projections foroperating pressures and product TDS to match pilot test results. Aftercalibration and including allowances for additional increases in operatingpressure and product TDS with age, the average of the three calibratedperformance projections form the basis for the RO conceptual design inthis study.
7. To achieve 85-percent and higher water recoveries, the RO conceptualdesign that was chosen consists of three RO equipment stages (seefigure 2). Stage 1 concentrate is stage 2 feed. Stage 2 concentrate isstage 3 feed. The RO feed pumps include both single-speed and variable-speed centrifugal pumps where the variable-speed pumps provideoperational flexibility. Interstage booster pumps maintain uniform 17-gfd water flux for each of the three stages. Energy recovery turbinesrecover energy from the pressurized stage 3 concentrate and transfer itby direct couple to feed pumps (alternatively, energy recovery couldpower the interstage pumps).
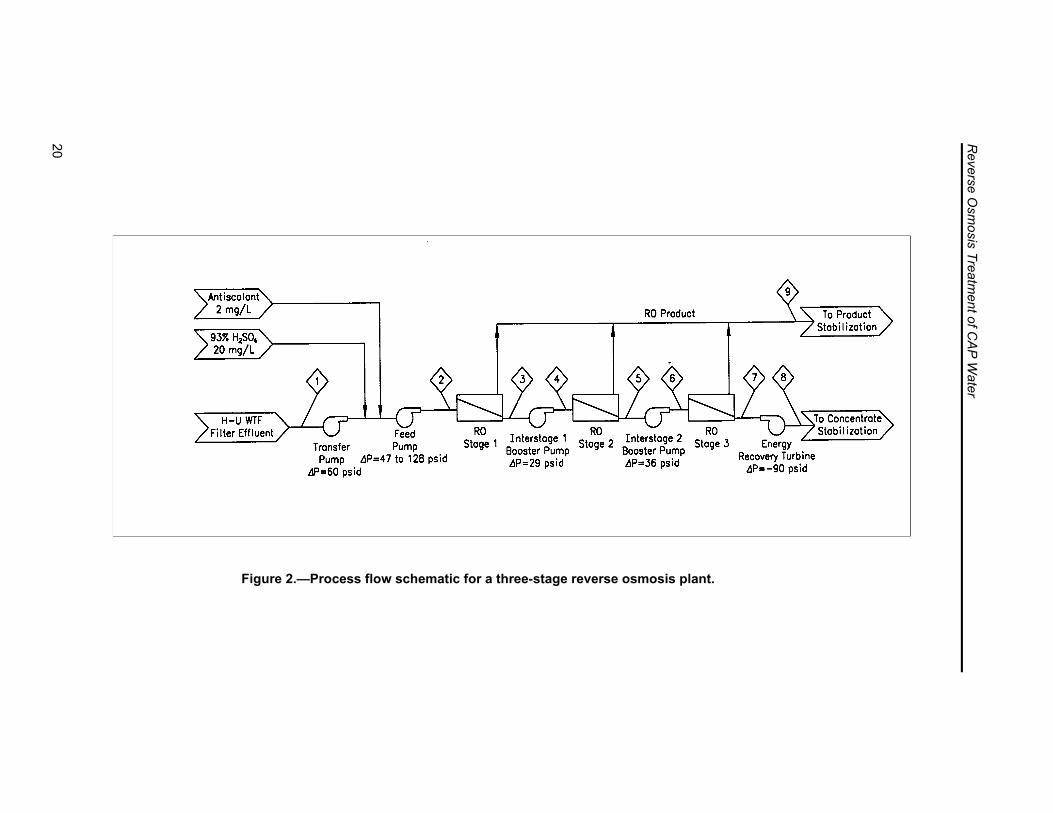
Reverse O
smosis Treatm
ent of CAP W
ater
20
Figure 2.—Process flow schematic for a three-stage reverse osmosis plant.
Research Report
21
At 17-gfd water flux and 85-percent water recovery, a two-stage designmay offer a lower-cost alternative to the selected three-stage design. Theselected three-stage design, however, offers the flexibility of operating athigher water recovery (e.g., 90 percent). The three-stage design can alsooperate at lower water flux (e.g., 10-12 gfd) if needed to reduce fouling, aswell as to obtain significant power savings with a variable-productionplant in the winter with cold water and low demand.
RO treatment of CAP water with total dissolved solids (TDS) of 700milligrams per liter (mg/L) recovers 85 percent of the water as productwith an average TDS of 56 mg/L and discharges 15 percent as brackishconcentrate waste with a TDS of 4,400 mg/L.
The average expected RO product water quality levels are 56 mg/L TDS,5.4 mg/L hardness, and 0.14 mg/L TOC. Projected post treatmentstabilization with low-turbidity lime and carbon dioxide raises theaverage TDS level to 95 to 137 mg/L and hardness concentration to 44 to86 mg/L (2.6 to 5.0 grains/gallon).
In the summer when salt rejection is lowest, the expected RO productwater quality levels are 69 mg/L TDS, 6.9 mg/L hardness, and 0.14 mg/Ltotal organic carbon (TOC). Projected post treatment stabilization withlow-turbidity lime and carbon dioxide raises the summer TDS level to 108to 166 mg/L and hardness concentration to 46 to 104 mg/L (2.7 to 6.1grains/gallon). Caustic soda can replace some of the lime to reduce theadded hardness.
These levels can meet the requirements of the City's 1995 WaterConsumer Protection Act (WCPA) criteria of 210 mg/L TDS,84 mg/L hardness, and 0.4 mg/L TOC.
With a 13-percent “blend” of GAC-treated water (refer to table 2, alternatives7a and 10a), the average annual blend water has a TDS of 140 mg/L and ahardness of 47 mg/L. The post-treated blend has an estimated TDS of 173mg/L and a hardness of 81 mg/L (see appendix A, revision 1).
Figures 3a and 3b illustrate the integration of 96.3- and 150-MGD RO plantsinto the City's water system. Listed are the available capacities from boththe RO plants and the existing well field. For year-round full capacityoperation of the 96.3-MGD RO plant, the well fields can serve for winterstorage and summer recovery of excess winter RO production.
Reverse Osmosis Treatment of CAP Water
22
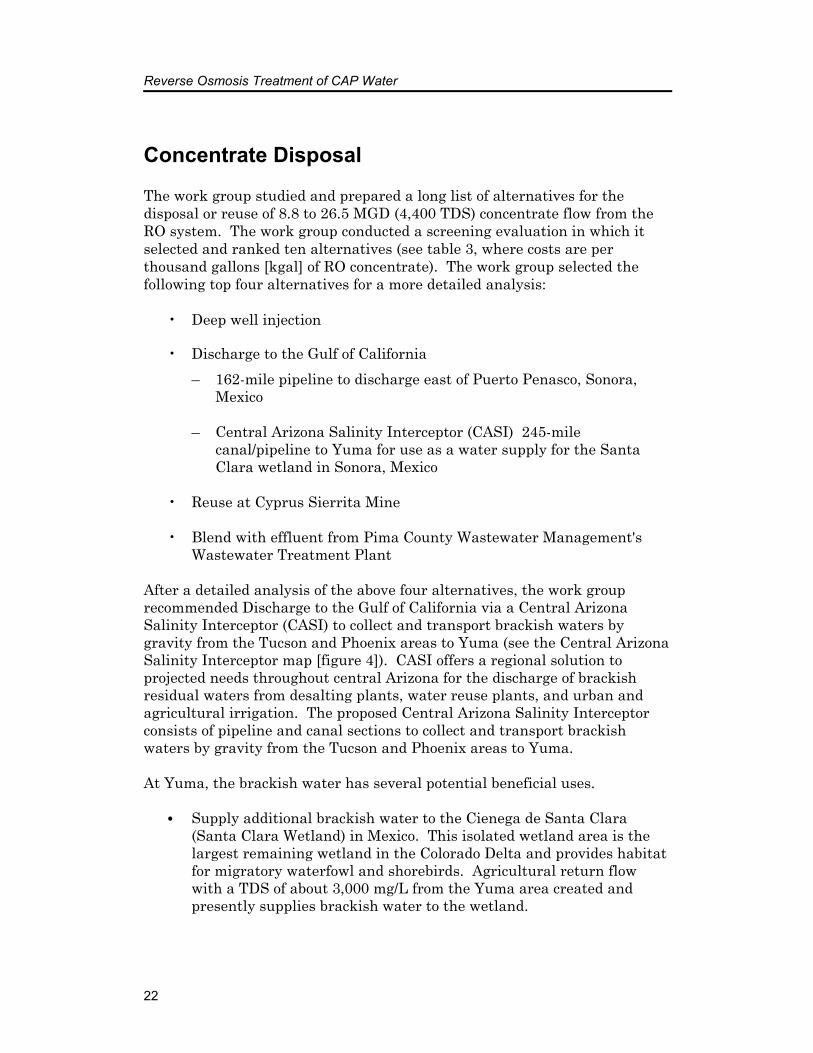
Concentrate Disposal
The work group studied and prepared a long list of alternatives for thedisposal or reuse of 8.8 to 26.5 MGD (4,400 TDS) concentrate flow from theRO system. The work group conducted a screening evaluation in which itselected and ranked ten alternatives (see table 3, where costs are perthousand gallons [kgal] of RO concentrate). The work group selected thefollowing top four alternatives for a more detailed analysis:
• Deep well injection
• Discharge to the Gulf of California– 162-mile pipeline to discharge east of Puerto Penasco, Sonora,
Mexico
– Central Arizona Salinity Interceptor (CASI) 245-milecanal/pipeline to Yuma for use as a water supply for the SantaClara wetland in Sonora, Mexico
• Reuse at Cyprus Sierrita Mine
• Blend with effluent from Pima County Wastewater Management'sWastewater Treatment Plant
After a detailed analysis of the above four alternatives, the work grouprecommended Discharge to the Gulf of California via a Central ArizonaSalinity Interceptor (CASI) to collect and transport brackish waters bygravity from the Tucson and Phoenix areas to Yuma (see the Central ArizonaSalinity Interceptor map [figure 4]). CASI offers a regional solution toprojected needs throughout central Arizona for the discharge of brackishresidual waters from desalting plants, water reuse plants, and urban andagricultural irrigation. The proposed Central Arizona Salinity Interceptorconsists of pipeline and canal sections to collect and transport brackishwaters by gravity from the Tucson and Phoenix areas to Yuma.
At Yuma, the brackish water has several potential beneficial uses.
� Supply additional brackish water to the Cienega de Santa Clara(Santa Clara Wetland) in Mexico. This isolated wetland area is thelargest remaining wetland in the Colorado Delta and provides habitatfor migratory waterfowl and shorebirds. Agricultural return flowwith a TDS of about 3,000 mg/L from the Yuma area created andpresently supplies brackish water to the wetland.
Reverse Osmosis Treatment of CAP Water
24
� Desalt the mixture of brackish waters conveyed to Yuma by CASI atthe Yuma Desalting Plant (YDP). The YDP is designed to desaltbrackish water in the anticipated CASI water salinity range.
� Supply relatively fresh water (4,400 mg/L TDS) to the Salton Sea tohelp lower its salinity from 44,000 mg/L to 40,000 mg/L or less.
� Supply brackish water to restore and maintain the river and riparianecology of frequently-dry stretches of the Colorado River and ColoradoDelta in Mexico in locations other than the Santa Clara Wetland.
Selenium levels in the concentrated Colorado River water present toxicityconcerns for the beneficial ecology restorations described above. Although noselenium toxicity has been observed to date in the Santa Clara Wetland with5 �g/L of selenium in its water supply, implementing these beneficial useswill require a thorough evaluation of selenium levels in the water supply andthe potential selenium toxicities to the receiving ecologies.
The Central Arizona Water Conservation District could operate CASI in amanner similar to the Santa Ana Watershed Protection Authority’s operationof the Santa Ana Regional Interceptor (SARI) pipeline in Orange County,California.
In the possible absence of partners to build and operate CASI, the workgroup evaluated a shorter route to transport the concentrate by pipeline tothe Gulf of California at a discharge site east of Puerto Penasco, where thebrackish water is expected to have several beneficial uses. This alternativeis less costly than the a non-partnered low-volume, CASI pipeline.
The work group, however, considers CASI to represent a regional solution tobrackish water disposal, and the November 1998 report estimated thatadditional CASI partners would decrease CASI costs to be less than for thePuerto Penasco route. Potential partners include the Arizona MunicipalWater Users Association (AMWUA) Subregional Operating Group (SROG),that anticipates construction of several advanced RO wastewatertreatment/water reuse plants in the Phoenix area during the next 20 years. In a comparison of evaporation ponds and CASI requested by AMWUASROG, Irvine (2000) estimated CASI to have lower costs for disposing 20MGD from AMWUA SROG water reuse plants.
The high-volume CASI canal (CC270) can transport the total projected needfor brackish water discharge in central Arizona of 270 MGD (300,000 acre-feet per year). This is the estimated flow to achieve salt balance for centralArizona from agricultural, municipal, and industrial uses. It is based onColorado River inflows of 1.5 million acre-feet/yr with 700 mg/L TDS, Salt
Research Report
25
River inflows of 0.8 million acre-feet/yr with 400 mg/L TDS, and an assumedCASI TDS of 4,500 mg/L.
In May 1999, City and Reclamation representatives selected six variations ofthe “Discharge to the Gulf of California” alternative for cost estimating inconjunction with the two plant capacities (see table 4).
Table 4. --Six alternatives for concentrate disposal by discharge to the Gulf of California.
DescriptionAverage flow
(MGD) Abbreviation
Pipeline to Puerto Penasco (without partners) 16 PP16
CASI pipeline to Yuma (without partners) 16 CP16
CASI canal to Yuma (without partners) 16 CC16
CASI pipeline to Yuma with 20 MGD from Phoenix-area SROG
36 CP36
CASI canal to Yuma with 20 MGD from Phoenix-areaSROG
36 CC36
CASI canal to Yuma with maximum multiple CentralArizona partners and a total flow of 270 MGD (300,000af/yr)
270 CC270
Average RO concentrate flow from Tucson is 16.1 MGD with RO alone and13 percent less, 14.0 MGD for GAC replacing RO to process 13 percent of thewater.
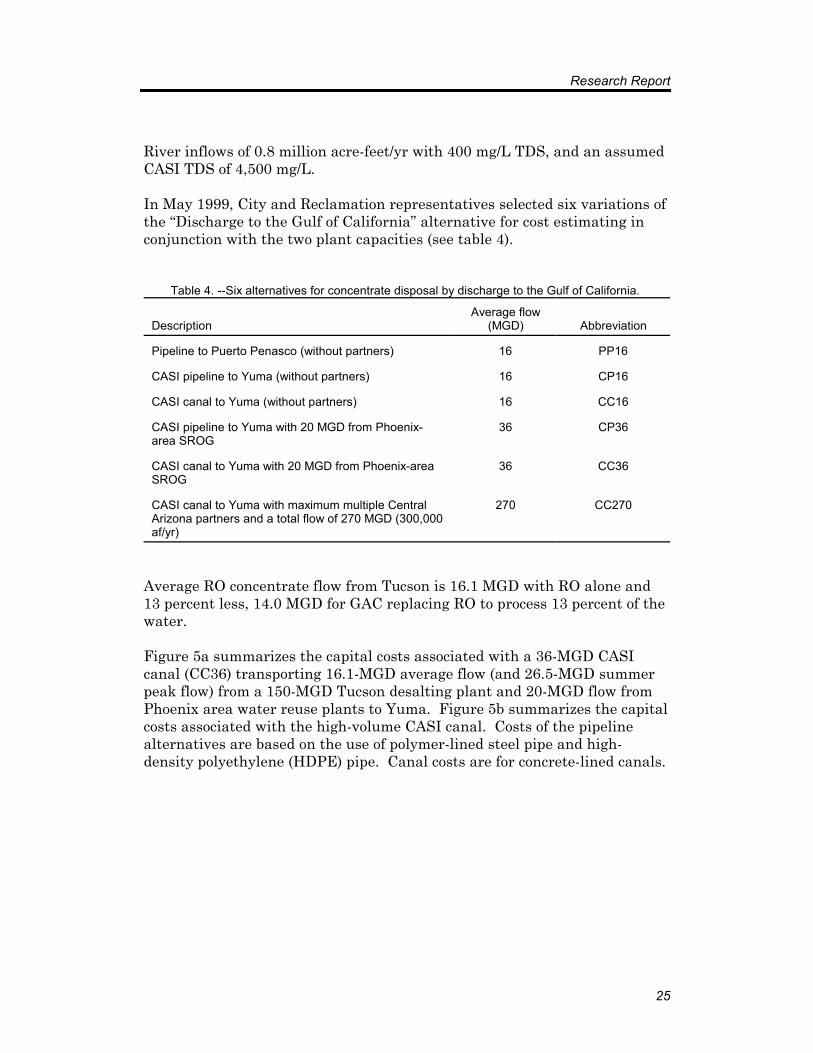
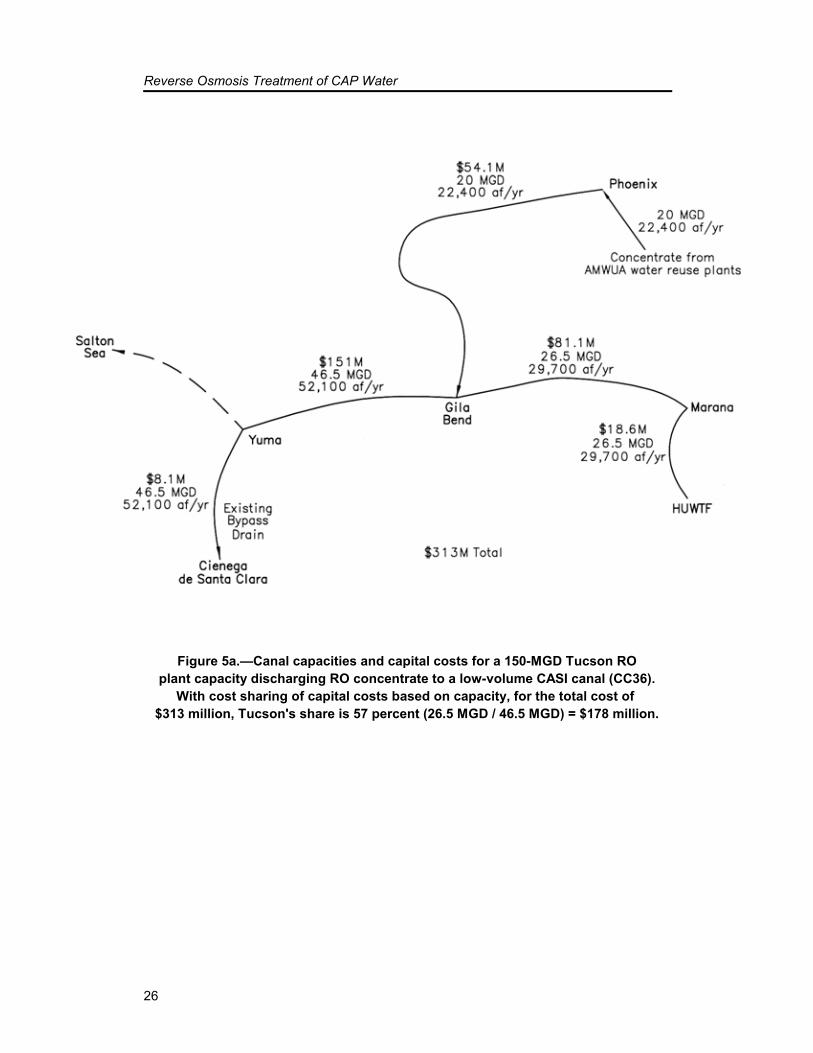
Figure 5a summarizes the capital costs associated with a 36-MGD CASIcanal (CC36) transporting 16.1-MGD average flow (and 26.5-MGD summerpeak flow) from a 150-MGD Tucson desalting plant and 20-MGD flow fromPhoenix area water reuse plants to Yuma. Figure 5b summarizes the capitalcosts associated with the high-volume CASI canal. Costs of the pipelinealternatives are based on the use of polymer-lined steel pipe and high-density polyethylene (HDPE) pipe. Canal costs are for concrete-lined canals.
Reverse Osmosis Treatment of CAP Water
26
Figure 5a.—Canal capacities and capital costs for a 150-MGD Tucson ROplant capacity discharging RO concentrate to a low-volume CASI canal (CC36).
With cost sharing of capital costs based on capacity, for the total cost of $313 million, Tucson's share is 57 percent (26.5 MGD / 46.5 MGD) = $178 million.
Research Report
27
Figure 5b.—Canal capacities and capital costs for a 150-MGD Tucson RO plant capacity discharging RO concentrate to a high-volume CASI canal (CC270).
With cost sharing of capital costs based on capacity, for the total cost of $883 million, Tucson's share is 9.7 percent (26.5 MGD / 272 MGD) = $86 million.
Costs and Selection of Recommended AlternativesCost estimates describe the costs of “advanced” treatment of CAP water andconcentrate disposal. Costs described include:
1. Costs of operating existing HUWTF processes. This represents costsof the no action alternative for comparison with costs of advancedtreatment and for use of the existing HUWTF processes in treatmentalternatives 10 and 10a (see appendix E, revision 1).
Reverse Osmosis Treatment of CAP Water
28
2. Costs of MF/UF treatment of CAP water and Hayden Udall WTF-treated CAP water (see appendix C, Revision 1, and appendix E,Revision 1).
3. Costs of RO treatment of MF/UF product water (see appendix A,appendix C, and appendix E, revision 1). RO treatment consists of athree-stage design with interstage booster pumps to operate at 17-gfdwater flux, 85-percent water recovery, energy recovery of thepressurized concentrate, pH adjustment to 7.2 with sulfuric acid,antiscalant chemical to prevent barium sulfate scaling, PA membraneelements at a cost of $400 for each 8-inch-diameter by 40-inch-longelement, a 3-year membrane replacement frequency, no disinfectionin the treatment processes, and nine RO cleanings per year.
4. Costs of granular activated carbon (GAC) treatment of MF/UFproduct and HUWTF-MF/UF product for possible blending with ROproduct water (see appendix B and appendix E, revision 1).
5. Costs for water stabilization of RO product water. The costs of post-treatment of RO product water are based on stabilization for corrosioncontrol with carbon dioxide and low-turbidity lime and disinfectionwith sodium hypchlorite. (see appendix A, revision 1, and appendix E,revision 1).
6. Costs for disposal of RO concentrate (see appendix D and appendix E,revision 1).
7. Amortization of capital costs (see appendix E, revision 1). Capitalcosts of treatment are amortized at 6.25-percent interest for 25 yearscorresponding to a capital recovery factor of 0.0801. The interest rateand repayment period are based on the City’s 1998 financial planningvalues for a municipal project. For concentrate disposal, capital costs areamortized at 7.125-percent interest for 40 years corresponding to acapital recovery factor of 0.0761. Assuming CASI construction under theexisting CAP authority, Reclamation used the CAP 40-year repaymentperiod for concentrate disposal. The actual interest rates will depend onthe rates at the time of bonding.
8. “Upgrade” costs to incorporate advanced treatment and concentratedisposal at the HUWTF. Upgrade costs are the difference betweenannual (including amortized capital) costs of the advanced treatmentsand concentrate disposal minus O&M costs of the existing HUWTF.
This study focuses on the major costs associated with advanced treatment. Therefore, it does not describe:
Research Report
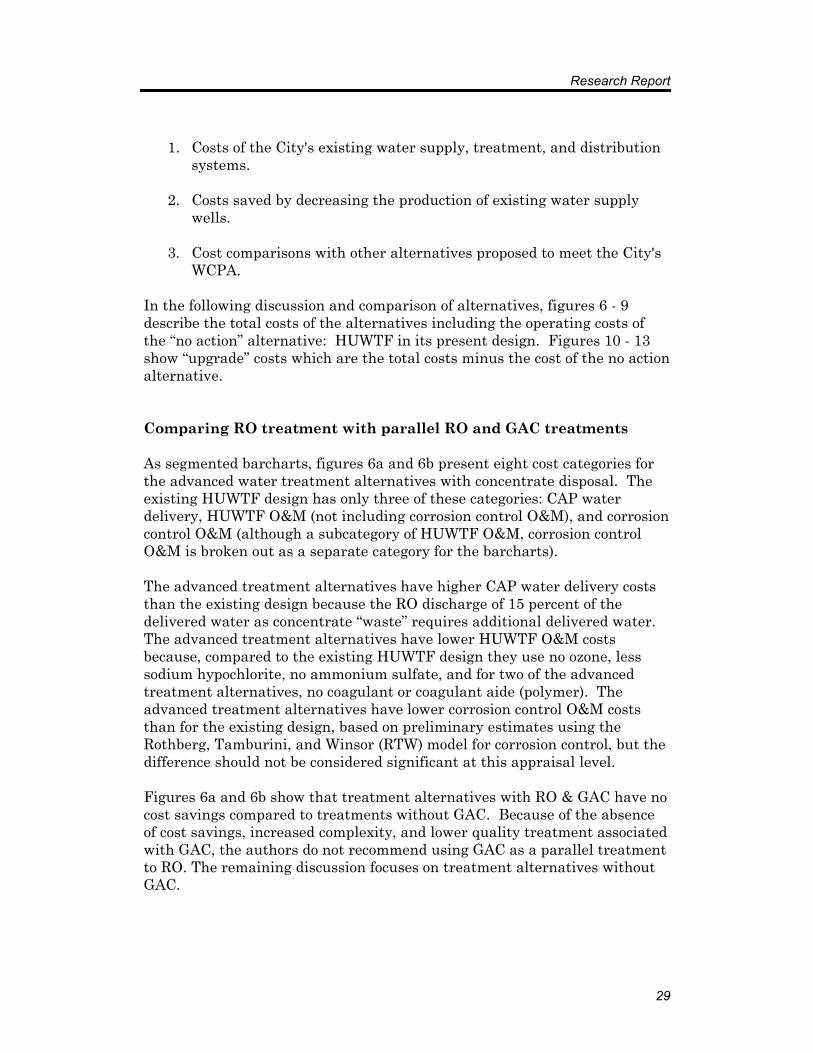
29
1. Costs of the City's existing water supply, treatment, and distributionsystems.
2. Costs saved by decreasing the production of existing water supplywells.
3. Cost comparisons with other alternatives proposed to meet the City'sWCPA.
In the following discussion and comparison of alternatives, figures 6 - 9describe the total costs of the alternatives including the operating costs ofthe “no action” alternative: HUWTF in its present design. Figures 10 - 13show “upgrade” costs which are the total costs minus the cost of the no actionalternative.
Comparing RO treatment with parallel RO and GAC treatments
As segmented barcharts, figures 6a and 6b present eight cost categories forthe advanced water treatment alternatives with concentrate disposal. Theexisting HUWTF design has only three of these categories: CAP waterdelivery, HUWTF O&M (not including corrosion control O&M), and corrosioncontrol O&M (although a subcategory of HUWTF O&M, corrosion controlO&M is broken out as a separate category for the barcharts).
The advanced treatment alternatives have higher CAP water delivery coststhan the existing design because the RO discharge of 15 percent of thedelivered water as concentrate “waste” requires additional delivered water. The advanced treatment alternatives have lower HUWTF O&M costsbecause, compared to the existing HUWTF design they use no ozone, lesssodium hypochlorite, no ammonium sulfate, and for two of the advancedtreatment alternatives, no coagulant or coagulant aide (polymer). Theadvanced treatment alternatives have lower corrosion control O&M coststhan for the existing design, based on preliminary estimates using theRothberg, Tamburini, and Winsor (RTW) model for corrosion control, but thedifference should not be considered significant at this appraisal level.
Figures 6a and 6b show that treatment alternatives with RO & GAC have nocost savings compared to treatments without GAC. Because of the absenceof cost savings, increased complexity, and lower quality treatment associatedwith GAC, the authors do not recommend using GAC as a parallel treatmentto RO. The remaining discussion focuses on treatment alternatives withoutGAC.
Reverse Osmosis Treatment of CAP Water
30
Figure 6a. --Comparison of treatment alternatives for 96-MGD desalting capacity. Concentrate disposal is by pipeline to Puerto Penasco (PP16).
0
10
20
30
40
50
60
70
HUWTF, existing 96:UF-RO-PP16 96:UF-RO&GAC-PP16 96:HU-UF-RO-PP16 96:HU-UF-RO&GAC-PP16
Tota
l Ann
ual c
osts
(mill
ion
$/yr
)
CAP water delivery cost HUWTF O&M Advanced treatment capital 1Advanced treatment O&M 1 Post treatment corrosion control O&M Post treatment corrosion control capitalConc. Disposal capital Conc. Disposal O&M
Figure 6b. --Comparison of treatment alternatives for 150-MGD desalting capacity. Concentrate disposal is by pipeline to Puerto Penasco (PP16).
0
10
20
30
40
50
60
70
HUWTF, existing 150:UF-RO-PP16 150:UF-RO&GAC-PP16 150:HU-UF-RO-PP16 150:HU-UF-RO&GAC-PP16
Tota
l Ann
ual c
osts
(mill
ion
$/yr
)
CAP water delivery cost HUWTF O&M Advanced treatment capital 1Advanced treatment O&M 1 Post treatment corrosion control capital Post treatment corrosion control O&MConc. Disposal capital Conc. Disposal O&M
Research Report
31
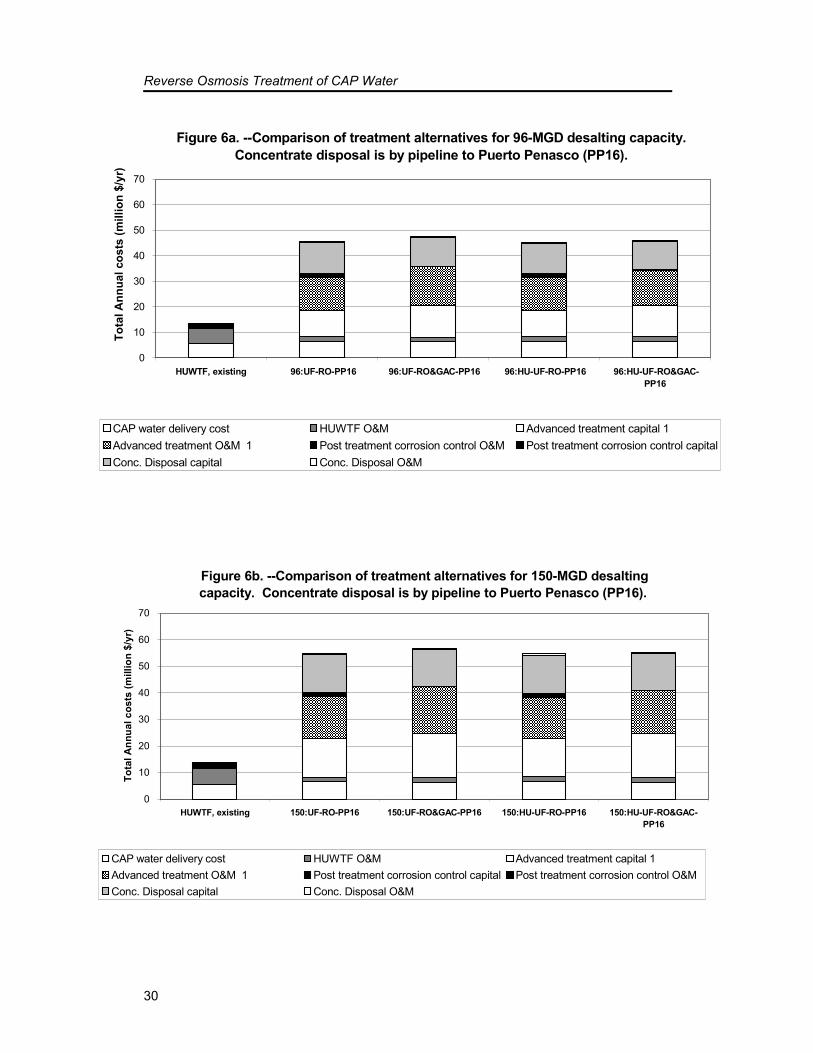
Comparing treatment alternatives with and without existingtreatment processes at the HUWTF
The difference in estimated costs of the remaining two treatmentalternatives—MF/UF-RO and HU-MF/UF-RO—is not significant (refer tofigure 6).
The HU-MF/UF-RO treatment alternative increases MF/UF operationalreliability by employing the existing HUWTF rapid-sand gravity filters asroughing filters. This increased reliability comes at the expense of slightlygreater complexity, because it requires operating and periodicallybackwashing the HUWTF rapid-sand filters. Although costs for theHU-MF/UF-RO alternative include the possible use of coagulant (e.g., ferricchloride) and coagulant aide, these are not expected to be needed. Thealternative does not include the use of ozone.
Both treatment alternatives operate with PA membrane elements with anestimated replacement frequency of 3 years in the RO equipment, nodisinfection in the HUWTF, MF/UF, or RO equipment, and nine ROcleanings per year1. A downside to using PA membranes compared to CAmembranes is that free chlorine disinfection cannot be used, because PAmembranes can suffer significant losses in salt rejection in the presence offree chlorine. Although PA membranes operated successfully withoutdegradation in short-term pilot tests in this study, in short-term pilot testsat Reclamation’s WQIC, and for several years with chloramine disinfection atwastewater reuse plants, generally PA membranes operate with nodisinfectant and rely on periodic cleanings to control biofouling.
The authors consider both treatment alternatives to have similareffectiveness. Because of their similar costs, the authors recommend bothtreatment alternatives.
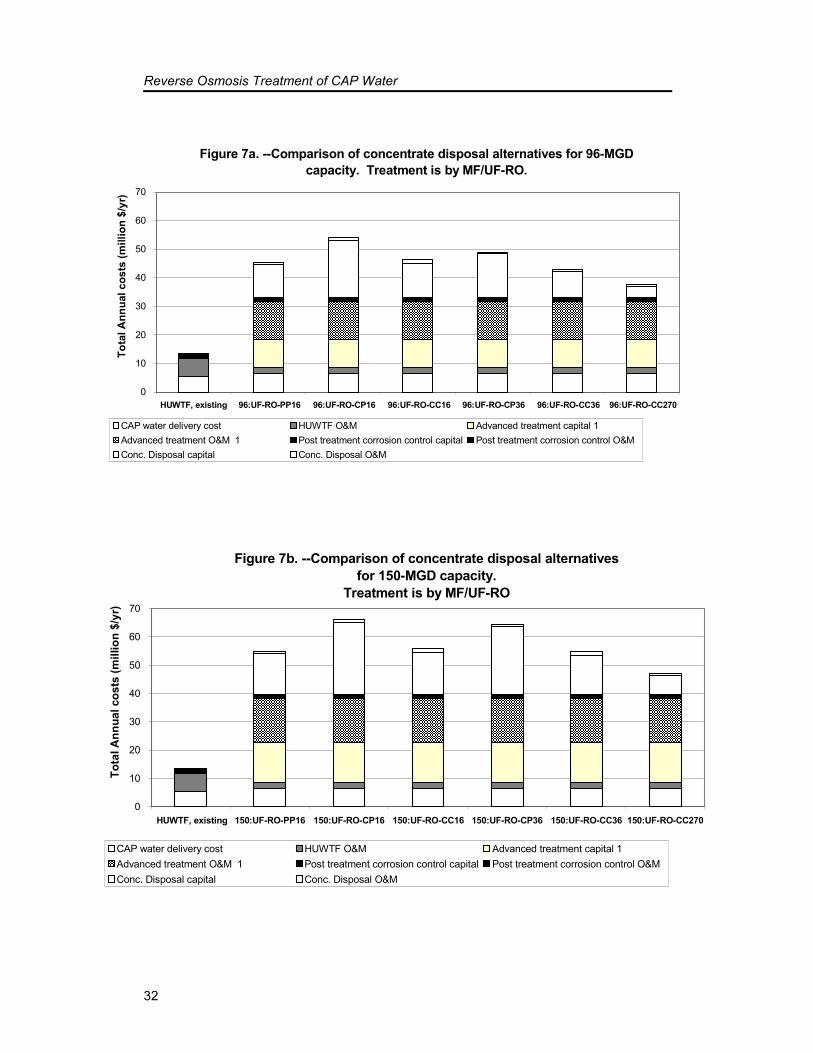
Comparing concentrate disposal alternatives
Figures 7a and 7b show that from lowest to highest cost, the concentratedisposal alternatives cost order is:_________________________
1 Two major causes of loss in RO production and/or increase in required RO feed pressure areparticulate fouling and “biofouling” caused by the growth of bacteria on the membranesurfaces. This study’s RO pilot tests were conducted with chloramine disinfection to measure(in the absence of biofouling) particulate fouling and the effectiveness of differentpretreatment tecnologies in preventing particulate fouling. Although the pilot tests wereconducted with chloramine disinfection to evaluate RO pretreatment technologies, both theMF/UF-RO and HU-MF/UF-RO treatment alternatives incorporate PA membranes, nodisinfection, and nine RO cleanings per year.
Reverse Osmosis Treatment of CAP Water
32
Figure 7a. --Comparison of concentrate disposal alternatives for 96-MGD capacity. Treatment is by MF/UF-RO.
0
10
20
30
40
50
60
70
HUWTF, existing 96:UF-RO-PP16 96:UF-RO-CP16 96:UF-RO-CC16 96:UF-RO-CP36 96:UF-RO-CC36 96:UF-RO-CC270
Tota
l Ann
ual c
osts
(mill
ion
$/yr
)
CAP water delivery cost HUWTF O&M Advanced treatment capital 1Advanced treatment O&M 1 Post treatment corrosion control capital Post treatment corrosion control O&MConc. Disposal capital Conc. Disposal O&M
Figure 7b. --Comparison of concentrate disposal alternatives for 150-MGD capacity.
Treatment is by MF/UF-RO
0
10
20
30
40
50
60
70
HUWTF, existing 150:UF-RO-PP16 150:UF-RO-CP16 150:UF-RO-CC16 150:UF-RO-CP36 150:UF-RO-CC36 150:UF-RO-CC270
Tota
l Ann
ual c
osts
(mill
ion
$/yr
)
CAP water delivery cost HUWTF O&M Advanced treatment capital 1Advanced treatment O&M 1 Post treatment corrosion control capital Post treatment corrosion control O&MConc. Disposal capital Conc. Disposal O&M
Research Report
33
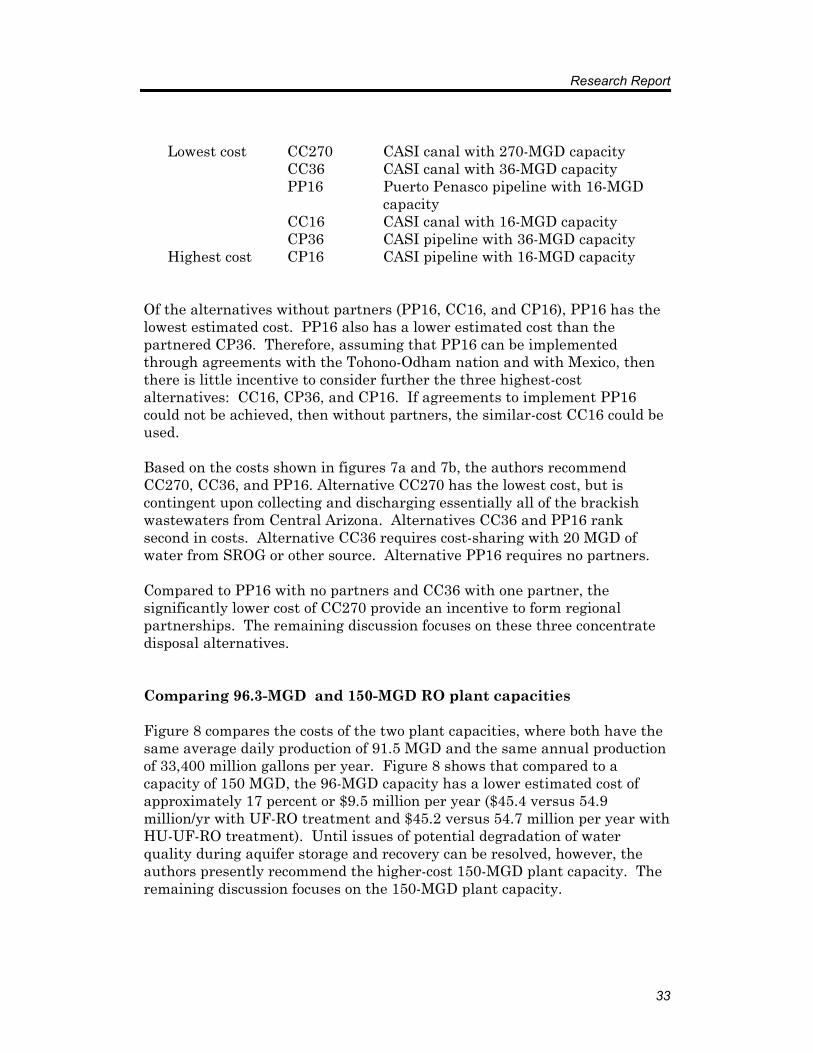
Lowest cost CC270 CASI canal with 270-MGD capacityCC36 CASI canal with 36-MGD capacityPP16 Puerto Penasco pipeline with 16-MGD
capacityCC16 CASI canal with 16-MGD capacityCP36 CASI pipeline with 36-MGD capacity
Highest cost CP16 CASI pipeline with 16-MGD capacity
Of the alternatives without partners (PP16, CC16, and CP16), PP16 has thelowest estimated cost. PP16 also has a lower estimated cost than thepartnered CP36. Therefore, assuming that PP16 can be implementedthrough agreements with the Tohono-Odham nation and with Mexico, thenthere is little incentive to consider further the three highest-costalternatives: CC16, CP36, and CP16. If agreements to implement PP16could not be achieved, then without partners, the similar-cost CC16 could beused.
Based on the costs shown in figures 7a and 7b, the authors recommendCC270, CC36, and PP16. Alternative CC270 has the lowest cost, but iscontingent upon collecting and discharging essentially all of the brackishwastewaters from Central Arizona. Alternatives CC36 and PP16 ranksecond in costs. Alternative CC36 requires cost-sharing with 20 MGD ofwater from SROG or other source. Alternative PP16 requires no partners.
Compared to PP16 with no partners and CC36 with one partner, thesignificantly lower cost of CC270 provide an incentive to form regionalpartnerships. The remaining discussion focuses on these three concentratedisposal alternatives.
Comparing 96.3-MGD and 150-MGD RO plant capacities
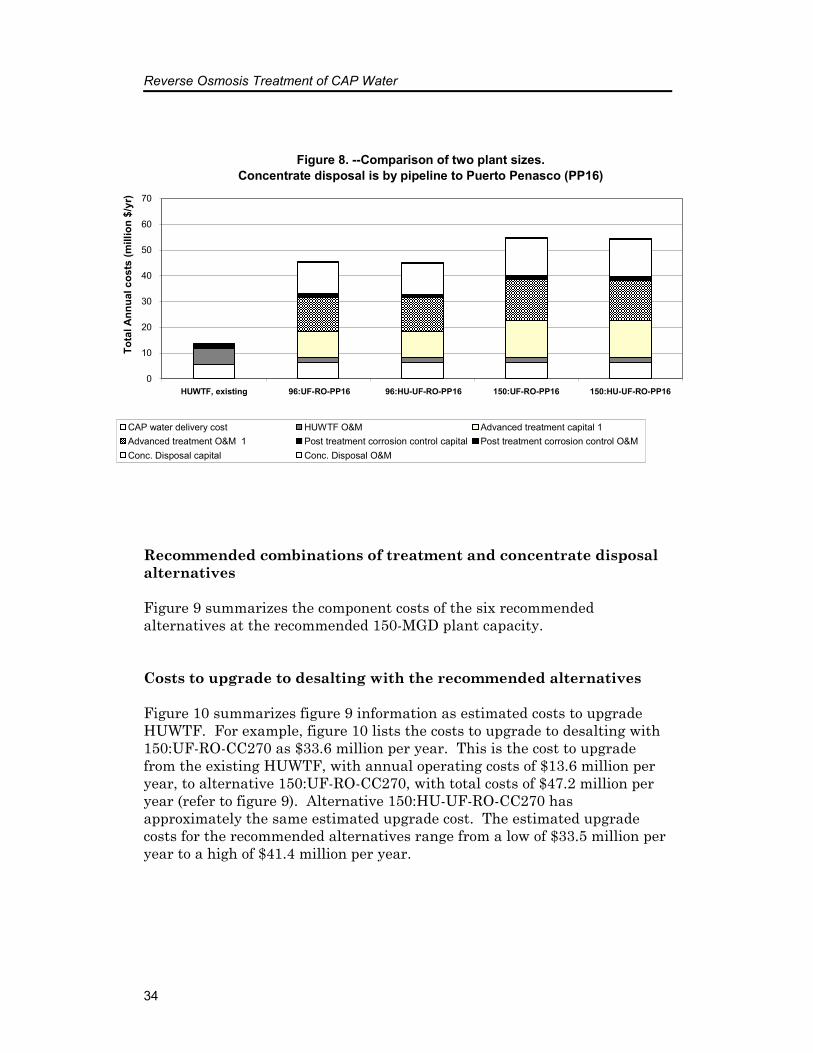
Figure 8 compares the costs of the two plant capacities, where both have thesame average daily production of 91.5 MGD and the same annual productionof 33,400 million gallons per year. Figure 8 shows that compared to acapacity of 150 MGD, the 96-MGD capacity has a lower estimated cost ofapproximately 17 percent or $9.5 million per year ($45.4 versus 54.9million/yr with UF-RO treatment and $45.2 versus 54.7 million per year withHU-UF-RO treatment). Until issues of potential degradation of waterquality during aquifer storage and recovery can be resolved, however, theauthors presently recommend the higher-cost 150-MGD plant capacity. Theremaining discussion focuses on the 150-MGD plant capacity.
Reverse Osmosis Treatment of CAP Water
34
Figure 8. --Comparison of two plant sizes.Concentrate disposal is by pipeline to Puerto Penasco (PP16)
0
10
20
30
40
50
60
70
HUWTF, existing 96:UF-RO-PP16 96:HU-UF-RO-PP16 150:UF-RO-PP16 150:HU-UF-RO-PP16
Tota
l Ann
ual c
osts
(mill
ion
$/yr
)
CAP water delivery cost HUWTF O&M Advanced treatment capital 1Advanced treatment O&M 1 Post treatment corrosion control capital Post treatment corrosion control O&MConc. Disposal capital Conc. Disposal O&M
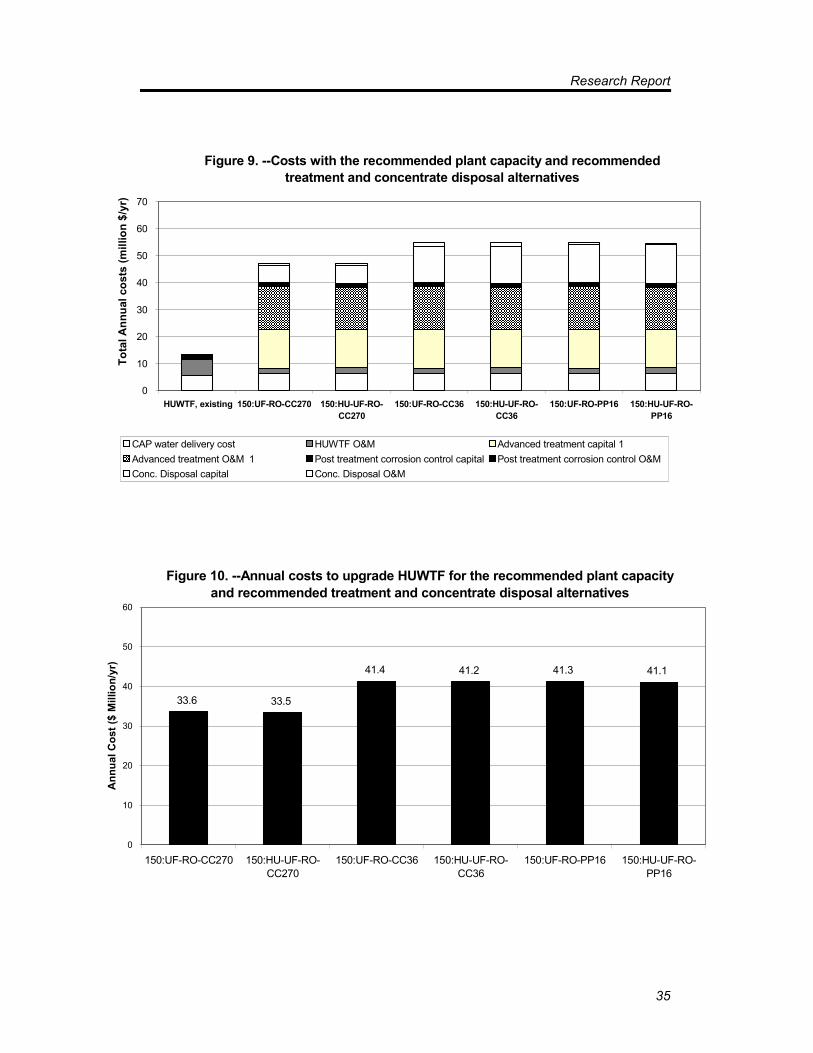
Recommended combinations of treatment and concentrate disposalalternatives
Figure 9 summarizes the component costs of the six recommendedalternatives at the recommended 150-MGD plant capacity.
Costs to upgrade to desalting with the recommended alternatives
Figure 10 summarizes figure 9 information as estimated costs to upgradeHUWTF. For example, figure 10 lists the costs to upgrade to desalting with150:UF-RO-CC270 as $33.6 million per year. This is the cost to upgradefrom the existing HUWTF, with annual operating costs of $13.6 million peryear, to alternative 150:UF-RO-CC270, with total costs of $47.2 million peryear (refer to figure 9). Alternative 150:HU-UF-RO-CC270 hasapproximately the same estimated upgrade cost. The estimated upgradecosts for the recommended alternatives range from a low of $33.5 million peryear to a high of $41.4 million per year.
Research Report
35
Figure 10. --Annual costs to upgrade HUWTF for the recommended plant capacity and recommended treatment and concentrate disposal alternatives
33.6 33.5
41.4 41.2 41.3 41.1
0
10
20
30
40
50
60
150:UF-RO-CC270 150:HU-UF-RO-CC270
150:UF-RO-CC36 150:HU-UF-RO-CC36
150:UF-RO-PP16 150:HU-UF-RO-PP16
Ann
ual C
ost (
$ M
illio
n/yr
)
Figure 9. --Costs with the recommended plant capacity and recommended treatment and concentrate disposal alternatives
0
10
20
30
40
50
60
70
HUWTF, existing 150:UF-RO-CC270 150:HU-UF-RO-CC270
150:UF-RO-CC36 150:HU-UF-RO-CC36
150:UF-RO-PP16 150:HU-UF-RO-PP16
Tota
l Ann
ual c
osts
(mill
ion
$/yr
)
CAP water delivery cost HUWTF O&M Advanced treatment capital 1Advanced treatment O&M 1 Post treatment corrosion control capital Post treatment corrosion control O&MConc. Disposal capital Conc. Disposal O&M
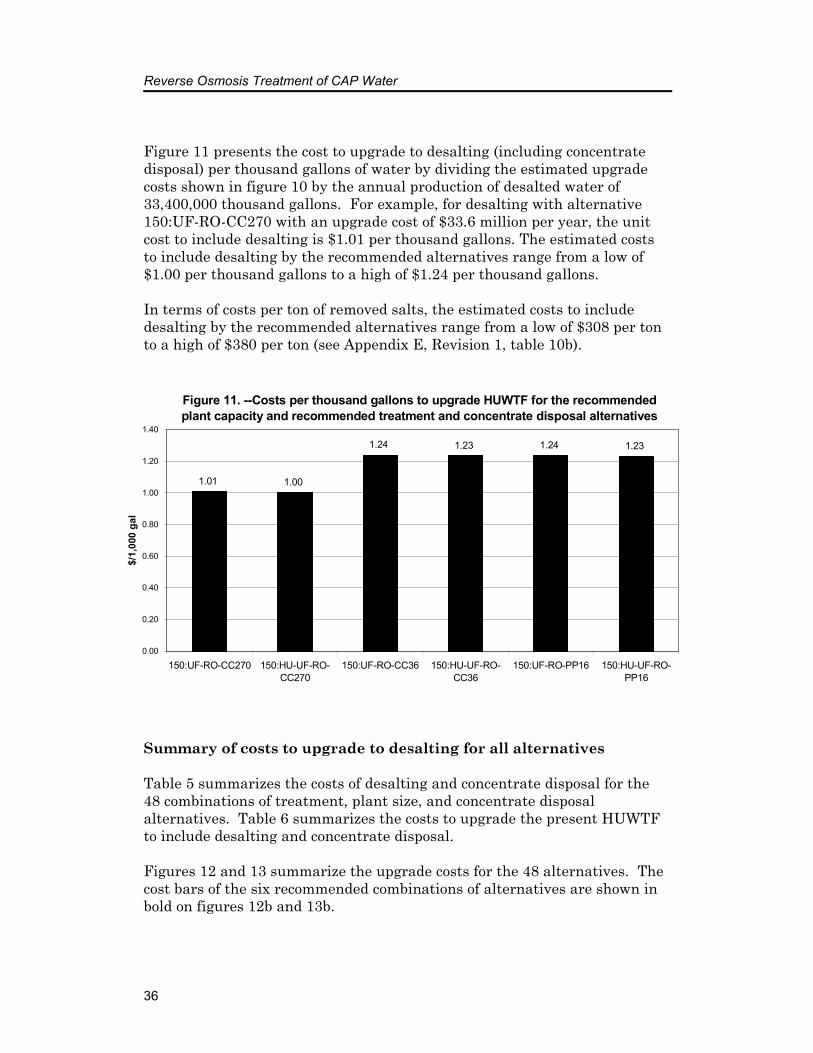
Reverse Osmosis Treatment of CAP Water
36
Figure 11. --Costs per thousand gallons to upgrade HUWTF for the recommended plant capacity and recommended treatment and concentrate disposal alternatives
1.01 1.00
1.23 1.24 1.231.24
0.00
0.20
0.40
0.60
0.80
1.00
1.20
1.40
150:UF-RO-CC270 150:HU-UF-RO-CC270
150:UF-RO-CC36 150:HU-UF-RO-CC36
150:UF-RO-PP16 150:HU-UF-RO-PP16
$/1,
000
gal
Figure 11 presents the cost to upgrade to desalting (including concentratedisposal) per thousand gallons of water by dividing the estimated upgradecosts shown in figure 10 by the annual production of desalted water of33,400,000 thousand gallons. For example, for desalting with alternative150:UF-RO-CC270 with an upgrade cost of $33.6 million per year, the unitcost to include desalting is $1.01 per thousand gallons. The estimated coststo include desalting by the recommended alternatives range from a low of$1.00 per thousand gallons to a high of $1.24 per thousand gallons.
In terms of costs per ton of removed salts, the estimated costs to includedesalting by the recommended alternatives range from a low of $308 per tonto a high of $380 per ton (see Appendix E, Revision 1, table 10b).
Summary of costs to upgrade to desalting for all alternatives
Table 5 summarizes the costs of desalting and concentrate disposal for the 48 combinations of treatment, plant size, and concentrate disposalalternatives. Table 6 summarizes the costs to upgrade the present HUWTFto include desalting and concentrate disposal.
Figures 12 and 13 summarize the upgrade costs for the 48 alternatives. Thecost bars of the six recommended combinations of alternatives are shown inbold on figures 12b and 13b.
Research Report
37
Constant-production plant with aquifer storage and recovery (ASR) for 91.5 MGD average, 96.3 MGD peak capacity, and 95% plant factor
TotalCosts Costs Costs Capital/O&M Total
Capital costs million $ MF/UF - RO 129.71 Pipeline to Puerto Penasco 156.21 285.92 22.28 37.24O&M costs milliion $/yr Figure 1a 14.55 PP16 0.41 14.97 14.97Capital costs million $ MF/UF - RO 129.71 CASI pipeline to Yuma 266.57 396.28 30.68 45.92O&M costs milliion $/yr Figure 1a 14.55 CP16 0.69 15.24 15.24Capital costs million $ MF/UF - RO 129.71 CASI canal to Yuma 160.51 290.22 22.60 38.43O&M costs milliion $/yr Figure 1a 14.55 CC16 1.27 15.82 15.82Capital costs million $ MF/UF - RO 129.71 CASI pipeline to Yuma 203.96 333.67 25.91 40.99O&M costs milliion $/yr Figure 1a 14.55 CP36 0.52 15.08 15.08
Capital costs million $ MF/UF - RO 129.71 CASI canal to Yuma 119.56 249.27 19.49 34.99O&M costs milliion $/yr Figure 1a 14.55 CC36 0.95 15.51 15.51Capital costs million $ MF/UF - RO 129.71 CASI canal to Yuma 55.03 184.74 14.58 29.58O&M costs milliion $/yr Figure 1a 14.55 CC270 0.44 15.00 15.00Capital costs million $ MF/UF - (RO & GAC) 155.56 Pipeline to Puerto Penasco 145.21 300.77 23.51 39.38O&M costs milliion $/yr Figure 2a (13% Blending) 15.49 PP16 0.38 15.87 15.87Capital costs million $ MF/UF - (RO & GAC) 155.56 CASI pipeline to Yuma 245.29 400.85 31.13 47.26O&M costs milliion $/yr Figure 2a (13% Blending) 15.49 CP16 0.65 16.14 16.14Capital costs million $ MF/UF - (RO & GAC) 155.56 CASI canal to Yuma 153.02 308.57 24.10 40.79O&M costs milliion $/yr Figure 2a (13% Blending) 15.49 CC16 1.20 16.69 16.69Capital costs million $ MF/UF - (RO & GAC) 155.56 CASI pipeline to Yuma 178.37 333.93 26.03 41.98O&M costs milliion $/yr Figure 2a (13% Blending) 15.49 CP36 0.46 15.94 15.94Capital costs million $ MF/UF - (RO & GAC) 155.56 CASI canal to Yuma 105.89 261.45 20.52 36.84O&M costs milliion $/yr Figure 2a (13% Blending) 15.49 CC36 0.84 16.33 16.33Capital costs million $ MF/UF - (RO & GAC) 155.56 CASI canal to Yuma 47.83 203.39 16.10 31.97O&M costs milliion $/yr Figure 2a (13% Blending) 15.49 CC270 0.39 15.87 15.87Capital costs million $ HUWTF - MF/UF - RO 125.97 Pipeline to Puerto Penasco 156.21 282.18 21.98 36.75O&M costs milliion $/yr Figure 3a 14.36 PP16 0.41 14.77 14.77Capital costs million $ HUWTF - MF/UF - RO 125.97 CASI pipeline to Yuma 266.57 392.54 30.38 45.42O&M costs milliion $/yr Figure 3a 14.36 CP16 0.69 15.05 15.05Capital costs million $ HUWTF - MF/UF - RO 125.97 CASI canal to Yuma 160.51 286.48 22.30 37.93O&M costs milliion $/yr Figure 3a 14.36 CC16 1.27 15.62 15.62Capital costs million $ HUWTF - MF/UF - RO 125.97 CASI pipeline to Yuma 203.96 329.93 25.61 40.49O&M costs milliion $/yr Figure 3a 14.36 CP36 0.52 14.88 14.88Capital costs million $ HUWTF - MF/UF - RO 125.97 CASI canal to Yuma 119.56 245.53 19.19 34.50O&M costs milliion $/yr Figure 3a 14.36 CC36 0.95 15.31 15.31Capital costs million $ HUWTF - MF/UF - RO 125.97 CASI canal to Yuma 55.03 181.00 14.28 29.08O&M costs milliion $/yr Figure 3a 14.36 CC270 0.44 14.80 14.80Capital costs million $ HUWTF - ([MF/UF-RO] & GAC) 151.86 Pipeline to Puerto Penasco 145.21 297.07 23.21 37.55O&M costs milliion $/yr Figure 4a (13% Blending) 13.95 PP16 0.38 14.34 14.34Capital costs million $ HUWTF - ([MF/UF-RO] & GAC) 151.86 CASI pipeline to Yuma 245.29 397.15 30.83 45.43O&M costs milliion $/yr Figure 4a (13% Blending) 13.95 CP16 0.65 14.60 14.60Capital costs million $ HUWTF - ([MF/UF-RO] & GAC) 151.86 CASI canal to Yuma 153.02 304.88 23.81 38.97O&M costs milliion $/yr Figure 4a (13% Blending) 13.95 CC16 1.20 15.16 15.16Capital costs million $ HUWTF - ([MF/UF-RO] & GAC) 151.86 CASI pipeline to Yuma 178.37 330.24 25.74 40.15O&M costs milliion $/yr Figure 4a (13% Blending) 13.95 CP36 0.46 14.41 14.41Capital costs million $ HUWTF - ([MF/UF-RO] & GAC) 151.86 CASI canal to Yuma 105.89 257.76 20.22 35.02O&M costs milliion $/yr Figure 4a (13% Blending) 13.95 CC36 0.84 14.79 14.79Capital costs million $ HUWTF - ([MF/UF-RO] & GAC) 151.86 CASI canal to Yuma 47.83 199.70 15.80 30.14O&M costs milliion $/yr Figure 4a (13% Blending) 13.95 CC270 0.39 14.34 14.34
Table 5.- Cost summary of treatment and concentrate disposal alternatives
Annual costs(million $/yr)Treatment configuration Concentrate disposal alternative
Reverse Osmosis Treatment of CAP Water
38
Variable-production plant to meet peak-day 150-MGD capacity, 91.5-MGD average, and 61% plant factor
TotalCosts Costs Costs Capital/O&M Total
Capital costs million $ MF/UF - RO 183.46 Pipeline to Puerto Penasco 188.91 372.37 29.07 46.69O&M costs milliion $/yr Figure 1b 17.12 PP16 0.50 17.62 17.62Capital costs million $ MF/UF - RO 183.46 CASI pipeline to Yuma 333.88 517.35 40.10 58.09O&M costs milliion $/yr Figure 1b 17.12 CP16 0.86 17.98 17.98Capital costs million $ MF/UF - RO 183.46 CASI canal to Yuma 192.63 376.09 29.35 48.02O&M costs milliion $/yr Figure 1b 17.12 CC16 1.54 18.66 18.66Capital costs million $ MF/UF - RO 183.46 CASI pipeline to Yuma 313.69 497.15 38.57 56.49O&M costs milliion $/yr Figure 1b 17.12 CP36 0.80 17.92 17.92Capital costs million $ MF/UF - RO 183.46 CASI canal to Yuma 178.17 361.63 28.25 46.80O&M costs milliion $/yr Figure 1b 17.12 CC36 1.43 18.55 18.55Capital costs million $ MF/UF - RO 183.46 CASI canal to Yuma 85.90 269.37 21.23 39.04O&M costs milliion $/yr Figure 1b 17.12 CC270 0.69 17.81 17.81Capital costs million $ MF/UF - (RO & GAC) 208.10 Pipeline to Puerto Penasco 179.74 387.85 30.35 48.68O&M costs milliion $/yr Figure 2b (15% Blending) 17.86 PP16 0.47 18.34 18.34Capital costs million $ MF/UF - (RO & GAC) 208.10 CASI pipeline to Yuma 313.92 522.03 40.56 59.22O&M costs milliion $/yr Figure 2b (15% Blending) 17.86 CP16 0.80 18.66 18.66Capital costs million $ MF/UF - (RO & GAC) 208.10 CASI canal to Yuma 180.96 389.06 30.44 49.74O&M costs milliion $/yr Figure 2b (15% Blending) 17.86 CC16 1.44 19.30 19.30Capital costs million $ MF/UF - (RO & GAC) 208.10 CASI pipeline to Yuma 273.83 481.93 37.51 56.07O&M costs milliion $/yr Figure 2b (15% Blending) 17.86 CP36 0.70 18.56 18.56Capital costs million $ MF/UF - (RO & GAC) 208.10 CASI canal to Yuma 156.88 364.98 28.61 47.72O&M costs milliion $/yr Figure 2b (15% Blending) 17.86 RO-CC36 1.26 19.12 19.12Capital costs million $ MF/UF - (RO & GAC) 208.10 CASI canal to Yuma 74.69 282.79 22.35 40.81O&M costs milliion $/yr Figure 2b (15% Blending) 17.86 CC270 0.60 18.46 18.46Capital costs million $ HUWTF - MF/UF - RO 178.36 Pipeline to Puerto Penasco 188.91 367.28 28.66 46.22O&M costs milliion $/yr Figure 3b 17.06 PP16 0.50 17.56 17.56Capital costs million $ HUWTF - MF/UF - RO 178.36 CASI pipeline to Yuma 333.88 512.25 39.70 57.61O&M costs milliion $/yr Figure 3b 17.06 CP16 0.86 17.92 17.92Capital costs million $ HUWTF - MF/UF - RO 178.36 CASI canal to Yuma 192.63 370.99 28.95 47.54O&M costs milliion $/yr Figure 3b 17.06 CC16 1.54 18.60 18.60Capital costs million $ HUWTF - MF/UF - RO 178.36 CASI pipeline to Yuma 313.69 492.05 38.16 56.02O&M costs milliion $/yr Figure 3b 17.06 CP36 0.80 17.86 17.86Capital costs million $ HUWTF - MF/UF - RO 178.36 CASI canal to Yuma 178.17 356.53 27.85 46.33O&M costs milliion $/yr Figure 3b 17.06 RO-CC36 1.43 18.49 18.49Capital costs million $ HUWTF - MF/UF - RO 178.36 CASI canal to Yuma 85.90 264.27 20.82 38.57O&M costs milliion $/yr Figure 3b 17.06 CC270 0.69 17.75 17.75Capital costs million $ HUWTF - ([MF/UF-RO] & GAC) 203.07 Pipeline to Puerto Penasco 179.74 382.81 29.94 46.88O&M costs milliion $/yr Figure 4b (15% Blending) 16.46 PP16 0.47 16.94 16.94Capital costs million $ HUWTF - ([MF/UF-RO] & GAC) 203.07 CASI pipeline to Yuma 313.92 516.99 40.16 57.41O&M costs milliion $/yr Figure 4b (15% Blending) 16.46 CP16 0.80 17.26 17.26Capital costs million $ HUWTF - ([MF/UF-RO] & GAC) 203.07 CASI canal to Yuma 180.96 384.03 30.04 47.94O&M costs milliion $/yr Figure 4b (15% Blending) 16.46 CC16 1.44 17.90 17.90Capital costs million $ HUWTF - ([MF/UF-RO] & GAC) 203.07 CASI pipeline to Yuma 273.83 476.90 37.10 54.26O&M costs milliion $/yr Figure 4b (15% Blending) 16.46 CP36 0.70 17.16 17.16Capital costs million $ HUWTF - ([MF/UF-RO] & GAC) 203.07 CASI canal to Yuma 156.88 359.95 28.20 45.92O&M costs milliion $/yr Figure 4b (15% Blending) 16.46 RO-CC36 1.26 17.72 17.72Capital costs million $ HUWTF - ([MF/UF-RO] & GAC) 203.07 CASI canal to Yuma 74.69 277.76 21.95 39.01O&M costs milliion $/yr Figure 4b (15% Blending) 16.46 CC270 0.60 17.06 17.06
Table 5.- Cost summary of treatment and concentrate disposal alternatives, continued
(million $/yr)Treatment configuration Concentrate disposal alternativeAnnual costs
Research Report
39
Table 6.- Annual cost to upgrade HUWTF to include desalting and concentrate disposal Constant-production plant with aquifer storage and recovery (ASR) for 91.5 MGD average, 96.3 MGD peak capacity, and 95% plant factor
Annual costs
Capital costs of
desalting & concentrate
disposal
Amortized Capital
Costs of desalting & concentrate
disposalCAP water
deliveryHUWTF
O&M
Sum of CAP water
delivery & HUWTF
O&M
Desalting, & concentrate
disposal
CAP water delivery, partial
HUWTF, desalting, & concentrate
disposal
Amortized capital &
O&M
Additional O&M costs to upgrade
to desalting
Amortized capital & additional
O&M
million $/yr million $/yr million $/yr million $/yr million $/yr million $/yr million $/yr million $/yr million $/yr million $/yr
HUWTF, existing 0 0 5.54 8.05 13.59 0 13.59 13.59 0.00 0
96:UF-RO-PP16 285.92 22.28 6.53 1.64 8.17 14.97 23.14 45.42 9.55 31.82
96:UF-RO-CP16 396.28 30.68 6.53 1.64 8.17 15.24 23.42 54.09 9.82 40.50
96:UF-RO-CC16 290.22 22.60 6.53 1.64 8.17 15.82 24.00 46.60 10.40 33.01
96:UF-RO-CP36 333.67 25.91 6.53 1.64 8.17 15.08 23.25 49.16 9.66 35.57
96:UF-RO-CC36 249.27 19.49 6.53 1.64 8.17 15.51 23.68 43.17 10.09 29.57
96:UF-RO-CC270 184.74 14.58 6.53 1.64 8.17 15.00 23.17 37.75 9.58 24.16
96:UF-RO&GAC-PP16 300.77 23.51 6.40 1.62 8.02 15.87 23.89 47.40 10.30 33.81
96:UF-RO&GAC-CP16 400.85 31.13 6.40 1.62 8.02 16.14 24.16 55.28 10.56 41.69
96:UF-RO&GAC-CC16 308.57 24.10 6.40 1.62 8.02 16.69 24.71 48.82 11.12 35.22
96:UF-RO&GAC-CP-36 333.93 26.03 6.40 1.62 8.02 15.94 23.97 50.00 10.37 36.41
96:UF-RO&GAC-CC36 261.45 20.52 6.40 1.62 8.02 16.33 24.35 44.87 10.76 31.27
96:UF-RO&GAC-CC270 203.39 16.10 6.40 1.62 8.02 15.87 23.89 39.99 10.30 26.40
96:HU-UF-RO-PP16 282.18 21.98 6.53 1.95 8.48 14.77 23.25 45.23 9.66 31.63
96:HU-UF-RO-CP16 392.54 30.38 6.53 1.95 8.48 15.05 23.53 53.90 9.93 40.31
96:HU-UF-RO-CC16 286.48 22.30 6.53 1.95 8.48 15.62 24.10 46.41 10.51 32.82
96:HU-UF-RO-CP-36 329.93 25.61 6.53 1.95 8.48 14.88 23.36 48.97 9.77 35.38
96:HU-UF-RO-CC36 245.53 19.19 6.53 1.95 8.48 15.31 23.79 42.98 10.20 29.38
96:HU-UF-RO-CC270 181.00 14.28 6.53 1.95 8.48 14.80 23.28 37.56 9.69 23.97
96:HU-UF-RO&GAC-PP16 297.07 23.21 6.40 1.92 8.32 14.34 22.66 45.87 9.07 32.28
96:HU-UF-RO&GAC-CP16 397.15 30.83 6.40 1.92 8.32 14.60 22.93 53.76 9.33 40.16
96:HU-UF-RO&GAC-CC16 304.88 23.81 6.40 1.92 8.32 15.16 23.48 47.29 9.89 33.70
96:HU-UF-RO&GAC-CP-36 330.24 25.74 6.40 1.92 8.32 14.41 22.73 48.47 9.14 34.88
96:HU-UF-RO&GAC-CC36 257.76 20.22 6.40 1.92 8.32 14.79 23.12 43.34 9.52 29.75
96:HU-UF-RO&GAC-CC270 199.70 15.80 6.40 1.92 8.32 14.34 22.66 38.47 9.07 24.87
Treatment alternatives
Capital costs O&M costs Upgrade costs
Reverse Osmosis Treatment of CAP Water
40
Table 6.- Annual cost to upgrade HUWTF to include desalting and concentrate disposal, cont. Variable-production plant to meet peak-day 150-MGD capacity, 91.5-MGD average, and 61% plant factor
Annual costs
Capital costs of
desalting & concentrate
disposal
Amortized Capital
Costs of desalting & concentrate
disposalCAP water
deliveryHUWTF
O&M
Sum of CAP water
delivery & HUWTF
O&M
Desalting, & concentrate
disposal
CAP water delivery, partial
HUWTF, desalting, & concentrate
disposal
Amortized capital &
O&M
Additional O&M costs to upgrade
to desalting
Amortized capital & additional
O&M
150:UF-RO-PP16 372.37 29.07 6.53 1.64 8.17 17.62 25.79 54.87 12.20 41.27
150:UF-RO-CP16 517.35 40.10 6.53 1.64 8.17 17.98 26.15 66.26 12.56 52.67
150:UF-RO-CC16 376.09 29.35 6.53 1.64 8.17 18.66 26.84 56.19 13.24 42.60
150:UF-RO-CP36 497.15 38.57 6.53 1.64 8.17 17.92 26.10 64.66 12.50 51.07
150:UF-RO-CC36 361.63 28.25 6.53 1.64 8.17 18.55 26.72 54.98 13.13 41.38
150:UF-RO-CC270 269.37 21.23 6.53 1.64 8.17 17.81 25.98 47.22 12.39 33.62
150:UF-RO&GAC-PP16 387.85 30.35 6.40 1.62 8.02 18.34 26.36 56.71 12.77 43.11
150:UF-RO&GAC-CP16 522.03 40.56 6.40 1.62 8.02 18.66 26.68 67.24 13.09 53.65
150:UF-RO&GAC-CC16 389.06 30.44 6.40 1.62 8.02 19.30 27.33 57.77 13.73 44.17
150:UF-RO&GAC-CP-36 481.93 37.51 6.40 1.62 8.02 18.56 26.58 64.09 12.99 50.50
150:UF-RO&GAC-CC36 364.98 28.61 6.40 1.62 8.02 19.12 27.14 55.75 13.55 42.15
150:UF-RO&GAC-CC270 282.79 22.35 6.40 1.62 8.02 18.46 26.48 48.84 12.89 35.24
150:HU-UF-RO-PP16 367.28 28.66 6.53 1.95 8.48 17.56 26.04 54.70 12.45 41.11
150:HU-UF-RO-CP16 512.25 39.70 6.53 1.95 8.48 17.92 26.40 66.09 12.81 52.50
150:HU-UF-RO-CC16 370.99 28.95 6.53 1.95 8.48 18.60 27.08 56.03 13.49 42.43
150:HU-UF-RO-CP-36 492.05 38.16 6.53 1.95 8.48 17.86 26.34 64.50 12.75 50.91
150:HU-UF-RO-CC36 356.53 27.85 6.53 1.95 8.48 18.49 26.97 54.81 13.37 41.22
150:HU-UF-RO-CC270 264.27 20.82 6.53 1.95 8.48 17.75 26.23 47.05 12.63 33.46
150:HU-UF-RO&GAC-PP16 382.81 29.94 6.40 1.92 8.32 16.94 25.26 55.20 11.67 41.61
150:HU-UF-RO&GAC-CP16 516.99 40.16 6.40 1.92 8.32 17.26 25.58 65.74 11.99 52.15
150:HU-UF-RO&GAC-CC16 384.03 30.04 6.40 1.92 8.32 17.90 26.23 56.26 12.63 42.67
150:HU-UF-RO&GAC-CP-36 476.90 37.10 6.40 1.92 8.32 17.16 25.48 62.59 11.89 49.00
150:HU-UF-RO&GAC-CC36 359.95 28.20 6.40 1.92 8.32 17.72 26.04 54.24 12.45 40.65
150:HU-UF-RO&GAC-CC270 277.76 21.95 6.40 1.92 8.32 17.06 25.38 47.33 11.79 33.74
Treatment alternatives
Capital costs O&M costs Upgrade costs
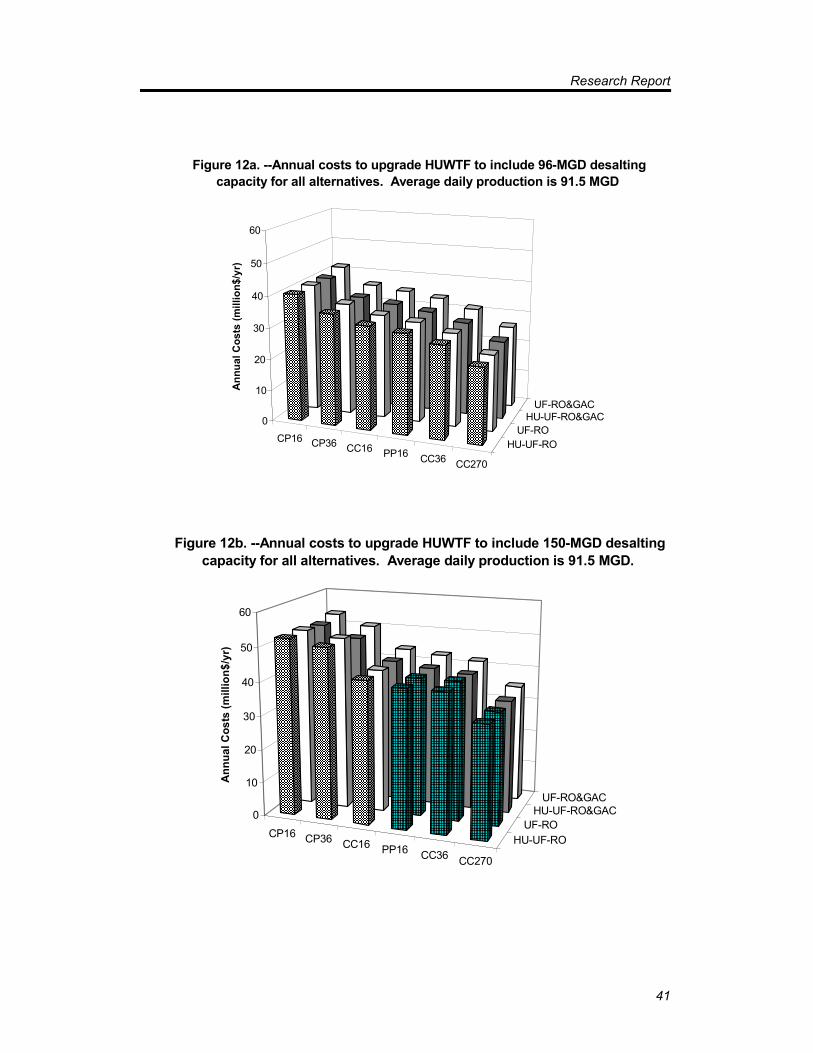
Research Report
41
CP16 CP36 CC16 PP16 CC36 CC270
HU-UF-ROUF-RO
HU-UF-RO&GACUF-RO&GAC
0
10
20
30
40
50
60
Annu
al C
osts
(mill
ion$
/yr)
Figure 12b. --Annual costs to upgrade HUWTF to include 150-MGD desalting capacity for all alternatives. Average daily production is 91.5 MGD.
CP16 CP36 CC16 PP16 CC36 CC270
HU-UF-ROUF-RO
HU-UF-RO&GACUF-RO&GAC
0
10
20
30
40
50
60An
nual
Cos
ts (m
illio
n$/y
r)
Figure 12a. --Annual costs to upgrade HUWTF to include 96-MGD desalting capacity for all alternatives. Average daily production is 91.5 MGD
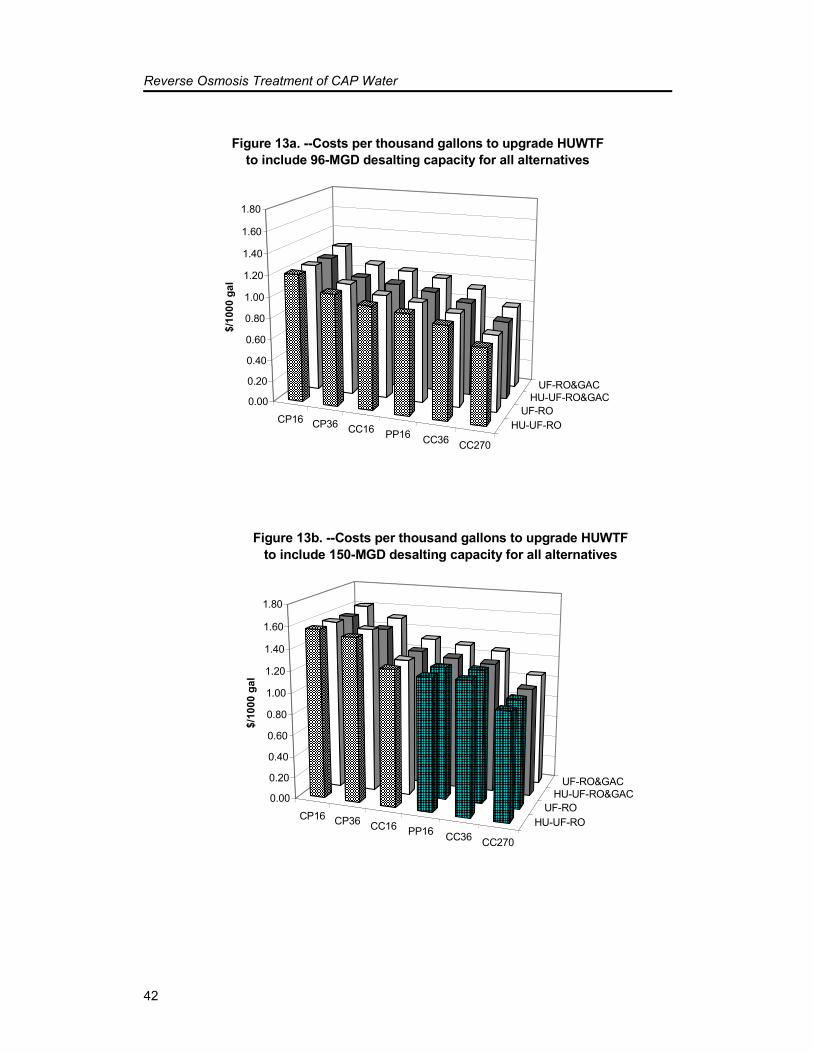
Reverse Osmosis Treatment of CAP Water
42
CP16 CP36 CC16 PP16 CC36 CC270
HU-UF-ROUF-RO
HU-UF-RO&GACUF-RO&GAC
0.00
0.20
0.40
0.60
0.80
1.00
1.20
1.40
1.60
1.80
$/10
00 g
al
Figure 13a. --Costs per thousand gallons to upgrade HUWTF to include 96-MGD desalting capacity for all alternatives
CP16 CP36 CC16 PP16 CC36 CC270
HU-UF-ROUF-RO
HU-UF-RO&GACUF-RO&GAC
0.00
0.20
0.40
0.60
0.80
1.00
1.20
1.40
1.60
1.80
$/10
00 g
al
Figure 13b. --Costs per thousand gallons to upgrade HUWTF to include 150-MGD desalting capacity for all alternatives
Research Report
43
From the 48 alternatives, the authors selected:
1. Treatment. RO without GAC because GAC in parallel to RO results inno cost savings and produces lower-quality water.
2. Treatment. Both MF/UF-RO and HU-MF/UF-RO because of MF/UFeffectiveness in maintaining low RO fouling during pilot tests and thesimilar costs of the two treatment alternatives.
3. Plant size. 150-MGD plant size because of limited information on theeffectiveness of the 96-MGD plant size ASR in maintaining the highquality of RO product water during aquifer storage.
4. Concentrate disposal.CC270 as the lowest cost alternative and one that offers a regionalsolution to the required disposal of brackish waste waters from centralArizona.
CC36 for joint discharge of 16 MGD from Tucson and 20 MGD fromSROG in Phoenix.
PP16 for direct discharge to the Gulf of California if no partners areavailable to share CASI costs to Yuma.
The six recommended combinations of alternatives are:
150:UF-RO-CC270 150:HU-UF-RO-CC270150:UF-RO-CC36 150:HU-UF-RO-CC36150:UF-RO-PP16 150:HU-UF-RO-PP16
For the recommended alternatives, installation of 150-MGD capacity MF/UFand RO treatment processes at the HUWTF has an estimated capital cost ofapproximately $178 to 183 million (refer to table 5) for an installed cost of$1.19 to 1.22 per gpd capacity. Concentrate disposal has an estimatedcapital cost of $86 to 189 million, depending on which of the threerecommended alternatives is selected. The estimated total capital costsrange from $264 to 372 million, of which concentrate disposal capital costsrepresent 32 percent with the high-volume CASI canal (CC270) and 51percent with the non-partnered pipeline to Puerto Penasco (PP16).
For the recommended alternatives, operation and maintenance of 150-MGDcapacity MF/UF and RO treatment processes has an estimated cost of $17.1million per year (refer to table 5). Operation and maintenance forconcentrate disposal has much lower estimated costs of $0.5 to 1.4 millionper year.
Reverse Osmosis Treatment of CAP Water
44
Compared to the present design of the HUWTF, water treatment operatingand maintenance costs increase by $12.2 to $13.4 million per year (refer totable 6). Compared to the present HUWTF, the combination of amortizedcapital costs and operating and maintenance costs results in additionalannual costs of $33 to $41 million per year to upgrade to desalting (refer totable 6 and figure 10).
For the annual production of 33.4 billion gallons of desalted water, the cost toupgrade to include desalting with the recommended alternatives ranges from$1.00 to $1.24 per thousand gallons (refer to figure 11). In terms of tons ofsalt removed, desalting and concentrate disposal removes 108,600 tons ofsalt per year at a cost ranging from $308 to $380 per ton (see appendix E,revision 1, table 10).
Because of the absence of cost savings, increased complexity, and lowerquality treatment associated with GAC, the authors do not recommendusing GAC as a parallel treatment to RO.
Water Quality with Recommended Treatment AlternativesFor the recommended MF/UF and RO treatment alternatives, Table 7 liststhe design values for TDS, hardness, and TOC for the CAP canal, HaydenUdall WTF product, RO product, and finished RO product stabilized forcorrosion control and compares these with the WCPA's maximum levels forthese constituents.
The average annual finished RO product water with post-treatmentstabilization for corrosion control has expected concentrations of 95 to137 mg/L TDS, 44 to 86 mg/L hardness, and 0.14 mg/L TOC. In Augustwhen the lowest rejection occurs with the warmest water, the finished ROproduct water has expected concentrations of 108 to 166 mg/L TDS, 48 to 104mg/L hardness, and 0.14 mg/L TOC. These concentrations meet the WCPAcriteria for TDS and TOC and, with caustic replacing some of the lime, ifneeded, also meet the WCPA criteria for hardness.
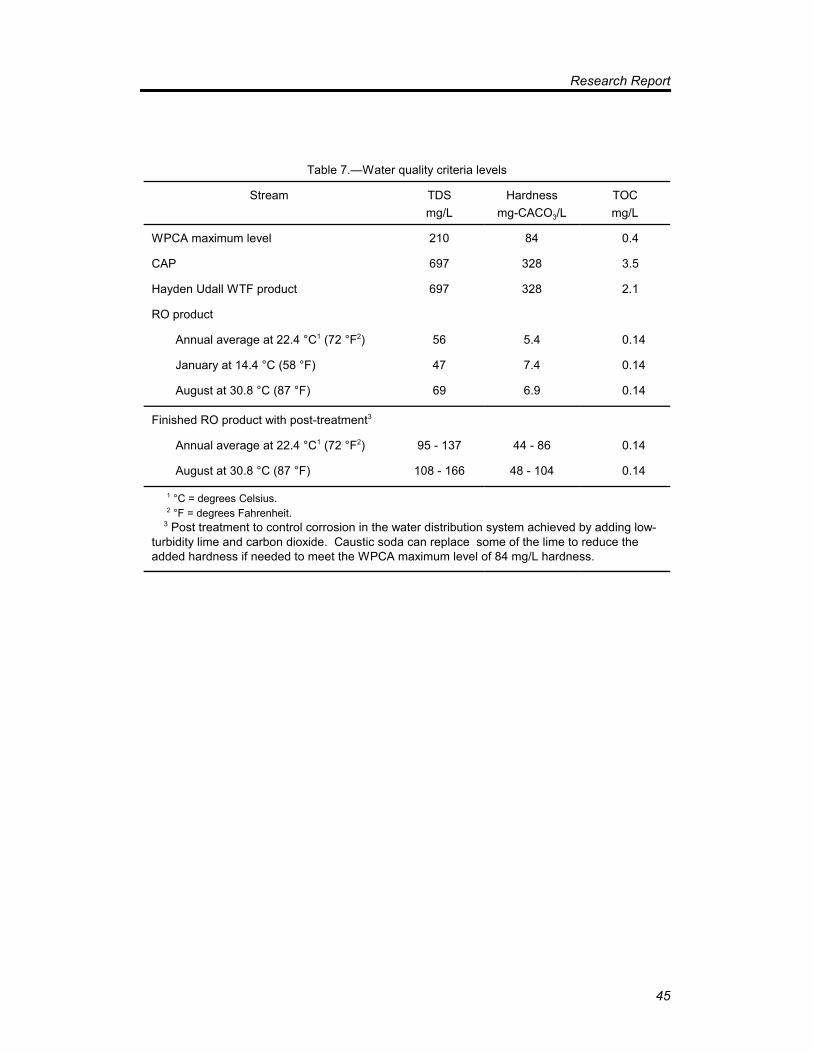
Research Report
45
Table 7.—Water quality criteria levels
Stream TDSmg/L
Hardnessmg-CACO3/L
TOCmg/L
WPCA maximum level 210 84 0.4
CAP 697 328 3.5
Hayden Udall WTF product 697 328 2.1
RO product
Annual average at 22.4 °C1 (72 °F2) 56 5.4 0.14
January at 14.4 °C (58 °F) 47 7.4 0.14
August at 30.8 °C (87 °F) 69 6.9 0.14
Finished RO product with post-treatment3
Annual average at 22.4 °C1 (72 °F2) 95 - 137 44 - 86 0.14
August at 30.8 °C (87 °F) 108 - 166 48 - 104 0.14
1 °C = degrees Celsius.2 °F = degrees Fahrenheit.
3 Post treatment to control corrosion in the water distribution system achieved by adding low-turbidity lime and carbon dioxide. Caustic soda can replace some of the lime to reduce theadded hardness if needed to meet the WPCA maximum level of 84 mg/L hardness.
Reverse Osmosis Treatment of CAP Water
46
ConclusionsTo determine the cost and viability of NF or RO membrane treatment ofCAP water, this study developed the following information.
1. Membrane type
Polyamide reverse osmosis membrane elements operating at pressures of 90to 140 pounds per square inch gauge (psig) pressure are selected for thepreliminary conceptual design. PA NF “softening” membrane elements (withsodium chloride salt rejections of 80 percent or less) have insufficient saltrejection to produce the target 210 mg/L TDS. Cellulose acetate (CA)membrane elements were not selected primarily because they requireoperation at pH 5.5, and the required acid (if sulfuric acid) increases thesupersaturation and potential scaling of barium sulfate by about 40 percent.
A downside to using PA membranes compared to CA membranes is that freechlorine disinfection cannot be used, because PA membranes can suffersignificant losses in salt rejection in the presence of free chlorine. AlthoughPA membranes operated successfully without degradation in short-term pilottests in this study, in short-term pilot tests at Reclamation's WQIC, and forseveral years with chloramine disinfection at wastewater reuse plants,generally PA membranes operate with no disinfectant and rely on periodiccleanings to control biofouling. The selected treatment alternativesincorporate PA membranes with an estimated 3-year replacement frequency,no disinfection, and nine RO cleanings per year.
NF remains a potential alternative in stage 1 of a three-stage NF/RO plant. CA remains a potential alternative if, in future tests, PA elements exhibithigh fouling rates or high cleaning frequencies, if CA operation at highrecovery can be achieved at the higher barium sulfate supersaturation levelsassociated with sulfuric acid addition, or if hydrochloric acid is used.
Research Report
47
2. Maximum product water recovery
Pilot tests with MF/UF - RO operated at RO recoveries as high as 90 percentwith no observed scaling or performance decline in the tail elements. Because the design CAP water TDS is higher than that of the pilot testfeedwater, the authors selected an 85-percent RO water recovery for thisconceptual design.
3. Selection of microfiltration or ultrafiltration pretreatment toreverse osmosis
Pilot tests with Hayden Udall PP modeled to represent the HaydenUdall WTF provided marginally adequate pretreatment for RO stage 1 inpilot test activity 4. Observed RO pilot plant stage 2 performance declinesare attributed to scaling by aluminum hydroxide from the alum coagulant. Although the direct filtration provided by the HUWTF (or conventionaltreatment if the HUWTF is modified with sedimentation basins), possiblymay be modified to provide low-fouling and low-scaling waters to the ROprocess, pilot tests with the Hayden Udall PP did not achieve this goal.
Because pilot tests with MF and UF pretreatment successfully maintainedRO performance in pilot test activities 5 and 7, MF or UF pretreatment wasselected.
4. Concentrate disposal quantity, composition, recommendedalternatives, and costs
At 85-percent RO water recovery, a desalting plant producing an average of91.5 MGD of desalted water requires a feed flow of 107.6 MGD and aconcentrate flow of 16.1 MGD. Operating with a CAP TDS of 700 mg/L andproducing RO product water with a TDS of 56 mg/L, the concentrate TDS is4,400 mg/L.
Concentrate disposal presents a serious challenge to the operation of anRO plant at an inland site, such as Tucson. Nevertheless, the studyidentified several viable alternatives. The recommended alternativesdischarge to the Gulf of California, obtaining beneficial uses of the brackishwater en route.
Based on the criteria of effectiveness, implementability, and cost, the workgroup selected and the authors recommend the use of a proposed Central
Reverse Osmosis Treatment of CAP Water
48
Arizona Salinity Interceptor to collect and transport brackish waters bygravity from the Tucson and Phoenix areas to Yuma. CASI offers a regionalsolution to projected needs throughout central Arizona for the discharge ofbrackish residual waters from desalting plants, water reuse plants, andurban and agricultural irrigation.
At Yuma the brackish water has several potential beneficial uses, includingserving as an additional brackish water supply to the Santa Clara wetland,further desalting at the Yuma Desalting Plant, restoration of the Salton Sea,and/or restoration of the Colorado Delta.
The Central Arizona Water Conservation District could operate CASI in amanner similar to the Santa Ana Watershed Protection Authority’s operationof the SARI pipeline in Orange County, California.
In the possible absence of partners to build and operate CASI, the authorsrecommend considering a shorter route to transport the concentrate by pipeline to the Gulf of California at a discharge site east of Puerto Penasco,where the brackish water is expected to have several potential beneficialuses.
These concentrate disposal alternatives have estimated capital costs of $86to $189 million, depending on which of route to the Gulf of California isselected and the number of partners to share in the CASI route throughYuma.
Of the estimated total capital costs of $264 to 372 million for desalting andconcentrate disposal, concentrate disposal capital costs represent 32 percentwith the high-volume CASI canal (CC270) and 51 percent with the non-partnered pipeline to Puerto Penasco (PP16).
Operation and maintenance for concentrate disposal has estimated costs of$0.5 to 1.4 million per year.
Concentrate disposal alternative selection and costs will depend on theparticipation, agreement, and/or approval from local, state, tribal, U.S., andMexico governments.
5. Costs of RO treatment including concentrate disposal
For the recommended alternatives, installation of 150-MGD capacity MF/UFand RO treatment processes at the HUWTF has an estimated capital cost of
Research Report
49
approximately $178 to 183 million for an installed cost of $1.19 to $1.22 pergpd capacity. Installation of concentrate disposal has an estimated capitalcost of $86 to $189 million, depending on which of the three recommendedalternatives is selected. The estimated total capital costs range from $264 to372 million, of which concentrate disposal capital costs represent 32 percentwith the high-volume CASI canal (CC270) and 51 percent with the non-partnered pipeline to Puerto Penasco (PP16).
Operation and maintenance of 150-MGD capacity MF/UF and RO treatmentprocesses has an estimated cost of $17.1 million per year (refer to table 5). Operation and maintenance for concentrate disposal has much lowerestimated costs of $0.5 to $1.4 million per year
Compared to the present design of the HUWTF, water treatment operatingand maintenance costs increase by $12.2 to $13.4 million per year. Compared to the present HUWTF, the combination of amortized capital costsand operating and maintenance costs results in additional annual costs of$33 to $41 million per year to upgrade to desalting and concentrate disposal.
For the annual production of 33.4 billion gallons of desalted water, the cost toupgrade to include desalting with the recommended alternatives ranges from$1.00 to $1.24 per thousand gallons. In terms of tons of salt removed,desalting and concentrate disposal removes 108,600 tons of salt per year at acost ranging from $308 to $380 per ton.
The study evaluated treatment by granular activated carbon (GAC) inparallel to RO, but estimated that the GAC process would not result in lowercosts, and would add complexity and produce lower-quality water.
6. What additional pilot plant, regulatory, and cost issues need to beaddressed in the next evaluation stage of this water treatmentoption?
Cost sharing of RO treatment
Explore cost sharing of RO treatment with WWTP and WWTP effluentowners, who benefit by having lower TDS wastewater. For the 62 percent ofthe treated water that reaches the WWTP, an RO plant lowers thewastewater TDS from 950 mg/L for direct-delivered CAP water to about350 mg/L with RO-treated CAP water.
Reverse Osmosis Treatment of CAP Water
50
RO pretreatment design
Because two recent studies have concluded that slowsand filtration holdspromise as an effective and low-cost pretreatment for RO treatment of CAPwater, consider SSF-RO treatment alternatives 8 and 9 (refer to table 2).
Because the existing CAVSRP may also adequately filter CAP water for ROtreatment if the recovered water is delivered to the RO plant in a closedpipeline, evaluate the effectiveness and costs of table 2 treatmentalternatives 6 and 6a: CAVSRP - RO.
Because the emerging technology of MF/UF continues to improve rapidly,continue to review the costs of the two recommended treatment alternatives(refer to table 2 numbers 7 and 10): HUWTF - MF/UF - RO and MF/UF -RO. In pilot tests, evaluate the effectiveness of MF/UF improvementsoffering significant cost reductions.
Because the RO industry continues to advance RO membrane technologies,continue to review improvements such as “low-fouling” PA membranes forpossible operation with the existing HUWTF for table 2 treatmentalternative 3: HUWTF - RO. In pilot tests, evaluate effects of operationalchanges to the HUWTF and the use of low-fouling PA membranes with thegoal of obtaining reliable low-fouling and non-scaling operation with thistreatment alternative.
RO design
In pilot studies on surface water from the CAP or Colorado River:
a. Evaluate RO cleaning frequencies.
b. Evaluate the effects of antiscalants on RO fouling, RO recovery, andbarium sulfate crystallization (see d. below). Because antiscalantsare the third highest operation and maintenance cost item (afterelectricity and membrane replacement), it may be advisable to includethe lower cost, generic sodium hexametaphosphate antiscalant in theevaluation.
c. Evaluate stabilization of RO product water to avoid pipe corrosion.
d. Evaluate the need for stabilization of RO concentrate to avoid scalingof concentrate disposal pipelines or canals. If stabilization is needed,
Research Report
51
test a pilot-scale barium sulfate crystallizer to remove supersaturatedbarite.
e. Evaluate operating at as high as 90-percent recovery becauseincreasing recovery from 85 percent to 90 percent increases water useby 5 percent and decreases the concentrate disposal volume by onethird. Include an evaluation of the effect the higher concentrate TDS(about 6,000 mg/L at 90-percent recovery) would have on concentratedisposal alternatives.
Concentrate disposal
The greatest uncertainties with respect to implementability and cost arerelated to concentrate disposal.
a. For the recommended Central Arizona Salinity Interceptor to Yuma,
� Review the rate of accumulation of salt and brackish water inCentral Arizona and estimate the required discharge of brackishwater to achieve salt balance so that salt outflows equal saltinflows.
� Because almost all present brackish water discharges in CentralArizona eventually reach groundwater, estimate the predictedgroundwater salinities, groundwater rise rates, and dates whenthe groundwater levels will surface and thereby waterlog andsalinize Central Arizona soils.
� To avoid surfacing groundwater, participate in a regionalevaluation of the reuse and disposal of brackish water“concentrates” from desalting plants, water reuse plants, andagricultural and urban irrigation in Central Arizona.
The Central Arizona Salinity Study (CASS) began a regional evalua-tion to address the above three actions in October 2001. For informa-tion on CASS, see <http://cass.bcportals.com/public/default.cfm>. Ifthe regional evaluation concurs with the recommendation of thisstudy to construct and operate CASI, then proceed with the followingactions:
Reverse Osmosis Treatment of CAP Water
52
• Work with Reclamation and the International Boundary andWater Commission (IBWC) to explore an international agreementfor concentrate discharge to the Santa Clara wetland or Gulf ofCalifornia using the existing bypass canal.
• Explore and evaluate additional beneficial uses of brackish waterin the Yuma area, including further desalting at the YumaDesalting Plant, restoration of the Salton Sea, and/or restorationof the Colorado Delta. Because selenium levels in theconcentrated Colorado River water may present toxicity concernsfor beneficial ecological uses, evaluate selenium toxicities for theseecologies.
• Refine the CASI cost estimates
• To share CASI construction and operating costs, evaluatepotential partnerships with brackish water users in the Yumaarea. Develop preliminary fee structures for delivered brackishwater.
• Explore possibilities for power generation for the 2400-footelevation drop.
• Determine if CASI return flows can be subtracted, on a full orpartial basis, from CAP diversions in calculating CAPconsumptive use. This would enable increased CAP diversionswith the same consumptive use allotment.
b. For the alternate route to the Gulf of California with a discharge siteeast of Puerto Penasco,
• Meet with the Tohono O'Odham Nation to explore obtaining apipeline right-of-way.
• Work with Sonora and Mexico Government agencies through theIBWC to evaluate beneficial uses for the brackish concentrate,select a discharge site, and address pipeline/canal right-of-wayissues in Mexico.
• Refine the cost estimates, including a more detailed analysis ofcosts with a canal for part of the route.
Research Report
53
• Evaluate opportunities to obtain cost-sharing from end users forbeneficial uses of concentrate water.
• Explore possibilities for power generation for the 2400-footelevation drop.
54
ReferencesAdham, Smer S., Joseph G. Jacangelo, and Jean-Michel Laine, 1996,
“Characteristics and Costs of MF and UF Plants,” Journal AWWA,May 1996, pages 22-30.
Bookman-Edmonston Engineering, 1998, “Salinity Management Study FinalReport, Long-Term Strategy and Recommended Action Plan, Draft,”prepared for the Metropolitan Water District of Southern California andthe U.S. Bureau of Reclamation, June 1998, pages 2-24 and TA10-22.
Bouwer, Herman, 1997, “Arizona’s Long-Term Water Outlook: From NIMTOto AMTO,” Newsletter of the Arizona Hydrological Society, April/May1997.
Chowdhury, Zaid, Sunil Kommineni, James Lozier, Fair Miller, Gary Amy,and Steve Grooters, 2003, “Innovative Biological Pretreatments forMembrane Filtration,” American Water Works Association ResearchFoundation, 2003.
Dames and Moore, 1995, “CAP Use Study for Quality Water, Draft TechnicalMemorandum Development of Draft Plans,” May 22, 1995, pg 2.2-12, andC-9.
Gillaspie, Jennifer, 1997, personal communication, Tucson WaterDepartment, Tucson, Arizona, December 1997.
Irvine, Scott R., 2000, "Evaluation of Two Concentrate Disposal Alternativesfor the Phoenix Metropolitan Area: Evaporation Ponds and Discharge tothe Gulf of California," Bureau of Reclamation Desalination and WaterPurification Research and Development Program Report No. 54, March2000.
Liang, Sun, Leslie S. Palencia, and Jeanne-Marie Bruno, 1999, “Evaluationof Methyl Tertiary-Butyl Ether and Perchlorate Rejection byNanofiltration and Reverse Osmosis Membranes,” Proceedings of theAmerican Water Works Association Membrane Technology Conference,”Long Beach, California, February 28 through March 3, 1999.
Research Report
55
Logsdon, Gary, Alan Hess, and Michael Horsley, 1999, “Guide to Selection ofWater Treatment Processes,” chapter 3 in Water Quality and Treatment,A Handbook of Community Water Supplies, 5th edition, Raymond D.Letterman, technical editor, McGraw-Hill, pg. 3.12-3.13.
Mapes, Sarah L., 1996, “Avra Valley Water Quality Parameters forProposition 200,” Memorandum to Charles K. McClain, February 15, 1996.
McAleese, Paul, Charles Moody, Steve Duranceau, Brent Corbett, and KimThorner, 1999, “Integrated Membrane Systems Pilot Test Program forthe Olivenhain Water Storage Project (in preparation),” was presented atthe 1999 AWWA Membrane Technology Conference, March 1999.
Moody, Charles, Bruce Garrett, and Eric Holler, 2002, “Pilot Investigation ofSlowsand Filtration and Reverse Osmosis Treatment of Central ArizonaProject Water,” U.S. Department of the Interior, Bureau of Reclamation,Science and Technology Program Advanced Water Treatment ResearchProgram Report No. 90, August 2002.
Reclamation, Bureau of, 1998a, Salton Sea Alternatives, Final PreappraisalReport. U.S. Department of the Interior, Bureau of Reclamation, LowerColorado Region, Boulder City, Nevada, November 12, 1998.
Reclamation, 1998b, Environmental Impact Statement, Central ArizonaProject, Tucson Aqueduct System Reliability Investigation, Bureau ofReclamation, Phoenix Area Office, April 1998.
Riley, Robert L., 1998, personal communication, Separation SystemsTechnology, La Jolla, California, September 29, 1998.
Sword, Teresa, 1998, personal communication, Zenon EnvironmentalSystems, Inc., Burlington, Ontario, Canada, October 1998.
Tanner, Rene, Jaqueline Garcia, Donald J. Baumgartner, Edward Glenn,and James J. Riley, 1997, “Acceptability of Potential Water Supplies tothe Santa Clara Wetlands with Respect to Salinity and Selenium,”University of Arizona Environmental Research Laboratory, prepared forthe Bureau of Reclamation (see appendix D for report).
Tucson Water Department, 1996, “1995 Annual Groundwater Withdrawaland Use Report,” City of Tucson, Tucson Water, Planning andEngineering Division, April 30, 1996, page 5.1.
Reverse Osmosis Treatment of CAP Water
56
Tucson Water Department, 1997, “1996 Annual Groundwater Withdrawaland Use Report,” City of Tucson, Tucson Water, Planning andEngineering Division, March 31, 1997, page 5.1.
Tucson Water Department, 1998, “1997 Annual Groundwater Withdrawaland Use Report,” City of Tucson, Tucson Water, Planning andEngineering Division, March 31, 1998, page 5.1