Embed Size (px)
Citation preview
Feasibility of Using Reverse Osmosis as
Post-Treatment of Wastewater in
Gaza Wastewater Plants
دراسة جدوى استخدام تقنية التناضح العكسي لمعالجة مياه الصرف الصحي الناتجة من محطات المعالجة
By
Abedelmajeed Moeen Kahail
Supervised by
Dr. Mazen Abualtayef
Associate Professor, Environmental Engineering Department
A thesis submitted in partial fulfilment of the requirements for the
degree of Master of Science in Civil Engineering, Infrastructure
Engineering
August/2018
ـزةــــــبغـــــ ةـــــــالإســـــلاميــامعــــــــــة ـــالجـ عمادة البحث العممي والدراسات العميا
ــةــــــــــــــــــــــــــــــــــــــــــــــــة الهندســــــــــــــكـمي ــــةســــــة المدنيـــــــــــدــــــــالهن قســـــــــــــــم
البنــــــــــــــــــــــى التحتيـــــــــــــةهندســـــــــة
The Islamic University of Gaza
Deanship of Research and Graduate Studies
Faculty of Engineering
Civil Engineering Department
Infrastructure Engineering
I
إقرار
أنا الووقع أدناه هقذم الرسالة التي تحول العنواى:
Feasibility of Using Reverse Osmosis as
Post-Treatment of Wastewater in
Gaza Wastewater Plants
تقنية التناضح العكسي لمعالجة مياه دراسة جدوى استخدام الصرف الصحي الناتجة من محطات المعالجة
أقر بأن ما اشتممت عميو ىذه الرسالة إنما ىو نتاج جيدي الخاص، باستثناء ما تمت
الإشارة إليو حيث ورد، وأن ىذه الرسالة ككل أو أي جزء منيا لم يقدم من قبل الآخرين لنيل
بحثي لدى أي مؤسسة تعميمية أو بحثية أخرى.درجة أو لقب عممي أو
Declaration
I understand the nature of plagiarism, and I am aware of the University's
policy on this.
The work provided in this thesis, unless otherwise referenced, is the
researcher's own work, and has not been submitted by others elsewhere for
any other degree or qualification.
Student's name: Abedelmajeed Moeen Kahail :اسم الطالب
Signature: Abedelmajeed Moeen Kahail :التوقيع
Date: 13/08/2018 :التاريخ
II
نتيجة الحكن
III
Abstract
Wastewater reclamation has become a viable alternative to supplement
water supplies in water scarcity areas. Current chemical, physical and biological
wastewater treatment techniques don‟t always duly remove all biogenic elements
(nitrates, ammonia and phosphates) and other pollutants to proper reuse wastewater.
Modern methods like membrane technologies recently gained the
acceptance and is being used in commercial large-scale worldwide. Reverse osmosis
can offer high removal rates with low energy consumption for many of contaminants
and pollutants such as dissolved solids, heavy metals, organic pollutants, viruses,
bacteria, and other dissolved contaminants. However, to apply reverse osmosis to
treat wastewater successfully, appropriate pretreatment is required to decrease
fouling rates for RO membranes and extend its life.
Our research aims to assess the performance of using RO as post treatment
for Gaza wastewater treatment plants and compare it with Palestinian standards for
non-potable usage as agriculture and groundwater recharging. Also, the research
aims to estimate the total cost of applying this extra advanced technology.
The experimental work using RO membrane unit as a post treatment was
conducted in two trials. In each trial, the partially treated wastewater was collected
from GWWTP effluent and fed to sand filter then to three stages of micro-filtration
membranes as pretreatment then to the RO membrane unit. The BOD, TSS, TDS,
FC, NO3, EC pH and Temperature was tested at every stage of the experiment
system.
Results shows that RO with its associated pretreatment treatment has ability
to remove 011% of BOD, 92% of TSS, 100% of Nitrate, 100% of FC, and 88% of
TDS. Furthermore, cost analysis for using RO as post treatment for GWWTPs was
done. Results shows that the cost of 1m3 of treated wastewater less than 1.9$ and
consume 0.7 Kwh.

IV
هلخص الذراسة
اكتسبت إعادة استخدام مياه الصرف الصحي المعالجة أىمية كبيرة وأصبحت تعتبر مصدر لاستكمال النقص في المياه خصوصا في المناطق الفقيرة بالمياه. إن أحدث تقنيات
والفيزيائية والبيولوجية الحالية لا تقوم بإزالة جميع العناصر الحيوية معالجة المياه الكيميائية والمموثات الأخرى لإعادة استخدام مياه الصرف الصحي عمى )النترات والأمونيا والفوسفات(
النحو الأمثل.
اكتسبت التقنيات الحديثة مثل تقنيات الأغشية مؤخرا القبول ويتم استخداميا في عمى معدلات إزالة عالية وبحجم محطات كبيرة. يوفر التناضح العكسي ي أنحاء العالمنطاق واسع وف
لمعديد من المموثات مثل المواد الصمبة الذائبة والمعادن الثقيمة والمموثات العضوية والفيروسات والبكتيريا والمموثات الأخرى الذائبة ذات الاستيلاك المنخفض من الطاقة. ومع ذلك، من أجل
لتناضح العكسي بنجاح لمعالجة المياه العادمة، يمزم إجراء معالجة مسبقة مناسبة لتقميل تطبيق ا وحدات التحمية ولإطالة عمر الغشاء. دمعدلات الانسدا
ييدف ىذا البحث لتقييم أداء استخدام التناضح العكسي كمعالجة متقدمة لمياه ا مع المعايير الفمسطينية الصرف الصحي الناتجة من محطات المعالجة في غزة ومقارنتي
عادة تغذية المياه الجوفية. كما ييدف البحث إلى للاستخدامات غير الشرب مثل الزراعة وا التقنية. مثل ىذهتقدير التكمفة الإجمالية لتطبيق
. في كل تجربة، التناضح العكسيتم إجراء التجربة عمى مرتين باستخدام وحدة غشاء جزئيا من مياه الصرف الصحي من محطة معالجة غزة وتغذيتيا تم جمع مياه الصرف المعالجة
كمعالجة مسبقة ثم إلى MFإلى مرشح رممي ثم إلى ثلاث مراحل من أغشية الترشيح الدقيقة ECو pHو NO3و FCو TDSو TSSو BOD. تم اختبار التناضح العكسيوحدة غشاء
ودرجة الحرارة في كل مرحمة من مراحل نظام التجربة.
لدييا القدرة عمى مع المعالجة المسبقة المرافقة لو التناضح العكسي تظير النتائج أن ٪ 88، و FC٪ من 011٪ من النيترات، TSS ،011٪ من BOD ،29٪ من 011إزالة تم إجراء تحميل لمتكمفة لاستخدام ىذه التقنية واظيرت النتائج أن ذلك،. علاوة عمى TDSمن
دولار وتستيمك 1.2من مياه الصرف الصحي المعالجة أقل من الواحدالمتر المكعب تكمفة كيمو وات بالساعة. 1.0طاقة اقل من

V
اقتباس
عملن أ
ي وأ وال وعل نعمت عل
شكر نعمتك امت أ
ن أ
وزعن أ
رب أ
دخنن الي صالا ترضاه وأ برحتك ف عبادك الص
] 91النمل: [
"My Lord, enable me to be grateful for Your favor which
You have bestowed upon me and upon my parents and to do
righteousness of which You approve. And admit me by Your
mercy into [the ranks of] Your righteous servants."
(An-Naml – 19)

VI
DEDICATION
This work mainly dedicates for Allah pleasing
To my parents for their kindness and support
To my wife for her encouragement
To my beloved Kids Moeen & Mira
To my brothers and sisters
To all knowledge seekers
To everyone who search for better life and prosperous
future for humankind

VII
Acknowledgment
First of All I would like to thank the almighty Allah for His endless
Grace and Blessing on me and all my life. Peace and blessing of
Allah be a upon last Prophet Mohammed (Peace Be Upon Him).
I would like to thank all people who have assisted, guided and
supported me in my studies leading to this thesis. I heartily thank
my advisor, Dr. Mazen Abualtayef, for his great help, encouraging
support, valuable ideas.
I would like to express my grateful appreciation and thanks to
Infrastructure Engineering staff of the Islamic University of Gaza
for their academic and scientific support throughout my study of
MSc.
I wish to acknowledge the funding entities that made this research
possible, including the Palestinian Water Authority (PWA) and The
Middle East Desalination Research Centre (MEDRC).
Finally, special thanks to my family, especially my parents and my
wife, for their support and encouragement which gave me the
strength to continue.
VIII
List of Abbreviation & Units
AOP Advanced Oxidation Process
AWT Advanced Water Treatment
BOD Biochemical Oxygen Demand
°C Degrees Celsius
Cl Chloride
CMWU Coastal Municipal Water Utility
COD Chemical Oxygen Demand
DOC Dissolved Organic Carbon
dS/m Decisiemens Per Meter
EC Electrical Conductivity
FC Fecal Coliform
GWWTP Gaza Wastewater Treatment Plant
h Hour
kW Kilo Watt
L Liter
l/c/d Liter Per Capita Per Day
Lab Laboratory
m3 Cubic Meter
mm Millimeter
MCM Million Cubic Meter
MGD Million Gallons per Day
MLD Million Liter per Day
MPN Most Probable Number
MF Micro Filtration
MOA Ministry Of Agriculture (Palestine)
NF Nano Filtration
NH3 Ammonia
NO3 Nitrate
PPM Part Per Million
PSI Palestinian Standards Institute
PWA Palestinian Water Authority
RO Reverse Osmosis
SF Sand Filter
STLV Short Term Low Volume
TKN Total Kjeldahl Nitrogen
TS Total Solid
TWW Treated Wastewater
UF Ultrafiltration
UNDP United Nations Development Programme
WWTPs Wastewater Treatment Plants
WW Wastewater
IX
Table of Contents
I ..................................................................................................................................... إقرار
II ........................................................................................................................... نتيجة الحكم
Abstract ........................................................................................................................... III
IV ..................................................................................................................... ملخص الدراسة
V ................................................................................................................................. اقتباس
DEDICATION ................................................................................................................ VI
Acknowledgment ........................................................................................................... VII
List of Abbreviation & Units ....................................................................................... VIII
Table of Contents ............................................................................................................ IX
List of Tables ............................................................................................................... XIII
List of Figures .............................................................................................................. XIV
Chapter 1: Introduction ................................................................................................ 1
1.1 Background ................................................................................................................. 2
1.2 Aim and Objectives .................................................................................................... 4
1.3 Problem Statement ...................................................................................................... 5
1.4 Thesis structure ........................................................................................................... 5
1.5 Research Importance ................................................................................................... 6
1.6 Research Methodology ............................................................................................... 6
Chapter 2: Literature Review ....................................................................................... 8
2.1 Background ................................................................................................................. 9
2.2 Wastewater Reuse ....................................................................................................... 9
2.3 Wastewater Characteristics ....................................................................................... 10
2.3.1 Types of BOD ........................................................................................................ 10
2.3.2 Types of microbiological ....................................................................................... 11
2.4 Treatment Methods ................................................................................................... 12
X
2.5 Quaternary (Advanced) treatment using membrane processes ................................. 14
2.5.1 Introduction ............................................................................................................ 14
2.5.2 Pre-treatment for Reverse osmosis ........................................................................ 15
2.5.3 Reverse osmosis ..................................................................................................... 17
2.6 Potential of Wastewater Reuse Applications ............................................................ 22
2.7 Wastewater Reuse in Agriculture ............................................................................. 24
2.7.1 Impact of Wastewater Reuse in Agriculture .......................................................... 25
2.7.2 Public Acceptance .................................................................................................. 28
2.7.3 Social Acceptance .................................................................................................. 30
2.8 Regulations and Standards of Treated Wastewater .................................................. 30
2.8.1 WHO guidelines .................................................................................................... 30
2.8.2 Palestinian standards .............................................................................................. 32
2.9 Limitation of Wastewater Reuse in Gaza ................................................................. 34
2.10 Case Studies ............................................................................................................ 35
2.10.1 Sulaibiya Wastewater Reclamation Plant in Kuwait ........................................... 36
2.10.2 Groundwater replenishment scheme in Orange County, USA ............................ 36
2.10.3 Changi Water Reclamation Plant, Singapore ...................................................... 37
2.10.4 Bundamba Advanced Water Treatment Plant ..................................................... 37
Chapter 3: Study Area ................................................................................................ 39
3.1 Introduction ............................................................................................................... 40
3.2 Water Resources in Gaza Strip ................................................................................. 41
3.2.1 Groundwater .......................................................................................................... 41
3.2.2 Non-conventional water resources ......................................................................... 41
3.3 Wastewater in Gaza Strip ......................................................................................... 42
3.3.1 Present situation of wastewater in Gaza Strip ....................................................... 42
3.3.2 Wastewater Composition in Gaza Strip ................................................................. 44
XI
3.3.3 Wastewater treatments in Gaza Strip ..................................................................... 44
3.4 Strategy for the development of reclaimed effluent reuse in agriculture ................. 48
Chapter 4: Methodology ............................................................................................. 51
4.1 Data collection .......................................................................................................... 52
4.2 Field Experiment ....................................................................................................... 52
4.2.1 Experimental set up and procedure ........................................................................ 52
4.2.2 Sand filter design ................................................................................................... 53
4.2.3 Microfiltration/Ultrafiltration Unit ........................................................................ 54
4.2.4 Reverse Osmosis Unit ............................................................................................ 54
4.3 Sample Collection ..................................................................................................... 54
4.4 Analytical Work ........................................................................................................ 55
4.4.1 Biochemical Oxygen Demand (BOD5) ................................................................. 55
4.4.2 Fecal Coliforms (FC) ............................................................................................ 56
4.4.3 Suspended Solid (TSS) .......................................................................................... 56
4.4.4 Nitrate (NO3-N) ..................................................................................................... 56
4.4.5 pH ........................................................................................................................... 57
4.4.6 Electrical Conductivity (EC) ................................................................................. 57
4.4.7 Total Dissolved Solid (TDS) ................................................................................. 57
Chapter 5: Results and Discussion .............................................................................. 58
5.1 Efficiency for using RO to treated wastewater ......................................................... 59
5.1.1 Removal efficiency of total suspended solid (TSS) ............................................... 59
5.1.2 BOD5 Mean Removal Efficiency .......................................................................... 61
5.1.3 Fecal coliform (FC) Mean Removal Efficiency .................................................... 62
5.1.4 Nitrate (NO3) Mean Removal Efficiency .............................................................. 63
5.1.5 Removing Efficiency of TDS ................................................................................ 63
5.1.6 pH results ............................................................................................................... 64
XII
5.2 Comparing the results with the Palestinian standards for non-potable usages ......... 65
5.3 Energy Consumption ................................................................................................ 67
Chapter 6: Cost Estimation ........................................................................................ 68
6.1 Experiment Model .................................................................................................... 69
6.1.1 Energy cost ........................................................................................................... 72
6.2.1 Estimated fixed cost ............................................................................................... 73
6.2 Comparison Study ..................................................................................................... 73
6.2.1 Cost breakdown of RO treatment plant ................................................................. 73
6.2.2 Pretreatment cost ................................................................................................... 74
6.2.3 RO Membrane Replacement and Cleaning ........................................................... 75
6.2.4 Other Fixed Costs .................................................................................................. 75
6.2.5 Other Variable Costs .............................................................................................. 75
6.2.6 Total Cost of Ownership ........................................................................................ 76
6.3 Energy Cost ............................................................................................................... 77
6.3.1 Energy costs from conventional sources ............................................................... 77
6.3.2 Energy cost for wastewater reuse .......................................................................... 77
6.3.3 Energy cost for seawater reuse .............................................................................. 78
6.3.4 Summary of energy costs from various sources .................................................... 78
6.3 Conclusion ................................................................................................................ 79
Chapter 7 : Conclusion and Recommendations ......................................................... 81
7.1 Conclusion ................................................................................................................ 82
7.2 Recommendations ..................................................................................................... 82
REFERENCES ............................................................................................................... 84
XIII
List of Tables
Table (2.1): Levels of wastewater treatments ...................................................... 13
Table (2.2): Some of pathogenic organisms linked with raw wastewater ........... 29
Table (2.3): WHO guidelines for using treated effluent in irrigation .................. 31
Table (2.4): Classification of wastewater quality (PS 742/2003) ........................ 33
Table (2.5): Recommended PSI effluent standards (PS742/ 2003) ..................... 33
Table (2.6): Criteria recommended by PSI for crops (PS742/ 2003) .................. 34
Table (3.1): Estimated amounts of wastewater produced in Palestine in 2015 ... 43
Table (3.2): Anticipated amount of effluent generated in Gaza Strip in 2015 .... 44
Table (3.3): Efficiency of existing effluent treatment plants (Gaza Strip) .......... 45
Table (3.4): General characteristics of effluent treatment plants (ARIJ, 2015c) . 46
Table (3.5): Current and Future WWTPs ............................................................. 48
Table (3.6): Potential reuse of treated wastewater (PWA, 2013) ........................ 49
Table (3.7): Anticipated wastewater reuse for agriculture (PWA, 2013) ............ 50
Table (5.1): the result of TSS for experiment trial 1 ............................................ 59
Table (5.2): the result of TSS for experiment trial 2 ............................................ 60
Table (5.3): the result of trial 1 experiment of BOD5 ......................................... 61
Table (5.4): the result of trial 2 experiment of BOD5 ......................................... 61
Table (5.5): the result of trial 1 experiment of FC ............................................... 62
Table (5.6): the result of trial 2 experiment of FC ............................................... 62
Table (5.7): the result of trial 2 experiment of NO3 ............................................ 63
Table (5.8): the result of trial 1 experiment of TDS ............................................ 64
Table (5.9): the result of trial 2 experiment of pH ............................................... 65
Table (5.10): Comparing the results with the Palestinian standard for reuse in
agricultural purposes ............................................................................................ 66
Table (6.1): Feed information .............................................................................. 70
Table (6.2): Model design components ................................................................ 70
Table (6.4): Pumps data ....................................................................................... 72
Table (6.5): Power consumption for pumps ......................................................... 72
Table (6.6): Estimated fixed cost for applying the model.................................... 73
Table (6.7): Energy usage for various water and wastewater .............................. 78
XIV
List of Figures
Figure (2.1): Wastewater reclamation plants .................................................................. 35
Figure (3.1): Gaza Strip Governorates ............................................................................ 40
Figure (3.2): Current & future WWTP ........................................................................... 47
Figure (4.1): Layout of experiment ................................................................................. 53
Figure (4.2): sand filter configuration 'trial1' .................................................................. 53
Figure (4.3): Sand filter configuration 'trial2' ................................................................ 53
Figure (4.4): Reverse osmosis filter unit ........................................................................ 54
Figure (4.5): Sample collection after RO ........................................................................ 55
Figure (4.6): Experiment Layout and samples location .................................................. 55
Figure (5.1): Samples before and after desalination operation ....................................... 64
Figure (5.2): MF/UF &RO unit ..................................................................................... 65
Figure (5.3): MF/UF cartridges after the experiment ..................................................... 65
Figure (5.4): Comparing the results with the Palestinian standard for reuse in
agricultural purposes ....................................................................................................... 67
Figure (6.1): Model configuration .................................................................................. 71
Figure (6.2): Comparison between total costs when using conventional or membrane
pretreatment .................................................................................................................... 76
Figure (6.3): Energy consumption for different type of treatment ................................. 79

Chapter 1:
Introduction
2
CHAPTER 1:
INTRODUCTION
1.1 Background
The Middle East and North Africa (MENA) countries which contains 6.3% of the
world‟s population are considered to be the highest water-scarce countries in the
world, sharing only 1.4% of the world‟s renewable fresh water. These countries use
more of its renewable water resources than it receives each year and more water than
other countries. (Hamoda et al., 2015)
Gaza Strip is categorized as a semi-arid region and suffers from water scarcity.
Water demand in Gaza Strip is growing continuously due to population increase
while the water resources are constant or even reducing due to urban development.
The demanded amount of water is much more the renewable quantity of water that
replenishes the groundwater, which lead to deterioration of the groundwater system
in both quantitative and qualitative aspects (Jarboo et al., 2015).
The annual average rainfall differs from (400-200mm) from the north to south
respectively. Total abstraction of groundwater in Gaza Strip exceeds 200 MCM year
(PWA,2014). Around two thirds of groundwater pumped through more than 10000
wells used for agriculture purpose. 120 MCM annual deficit of water balance, due to
increasing of the gap between water demand and water supply, as a result of rapid
population growth in this small area. There is a pressing need to protect and conserve
fresh water and to use the water of low quality or treated wastewater for non-potable
uses. This is mainly because agriculture dominates the Palestinian water
consumption with about 50%, while leaving 50% for domestic and industrial
purposes (PWA, 2014).
There are five wastewater treatment plants operating in the Gaza Governorates:
North Gaza wastewater treatment plant in the north, Gaza wastewater treatment plant
in the Gaza city, Wadi Gaza wastewater plant, Khan Younis and Rafah wastewater
treatment plants in the south. The existing WWTPs are heavily overloaded as the
actual flow far exceeds the design flow. The total effluent of WWTPs is
approximately over 50 MCM / year. The Mediterranean Sea acts as the final
3
discarding of fully treated or partially treated wastewater in Gaza strip without any
significant reuse (CMWU, 2012).
The reuse of effluent is one of the master solution option being contemplated as a
new source of water in counties. Effluent reuse has also become an attractive choice
for protecting the ecosystem. In the last decade, there has been an important diversity
of water reuse practices, such as green space and crop irrigation, industrial
applications, and aquifer replenishment (Bouregba et al., 2016).
Wastewater reuse is the processing to make it reclaimable with definable treatment
reliability and to meet the needed effluent quality guidelines standards. Over the last
decades, the concept of encouraging effluent reclamation for water reuse to offer a
water resource supplement has grown worldwide (Asano,1998). If the quantity of
wastewater is reclaimed to a good quality, we can save the groundwater for other
purposes. This falls under the principle of sustainability, recycling and reuse of
available resources. Besides, reuse of treated effluent in irrigated agriculture would
reduce environmental pollution caused by untreated/poorly treated wastewater
(Angelakis, A. N, 2001).
Although, the use of reclaimed effluent for agriculture is subject to major concern
because of the possible increasing rapidly of social and environmental problem. The
public acceptance to use treated wastewater is a critical aspect to ensure the success
of any reuse project. Also, wastewater may contain unwanted chemical component
and pathogens that create negative environmental and health impacts. As the result,
mismanagement of wastewater irrigation would create environmental and health
problems to the environment and human beings (Huertas et al., 2008).
Presently, the reuse of reclaimed effluent is very restricted to a few illegal irrigation
sites beside the treatment plants, or limited to research activities. The quality of the
effluents would nearly meet Class C, PWA- Palestine Standards. Standards for
effluent reuse have recently been adopted (PS 742 / 2003). These set conditions on a
range of reuse options, aquifer recharge and sea discharge, with associated limit
values for physical, chemical and microbiological parameters, although discharge to
Wadi is not mentioned. Reclaimed water quality evaluation is required to determine
conformity with applicable criteria and standards.
4
A current typical process for municipal wastewater consists of primary, secondary
and tertiary treatments. The resulting effluent is low in turbidity and can be
disinfected for discharge purposes. However, this process does not decrease the level
of dissolved particles and the water is generally not suitable for discharging into
groundwater or un-restricted reusing for agriculture irrigation.
For the time being, membrane technologies such as micro, ultra, nanofiltration, and
Reverse osmosis (RO) play an increasingly important role in effluent treatment in
wide-ranging municipal wastewater treatment plants. Membrane technology employ
a semi-permeable membrane for the elimination of solids and pollutants from
wastewater. It has been utilized for many years in desalination of brackish and
seawater and was recently applied in the wastewater treatment domain. Membrane
technologies are gaining special recognition as alternatives to conventional effluent
treatment and as a means of purifying treated effluent for reuse applications (Akther,
N., 2015).
The ability of RO membranes to successfully treat wastewater and provide water
with quality exceeding the requirement have been confirmed. There has been quick
prosperity in RO usage in the reclamation of wastewater all over the world.
Compared to other technologies, RO offers low energy consumption with high rate
of pollutants and contaminates removal. Meanwhile, the most significant aspect in
the design of RO based effluent treatment system is to reduce membrane fouling by
selection of suitable and proper pre-treatment process such as Ultrafiltration (UF) or
Microfiltration (MF) )Hamoda, 2015(.
1.2 Aim and Objectives
The main aim of this study was to assess the performance of Reverse Osmosis in
improving the quality of effluent from Gaza wastewater treatment plant.
The specific objectives were:
To investigate the quality of treated wastewater using RO membranes (preceded
by suitable pre-treatment method) as a post treatment in Gaza wastewater
treatment plant.
5
To estimate the cost of applying RO as a post treatment for Gaza wastewater
treatment plants.
1.3 Problem Statement
Freshwater shortage is becoming an increasingly severe problem in Gaza strip. Gaza
Strip suffers from lack of water resources. The coastal aquifer is the sole source to
meet the fresh water needs of the residents of the Gaza Strip, but it has a limited
capacity to meet these needs. It is suffering from sharp and continuous attrition,
which is expected to reach a water deficit of 120 MCM per year (PCBS, 2011). In
the event of continuing the same policies that were followed during the past years
(pumping, the lack of sustainable management), this may lead to acute deterioration
of water resources, groundwater may become more saline due to seawater intrusion.
The sewage discharge in the sea seems to be a problem; it is not only contaminating
Gaza sea water but also posing health risks for bathers and consumers of seafood.
This situation can lead to the spread of pathogens that are multi-drug resistant. Water
quality tests performed in late April 2008 by the World Health Organization at 13
points along Gaza's coast found that four sites (Three in Gaza city and one in Rafah
city) are polluted with high levels of fecal bacteria. This would indicate that
pathogenic organisms within the general population may be being released to the
coastal waters, thereby posing health risks to those who bathe in or consume shellfish
from contaminated waters (Alafifi, 2006)
Therefore, conventional methods for wastewater treatment are not enough to
preserve environment or maintain public health and didn‟t reach the minimum
international treatment standard to use it in agriculture, discharge it in groundwater
or even dispose it into sea.
1.4 Thesis structure
This thesis consists of Seven chapters structured and detailed as follows:
Chapter one: Introduction, prefaces for wastewater situation in Gaza Strip and RO,
the main objective definition, research importance and methodology
Chapter two: Literature review for the related topics and case studies for similar
projects in the world.
6
Chapter three: Study area, wastewater situation and wastewater treatment plants in
Gaza Strip.
Chapter four: Methodology.
Chapter five: Describes the result of experiments
Chapter six: Estimate cost for applying RO in GWWTP
Chapter seven: Defines recommendation and conclusion of the experiment
1.5 Research Importance
The crisis of water scarcity looming on the horizon and threatens the stability and
security of the Gaza strip. The crisis will continue and increase with time, if no
suitable actions are taken as soon as possible. Reuse of reclaimed wastewater has two
major objectives: it improves the environment quality by reducing the level of
contaminants load into the receiving water resources or to the Mediterranean Sea,
and it conserves water resources by reducing the demand for groundwater
abstraction.
The reuse of treated wastewater, particularly in irrigated agriculture because it uses
50% of all water consumption, are the most recommended alternatives for alleviation
of the sever water shortage in Palestine. On the other hand, the quality of treated
wastewater must meet the international standard for non-potable use and has to gain
public and social acceptance which conventional wastewater method of treatment
failed to achieve.
1.6 Research Methodology
The methodology followed to achieve the study objectives is summarized as follows:
1- Identify the research problem, research justification, set out the research's aim
and objectives.
2- Review previous studies, researches, research papers and journals related to
using membrane technologies as wastewater post treatment method.
3- Design experimental set up to investigate the quality of treated wastewater using
RO membranes.

7
4- Estimate the cost of applying RO as a post treatment for Gaza wastewater
treatment plant and make a comparison with worldwide similar project.
5- Make final conclusions and recommendations for feasibility of using RO as post
treatment for wastewater to meet international standards

Chapter 2:
Literature Review
9
Chapter 2:
Literature Review
2.1 Background
Water has a priceless value and each drop must be considered in water scarcity
Areas. Water-related problems are increasingly known as one of the most actual and
serious environmental threats to human kind. Water usage all over the world has
tripled since 1950, and one out of every six persons does not have regular access to
safe potable water. Lack of access to a safe water supply and sanitation impacts the
health of 1.2 billion people every year. (UNICEF, 2000).
The coastal aquifer is the only source of water in the Gaza Strip. The annual recharge
volume, equaled to the sustainable yield for the aquifer, is in the range of 55-60
MCM/yr. The Palestinian abstraction from this aquifer in Gaza Strip was about 178
MCM in 2013. The agriculture sector consumes around 88 MCM/year of the entire
groundwater pumped through wells (legal and illegal) located overall Gaza
Governorates. The remaining 90 MCM/year is used for domestic and industrial water
supplies. The water balance record shows a deficit of about 120 MCM/year (PWA
2013).
Many modernistic and conventional approaches, exist globally for efficiency
enhancement. These approaches to overcome this shortage rely in the policy of
ensuring additional water supply and wastewater reuse plan. Using effluent water
could be one of the main choices to improve the water resources in the Gaza Strip as
it appears an additional reliable and renewable water source (Afifi, 2000).
2.2 Wastewater Reuse
The phrase “wastewater” mainly means any water that is no longer needed, as no
further benefits can be obtained out of it. About 99 percent of wastewater is water,
and only one percent is solid wastes. Water reuse is the reclamation of treated
wastewater for a advantageous use. It is a "reuse" because the user does not get this
water from natural source like surface water or groundwater, it is a consequence of
human sanitation and of industrial processes (Metcalf & Eddy, 2003). By waste
components reduction from wastewater to an accepted level, treated wastewater can
01
be used safely for several purposes like agricultural, commercial, residential and
industrial uses.
The wastewater worth is becoming progressively understood in arid and semi-arid
regions and many countries are currently looking forward to improve and expand
effluent reuse applications. Effluent reuse also has become increasingly significant in
water resource management for both environmental and economic causes.
Researchers and scientists, aware of both benefits and risks, are assess it as one of the
choices for future generations water demands.
Effluent reuse has primarily a long history of implementation, by quantities,
agricultural irrigation is the largest consumer of reclaimed effluent and this is
anticipated to increase more, especially in developing countries, another major
consumer is for industry particularly for cooling and processing. A second category
of reuse is the indirect reuse. Highly reclaimed wastewater can be recharged to
groundwater to replenish aquifers. This is an indirect reuse where the reclaimed
water will be mixed with the groundwater (Metcalf & Eddy, 2003).
In Palestine, wastewater reuse projects are affected by political, financial, social,
institutional, and technical aspects. reclaimed wastewater reuse is still attached to the
political issues related Palestinian water rights, since Israel considers reused
wastewater as part of Palestinian total freshwater quota (Samhan, 2008).
2.3 Wastewater Characteristics
Treated wastewater quality is the physical, biological, and chemical characteristics of
a liquid flowing from a constituent. The constituent of wastewater can be listed as:
biochemical oxygen demand, total suspended solids and fats, oils and grease
(BODs, TSS, FOG)
pathogens (fecal coliform, viruses)
nutrients (nitrogen, phosphorus)
Other chemicals.
2.3.1 Types of BOD
High intensity wastewater is an influent which have BODs more than 300 mg/L;
00
and/or TSS more than 200 mg/L; and/or fats, oils, and grease FOG more than 50
mg/L.
I- Biochemical Oxygen Demand
Biochemical Oxygen Demand is the quantity of dissolved oxygen consumed by
microorganisms during the microbial and chemical oxidation of the constituents
contained in a wastewater sample during an incubation period at a given
temperature. The biochemical oxygen demand represents the oxygen utilized
during the oxidation of both carbon and nitrogenous composite.
II- Biochemical Oxygen Demand (BOD5)
Biochemical Oxygen Demand-5days is the amount of dissolved oxygen consumed
by microorganisms during the breakdown of organic matter in a wastewater
sample during five days incubation period and measured in mg/L at 20°C. It is
used as a means to show the amount of organic matter existing in the sample.
III- Chemical Oxygen Demand (COD)
Chemical Oxygen Demand is a measure of the quantity of organic matter
oxidized by a strong chemical oxidant. COD is used to measure organic
matter in industrial, commercial and municipal effluent that could carry
composite toxic to biologic life where the BOD5 test wouldn‟t work. The
COD test can generally be done within 150 minutes and the COD levels is
always greater than levels of BOD5 for the same wastewater sample.
In most cases, the BOD5 concentration can be anticipated when the COD/BOD5
relationship is known for a specific facility and the COD concentration of a
effluent can be measured.
2.3.2 Types of microbiological
I- Pathogens
The most crucial constituent, in terms of what must be eliminated from
effluent, is pathogens. Pathogens are organisms that cause diseases such as
viruses, protozoa, parasites, and bacteria. Pathogens could be found in any
type of wastewater. Any human or environment contact with this water results
02
in potential risk. Because of their ability in spreading disease, pathogens in
wastewater make reclamation a public health concern.
II- Fecal Coliforms (FC)
Several of the organisms found in effluent can cause disease while others are
harmless. It is almost impossible to identify all the pathogenic
microorganisms in effluent .Fecal coliform bacteria, which is usually exist in
digestive systems of warm blooded animals including human being, is used to
indicate either fecal contamination from sewage or the level of disinfection
generally measured as number of colonies/100mL or Most Probable Number
(MPN) .It is the most popular test for pathogens because it is a comparatively
simple and low-priced test.
2.4 Treatment Methods
Methods of reclamation in which the implementation of physical forces dominate are
known as operations. Methods of treatment in which the level of pollutants is done
by chemical or biological reactions are known as processes. Nowadays, operations
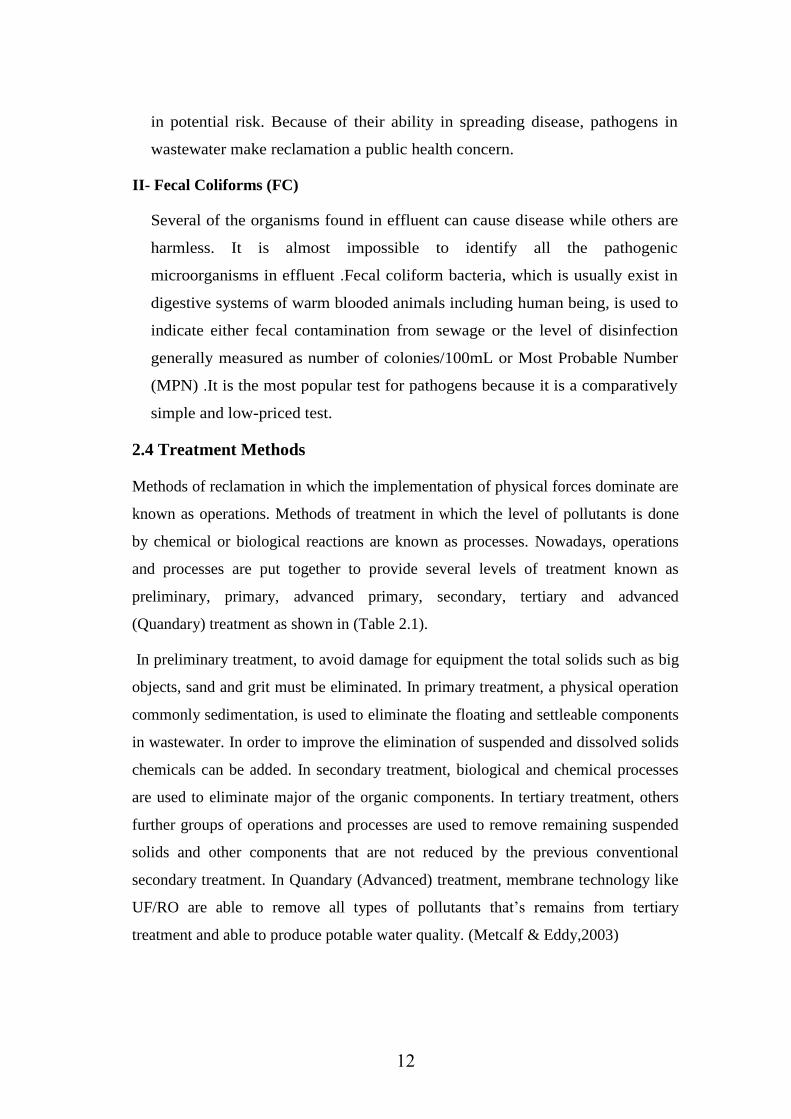
and processes are put together to provide several levels of treatment known as
preliminary, primary, advanced primary, secondary, tertiary and advanced
(Quandary) treatment as shown in (Table 2.1).
In preliminary treatment, to avoid damage for equipment the total solids such as big
objects, sand and grit must be eliminated. In primary treatment, a physical operation
commonly sedimentation, is used to eliminate the floating and settleable components
in wastewater. In order to improve the elimination of suspended and dissolved solids
chemicals can be added. In secondary treatment, biological and chemical processes
are used to eliminate major of the organic components. In tertiary treatment, others
further groups of operations and processes are used to remove remaining suspended
solids and other components that are not reduced by the previous conventional
secondary treatment. In Quandary (Advanced) treatment, membrane technology like
UF/RO are able to remove all types of pollutants that‟s remains from tertiary
treatment and able to produce potable water quality. (Metcalf & Eddy,2003)
03
Table (2.1): Levels of wastewater treatments
Treatment Level Description
Preliminary Removal of wastewater constituent such as rags, grits, and grace
which may cause problems with the treatment operations.
Primary Removal of part of the suspended solids and organic matters
Advanced
Primary
Increase the portion of elimination of suspended solids and
organic matters by chemical addition or filtration.
Secondary
Elimination of biodegradable organic matter, dissolved or
suspended solids
Secondary with
nutrient
removal
Elimination of biodegradable organics, suspended solids, and
nutrients such as nitrogen, phosphorus, or both.
Tertiary
Elimination of residual suspended solids and nutrient by granular
medium filtration or micro screens. Also, it may contain
disinfection.
Quaternary
(Advanced)
Removal of all types of pollutants and contaminants in water
using membrane technology which is producing a quality
comparable to drinking water
In order to reuse effluent, it is vital to treat it to meet specific quality standard for the
specific needs and to insure the public safety. Wastewater reclamation processes can
be categorized into the following three:
I. Physical process: Include processes where no major chemical or biological
changes are occurred and physical phenomena are employed to treat the
wastewater such as:
04
coarse screening process to remove larger particles, sedimentation process
which is holding wastewater for certain period of time to settle solids by gravity
and the greases or oils will flow and will be skimmed, adsorption process that
uses activated carbon to remove organic and ion exchange process that uses to
exchange certain ions for others, filtration process which is allow water to pass
throw filters voids and the blocks solids and finally equalization process which
is hold and mix widely varying amounts of wastewater and gradually release
them to eliminating shocks to the treatment plant and to make wastewater more
uniform
II. Chemical process: There is a lot of chemical process that is used in effluent
reclamation operations such as: Neutralization process which is comprise of the
adding acid or base to adjust pH levels to reach neutrality, Coagulation process
which is comprise of addition chemical through a chemical reaction, forms a
component which is impossible to solve and that make it easy to remove from
the wastewater.
III. Biological process: Which uses bacteria or other organisms in the biochemical
disintegration of effluent to stabilize components. More microorganisms, or
sludges, are created and a part of the pollutants is transferred to carbon dioxide,
water and other component. In general, according to availability of dissolved
oxygen biological treatment methods can be split into aerobic and anaerobic
methods.
The purpose of wastewater treatment is generally to remove from the wastewater
enough pollutants and solids (organic and inorganic) in order to make the treated
wastewater suitable for non-portable uses or even for discharging in ecosystem and
the removed solid can be collected as sludge. Final treatment may also be necessary
to rule odors, to retard biological activity, and demolish pathogenic organisms.
2.5 Quaternary (Advanced) treatment using membrane processes
2.5.1 Introduction
The level of treatment supplied to municipal effluent will mostly be according to
the needed standards for reclaimed wastewater set by the local or international
05
regulatory organizations when the wastewater is to be reused for different purposes,
or to be discharged into ecosystem. So, several treatment facilities provide the
tertiary-treated effluent with quaternary treatment using membrane processes to
produce an effluent appropriate for all kind of water reuse application.
Membrane technology uses a semipermeable membrane to separate of suspended,
dissolved solids from water. It has been applied for considerable years in brackish
and seawaters desalination and recently was adopted in the wastewater treatment
field.
Membrane technologies such as micro, ultra, nanofiltration, and RO are gaining
more attention, receiving special recognition as alternates to conventional wastewater
treatment and increasing the treated wastewater reuse applications.
There has been a rapid growth in the using of reverse osmosis (RO) in purification of
wastewater. Nowadays, there are a lot of large-scale municipal wastewater plants in
the world in operation or under construction. Comparing to others technologies, the
main motivation for this is the low energy consumption of RO and the high rate of
pollutant and contaminant removal. Meanwhile, the most important aspect for the
RO wastewater treatment system design is to use a proper pretreatment method such
as ultrafiltration (UF) or conventional pretreatment to remove suspended solids in
order to minimize membrane fouling to extend membrane life.
2.5.2 Pre-treatment for Reverse osmosis
Traditional wastewater treatment is often comprised of a primary settling phase,
followed by biological treatment and reclamation of the biological material in a
secondary settling phase. After the secondary settling phase. Wastewater effluent is
usually rich in organic carbon, phosphorus and nitrogen. Combined with high water
temperatures, this can lead to bio fouling on the reversed osmosis (RO) membranes
(Shang, et al. 2011).
Nowadays pretreatment stage is the most important issue in the implementation of
RO based desalination technology. Undesirable Fouling of the RO membranes in the
plant could lead to damage the membranes and reduce its life also frequently
cleaning process could damage the membranes and should be done as little as
possible.
06
Sand filter filtration is conventionally applied as pretreatment process for all kind of
reverse osmosis operation. however, recently microfiltration (MF) or ultrafiltration
(UF) with polymeric membranes are used as pretreatment for RO to remove these
substances from the WWTP effluent which called as dual membrane process.
I. Filtration with sand filter
Sand media filtration has been used since long time to treat water and wastewater.
Filtration is defined as an interaction among solute particles and a filtering
component , contaminants particles are separated from the solution when they
become tied to the media or to already caught particles, using of sand filtration is
popular for potable water and wastewater treatment.
AWWA, 2001, Torrens, 2009, Anderson,1985 and Woelkers, 2006 reported that the
effective selection of a filter media as sand filter to produce adequate required
contaminant elimination performance be conditional on the appropriate selection of
the filters depth, type of sand, sand size distribution, quality of influent and effluent
water, the filtration rate, and dosing system and stopping period duration, all
influenced the performance and treatment efficiency of the filters.
Granular media with too coarse reduce the retention time to a degree that sufficient
biological disintegration is not impossible to achieve. Coarser media have larger pore
opening that have high flux rates but let larger suspended particles passes. While,
granular media with too fine media lead to early filter clogging which will reduce the
quantity of water that may be passed. A very fine sand, or other fine material filter
has tiny pore opening with slow flux rates and removes out smaller TSS particles
(Urbonas, 2003).
Comprehensive filtration performance is controlled and affected by many aspects
such as the required treatment rate, the influent water quality and the physical
characteristics of the used material (type, depth, size distribution, and hydraulic
loading rate)
Generally, filter performance is evaluated by the following parameters: the effluent
of water quality (turbidity, BOD, SS, TDS), water production volume and head-loss
(backwash time or material replacement if no backwash is used). (Clark, 2007).
07
II. Microfiltration or Ultrafiltration process
The MF and UF membrane equipment were tested in a system for long operation as a
pretreatment substitutional to sand filtration for RO plants. Both MF and UF
installations, shows a good potential for a dependable long operation. This proof that
MF/UF application to RO pretreatment in better choice for future plants.
The conventional pretreatment for RO plants based on sand filters offers good results
for the low contaminated effluent. However, the conventional pretreatment is known
as rather cumbersome one which is cause the variability of the filtrate quality,
causing the membrane fouling. Using MF and UF membranes as an alternative for
conventional RO pretreatment could save the large area of the sand filters and the
chemicals used in pretreatment. On other hand using MF and UF can offer better
effluent quality to the RO installation that should reduce biological fouling, extend
lifetime and enhance performance of the RO membranes ) Feigin et al., 2012)
2.5.3 Reverse osmosis
Reverse Osmosis (RO) is a process that employ semi-permeable spiral wound
membranes to remove and separate solute solids and other contaminants like
pyrogens, color, submicron colloidal matter, bacteria and viruses from solution
which is wastewater. Wastewater is transferred under high pressure across the semi
permeable membrane, where water penetrate the tiny small pores of the membrane
and wastewater desalinated to water called permeate water. The solids and
contaminant, which was rejected by membrane, are gathered and concentrated in the
reject stream and will be drained is called brine or concentrate water (Shannon et al.,
2010)
RO membranes usually are made of cellulose acetate, polyamides and other
polymers materials. The membrane consists of hollow fiber, spiral-wound usually
used for wastewater desalination, these membranes are semi-permeable and block the
solid ions while allow the water molecules penetrate. Generally, type of membrane
depends on the influent water quality and the operation parameters of the plant.
Membrane based seawater purification and wastewater reuse are exceedingly
considered as promising solutions to increase water supply and mitigate water
scarcity (Judd, et al., 2003)
08
I. Reverse osmosis for wastewater
There is a growing use of reverse osmosis (RO) in the wastewater purification.
Comparing with other techniques, the major motives for this technology are the low
energy consumption and the high percentage of pollutant elimination. The
dependability of the RO treatment plants is very high and improves with time which
gives researches and developers confidence of this technology.
RO treatment of wastewater beginning was in the late 1970s with small plants, like
Orange County Water region plant. The experience obtained from the many years of
operation of existing plants has been a fundamental factor to the growth and
augmentation of uses of this technology. Currently, numerous of mega-sized
wastewater RO based plant are now in operation or under construction all over the
world.
A standard conventional process for municipal wastewater composed of primary,
secondary and tertiary treatments. This treatment is not necessary enough in
reduction all contaminant and pollutant from wastewater to make it generally usable
for all kind of uses and without restrictions. So, membrane technology like RO can
complete the job and can offer quality by far better than conventional methods. But
when tertiary effluent from a conventional treatment method is pumped to a RO
system, it is popular to have all kinds of biofouling as colloidal, biological, scaling
and organic fouling.
The layer of biofouling will cover pores and block water flux across the membranes.
Early trials to use RO membranes in treating wastewater faced a quick fouling and
clogging problem which need cleaning frequently (every 3 days) and this leads to
shorten the life of membrane and increase the operation cost.
In the last decade, breakthrough happened in researches of using RO membrane in
wastewater treatment with high rates of operation stability, acceptable lifetime of
membrane with affordable cost. This work was mostly the result of experiment at the
water facility in Orange district, USA, and the plant in Bedok Singapore.
Reverse osmosis (RO) membranes have been demonstrated to notably minimize total
dissolved solids, organic pollutants, microorganisms, and other dissolved pollutants.
Experience from largescale commercial membrane wastewater reclamation plants
09
has shown that crucial design aspects must be followed to avoid quick membrane
fouling, and thus minimize elevated maintenance costs for system. Current best
applications contain the usage of other membrane-based technology as ultrafiltration
or microfiltration membranes to remove colloidal debris, maintain a chloramine
residual to avoid bio-growth, choose suitable anti-scaling chemicals, reduce RO
recovery percentages to prevent membrane scaling, and use membranes which
reduce biofouling. Select traditional polyamide and reduce fouling membranes have
been used successfully at plants such as the West Basin Wastewater treatment plant
in California or the Bedok and Kranji plants in Singapore. These large-scale plants
give the basis for implementation in even larger plants, and big contribution to the
water supply in water-scarce and arid countries.
A lot of researches have been carried out on the rejection of organic contaminants by
RO membranes, and these researches have specified some of characteristic linked
with contaminants rejection. (Sourirajan,1970 & Matsuura,1985) have assembled
rejection and flow data of cellulose acetate membranes for a lot of organic particles,
including many organic contaminants. They discovered that organic rejection can
very diverge from (0% to 100%) controlled by the physical aspects of the pollutant
(charge, size, polarity, etc.) and operating situation (Influent pH, system pressure,
etc.). In previous research, (Anderson, 1972) reviewed some of the aspects affecting
separation of various organics pollutant such as (acetone, urea, phenol, and
dichlorophenol) by cellulose acetate membranes. Separation of solids highly varied
for the different wastewater, and separation of ionizable organics that highly
dependent on degree of disconnection. No ionized matter was found to be highly
absorbed by the membranes and showed poor separation.
Duvel and Helfgott, 1975 also discovered organic pollutant elimination differ with
molecular size and dividing; they assumed organic rejection was also a function of
the matter's chance to form hydrogen bonds with the membrane (Duvel Jr& Helfgott,
T, 1975).
Edwards and Schubert, 1974 reported elimination results of herbicides and pesticides
with RO membranes. They discovered that herbicide separations were up to 51%.
They listed that that dissolved particles adsorption can happen on the cellulose
21
acetate membranes (Edwards, V. & Schubert, P, 1974). Fang and Chian, 1976
performed research on the elimination of multi polar organic matters with several
functional sets using cellulose acetate and various other kinds of membranes. This
research reviewed that the organic separation differs highly not only with dissolved
particles type but also with membrane type. Also, they reported high elimination
over 99% for various pesticides with cellulose acetate and a compound membrane;
Although, notable adsorption of the pesticides on the membranes was occurred.
(Shuckrow, 1981) as well reviewed cellulose acetate separation of various types of
organics, rejections were low to moderate (10% for methylene chloride, 73% for
acenaphthene) (Shuckrow, A. et al., 1981).
Many researches have made comparison between organic separation of cellulose
acetate and separation with other types of membranes, and a large number of these
have specified that aromatic polyamide and compounds membranes generally have
organic separation better than those of cellulose acetate membranes, (Kurihara, 1981)
reviewed various organic separation of the Toray compounds membrane (polyfuran),
generality separations were high, (97% for acetone) and (99% for phenol).
(Koyamal,1982 and Koyama ,1984) listed rejections results for various polar organic
dissolved particles (alcohols, phenols, carboxylic acids, amines, and ketones) and
several phenolic derivatives for a composite membrane. They discovered that the
major aspect influencing separation (molecular weight, molecular branching,
polarity, and degree of detachment for ionizable component). (Lynch, 1984) make
comparison between cellulose acetate and thin-film, compounds membrane a bonded
aromatic polyamide) rejections with a various of organic contaminants. The
composite membrane separation (more than 90% of the organics) and water flows
were extraordinarily better than the cellulose acetate membrane; although, adsorption
of number of the organics on the membranes was listed.
(Light, 1981) indicated dilute solutions of polynuclear aromatic hydrocarbons
(PAHs), aromatic amines, and nitrosamines and found separations of these
components was more than 99% for polyamide membranes. (Rickabaugh,1986) also
studied polyamide membrane separations of chlorinated hydrocarbons more than
95% which is better than cellulose acetate Membranes separation.
20
Reverse osmosis is best solution for pollutant removal from effluent of biological or
other conventional municipal reclamation that was failed to remove. RO is able to
remove dissolved solids which can‟t be eliminated by conventional municipal
treatment operation. Besides, RO membranes can help in reduce microorganism,
odors, colors, and nitrate levels. Although, comprehensive pretreatment and
periodical cleaning are usually necessary to preserve acceptable membrane water
flows.
(Tsuge and Mori, 1977) demonstrated that tubular RO membranes with a suitable
pretreatment system can eliminated inorganics and organics pollutants from
municipal treatment plants wastewater and made effluent meets potable water
standards.
(Stafstrom ,1982) reviewed over a three years municipal wastewater reclamation
using tubular cellulose acetate RO membranes. TDS removal was 81%, and TOC
removal was 94%, making the treated water appropriate for reuse. Although,
pretreatment process was essential to insure good water flow rates.
(Richardson and Argo, 1977, Allen and Elser, 1979, Argo and Montes, 1979,
Nussbaum and Argo, 1984), and Reinhard, 1986) have reviewed water factory
municipal wastewater reclamation in Orange country, USA which is large scale
plant. The plant influent was from of effluent of secondary treatment, and the process
was consisting of a various of treatment processes, including RO membranes
(various different types) with ability to produce five MGD of highly treated effluent.
The process minimizes pollutants to levels that allowed effluent to be recharged to
groundwater safely to replenish aquifer and to make barrier for seawater intrusion.
(Suzuki and Minami,1991) listed researches on using various RO membranes to treat
secondary treated wastewater that contain several salts and dissolved organic
materials. TDS removal was up to 99% and TOC removal was up to 90% were
discovered, and fecal coliform collection removal was more than 99.9%. Decreasing
water flow over time were noticed but could be partially reinstate by frequent
cleaning.
Membrane based technology have become attractive solution to take the place of
conventional wastewater treatment because of low costs, high efficiencies and low
22
chemical consumption. Depending on water, composition and type of pollutants need
to be removed, Ultra-filtration, Nano filtration or reverse osmosis techniques could
be adapted to wastewater treatment to improve quality of wastewater and produce
effluents for agricultural, industrial and domestic applications.
2.6 Potential of Wastewater Reuse Applications
Usage of reclaimed wastewater depends on various aspects; supply, demand,
treatment needs, storing and distributing constructions. Besides, effluent reuse is
oftentimes linked with ecological and health hazards concerns. Consequently, the
acceptance of replacement other water resources for irrigation is extremely depends
on acceptance of the health hazards and ecological impacts involved. In the
following, the main kinds of reuse will be listed:
1- Agricultural Use
The need for amount of treated wastewater for irrigation differ monthly through the
year due to climatic condition. Also, seasonal variation such as rainfall amount,
temperature and other factors such as kind of crop, plant growth phase, and irrigation
system.
The provider of treated effluent should take in consideration these seasonal
requirements and the variation of the influent quality, to meet the demands for
agriculture. To evaluate the feasibility of reuse, the treated wastewater provider must
be able to rationally assess agriculture demand and influent supplies.
The main concern in using treated wastewater in agriculture are salinity, sodium,
trace elements, excessive and chlorine residual. Sensitivity is basically a function of
an individual tolerance for plant to component encountered in the roots zone or
deposited on the soil. Treated wastewater more likely to have more concentrations of
these component than the natural water sources. The kinds and component
concentricity in treated effluent depend on the water supply, the wastewater flow if it
is domestic or industrial, amount and composition of infiltration in the sewage
system, the effluent reclamation processes, and the kinds of storing constructions. In
major cases, the treated wastewater has acceptable quality if it is from municipal
sources.
23
2- Groundwater Recharge
The soil ability for filtration and decomposition organic material make the
groundwater recharging one of the best reclaimed wastewater reuses options, thus
offering extra treating for the effluent in situ and further treating dependability to the
comprehensive effluent management system.
The treatment attained in the subsurface environment may cancel the need for
sophisticated wastewater treatment plants, depending on recharge technique, hydro
geological conditions, user‟s needs, and other aspects. In some cases, the treated
wastewater and groundwater mixed and can„t be distinguished. Groundwater
recharge helps provide identity losing between treated wastewater and groundwater.
Thus, this can widen the variety of using the reclaimed wastewater and make the
reuse more psychological accepted. Generally, the purposes of groundwater recharge
using reclaimed water include:
Prevent seawater intrusion in coastal aquifers.
Provide advanced treatment for future reuse.
Replenish groundwater aquifer for potable or non-potable uses.
Offers storage of reclaimed water.
However, there are clear advantages linked with groundwater recharging, there are
potential disadvantages to consider (Oaksford, 1985):
Covering large land zones for operation and maintenance.
Energy for well recharging may be expensive.
Recharge may rise the probability of contaminating aquifer.
May lead to liability and other legal problems.
Slow movement of groundwater can‟t meet the sudden increase of demand.
3- Industrial Reuse
Industrial reuse represents an important possible market for reclaimed water in all
over the world. Reclaimed water is perfect for many industries where processes do
not need potable water quality. Treated wastewater for industrial reuse may be obtain
from in plant recycling of industrial wastewaters or municipal water reclamation
plant. Recycling within an industrial plant is usually a fundamental part of the
industrial process and must be developed on individual basis. Industries, reclaim and
24
reuse their effluent either to maintain water or to meet or avoid strict regulatory
standards for wastewater disposals.
2.7 Wastewater Reuse in Agriculture
Like arid and semi-arid regions, use of reclaimed effluent in agriculture is gaining
more interest in evolving strategies for planning of Palestinian water resources.
Wastewater effluent is the most readily available to offers a partial resolution to the
water scarcity problem, the agriculture strip is the second main user of groundwater
in the Gaza Strip.
Agricultural irrigation will play a remarkable part in the sustainability of crop
production to feed the future generations. Reclaimed wastewater is progressively
used for irrigating orchards and fodder crops in Gaza Strip and applied successfully
in the neighboring countries. Future of reclaimed effluent reuse sound to be
promising in the Gaza Strip.
The anticipated quantities of treated effluent to be used for irrigated agriculture will
gradually growth on the next two decades saving more than 50% of groundwater
required for agriculture. However, the use of treated effluent for agriculture is source
of main anxiety because of the possible sanitary and ecological risks, the bad quality
of wastewater may pose fundamental health hazards for the farmers and consumers
of those agricultural crops. The WHO has been working to update the guideline
standards for reclaimed wastewater reuse in agriculture.
However, reuse of reclaimed, high quality treated effluent for agricultural irrigation
is important not only to protects public health but also consider a best preservation
plan to reduce the consumption of restricted potable water for agriculture and to
minimize fertilizer costs in the agricultural strip of low income territories (Zurita &
White, 2014).
AHT GROUP AG, 2009, reported that wastewater reuse for agricultural irrigation
involves three main challenges:
1. Quality requirements: To limit all types of negative effects on human sanitary and
the environment. This would require suitable treatment of water to be reused and
the implementation of secure irrigation techniques.
25
2. Seasonal demand: Wastewater is generated all the time, but irrigation is only
required seasonally, consequently proper storage facilities would be needed.
3 .Location of production: The greatest amount of wastewater is produced in large
cities, while agricultural areas are generally located in remote rural districts. As
a result, long distance transport networks and pumping would be necessary.
Also, reclaimed wastewater reuse faces technical, legal, institutional and
socioeconomic challenges which can be defeated through participatory approaches in
which farmers show their perspective and worries for successful application of
reclaimed wastewater reuse schemes. (Mizyed, 2013).
Until recent times, it is reported that farmworkers in Gaza are disagreed the reuse of
treated effluent, but now a lot of recent studies, suggest that the farmers in Gaza are
willing to use reclaimed effluent for irrigating agriculture if there is high-quality
wastewater treatment.
According to (NJDEP, 2005), the two mostly common types of water irrigation are:
• Restricted Irrigation
Use of bad quality effluents in restricted areas and for particular crops, limitations
are decided according to the type of soil, the closeness of the irrigated area to a
groundwater aquifer, irrigation techniques, crop harvesting method, and fertilizer
usage rate. It is easy and cheap so farmers must be trained to handle the bad-quality
effluent.
Unrestricted Irrigation
Use of high quality effluents, as an alternative of potable water, to irrigate all crops
(including vegetables) on all types of soil, without restrictions and without exposing
human health or environment to risk.
2.7.1 Impact of Wastewater Reuse in Agriculture
Using reclaimed effluent in agriculture is considered as a preferable practice for
environment than dispose it in the surface water or groundwater. Consequently,
mismanagement of effluent irrigation could lead to problems to both of environment
and human being health. Given these risk and benefits, countries is always looking
26
forward to enhance treated wastewater reuse in agriculture by minimize the risks for
public health and ecosystem, and maximize the benefits.
I. Benefits of effluent reuse in agriculture
Proper planning, executing and managing for treated effluent irrigation system is
very important to get various advantages for agriculture, water resource and
environment aspects.
Agricultural benefits
Agricultural benefits may include: more dependable and less irrigation water
cost, more crop yield and better in quality because nutrients in wastewater,
more urban agricultural production which contribute in better food security,
more employment for generations, and increase income for urban farmers
(Jimenez et al., 2010).
Water resources management benefits
Water resources management may include: extra drought resistant water
source, with lower cost than desalination or expanding and enhancing existing
resources, additional local source of water, implication of effluent in the wider
water resources management, and more integrated water resources
management (Jimenez et al., 2010).
Environmental benefits
Environmental benefits may include: avoiding surface water contamination that
could happen if effluent was not used but discharged into surface water, and
avoiding a lot of environmental contaminant problems, such as dissolved
oxygen reduction, foams, and fish death. Preservation and the rationalistic
usage of freshwater resources, particularly in waterless and water-poor zones,
freshwater for domestic‟s demand, wastewater for agricultural use; minimize
the needs for chemical fertilizers, which associated with lowering in energy
expenses and industrial contamination elsewhere; soil preservation and land
erosion preventing; and desert reclamation, through irrigation and fertilization
of tree belts (Mara & Cairncross, 1989).
27
II. Risks of effluent reuse in agriculture
Microbial risks to public health:
In areas with low and medium income, the biggest risks to public health is
from pathogens which is carried in municipal effluent, like bacteria, viruses,
protozoa and helminths. Epidemiological researches performed over the
preceding forty years have related the employment of non-treated or partially
treated effluent without any control for eatable crop irrigation to the spread of
diseases to farmworkers and crop consumers. Real dangers of using non-
treated effluent for agriculture include the increased spread of helminths illness
as ascariasis and hookworm to farmworkers and eaters of raw vegetables, along
with bacterial and viral illnesses as diarrhea, typhoid, and cholera. (Shuval &
Mara, 1986).
Chemical risks to public health:
Chemical risks are more dangerous in developed countries where industrial
effluents could be disposed to sewage system and pollute municipal effluent.
Chemical hazards to public health may be resulted by heavy metals such as
cadmium, lead, and mercury; and by other organic component such as
insecticide. Besides, there is also concerns from the existence of anthropogenic
chemical compounds that is hard to figure its effects on public health in the
long-term period such as pharmaceuticals, hormones, antibiotics, and personal
care products (Bhandari et al., 2009).
Risks to crops
The inappropriate effluent quality can reduce crop yields which is major
concern. for example, if the effluent is very saline and have large amount of
industrial toxicant, or other contaminants. Danger to crops health are decrease
if there is small amount of industrial wastes in the effluents, generally, five
parameters must be noticed during the irrigation period: EC, SAR, B, TN, and
pH (Westcot D.W., 1997).
28
Environmental risks
Soil and groundwater contamination are the major danger of utilizing
reclaimed effluent in irrigation; the pathogenically contamination of
groundwater is a minimal danger because soils will reject microorganisms in
the top layers of the soil except in some rare hydro-geological cases.
Chemical hazards include, nitrates in groundwater from effluent irrigation, soil and
aquifers salinity, and changing in soil structure. Setting and controlling the efficient
industrial wastewater pretreatment is the very important to control the various types
of chemical risks that may affect human being and environment (BGS, 2001).
III. Economics of Reclaimed Wastewater Irrigation
The main important factor to take when reviewing the feasibility of reusing treated
effluent is the economic and financial viability. The cost effectiveness of a reuse
project depends on the amount of treated water used; where the more water used, the
more the cost-effective the project (Urkiaga, 2008).
The evaluation process proposes that cost benefit analysis must merge
socioeconomic, health and environmental effects of effluent reuse in agriculture, for
appropriate evaluation. When wastewater reuse assessment projects, the first method
is to group all benefits into two categories, direct and indirect benefits.
For the first, increased crop production, savings on fertilizer costs and on water
supply beside offering job opportunities. For the second they are minimized
environmental damages, controlled soil erosion and protection of groundwater which
reduce waste and improves water preservation (Al-Dadah, 2008).
Water reclamation and reuse is technically feasible but oftentimes it is not a
inexpensive choice. The infrastructural requirements are generally high, in particular
because of the requirement to build and/or adjust the distribution system (Bixio,
2008).
2.7.2 Public Acceptance
One of the main crucial procedure in any reuse scheme is protecting the public
health, particularly that of users and consumers. Consequently, it is main significant
to remove any infectious factors or pathogenic microorganisms that may be carried
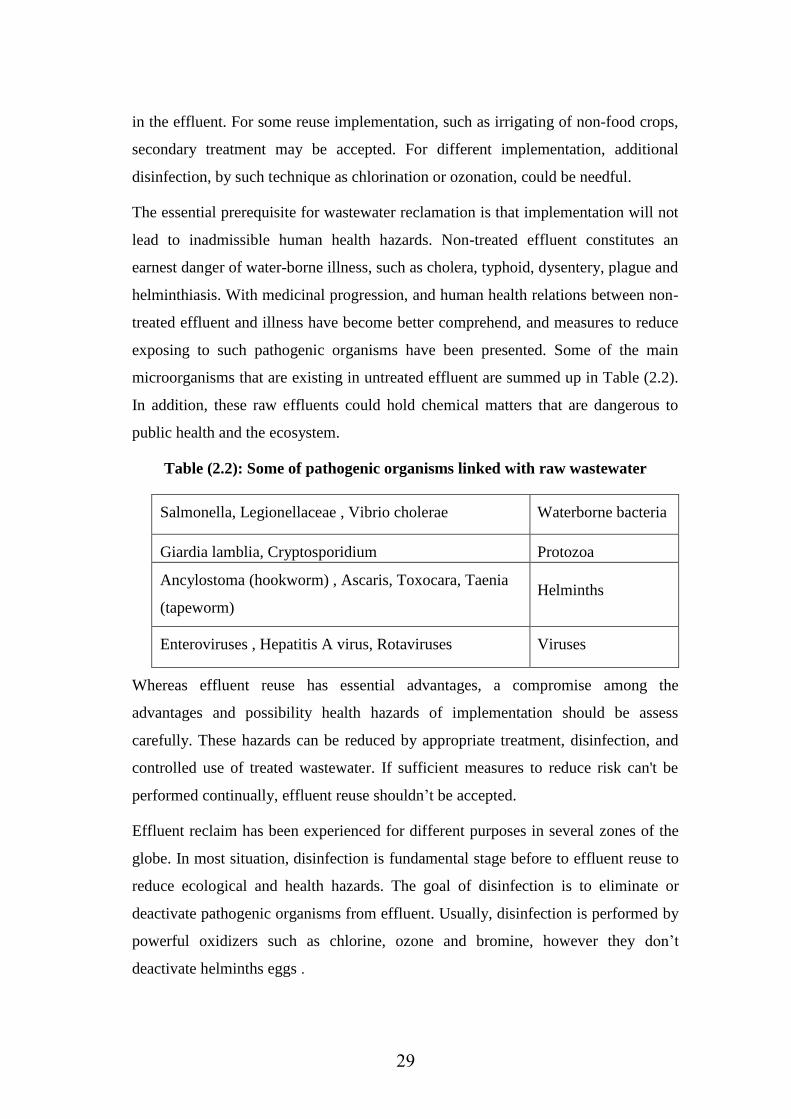
29
in the effluent. For some reuse implementation, such as irrigating of non-food crops,
secondary treatment may be accepted. For different implementation, additional
disinfection, by such technique as chlorination or ozonation, could be needful.
The essential prerequisite for wastewater reclamation is that implementation will not
lead to inadmissible human health hazards. Non-treated effluent constitutes an
earnest danger of water-borne illness, such as cholera, typhoid, dysentery, plague and
helminthiasis. With medicinal progression, and human health relations between non-
treated effluent and illness have become better comprehend, and measures to reduce
exposing to such pathogenic organisms have been presented. Some of the main
microorganisms that are existing in untreated effluent are summed up in Table (2.2).
In addition, these raw effluents could hold chemical matters that are dangerous to
public health and the ecosystem.
Table (2.2): Some of pathogenic organisms linked with raw wastewater
Waterborne bacteria Salmonella, Legionellaceae , Vibrio cholerae
Protozoa Giardia lamblia, Cryptosporidium
Helminths Ancylostoma (hookworm) , Ascaris, Toxocara, Taenia
(tapeworm)
Viruses Enteroviruses , Hepatitis A virus, Rotaviruses
Whereas effluent reuse has essential advantages, a compromise among the
advantages and possibility health hazards of implementation should be assess
carefully. These hazards can be reduced by appropriate treatment, disinfection, and
controlled use of treated wastewater. If sufficient measures to reduce risk can't be
performed continually, effluent reuse shouldn‟t be accepted.
Effluent reclaim has been experienced for different purposes in several zones of the
globe. In most situation, disinfection is fundamental stage before to effluent reuse to
reduce ecological and health hazards. The goal of disinfection is to eliminate or
deactivate pathogenic organisms from effluent. Usually, disinfection is performed by
powerful oxidizers such as chlorine, ozone and bromine, however they don‟t
deactivate helminths eggs .
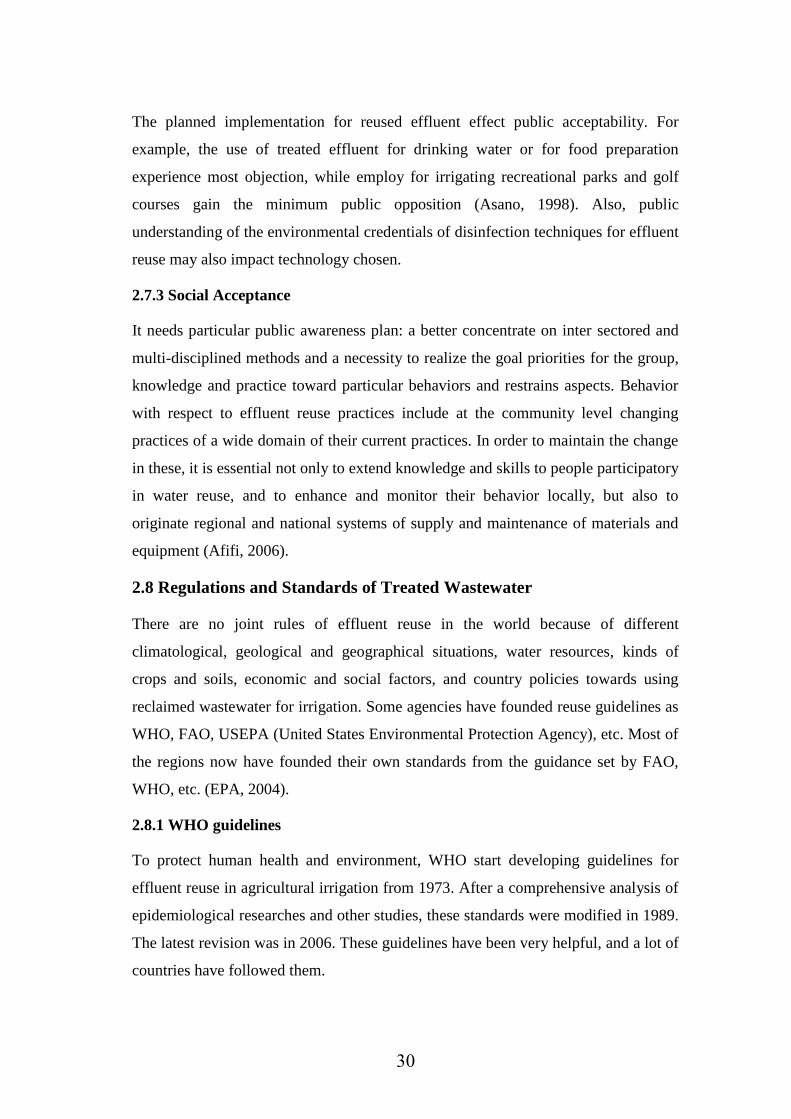
31
The planned implementation for reused effluent effect public acceptability. For
example, the use of treated effluent for drinking water or for food preparation
experience most objection, while employ for irrigating recreational parks and golf
courses gain the minimum public opposition (Asano, 1998). Also, public
understanding of the environmental credentials of disinfection techniques for effluent
reuse may also impact technology chosen.
2.7.3 Social Acceptance
It needs particular public awareness plan: a better concentrate on inter sectored and
multi-disciplined methods and a necessity to realize the goal priorities for the group,
knowledge and practice toward particular behaviors and restrains aspects. Behavior
with respect to effluent reuse practices include at the community level changing
practices of a wide domain of their current practices. In order to maintain the change
in these, it is essential not only to extend knowledge and skills to people participatory
in water reuse, and to enhance and monitor their behavior locally, but also to
originate regional and national systems of supply and maintenance of materials and
equipment (Afifi, 2006).
2.8 Regulations and Standards of Treated Wastewater
There are no joint rules of effluent reuse in the world because of different
climatological, geological and geographical situations, water resources, kinds of
crops and soils, economic and social factors, and country policies towards using
reclaimed wastewater for irrigation. Some agencies have founded reuse guidelines as
WHO, FAO, USEPA (United States Environmental Protection Agency), etc. Most of
the regions now have founded their own standards from the guidance set by FAO,
WHO, etc. (EPA, 2004).
2.8.1 WHO guidelines
To protect human health and environment, WHO start developing guidelines for
effluent reuse in agricultural irrigation from 1973. After a comprehensive analysis of
epidemiological researches and other studies, these standards were modified in 1989.
The latest revision was in 2006. These guidelines have been very helpful, and a lot of
countries have followed them.
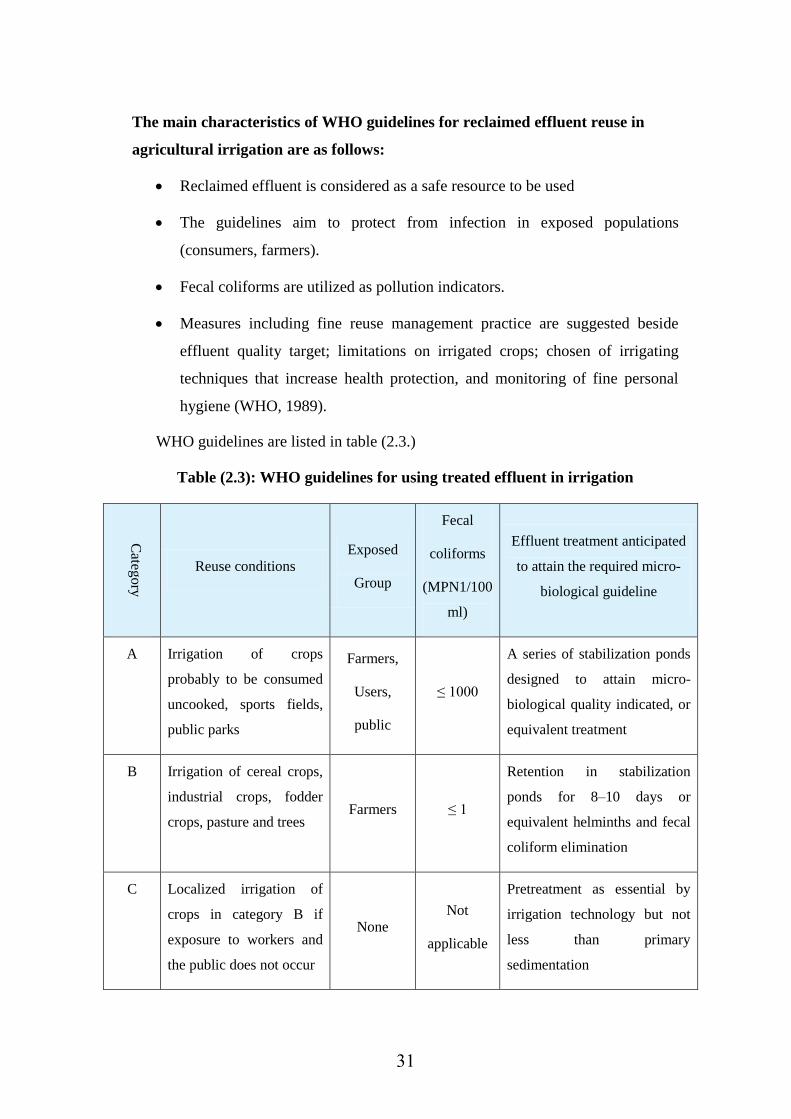
30
The main characteristics of WHO guidelines for reclaimed effluent reuse in
agricultural irrigation are as follows:
Reclaimed effluent is considered as a safe resource to be used
The guidelines aim to protect from infection in exposed populations
(consumers, farmers).
Fecal coliforms are utilized as pollution indicators.
Measures including fine reuse management practice are suggested beside
effluent quality target; limitations on irrigated crops; chosen of irrigating
techniques that increase health protection, and monitoring of fine personal
hygiene (WHO, 1989).
WHO guidelines are listed in table (2.3.)
Table (2.3): WHO guidelines for using treated effluent in irrigation
Categ
ory
Reuse conditions Exposed
Group
Fecal
coliforms
(MPN1/100
ml)
Effluent treatment anticipated
to attain the required micro-
biological guideline
A Irrigation of crops
probably to be consumed
uncooked, sports fields,
public parks
Farmers,
Users,
public
≤ 1000
A series of stabilization ponds
designed to attain micro-
biological quality indicated, or
equivalent treatment
B Irrigation of cereal crops,
industrial crops, fodder
crops, pasture and trees Farmers ≤ 1
Retention in stabilization
ponds for 8–10 days or
equivalent helminths and fecal
coliform elimination
C Localized irrigation of
crops in category B if
exposure to workers and
the public does not occur
None Not
applicable
Pretreatment as essential by
irrigation technology but not
less than primary
sedimentation
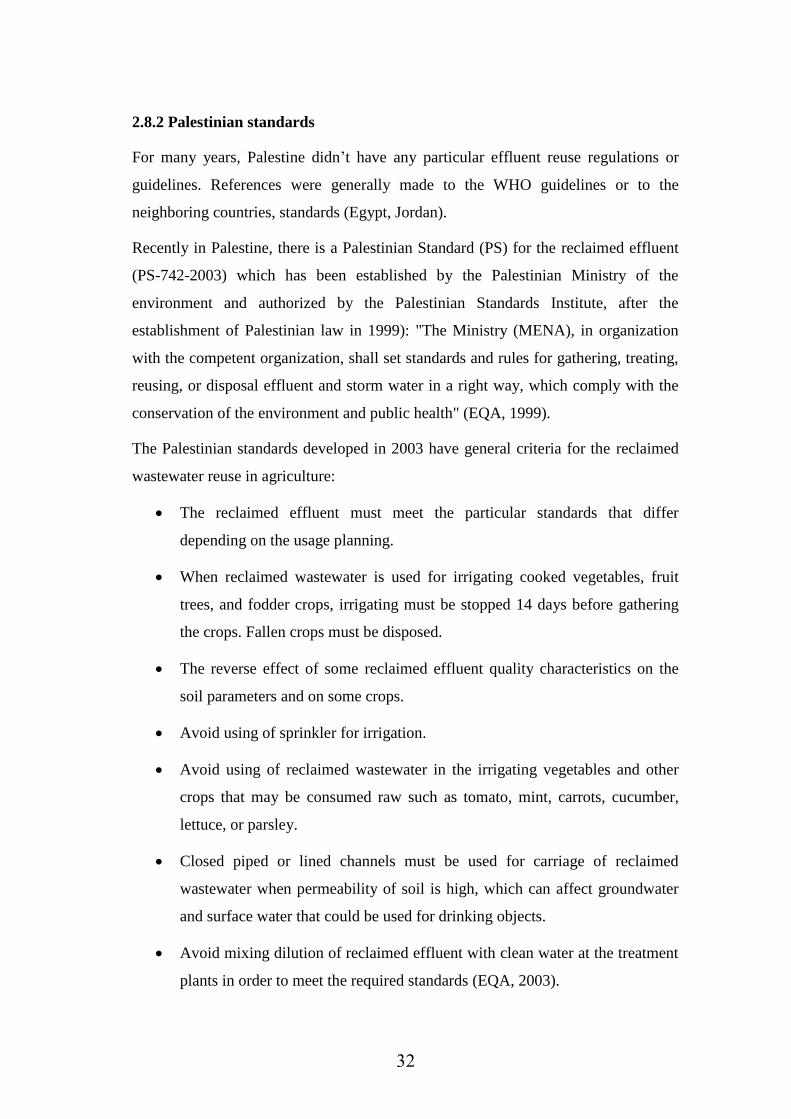
32
2.8.2 Palestinian standards
For many years, Palestine didn‟t have any particular effluent reuse regulations or
guidelines. References were generally made to the WHO guidelines or to the
neighboring countries, standards (Egypt, Jordan).
Recently in Palestine, there is a Palestinian Standard (PS) for the reclaimed effluent
(PS-742-2003) which has been established by the Palestinian Ministry of the
environment and authorized by the Palestinian Standards Institute, after the
establishment of Palestinian law in 1999): "The Ministry (MENA), in organization
with the competent organization, shall set standards and rules for gathering, treating,
reusing, or disposal effluent and storm water in a right way, which comply with the
conservation of the environment and public health" (EQA, 1999).
The Palestinian standards developed in 2003 have general criteria for the reclaimed
wastewater reuse in agriculture:
The reclaimed effluent must meet the particular standards that differ
depending on the usage planning.
When reclaimed wastewater is used for irrigating cooked vegetables, fruit
trees, and fodder crops, irrigating must be stopped 14 days before gathering
the crops. Fallen crops must be disposed.
The reverse effect of some reclaimed effluent quality characteristics on the
soil parameters and on some crops.
Avoid using of sprinkler for irrigation.
Avoid using of reclaimed wastewater in the irrigating vegetables and other
crops that may be consumed raw such as tomato, mint, carrots, cucumber,
lettuce, or parsley.
Closed piped or lined channels must be used for carriage of reclaimed
wastewater when permeability of soil is high, which can affect groundwater
and surface water that could be used for drinking objects.
Avoid mixing dilution of reclaimed effluent with clean water at the treatment
plants in order to meet the required standards (EQA, 2003).
33
Palestinian standards for effluent reuse have been adopted which set exacting and
complex requirements. In addition to many criteria and a multiple barrier approach to
health protection, the standards prohibit the use of effluent on crops eaten uncooked,
regardless of the extent of treatment.
Four classes of effluent quality are recognized (table 2.4), classified by BOD, TSS
and Fecal coliform concentrations. For each effluent class, a number of additional
barriers (table 2.5) are required for reuse, the number of barriers required (from a list
of eleven) depending on the type of crop (18 crop types are listed). For Class A
effluent, no additional barriers are required and Class D requires up to four barriers
depending on crop type. Vegetables are specifically excluded. Furthermore, limit
values are given for an additional 35 parameters for eight categories of reuse and
disposal.
Table (2.4): Classification of wastewater quality (PS 742/2003)
Class Quality BOD (mg/l) TSS (mg/l) Faecal coliform
(MPN1/100 ml)
A High 20 30 200
B Good 20 30 1,000
C Medium 40 50 1,000
D Low 60 90 1,000
Table (2.5): Recommended PSI effluent standards (PS742/ 2003)
Criteria Restricted Use1 Unrestricted Use2
BOD (Mg/l) 10-20 10-20
TSS (Mg/l) 15-20 15-20
Total-N (Mg/l) 10-15 10-15
F. coliforms Less than 200 Less than 1000
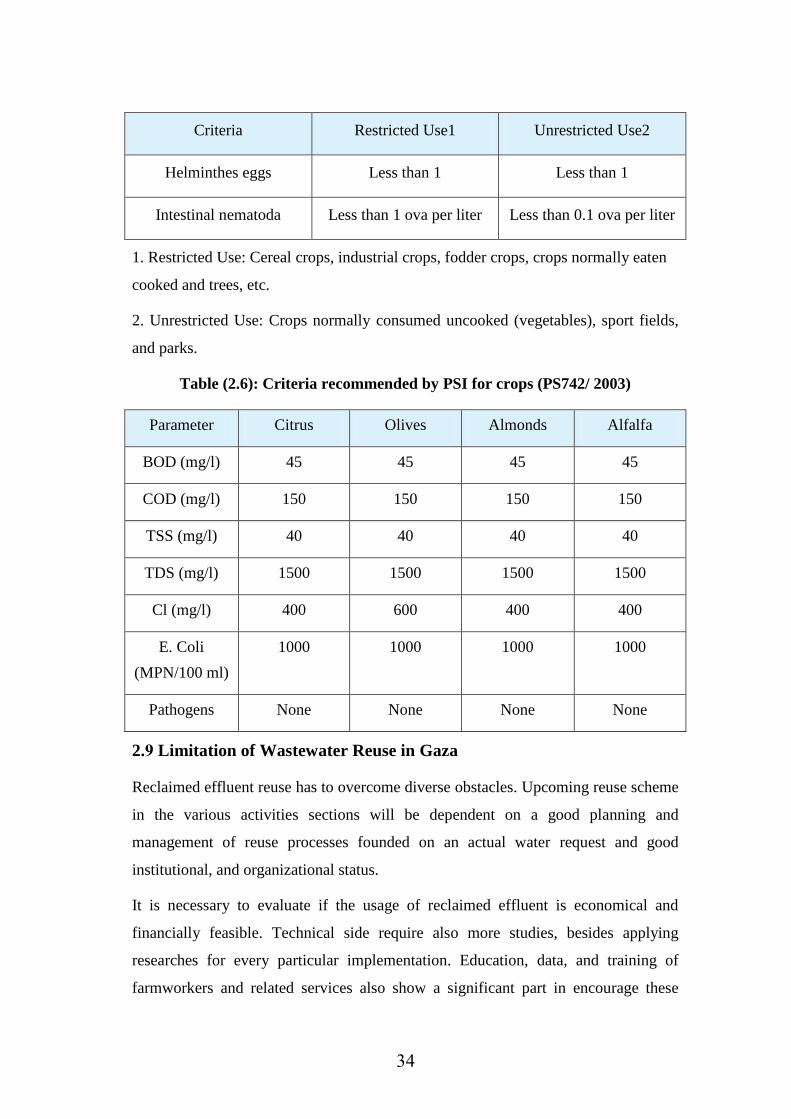
34
Criteria Restricted Use1 Unrestricted Use2
Helminthes eggs Less than 1 Less than 1
Intestinal nematoda Less than 1 ova per liter Less than 0.1 ova per liter
1. Restricted Use: Cereal crops, industrial crops, fodder crops, crops normally eaten
cooked and trees, etc.
2. Unrestricted Use: Crops normally consumed uncooked (vegetables), sport fields,
and parks.
Table (2.6): Criteria recommended by PSI for crops (PS742/ 2003)
Parameter Citrus Olives Almonds Alfalfa
BOD (mg/l) 45 45 45 45
COD (mg/l) 150 150 150 150
TSS (mg/l) 40 40 40 40
TDS (mg/l) 1500 1500 1500 1500
Cl (mg/l) 400 600 400 400
E. Coli
(MPN/100 ml)
1000 1000 1000 1000
Pathogens None None None None
2.9 Limitation of Wastewater Reuse in Gaza
Reclaimed effluent reuse has to overcome diverse obstacles. Upcoming reuse scheme
in the various activities sections will be dependent on a good planning and
management of reuse processes founded on an actual water request and good
institutional, and organizational status.
It is necessary to evaluate if the usage of reclaimed effluent is economical and
financially feasible. Technical side require also more studies, besides applying
researches for every particular implementation. Education, data, and training of
farmworkers and related services also show a significant part in encourage these
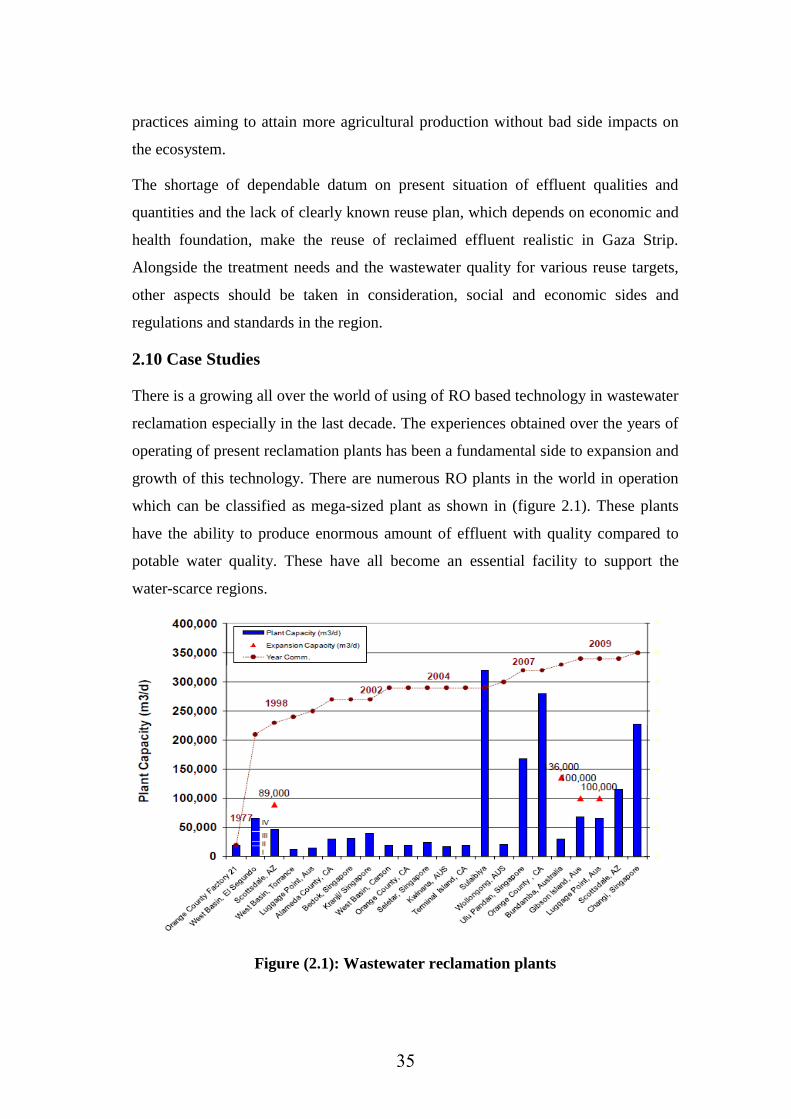
35
practices aiming to attain more agricultural production without bad side impacts on
the ecosystem.
The shortage of dependable datum on present situation of effluent qualities and
quantities and the lack of clearly known reuse plan, which depends on economic and
health foundation, make the reuse of reclaimed effluent realistic in Gaza Strip.
Alongside the treatment needs and the wastewater quality for various reuse targets,
other aspects should be taken in consideration, social and economic sides and
regulations and standards in the region.
2.10 Case Studies
There is a growing all over the world of using of RO based technology in wastewater
reclamation especially in the last decade. The experiences obtained over the years of
operating of present reclamation plants has been a fundamental side to expansion and
growth of this technology. There are numerous RO plants in the world in operation
which can be classified as mega-sized plant as shown in (figure 2.1). These plants
have the ability to produce enormous amount of effluent with quality compared to
potable water quality. These have all become an essential facility to support the
water-scarce regions.
Figure (2.1): Wastewater reclamation plants
36
2.10.1 Sulaibiya Wastewater Reclamation Plant in Kuwait
Sulaibiya Effluent Reclamation Plant, located in Kuwait, was commissioned in 2004
after two years and half of construction with total cost of ($422M), the Sulaibiya
effluent reclamation plant won global water awards as The Wastewater Project of the
Year in 2005 after short time of initiation. The plant is at the present time by far the
biggest treatment plant of its type in the globe to use membrane-based water
treatment technologies such as reverse osmosis (RO) and ultrafiltration (UF).
Currently, the capacity is to 375,000 m³/day and to reach the capacity of 600,000
m³/day.
The Sulaibiya plant consists of three processes; biological treatment, dual
membranes filtration (RO / UF) and sludge processing. Sulaibiya purify wastewater
to potable water quality for non-potable utilization such as agricultural, industrial and
aquifer recharging purposes. At full operation, the plant is anticipated to cover 26%
of Kuwait‟s gross water needs, which reduce the yearly demand from non-potable
sources from 140 MCM to 25 MCM (water technology, 2018).
2.10.2 Groundwater replenishment scheme in Orange County, USA
Orange Country Advanced Water Treatment, located in California USA, was opened
in 2004 and its effluent offers supplement sources of effluent to Orange County,
California for seawater intrusion barrier and for groundwater recharge. The facility
treats 320,000 m3/day of treated effluent to be expanded to reach capacity of 590,000
m3/day of product.
The treatment plant consists of three main treatment process; MF, RO and advanced
oxidation process (AOP) with UV light with hydrogen peroxide. The influent, which
is partially treated wastewater, is treated firstly using microfiltration unit.
Microfiltration processes remove tiny suspended components from the wastewater.
The wastewater is then purified through RO, which eliminate most of residual solids
and pollutants by penetrating the pumped water across membranes pores. Water
quality effluent after this process is almost distilled. Then the water is processed with
UV rays and hydrogen peroxide as a preventive measure. Merging UV rays and
hydrogen peroxide produces advanced oxidation reaction and reject any residual of
organic matters.
37
This multi-stage processes produces water with quality better than other conventional
water sources available to the Orange County area. The full-scale treatment plant
insure that removal of all contaminants can be possible to reach the drinking water
standard using an advanced treatment process consists of MF, RO, and AOP
treatment. After RO treatment, the product water is so low in salt & mineral content.
(Water technology, 2018).
2.10.3 Changi Water Reclamation Plant, Singapore
Changi Water Reclamation Plant (CWRP), located in Singapore, considered one of
the largest and most advanced wastewater treatment plant in the globe. It was opened
in June 2009 with a capacity to treat 800 m3/day of wastewater. The plant will be
extended to reach a capacity of 2400 m3/day. Effluent at the CWRP is purified by
rejection the solids and pollutants presented in the wastewater. Then the effluent
water is disposed to the ecosystem or conveyed to NEWater treatment plant for
advance treatment.
NEWater is the backbone of Singapore water sustainability plan and currently covers
one third of the total water country demand. At NEWater facilities, the treated
wastewater is treated using advanced dual membrane and ultraviolet to reach potable
water quality. The NEWater production operations use advanced dual membrane and
ultraviolet techniques as a post treatment for effluents from CWRP. Currently, there
are four NEWater facilities in Singapore. The latest and the largest one, Sembcorp
NEWater plant, was commissioned in May 2010 with a capacity of 50 MGD. (Water
technology, 2018).
2.10.4 Bundamba Advanced Water Treatment Plant
Bundamba Advanced Wastewater Treatment Plant (AWTP), located in Ipswich,
Australia, was built in two stages with total cost of $380m, construction of the plant
has started in September 2006 with capacity to treat 66,000 m3/day of treated water.
The plant became fully operational in June 2008.
Lamella pre-treatment clarifiers in Bundamba plant, with the area of 5,000m², have a
capacity to treat up to 100,000 m3/day of wastewater, consist of microfiltration and
reverse osmosis building, which have three core treatment processes, which is
microfiltration, reverse osmosis (RO), and advanced oxidation processes.
38
The microfiltration process involves passing the wastewater through a fiber
membrane with 0.014 microns wide pores diameter. Then the effluent passes with
high pressure throw 65 RO membrane with 18 in diameter. This removes all
particulate matter, and other pollutants from the wastewater. Advanced oxidation
uses ultraviolet (UV) irradiation and hydrogen peroxide to eliminate the residual
organics in the water. Lime and carbon dioxide are added to purified water to harden
water and to increase its alkalinity. The effluents from the plant have high quality
and can be safely used or sent to reservoirs or power stations (Water technology,
2018).

Chapter 3:
Study Area
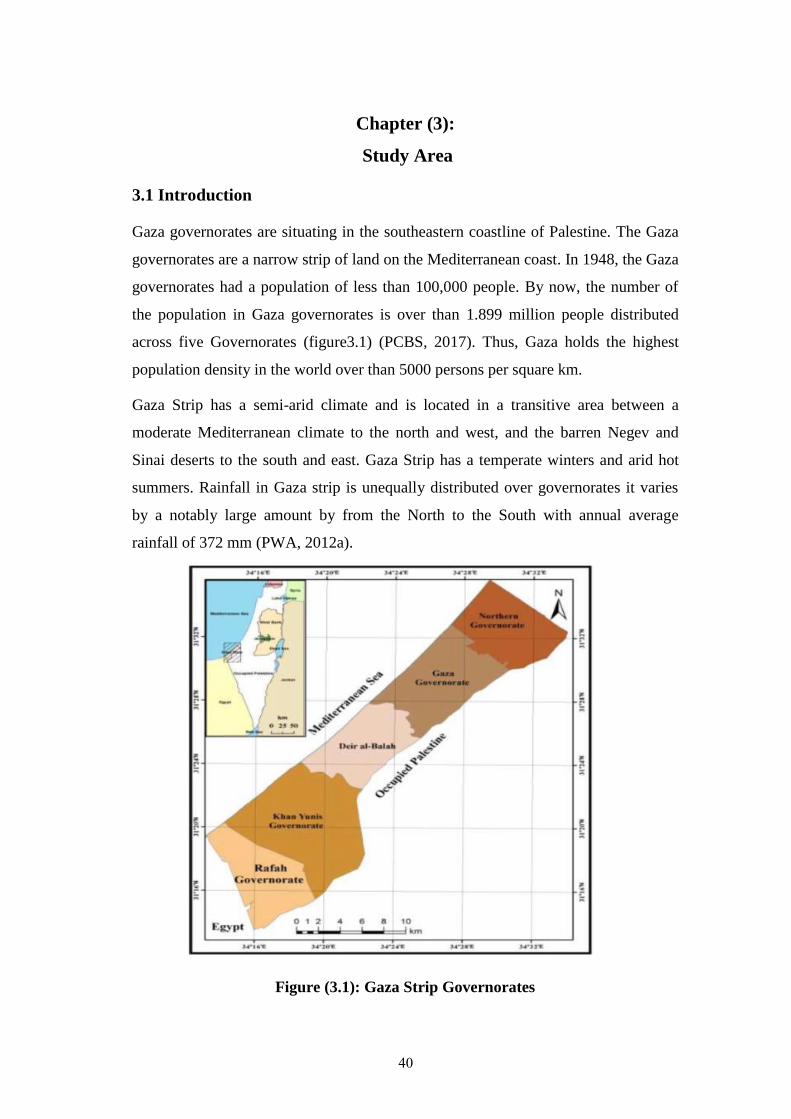
41
Chapter (3):
Study Area
3.1 Introduction
Gaza governorates are situating in the southeastern coastline of Palestine. The Gaza
governorates are a narrow strip of land on the Mediterranean coast. In 1948, the Gaza
governorates had a population of less than 100,000 people. By now, the number of
the population in Gaza governorates is over than 1.899 million people distributed
across five Governorates (figure3.1) (PCBS, 2017). Thus, Gaza holds the highest
population density in the world over than 5000 persons per square km.
Gaza Strip has a semi-arid climate and is located in a transitive area between a
moderate Mediterranean climate to the north and west, and the barren Negev and
Sinai deserts to the south and east. Gaza Strip has a temperate winters and arid hot
summers. Rainfall in Gaza strip is unequally distributed over governorates it varies
by a notably large amount by from the North to the South with annual average
rainfall of 372 mm (PWA, 2012a).
Figure (3.1): Gaza Strip Governorates
40
3.2 Water Resources in Gaza Strip
3.2.1 Groundwater
Groundwater is the master source of water in Gaza Strip where the coastal aquifer is
the only source for water, with the depth of the water containing layer diverges from
some meters in the eastern and southeastern zones to less than meter and half in the
western zones and align the coastline. The aquifer composed mostly of sand, gravel
and granular sand (Korkar) mixed with silt and clay. A rigid layer of clay with low
permeability has a depth of less than one meter located under the aquifer. The annual
recharge amounts for the aquifer is approximately 60 MCM. The total abstracted
volume is about 180 MCM, this shows that the whole recharge is only one-third of
overall extraction. These unsustainably high rates of abstraction have led to decrease
the groundwater levels, consequently gradually intrusion of seawater and upwelling
of saline groundwater occurred (PWA, 2012b).
The Water quality in Gaza Strip is very poor where the major problem is the high
concentrations of salts. The water quality didn‟t meet the accepted international
guidelines for potable water usage, only about 5% of water pumped through the
network meets drinking water standards (World Bank, 2009). At the present time,
more than a few of agricultural wells are also viewing high saline levels. The
chloride concentration of the abstracted water is varied from 100-1000 mg/l, while
the nitrate is varying from 50-300 mg/l. (PWA,2013)
3.2.2 Non-conventional water resources
According to (PWA, 2013), Gaza cannot supply itself but must find new alternative
sources of water as:
I-Purchased water (Mekorot)
Gaza presently buys amounts of its water from the Israeli water utility (Mekorot):
Israel is under a commitment to supply 10 MCM and there is an addition 5 MCM
is under the interim agreement and negotiations through the implementation of
those pledges with an initial price agreed (PWA, 2013).
42
II- Desalination plants
Purification of brackish water to obtain adequate levels of potable water quality is
an significant choice which were performed at minor scale. About 3 MCM per
year is supplied from about one hundred private water suppliers (brackish water
desalination) besides to single public seawater desalination plant and about six
pubic brackish groundwater desalination plants managed by municipal
departments and CMWU.
The PWA newly finished a research of water supply choices for the short-term,
medium-term and long-term. At the short-term, low-volume (STLV) seawater
desalination plant to be built with an overall capacity of 13 MCM per year. In the
long terms central seawater desalination plant will be built with a capacity of 50
MCM per year by the year 2017-2022 to be extended to 129 MCM/y in the future
(PWA,2012b).
III- Treated wastewater reuse
Wastewater reclamation and reuse appear to be encouraging in the Gaza Strip near
future. The predicted quantity of effluent to be used for agriculture will gradually
increase on the coming two decades saving more than 50%of groundwater that
required for agriculture (Tubail et. al., 2003).
There are several of latest researches, which have indicated that the farmworkers
in Gaza Strip are willing to use reclaimed effluent for irrigating agriculture, if
amounts of it was accessible. The reuse of reclaimed effluent is highly significant
because around 50% of the current potable water use in Gaza Strip is allocated to
the agricultural strip. The reuse can't be offered at any considerable scale if there
is a lack of high quality effluent treatment (PWA, 2011).
3.3 Wastewater in Gaza Strip
3.3.1 Present situation of wastewater in Gaza Strip
The environmentally right management of waste demand appropriate collection,
treatment and reuse of reclaimed wastewater. In Gaza Strip wastewater, some areas
linked to sewage facility and served by well-functioning system while some areas not
linked at all to the sewage system and depends on cesspits as wastewater disposal
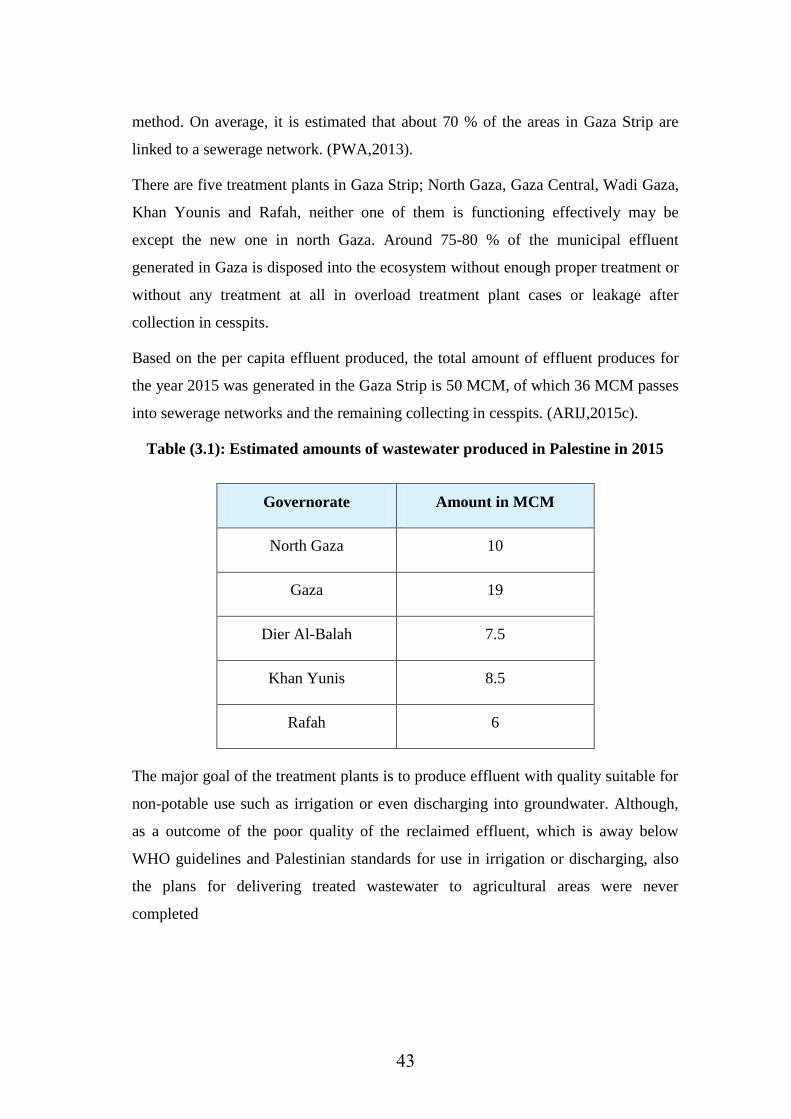
43
method. On average, it is estimated that about 70 % of the areas in Gaza Strip are
linked to a sewerage network. (PWA,2013).
There are five treatment plants in Gaza Strip; North Gaza, Gaza Central, Wadi Gaza,
Khan Younis and Rafah, neither one of them is functioning effectively may be
except the new one in north Gaza. Around 75-80 % of the municipal effluent
generated in Gaza is disposed into the ecosystem without enough proper treatment or
without any treatment at all in overload treatment plant cases or leakage after
collection in cesspits.
Based on the per capita effluent produced, the total amount of effluent produces for
the year 2015 was generated in the Gaza Strip is 50 MCM, of which 36 MCM passes
into sewerage networks and the remaining collecting in cesspits. (ARIJ,2015c).
Table (3.1): Estimated amounts of wastewater produced in Palestine in 2015
The major goal of the treatment plants is to produce effluent with quality suitable for
non-potable use such as irrigation or even discharging into groundwater. Although,
as a outcome of the poor quality of the reclaimed effluent, which is away below
WHO guidelines and Palestinian standards for use in irrigation or discharging, also
the plans for delivering treated wastewater to agricultural areas were never
completed
Governorate Amount in MCM
North Gaza 10
Gaza 19
Dier Al-Balah 7.5
Khan Yunis 8.5
Rafah 6
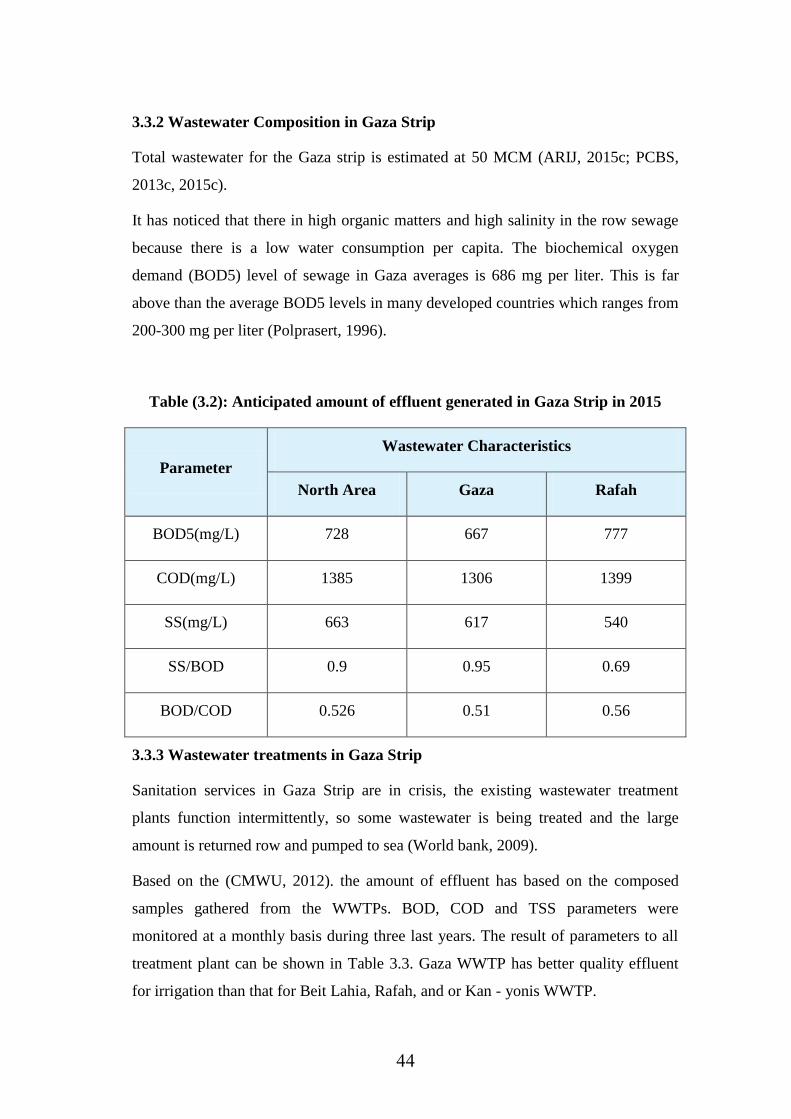
44
3.3.2 Wastewater Composition in Gaza Strip
Total wastewater for the Gaza strip is estimated at 50 MCM (ARIJ, 2015c; PCBS,
2013c, 2015c).
It has noticed that there in high organic matters and high salinity in the row sewage
because there is a low water consumption per capita. The biochemical oxygen
demand (BOD5) level of sewage in Gaza averages is 686 mg per liter. This is far
above than the average BOD5 levels in many developed countries which ranges from
200-300 mg per liter (Polprasert, 1996).
Table (3.2): Anticipated amount of effluent generated in Gaza Strip in 2015
Parameter
Wastewater Characteristics
North Area Gaza Rafah
BOD5(mg/L) 728 667 777
COD(mg/L) 1385 1306 1399
SS(mg/L) 663 617 540
SS/BOD 0.9 0.95 0.69
BOD/COD 0.526 0.51 0.56
3.3.3 Wastewater treatments in Gaza Strip
Sanitation services in Gaza Strip are in crisis, the existing wastewater treatment
plants function intermittently, so some wastewater is being treated and the large
amount is returned row and pumped to sea (World bank, 2009).
Based on the (CMWU, 2012). the amount of effluent has based on the composed
samples gathered from the WWTPs. BOD, COD and TSS parameters were
monitored at a monthly basis during three last years. The result of parameters to all
treatment plant can be shown in Table 3.3. Gaza WWTP has better quality effluent
for irrigation than that for Beit Lahia, Rafah, and or Kan - yonis WWTP.
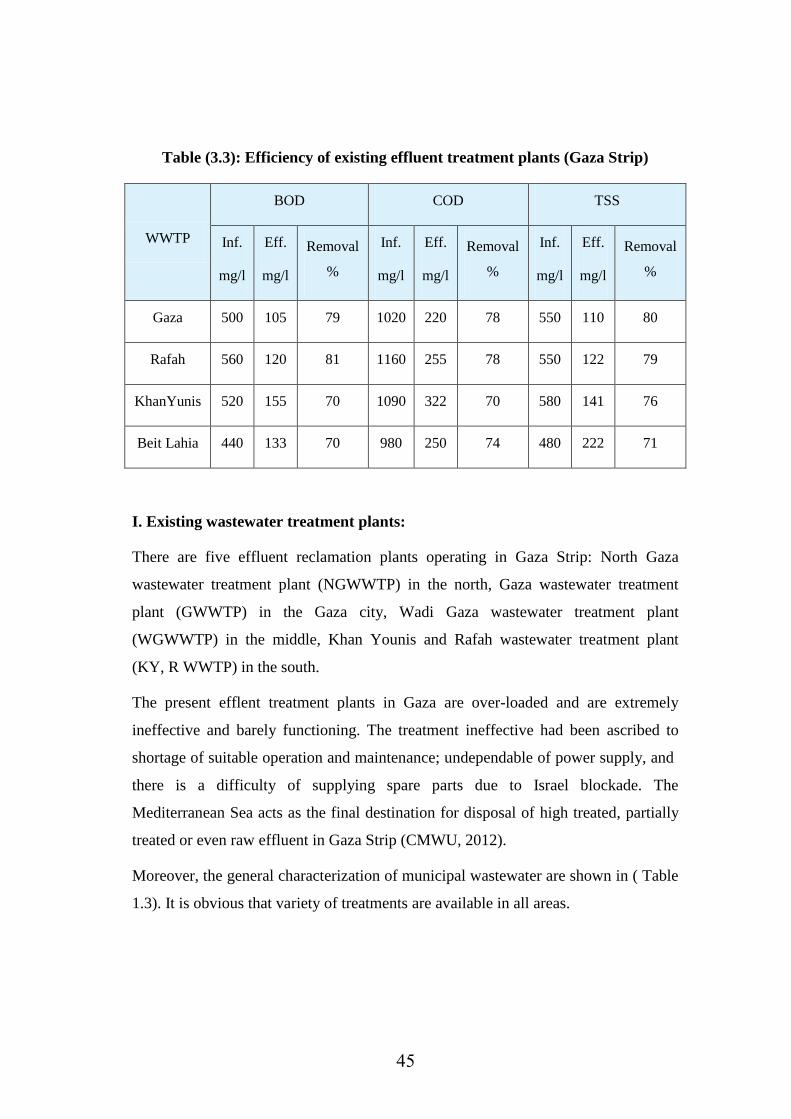
45
Table (3.3): Efficiency of existing effluent treatment plants (Gaza Strip)
WWTP
BOD COD TSS
Inf.
mg/l
Eff.
mg/l
Removal
%
Inf.
mg/l
Eff.
mg/l
Removal
%
Inf.
mg/l
Eff.
mg/l
Removal
%
Gaza 500 105 79 1020 220 78 550 110 80
Rafah 560 120 81 1160 255 78 550 122 79
KhanYunis 520 155 70 1090 322 70 580 141 76
Beit Lahia 440 133 70 980 250 74 480 222 71
I. Existing wastewater treatment plants:
There are five effluent reclamation plants operating in Gaza Strip: North Gaza
wastewater treatment plant (NGWWTP) in the north, Gaza wastewater treatment
plant (GWWTP) in the Gaza city, Wadi Gaza wastewater treatment plant
(WGWWTP) in the middle, Khan Younis and Rafah wastewater treatment plant
(KY, R WWTP) in the south.
The present efflent treatment plants in Gaza are over-loaded and are extremely
ineffective and barely functioning. The treatment ineffective had been ascribed to
shortage of suitable operation and maintenance; undependable of power supply, and
there is a difficulty of supplying spare parts due to Israel blockade. The
Mediterranean Sea acts as the final destination for disposal of high treated, partially
treated or even raw effluent in Gaza Strip (CMWU, 2012).
Moreover, the general characterization of municipal wastewater are shown in ( Table
1.3). It is obvious that variety of treatments are available in all areas.
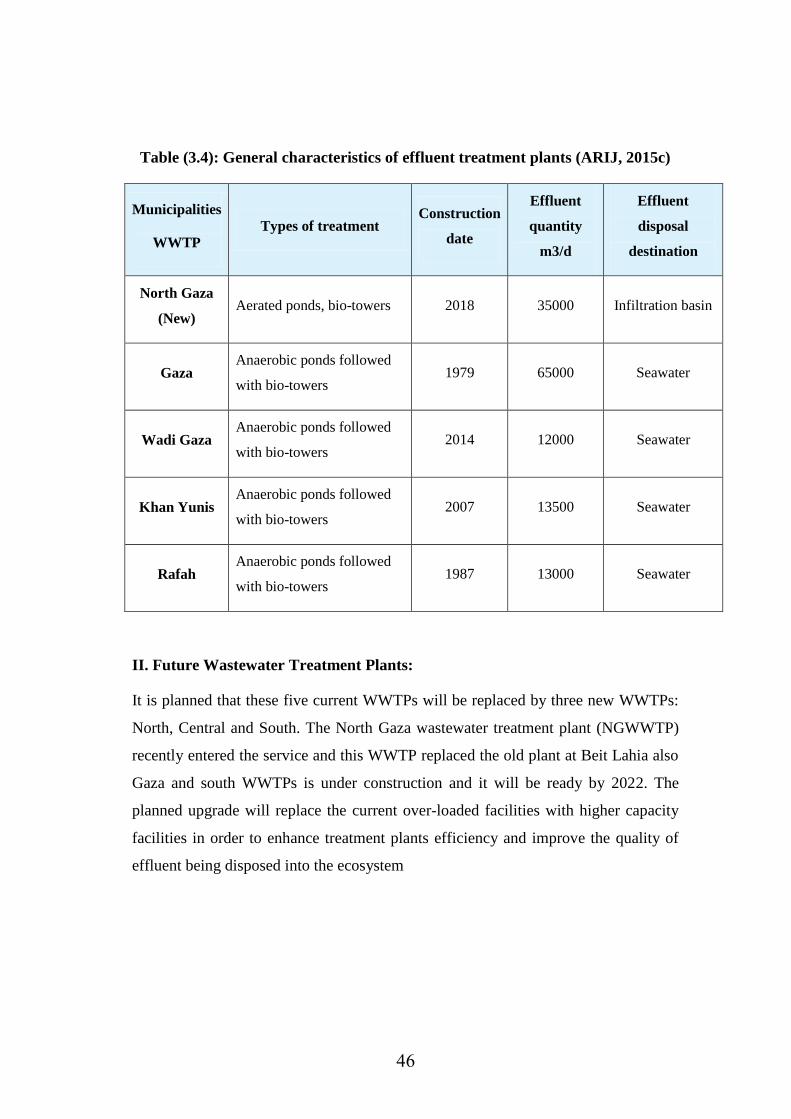
46
Table (3.4): General characteristics of effluent treatment plants (ARIJ, 2015c)
Municipalities
WWTP
Types of treatment Construction
date
Effluent
quantity
m3/d
Effluent
disposal
destination
North Gaza
(New) Aerated ponds, bio-towers 2018 35000 Infiltration basin
Gaza Anaerobic ponds followed
with bio-towers 1979 65000 Seawater
Wadi Gaza Anaerobic ponds followed
with bio-towers 2014 12000 Seawater
Khan Yunis Anaerobic ponds followed
with bio-towers 2007 13500 Seawater
Rafah Anaerobic ponds followed
with bio-towers 1987 13000 Seawater
II. Future Wastewater Treatment Plants:
It is planned that these five current WWTPs will be replaced by three new WWTPs:
North, Central and South. The North Gaza wastewater treatment plant (NGWWTP)
recently entered the service and this WWTP replaced the old plant at Beit Lahia also
Gaza and south WWTPs is under construction and it will be ready by 2022. The
planned upgrade will replace the current over-loaded facilities with higher capacity
facilities in order to enhance treatment plants efficiency and improve the quality of
effluent being disposed into the ecosystem
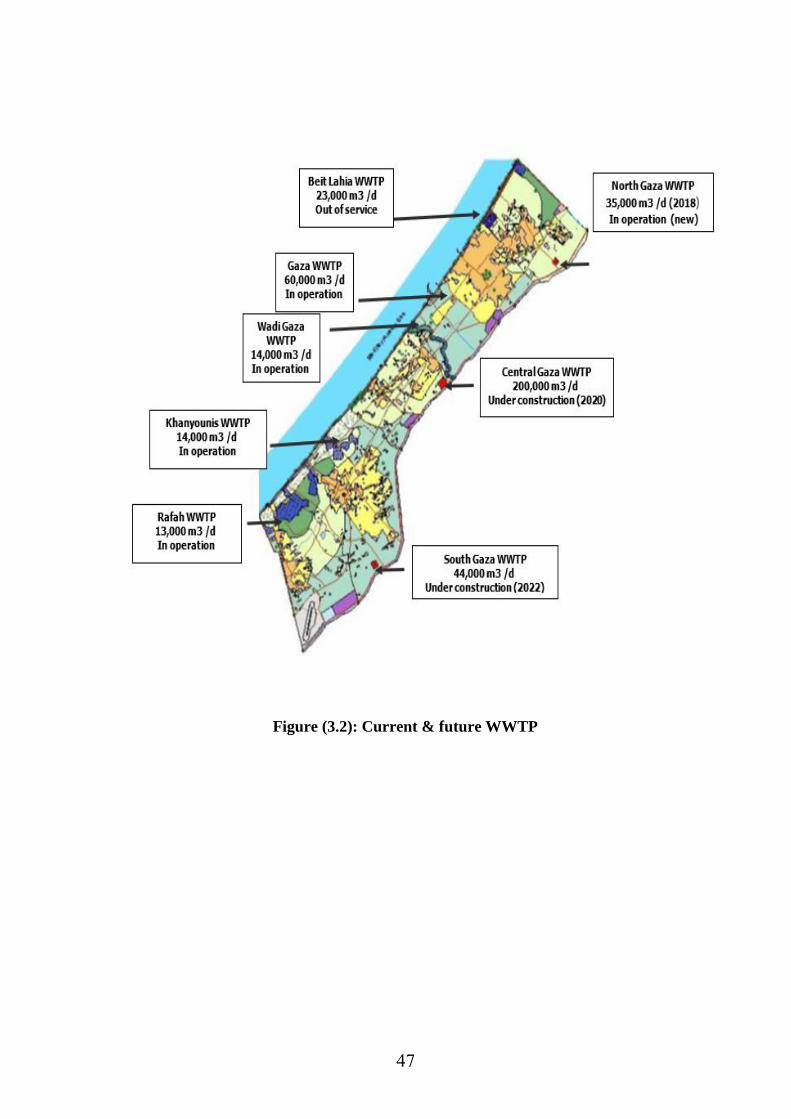
47
Figure (3.2): Current & future WWTP
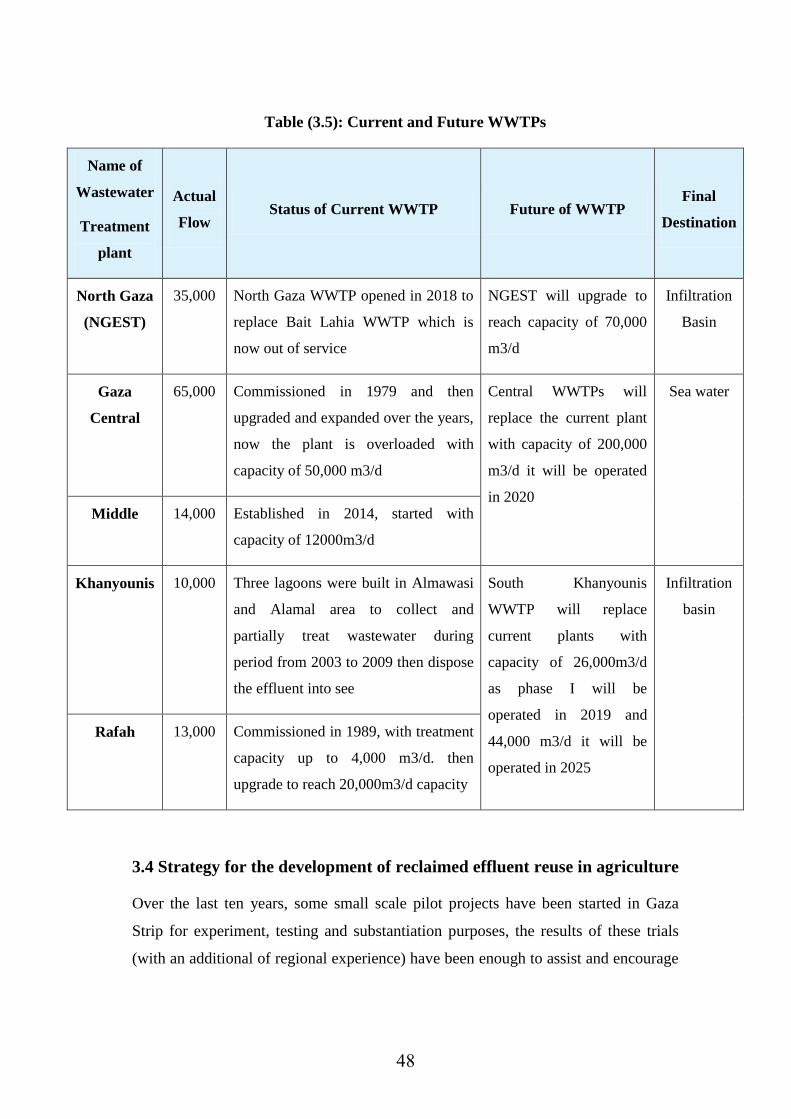
48
Table (3.5): Current and Future WWTPs
Name of
Wastewater
Treatment
plant
Actual
Flow Status of Current WWTP Future of WWTP
Final
Destination
North Gaza
(NGEST)
35,000 North Gaza WWTP opened in 2018 to
replace Bait Lahia WWTP which is
now out of service
NGEST will upgrade to
reach capacity of 70,000
m3/d
Infiltration
Basin
Gaza
Central
65,000 Commissioned in 1979 and then
upgraded and expanded over the years,
now the plant is overloaded with
capacity of 50,000 m3/d
Central WWTPs will
replace the current plant
with capacity of 200,000
m3/d it will be operated
in 2020
Sea water
Middle 14,000 Established in 2014, started with
capacity of 12000m3/d
Khanyounis 10,000 Three lagoons were built in Almawasi
and Alamal area to collect and
partially treat wastewater during
period from 2003 to 2009 then dispose
the effluent into see
South Khanyounis
WWTP will replace
current plants with
capacity of 26,000m3/d
as phase I will be
operated in 2019 and
44,000 m3/d it will be
operated in 2025
Infiltration
basin
Rafah 13,000 Commissioned in 1989, with treatment
capacity up to 4,000 m3/d. then
upgrade to reach 20,000m3/d capacity
3.4 Strategy for the development of reclaimed effluent reuse in agriculture
Over the last ten years, some small scale pilot projects have been started in Gaza
Strip for experiment, testing and substantiation purposes, the results of these trials
(with an additional of regional experience) have been enough to assist and encourage
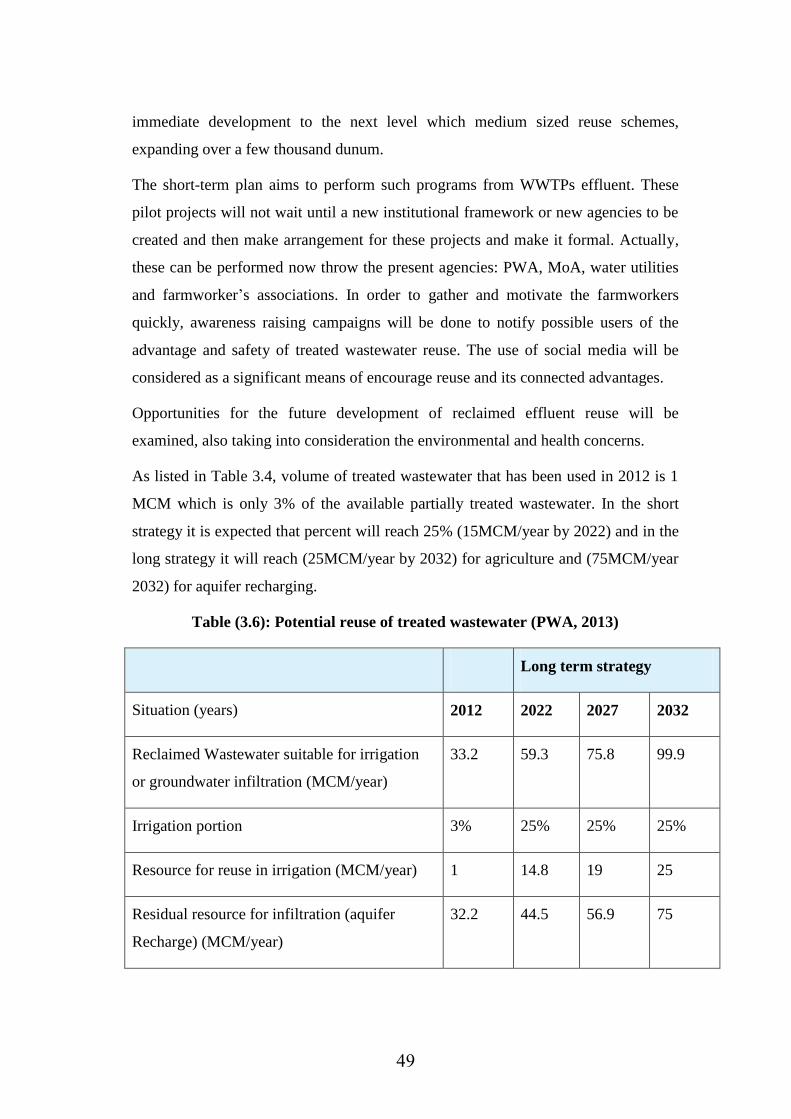
49
immediate development to the next level which medium sized reuse schemes,
expanding over a few thousand dunum.
The short-term plan aims to perform such programs from WWTPs effluent. These
pilot projects will not wait until a new institutional framework or new agencies to be
created and then make arrangement for these projects and make it formal. Actually,
these can be performed now throw the present agencies: PWA, MoA, water utilities
and farmworker‟s associations. In order to gather and motivate the farmworkers
quickly, awareness raising campaigns will be done to notify possible users of the
advantage and safety of treated wastewater reuse. The use of social media will be
considered as a significant means of encourage reuse and its connected advantages.
Opportunities for the future development of reclaimed effluent reuse will be
examined, also taking into consideration the environmental and health concerns.
As listed in Table 3.4, volume of treated wastewater that has been used in 2012 is 1
MCM which is only 3% of the available partially treated wastewater. In the short
strategy it is expected that percent will reach 25% (15MCM/year by 2022) and in the
long strategy it will reach (25MCM/year by 2032) for agriculture and (75MCM/year
2032) for aquifer recharging.
Table (3.6): Potential reuse of treated wastewater (PWA, 2013)
Long term strategy
Situation (years) 2012 2022 2027 2032
Reclaimed Wastewater suitable for irrigation
or groundwater infiltration (MCM/year)
33.2 59.3 75.8 99.9
Irrigation portion 3% 25% 25% 25%
Resource for reuse in irrigation (MCM/year) 1 14.8 19 25
Residual resource for infiltration (aquifer
Recharge) (MCM/year)
32.2 44.5 56.9 75
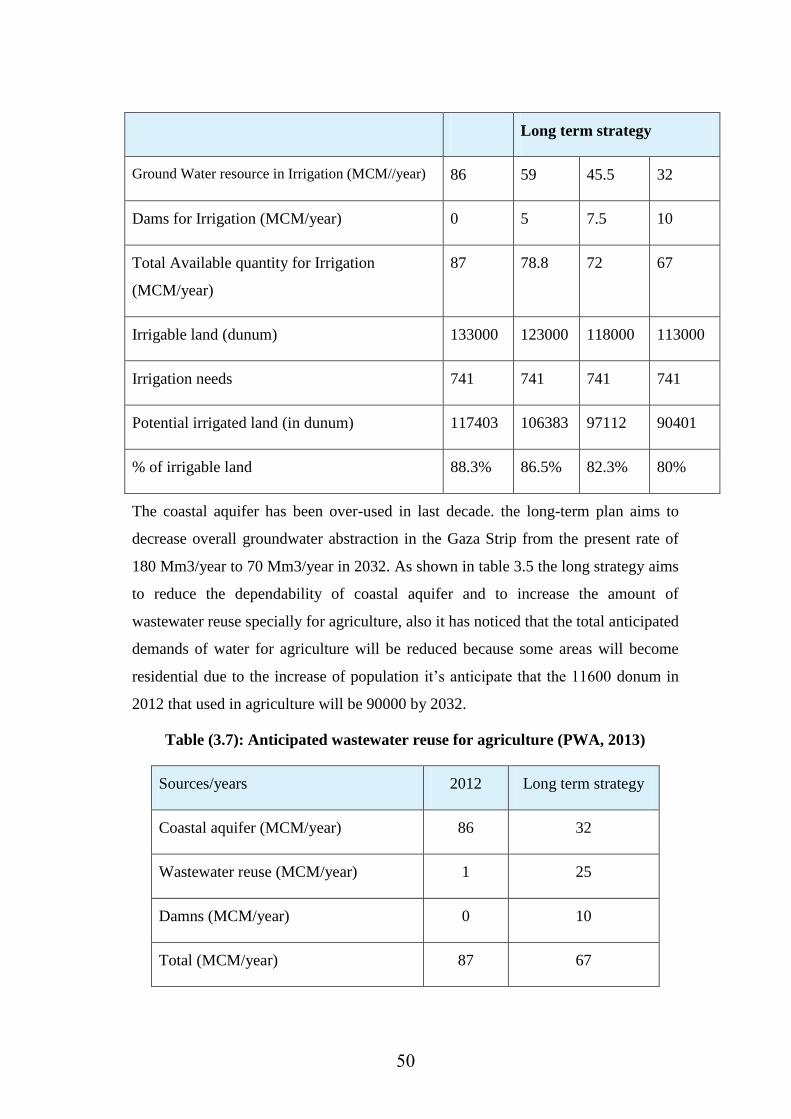
51
Long term strategy
Ground Water resource in Irrigation (MCM//year) 86 59 45.5 32
Dams for Irrigation (MCM/year) 0 5 7.5 10
Total Available quantity for Irrigation
(MCM/year)
87 78.8 72 67
Irrigable land (dunum) 133000 123000 118000 113000
Irrigation needs 741 741 741 741
Potential irrigated land (in dunum) 117403 106383 97112 90401
% of irrigable land 88.3% 86.5% 82.3% 80%
The coastal aquifer has been over-used in last decade. the long-term plan aims to
decrease overall groundwater abstraction in the Gaza Strip from the present rate of
180 Mm3/year to 70 Mm3/year in 2032. As shown in table 3.5 the long strategy aims
to reduce the dependability of coastal aquifer and to increase the amount of
wastewater reuse specially for agriculture, also it has noticed that the total anticipated
demands of water for agriculture will be reduced because some areas will become
residential due to the increase of population it‟s anticipate that the 11600 donum in
2012 that used in agriculture will be 90000 by 2032.
Table (3.7): Anticipated wastewater reuse for agriculture (PWA, 2013)
Sources/years 2012 Long term strategy
Coastal aquifer (MCM/year) 86 32
Wastewater reuse (MCM/year) 1 25
Damns (MCM/year) 0 10
Total (MCM/year) 87 67

Chapter 4:
Methodology
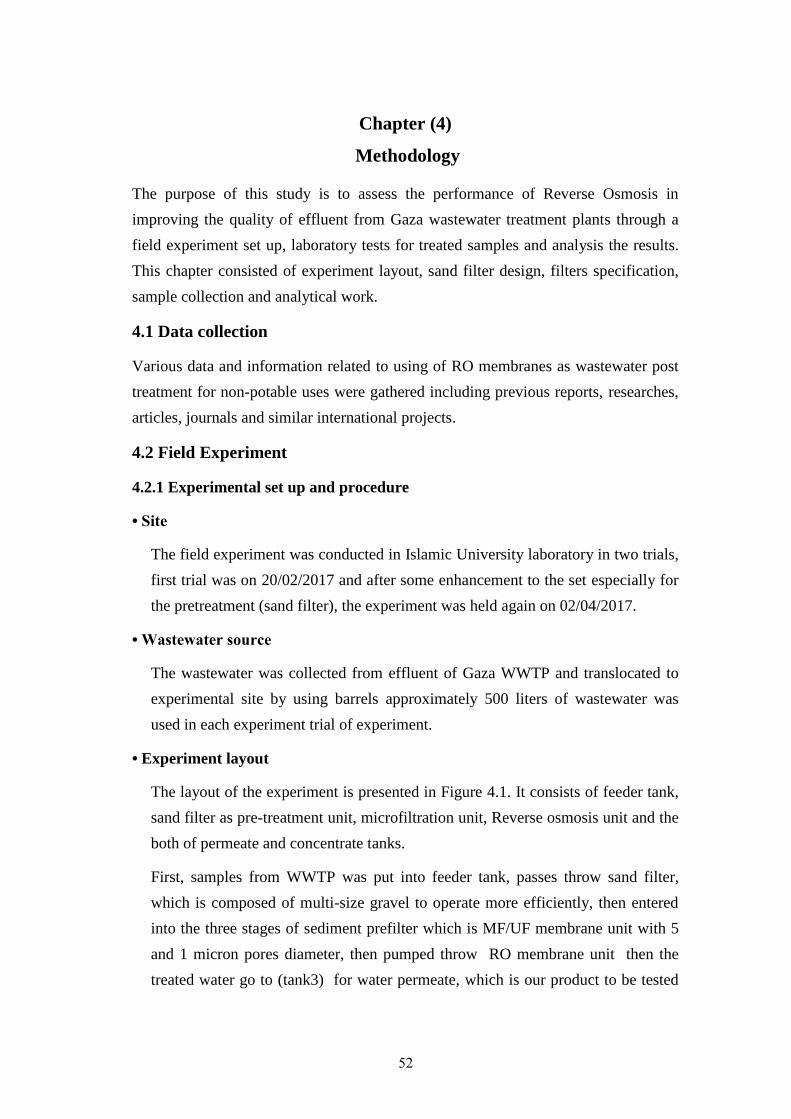
52
Chapter (4)
Methodology
The purpose of this study is to assess the performance of Reverse Osmosis in
improving the quality of effluent from Gaza wastewater treatment plants through a
field experiment set up, laboratory tests for treated samples and analysis the results.
This chapter consisted of experiment layout, sand filter design, filters specification,
sample collection and analytical work.
4.1 Data collection
Various data and information related to using of RO membranes as wastewater post
treatment for non-potable uses were gathered including previous reports, researches,
articles, journals and similar international projects.
4.2 Field Experiment
4.2.1 Experimental set up and procedure
• Site
The field experiment was conducted in Islamic University laboratory in two trials,
first trial was on 20/02/2017 and after some enhancement to the set especially for
the pretreatment (sand filter), the experiment was held again on 02/04/2017.
• Wastewater source
The wastewater was collected from effluent of Gaza WWTP and translocated to
experimental site by using barrels approximately 500 liters of wastewater was
used in each experiment trial of experiment.
• Experiment layout
The layout of the experiment is presented in Figure 4.1. It consists of feeder tank,
sand filter as pre-treatment unit, microfiltration unit, Reverse osmosis unit and the
both of permeate and concentrate tanks.
First, samples from WWTP was put into feeder tank, passes throw sand filter,
which is composed of multi-size gravel to operate more efficiently, then entered
into the three stages of sediment prefilter which is MF/UF membrane unit with 5
and 1 micron pores diameter, then pumped throw RO membrane unit then the
treated water go to (tank3) for water permeate, which is our product to be tested
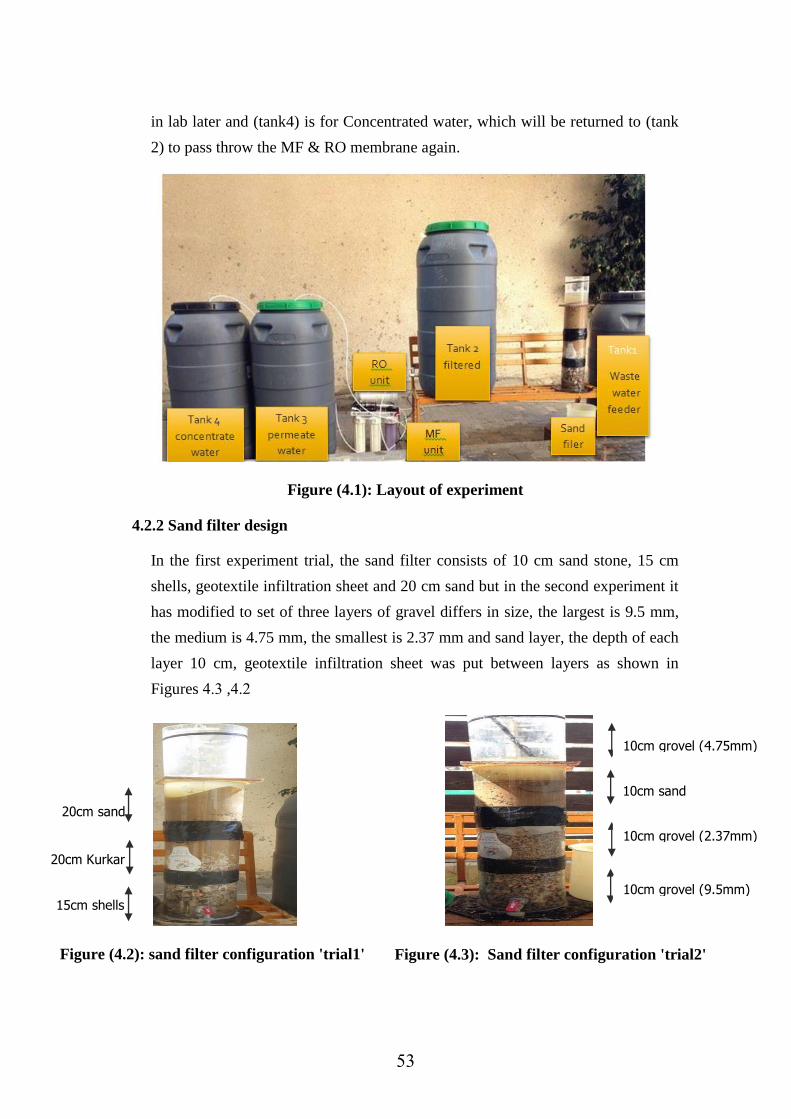
53
in lab later and (tank4) is for Concentrated water, which will be returned to (tank
2) to pass throw the MF & RO membrane again.
Figure (4.1): Layout of experiment
4.2.2 Sand filter design
In the first experiment trial, the sand filter consists of 10 cm sand stone, 15 cm
shells, geotextile infiltration sheet and 20 cm sand but in the second experiment it
has modified to set of three layers of gravel differs in size, the largest is 9.5 mm,
the medium is 4.75 mm, the smallest is 2.37 mm and sand layer, the depth of each
layer 10 cm, geotextile infiltration sheet was put between layers as shown in
Figures 4.3 ,4.2
10cm grovel (9.5mm)
10cm grovel (2.37mm)
10cm sand
10cm grovel (4.75mm)
15cm shells
20cm Kurkar
20cm sand
Figure (4.2): sand filter configuration 'trial1'
Figure (4.3): Sand filter configuration 'trial2'
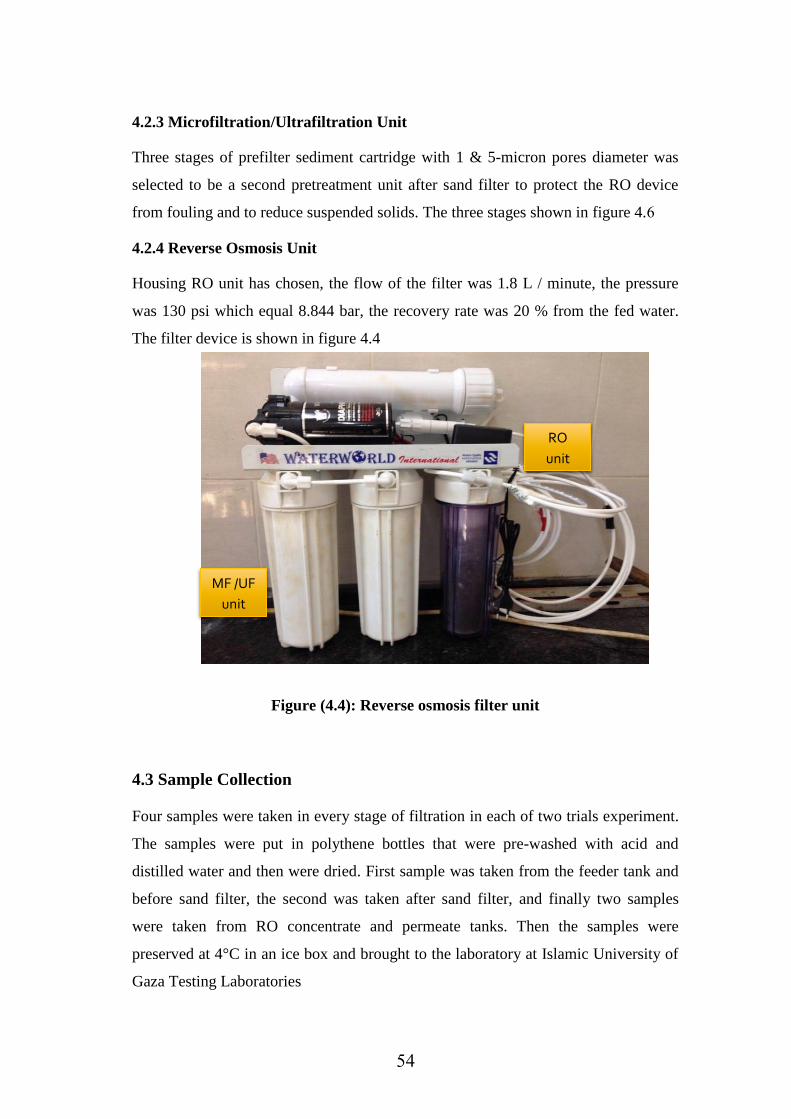
54
4.2.3 Microfiltration/Ultrafiltration Unit
Three stages of prefilter sediment cartridge with 1 & 5-micron pores diameter was
selected to be a second pretreatment unit after sand filter to protect the RO device
from fouling and to reduce suspended solids. The three stages shown in figure 4.6
4.2.4 Reverse Osmosis Unit
Housing RO unit has chosen, the flow of the filter was 1.8 L / minute, the pressure
was 130 psi which equal 8.844 bar, the recovery rate was 20 % from the fed water.
The filter device is shown in figure 4.4
Figure (4.4): Reverse osmosis filter unit
4.3 Sample Collection
Four samples were taken in every stage of filtration in each of two trials experiment.
The samples were put in polythene bottles that were pre-washed with acid and
distilled water and then were dried. First sample was taken from the feeder tank and
before sand filter, the second was taken after sand filter, and finally two samples
were taken from RO concentrate and permeate tanks. Then the samples were
preserved at 4°C in an ice box and brought to the laboratory at Islamic University of
Gaza Testing Laboratories
MF /UF
unit
RO
unit
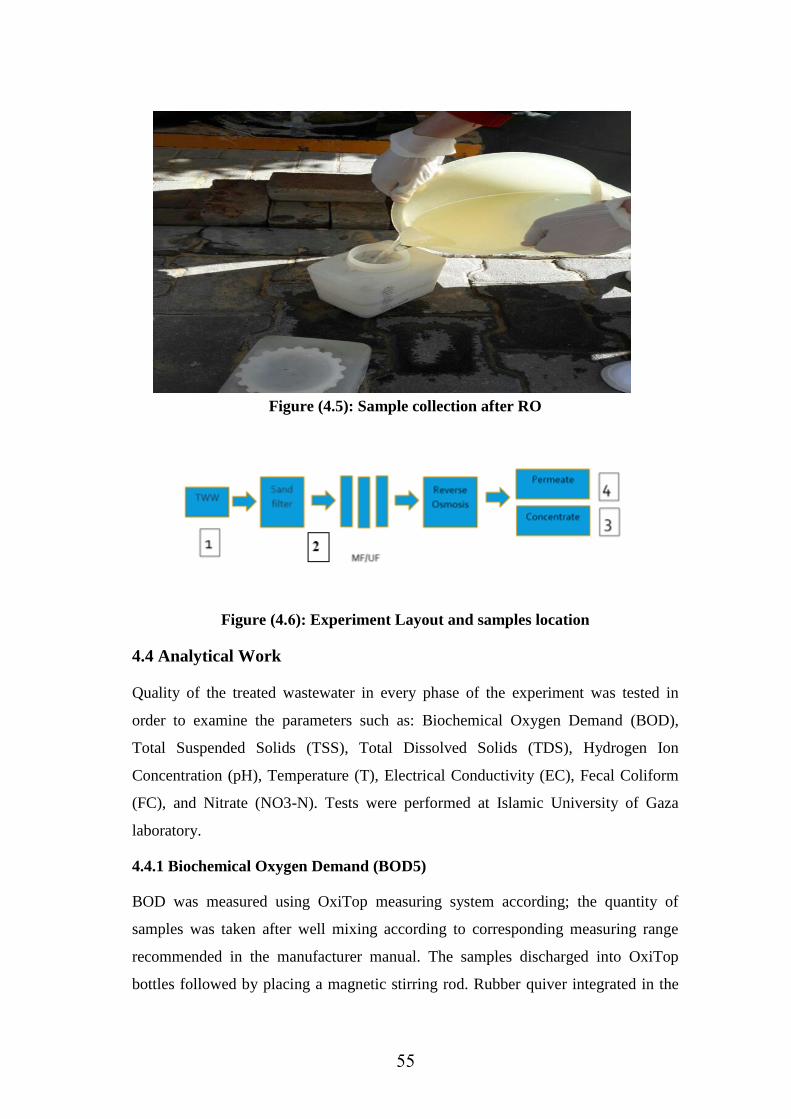
55
Figure (4.5): Sample collection after RO
Figure (4.6): Experiment Layout and samples location
4.4 Analytical Work
Quality of the treated wastewater in every phase of the experiment was tested in
order to examine the parameters such as: Biochemical Oxygen Demand (BOD),
Total Suspended Solids (TSS), Total Dissolved Solids (TDS), Hydrogen Ion
Concentration (pH), Temperature (T), Electrical Conductivity (EC), Fecal Coliform
(FC), and Nitrate (NO3-N). Tests were performed at Islamic University of Gaza
laboratory.
4.4.1 Biochemical Oxygen Demand (BOD5)
BOD was measured using OxiTop measuring system according; the quantity of
samples was taken after well mixing according to corresponding measuring range
recommended in the manufacturer manual. The samples discharged into OxiTop
bottles followed by placing a magnetic stirring rod. Rubber quiver integrated in the
56
neck of the bottle then three tablets of sodium hydroxide were put into the rubber
quiver with a tweezers. OxiTop bottle was directly tightly closed and pressed on S
and M buttons simultaneously for two second until the display shows 00. The bottles
were placed in the stirring tray and incubated for 5 days at 20 ºC. Readings of stored
values was registered after 5 days by pressing on m until values displayed for 1
second (modified from OxiTop Manual).
4.4.2 Fecal Coliforms (FC)
The concentration of fecal coliforms organisms in water is measured to determine the
probability of pollution by micro-biological bacteria. The membrane filter method is
a standard method for the testing of Water and Wastewater, gives direct counts of the
fecal coliform collection without enrichment or following tests. The results of the
membrane filter test take less than 1day. An adequate amount of water sample is
pushed through a membrane filter that retains the microorganisms that existing in the
sample. The filter comprising the bacteria is put on MFC agar in a petri dish. The
dish is incubated at temperature of 44.5 ± 0.2°C for 24 ± 2 hours .
After incubation, the representative colonies of bacteria are calculated under low
magnification and the number of fecal coliforms is reported as colony forming units
per 100 ml (CFU/100 mL) of water sample.
4.4.3 Suspended Solid (TSS)
To examine the total suspended particles in water and wastewater, an appropriate
volume of water sample is pushed through a weighed standard glass-fiber filter and
the remains kept on the filter is dried with temperature of 103°C to 105°C to reach
fixed weight. The increase in weight of the filter is the weight of the total suspended
particles. If the suspended solids block the filter voids and extend the time of
filtration, increasing the diameter of the filter opening or decrease the sample volume
may be necessary. To get an estimate of total suspended solids, subtract total
dissolved solids from total solids.
4.4.4 Nitrate (NO3-N)
As mentioned in (El –Nahhal, 2014). NO3 concentration in wastewater is determined
according to salicylic acid method. In this method 5 g salicylic acid dissolved in
57
100ml H2SO4. Then 2ml of the solution was transform to test tubes contained the
1ml of standard solution concentration.
The system is left for 20 min. to allow the reaction. The 18 ml of NaOH 6N is added
to the tubes. A yellow color of salicylic acid is developed. The color in the standard
solutions and known samples were measured at 420 nm. The liner relationship
between the optical description and concentration was used to determine the NO3
concentration in the others samples.
4.4.5 pH
PH is a measure of the hydrogen ion concentration in water. PH measured using a pH
meter, firstly the device has to be calibrated by measuring pH for a matter with a
known pH number, them meter has to be adjusted to match the sample temperature.
4.4.6 Electrical Conductivity (EC)
EC is considered as a big indicator of water salinity. The more solids content or total
dissolved solid (TDS) in water the more of EC value number. EC can measure by EC
meter. First Calibrate the EC meter and then Measure conductance of samples then
we report the reading. EC is measured in dS/m. TDS value can be estimated by
equation TDS (ppm) = 640*EC (dS/m)
4.4.7 Total Dissolved Solid (TDS)
TDS refers to total dissolved solids particles contained in water the solids. TDS can
be measured by evaporating the water passed from TSS test at 180°C for one hour,
TDS can also be estimated by measuring EC and using the previous mentioned
equation or simply TDS can measure by TDS meter. TDS is measure in ppm or mg/l

Chapter 5:
Results and Discussion
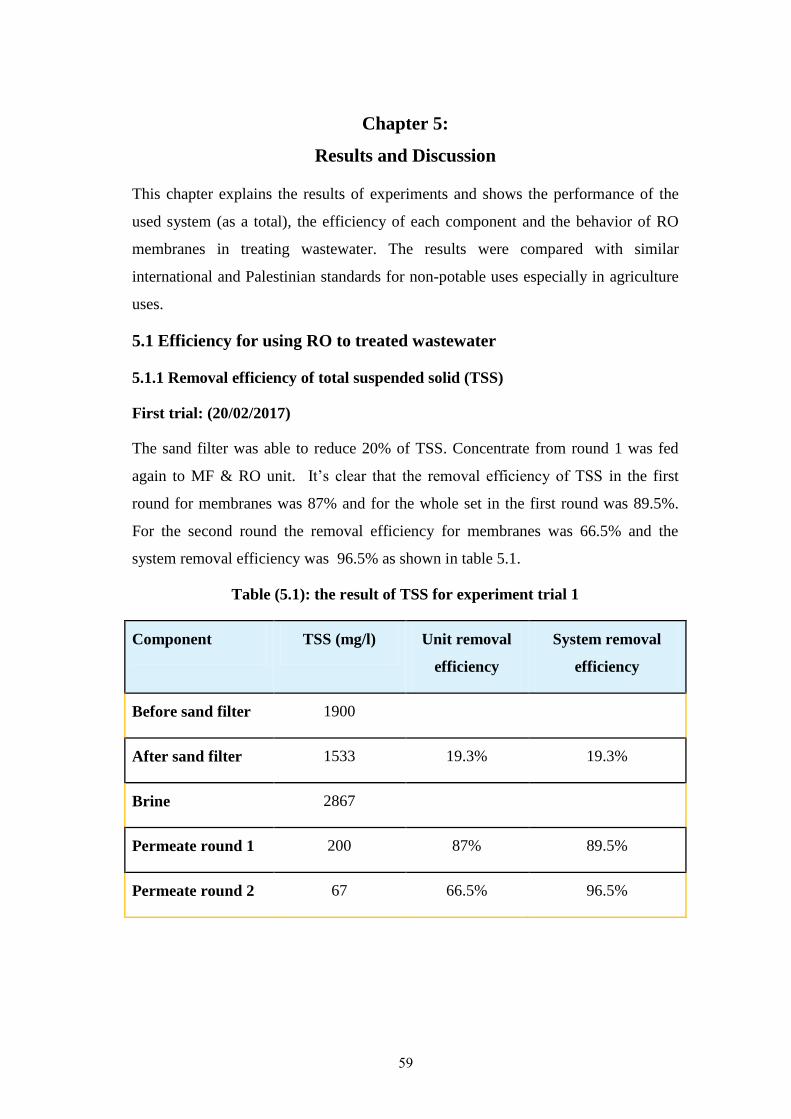
59
Chapter 5:
Results and Discussion
This chapter explains the results of experiments and shows the performance of the
used system (as a total), the efficiency of each component and the behavior of RO
membranes in treating wastewater. The results were compared with similar
international and Palestinian standards for non-potable uses especially in agriculture
uses.
5.1 Efficiency for using RO to treated wastewater
5.1.1 Removal efficiency of total suspended solid (TSS)
First trial: (20/02/2017)
The sand filter was able to reduce 20% of TSS. Concentrate from round 1 was fed
again to MF & RO unit. It‟s clear that the removal efficiency of TSS in the first
round for membranes was 87% and for the whole set in the first round was 89.5%.
For the second round the removal efficiency for membranes was 66.5% and the
system removal efficiency was 96.5% as shown in table 5.1.
Table (5.1): the result of TSS for experiment trial 1
Component TSS (mg/l) Unit removal
efficiency
System removal
efficiency
Before sand filter 1900
After sand filter 1533 19.3% 19.3%
Brine 2867
Permeate round 1 200 87% 89.5%
Permeate round 2 67 66.5% 96.5%
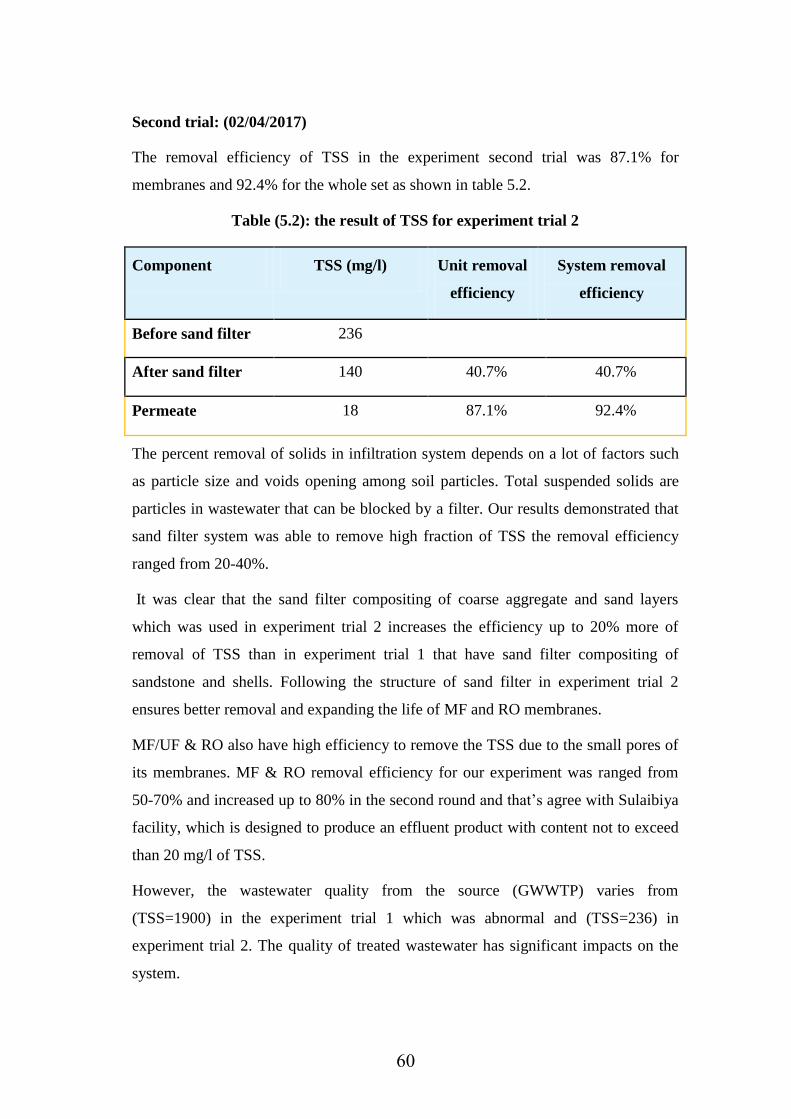
61
Second trial: (02/04/2017)
The removal efficiency of TSS in the experiment second trial was 87.1% for
membranes and 92.4% for the whole set as shown in table 5.2.
Table (5.2): the result of TSS for experiment trial 2
Component TSS (mg/l) Unit removal
efficiency
System removal
efficiency
Before sand filter 236
After sand filter 140 40.7% 40.7%
Permeate 18 87.1% 92.4%
The percent removal of solids in infiltration system depends on a lot of factors such
as particle size and voids opening among soil particles. Total suspended solids are
particles in wastewater that can be blocked by a filter. Our results demonstrated that
sand filter system was able to remove high fraction of TSS the removal efficiency
ranged from 20-40%.
It was clear that the sand filter compositing of coarse aggregate and sand layers
which was used in experiment trial 2 increases the efficiency up to 20% more of
removal of TSS than in experiment trial 1 that have sand filter compositing of
sandstone and shells. Following the structure of sand filter in experiment trial 2
ensures better removal and expanding the life of MF and RO membranes.
MF/UF & RO also have high efficiency to remove the TSS due to the small pores of
its membranes. MF & RO removal efficiency for our experiment was ranged from
50-70% and increased up to 80% in the second round and that‟s agree with Sulaibiya
facility, which is designed to produce an effluent product with content not to exceed
than 20 mg/l of TSS.
However, the wastewater quality from the source (GWWTP) varies from
(TSS=1900) in the experiment trial 1 which was abnormal and (TSS=236) in
experiment trial 2. The quality of treated wastewater has significant impacts on the
system.
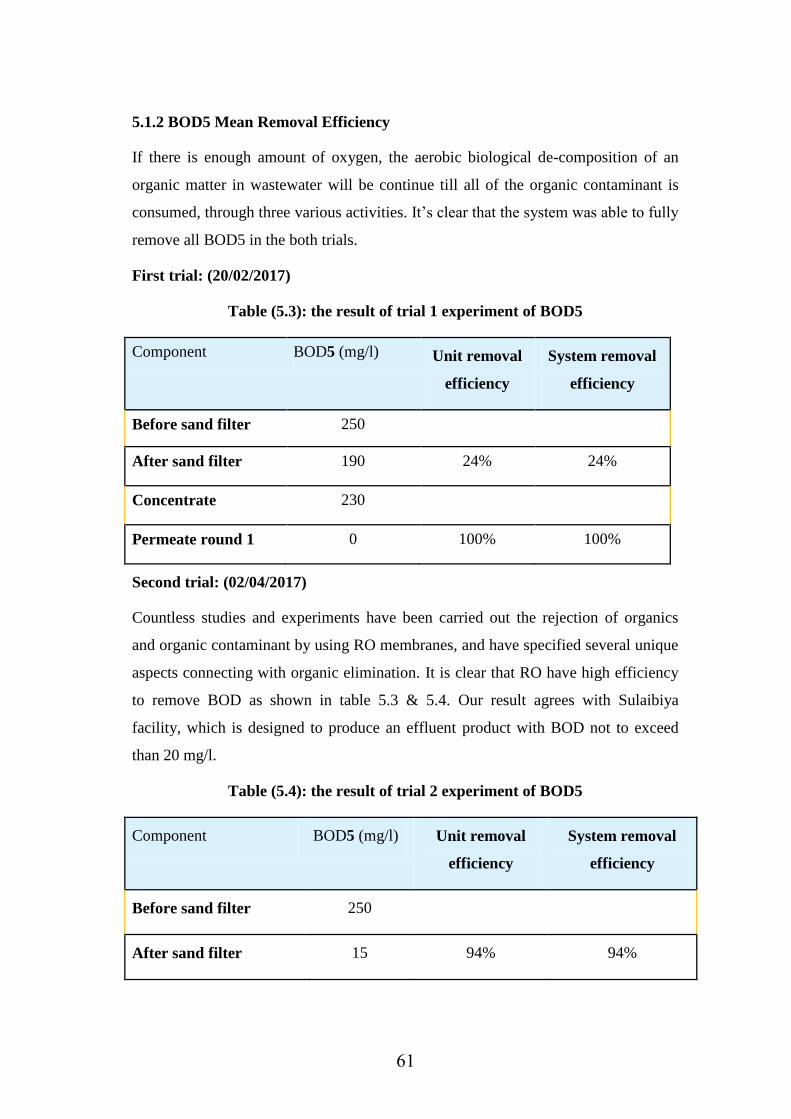
60
5.1.2 BOD5 Mean Removal Efficiency
If there is enough amount of oxygen, the aerobic biological de-composition of an
organic matter in wastewater will be continue till all of the organic contaminant is
consumed, through three various activities. It‟s clear that the system was able to fully
remove all BOD5 in the both trials.
First trial: (20/02/2017)
Table (5.3): the result of trial 1 experiment of BOD5
Component BOD5 (mg/l) Unit removal
efficiency
System removal
efficiency
Before sand filter 250
After sand filter 190 24% 24%
Concentrate 230
Permeate round 1 0 100% 100%
Second trial: (02/04/2017)
Countless studies and experiments have been carried out the rejection of organics
and organic contaminant by using RO membranes, and have specified several unique
aspects connecting with organic elimination. It is clear that RO have high efficiency
to remove BOD as shown in table 5.3 & 5.4. Our result agrees with Sulaibiya
facility, which is designed to produce an effluent product with BOD not to exceed
than 20 mg/l.
Table (5.4): the result of trial 2 experiment of BOD5
Component BOD5 (mg/l) Unit removal
efficiency
System removal
efficiency
Before sand filter 250
After sand filter 15 94% 94%
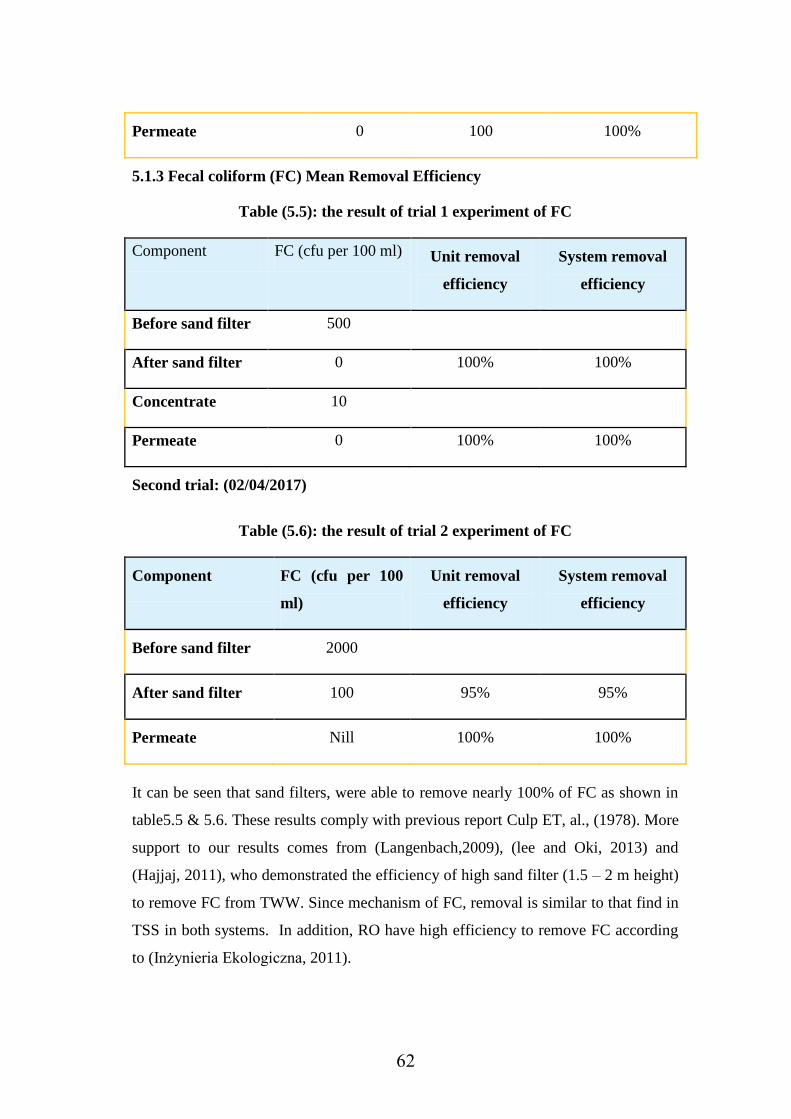
62
Permeate 0 100 100%
5.1.3 Fecal coliform (FC) Mean Removal Efficiency
Table (5.5): the result of trial 1 experiment of FC
Component FC (cfu per 100 ml) Unit removal
efficiency
System removal
efficiency
Before sand filter 500
After sand filter 0 100% 100%
Concentrate 10
Permeate 0 100% 100%
Second trial: (02/04/2017)
Table (5.6): the result of trial 2 experiment of FC
Component FC (cfu per 100
ml)
Unit removal
efficiency
System removal
efficiency
Before sand filter 2000
After sand filter 100 95% 95%
Permeate Nill 100% 100%
It can be seen that sand filters, were able to remove nearly 100% of FC as shown in
table5.5 & 5.6. These results comply with previous report Culp ET, al., (1978). More
support to our results comes from (Langenbach,2009), (lee and Oki, 2013) and
(Hajjaj, 2011), who demonstrated the efficiency of high sand filter (1.5 – 2 m height)
to remove FC from TWW. Since mechanism of FC, removal is similar to that find in
TSS in both systems. In addition, RO have high efficiency to remove FC according
to (Inżynieria Ekologiczna, 2011).
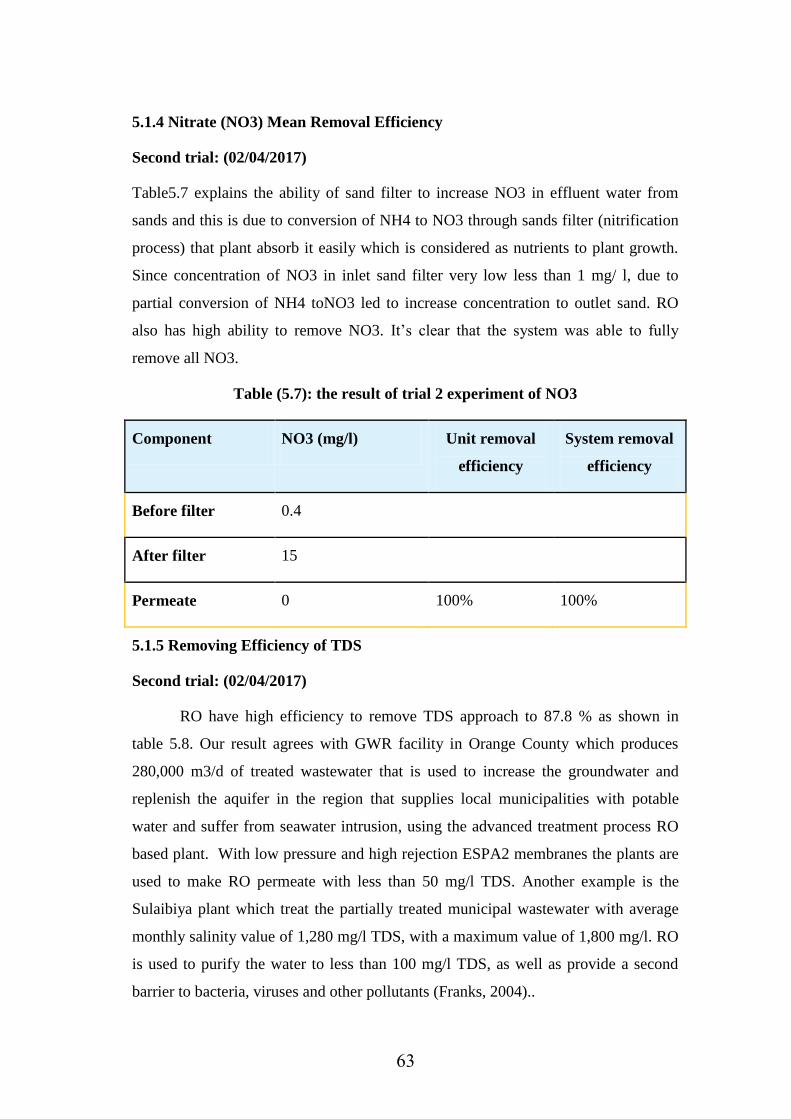
63
5.1.4 Nitrate (NO3) Mean Removal Efficiency
Second trial: (02/04/2017)
Table5.7 explains the ability of sand filter to increase NO3 in effluent water from
sands and this is due to conversion of NH4 to NO3 through sands filter (nitrification
process) that plant absorb it easily which is considered as nutrients to plant growth.
Since concentration of NO3 in inlet sand filter very low less than 1 mg/ l, due to
partial conversion of NH4 toNO3 led to increase concentration to outlet sand. RO
also has high ability to remove NO3. It‟s clear that the system was able to fully
remove all NO3.
Table (5.7): the result of trial 2 experiment of NO3
Component NO3 (mg/l) Unit removal
efficiency
System removal
efficiency
Before filter 0.4
After filter 15
Permeate 0 100% 100%
5.1.5 Removing Efficiency of TDS
Second trial: (02/04/2017)
RO have high efficiency to remove TDS approach to 87.8 % as shown in
table 5.8. Our result agrees with GWR facility in Orange County which produces
280,000 m3/d of treated wastewater that is used to increase the groundwater and
replenish the aquifer in the region that supplies local municipalities with potable
water and suffer from seawater intrusion, using the advanced treatment process RO
based plant. With low pressure and high rejection ESPA2 membranes the plants are
used to make RO permeate with less than 50 mg/l TDS. Another example is the
Sulaibiya plant which treat the partially treated municipal wastewater with average
monthly salinity value of 1,280 mg/l TDS, with a maximum value of 1,800 mg/l. RO
is used to purify the water to less than 100 mg/l TDS, as well as provide a second
barrier to bacteria, viruses and other pollutants (Franks, 2004)..
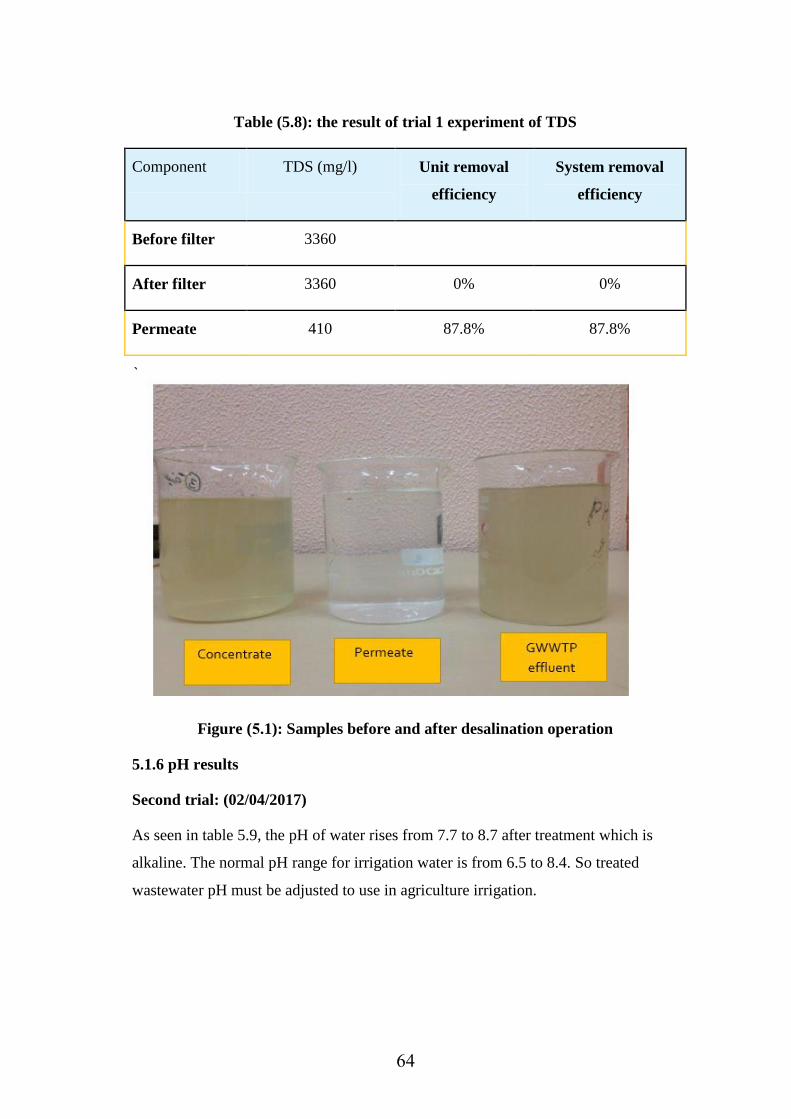
64
Table (5.8): the result of trial 1 experiment of TDS
Component TDS (mg/l) Unit removal
efficiency
System removal
efficiency
Before filter 3360
After filter 3360 0% 0%
Permeate 410 87.8% 87.8%
`
Figure (5.1): Samples before and after desalination operation
5.1.6 pH results
Second trial: (02/04/2017)
As seen in table 5.9, the pH of water rises from 7.7 to 8.7 after treatment which is
alkaline. The normal pH range for irrigation water is from 6.5 to 8.4. So treated
wastewater pH must be adjusted to use in agriculture irrigation.
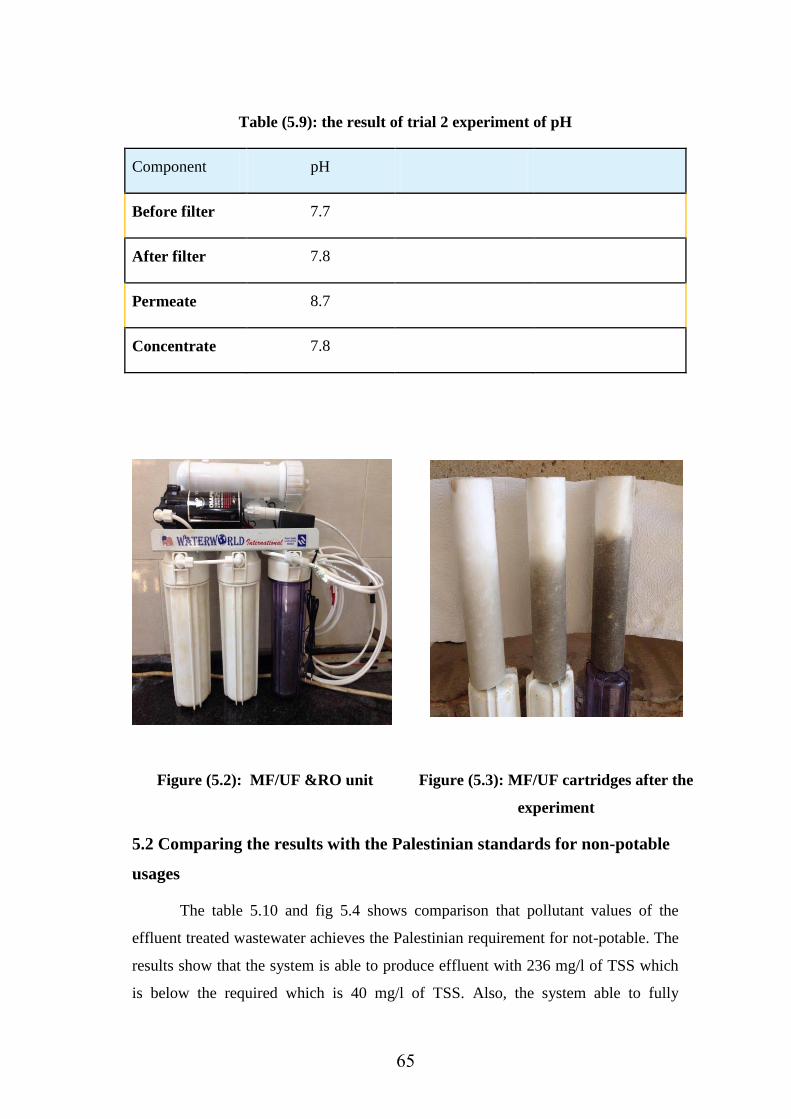
65
Table (5.9): the result of trial 2 experiment of pH
Component pH
Before filter 7.7
After filter 7.8
Permeate 8.7
Concentrate 7.8
Figure 1 MF/UF &RO unit
Figure (5.2): MF/UF &RO unit Figure (5.3): MF/UF cartridges after the
experiment
5.2 Comparing the results with the Palestinian standards for non-potable
usages
The table 5.10 and fig 5.4 shows comparison that pollutant values of the
effluent treated wastewater achieves the Palestinian requirement for not-potable. The
results show that the system is able to produce effluent with 236 mg/l of TSS which
is below the required which is 40 mg/l of TSS. Also, the system able to fully
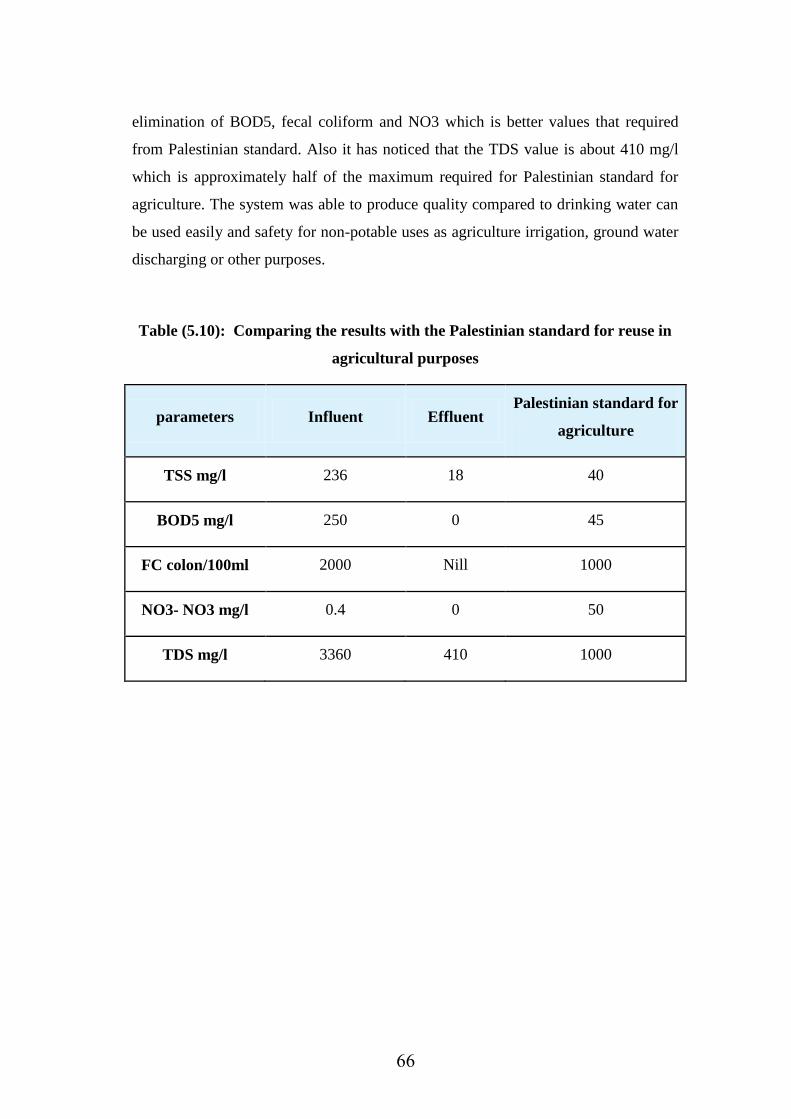
66
elimination of BOD5, fecal coliform and NO3 which is better values that required
from Palestinian standard. Also it has noticed that the TDS value is about 410 mg/l
which is approximately half of the maximum required for Palestinian standard for
agriculture. The system was able to produce quality compared to drinking water can
be used easily and safety for non-potable uses as agriculture irrigation, ground water
discharging or other purposes.
Table (5.10): Comparing the results with the Palestinian standard for reuse in
agricultural purposes
parameters Influent Effluent Palestinian standard for
agriculture
TSS mg/l 236 18 40
BOD5 mg/l 250 0 45
FC colon/100ml 2000 Nill 1000
NO3- NO3 mg/l 0.4 0 50
TDS mg/l 3360 410 1000
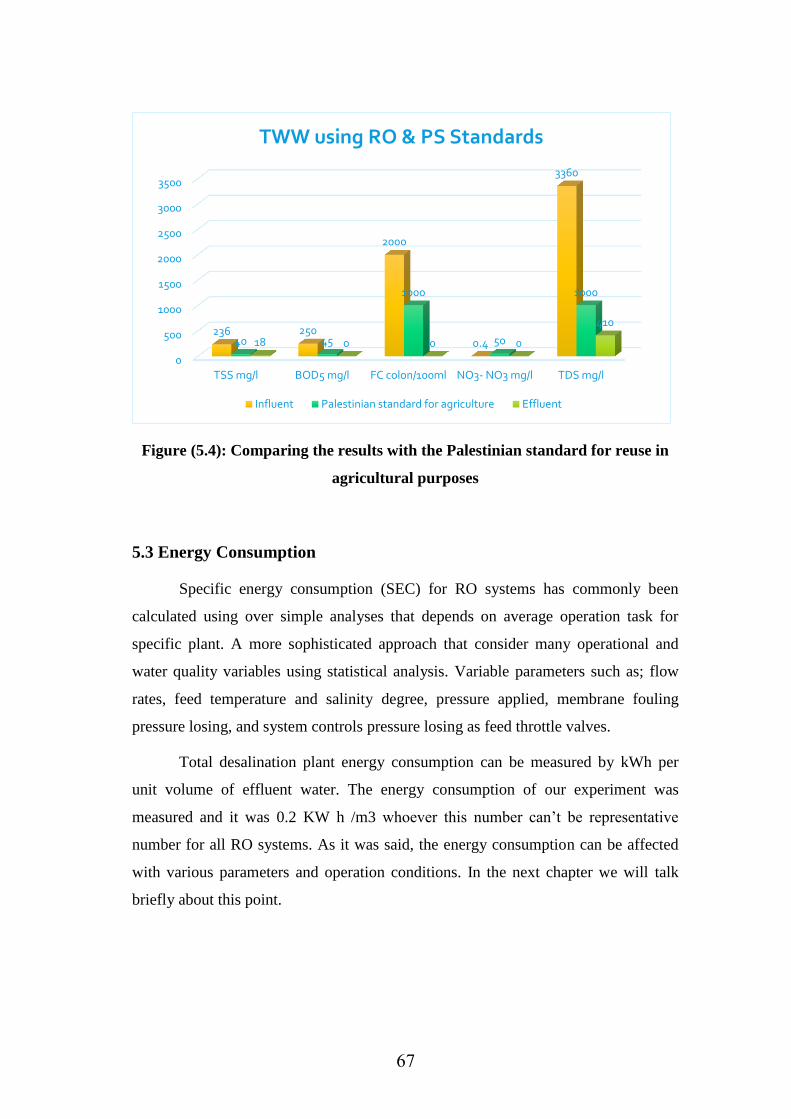
67
Figure (5.4): Comparing the results with the Palestinian standard for reuse in
agricultural purposes
5.3 Energy Consumption
Specific energy consumption (SEC) for RO systems has commonly been
calculated using over simple analyses that depends on average operation task for
specific plant. A more sophisticated approach that consider many operational and
water quality variables using statistical analysis. Variable parameters such as; flow
rates, feed temperature and salinity degree, pressure applied, membrane fouling
pressure losing, and system controls pressure losing as feed throttle valves.
Total desalination plant energy consumption can be measured by kWh per
unit volume of effluent water. The energy consumption of our experiment was
measured and it was 0.2 KW h /m3 whoever this number can‟t be representative
number for all RO systems. As it was said, the energy consumption can be affected
with various parameters and operation conditions. In the next chapter we will talk
briefly about this point.
0
500
1000
1500
2000
2500
3000
3500
TSS mg/l BOD5 mg/l FC colon/100ml NO3- NO3 mg/l TDS mg/l
236 250
2000
0.4
3360
40 45
1000
50
1000
18 0 0 0
410
TWW using RO & PS Standards
Influent Palestinian standard for agriculture Effluent
Chapter 6:
Cost Estimation
69
Chapter (6):
Cost Estimation
After the experiment part was performed and after the efficiency of membrane
technology as a post treatment for Gaza wastewater plant was examined, estimation
of the total cost and energy consumption has to be done to see if it is feasible to use
this kind of treatment or not.
It was difficult to make estimation of the cost by experiments except to calculate the
energy consumption roughly for this particular system, so in order to estimate
accurately the total cost and the exact energy consumption, two methods were
chosen. First method by make model simulate the experiment and see the output
results. Second method by make comparison study with the two largest plants in the
world Sulaibiya treatment plant in Kuwait and Orange country treatment plant in
USA. Because both plants are working since while and produce hundreds of
thousands cubic of reclaimed wastewater per day with stability and continuance,
faced all challenges and constrains relating to using RO in reclamation wastewater as
new technology.
6.1 Experiment Model
In order to make model simulate the experiment, Winflows program was chosen,
which is one of the best programs for designing and simulation the operation of
membrane systems. The program can simulate complex designs with a lot of
scenarios. Pretreatment unit like cartridge filter can be added to the simulation to
better represent the reality. Winflows also has some key new features that might not
be found in similar software offered by other manufacturers including:
3 Pass systems
Permeate Split and Recycle
Antiscalant Dosing
Energy Recovery Devices
Ability to Combine stages
The model was designed to treat 1000 m3/hour of tertiary treated wastewater with
assumed TDS 3800 and pH 7.8 with temperature 16C.
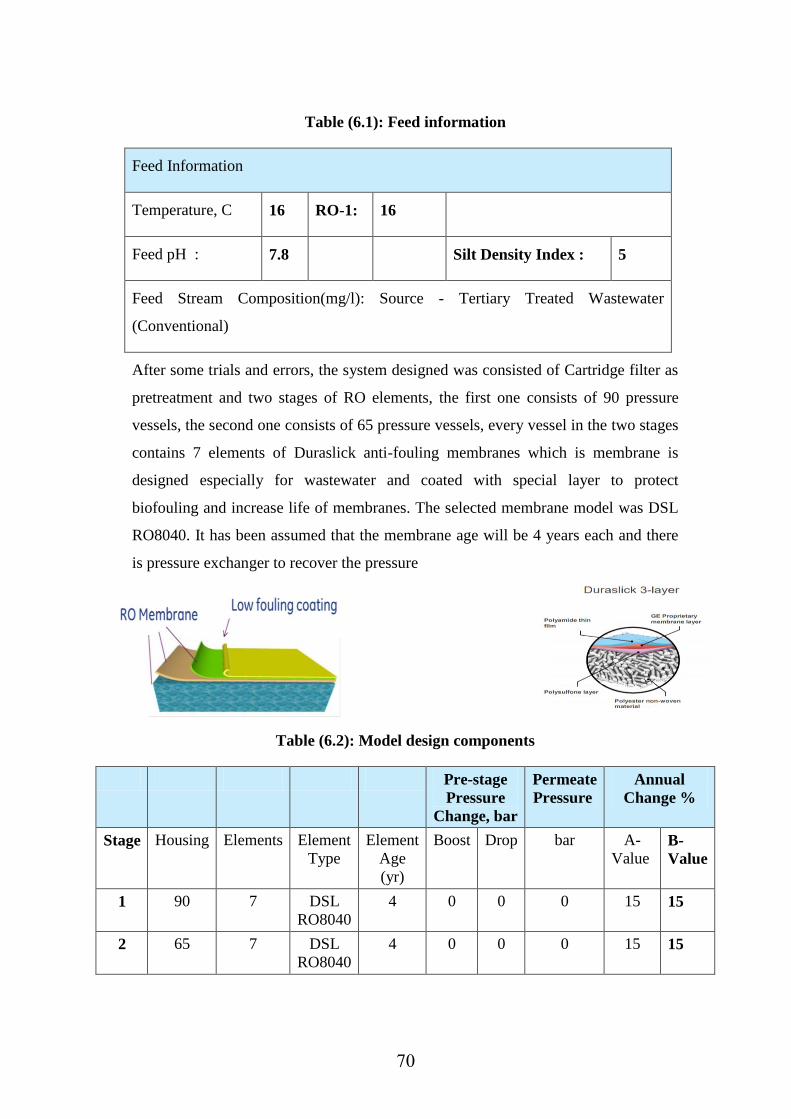
71
Table (6.1): Feed information
Feed Information
Temperature, C 16 RO-1: 16
Feed pH : 7.8 Silt Density Index : 5
Feed Stream Composition(mg/l): Source - Tertiary Treated Wastewater
(Conventional)
After some trials and errors, the system designed was consisted of Cartridge filter as
pretreatment and two stages of RO elements, the first one consists of 90 pressure
vessels, the second one consists of 65 pressure vessels, every vessel in the two stages
contains 7 elements of Duraslick anti-fouling membranes which is membrane is
designed especially for wastewater and coated with special layer to protect
biofouling and increase life of membranes. The selected membrane model was DSL
RO8040. It has been assumed that the membrane age will be 4 years each and there
is pressure exchanger to recover the pressure
Table (6.2): Model design components
Pre-stage
Pressure
Change, bar
Permeate
Pressure
Annual
Change %
Stage Housing Elements Element
Type
Element
Age
(yr)
Boost Drop bar A-
Value B-
Value
1 90 7 DSL
RO8040
4 0 0 0 15 15
2 65 7 DSL
RO8040
4 0 0 0 15 15
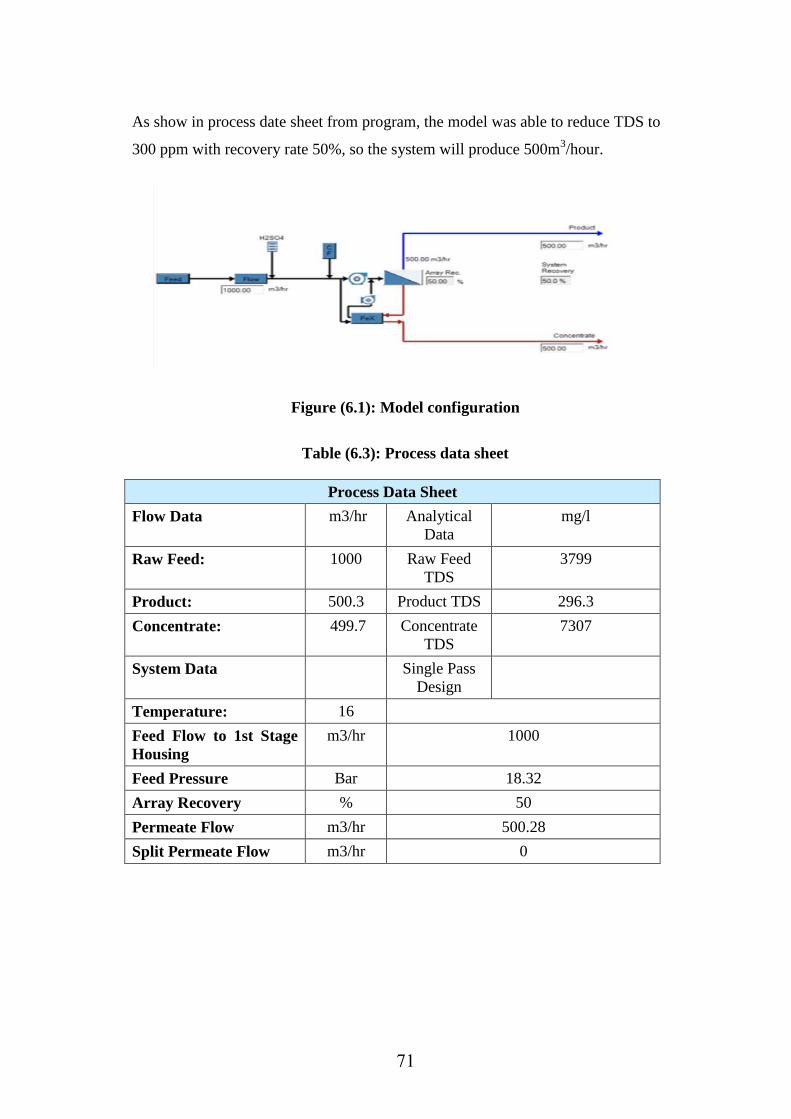
70
As show in process date sheet from program, the model was able to reduce TDS to
300 ppm with recovery rate 50%, so the system will produce 500m3/hour.
Figure (6.1): Model configuration
Table (6.3): Process data sheet
Process Data Sheet
Flow Data m3/hr Analytical
Data
mg/l
Raw Feed: 1000 Raw Feed
TDS
3799
Product: 500.3 Product TDS 296.3
Concentrate: 499.7 Concentrate
TDS
7307
System Data Single Pass
Design
Temperature: 16
Feed Flow to 1st Stage
Housing
m3/hr 1000
Feed Pressure Bar 18.32
Array Recovery % 50
Permeate Flow m3/hr 500.28
Split Permeate Flow m3/hr 0
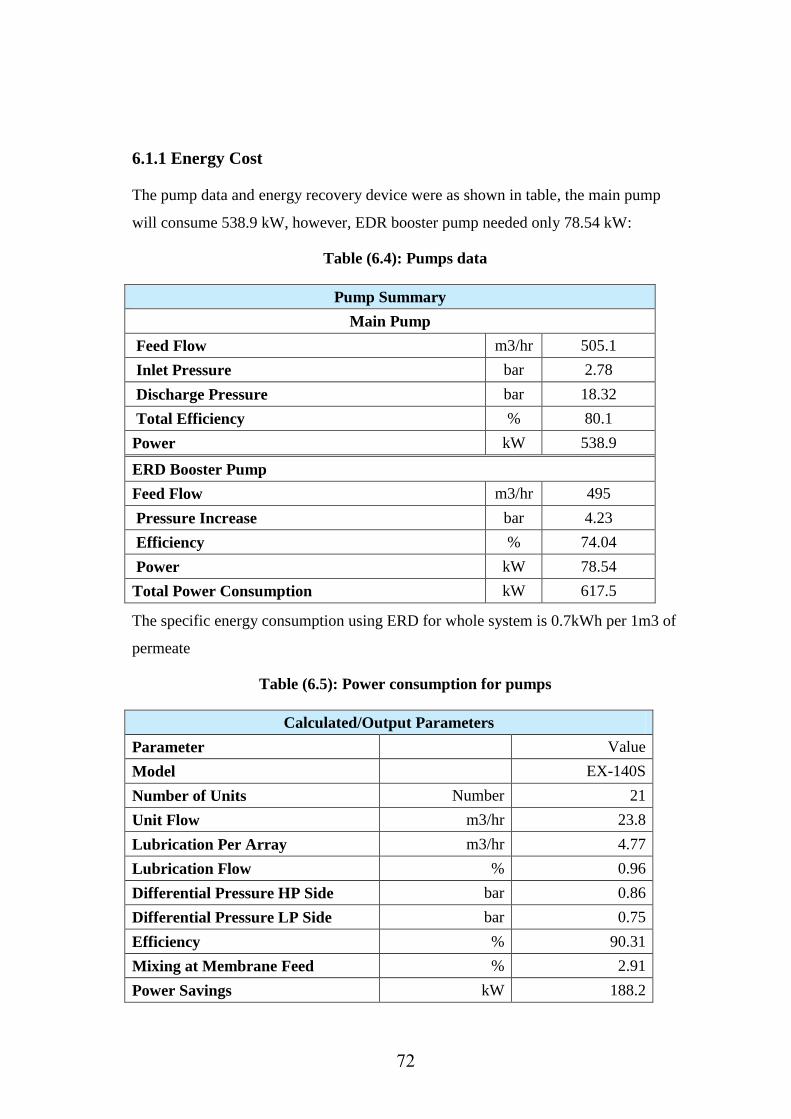
72
6.1.1 Energy Cost
The pump data and energy recovery device were as shown in table, the main pump
will consume 538.9 kW, however, EDR booster pump needed only 78.54 kW:
Table (6.4): Pumps data
Pump Summary
Main Pump
Feed Flow m3/hr 505.1
Inlet Pressure bar 2.78
Discharge Pressure bar 18.32
Total Efficiency % 80.1
Power kW 538.9
ERD Booster Pump
Feed Flow m3/hr 495
Pressure Increase bar 4.23
Efficiency % 74.04
Power kW 78.54
Total Power Consumption kW 617.5
The specific energy consumption using ERD for whole system is 0.7kWh per 1m3 of
permeate
Table (6.5): Power consumption for pumps
Calculated/Output Parameters
Parameter Value
Model EX-140S
Number of Units Number 21
Unit Flow m3/hr 23.8
Lubrication Per Array m3/hr 4.77
Lubrication Flow % 0.96
Differential Pressure HP Side bar 0.86
Differential Pressure LP Side bar 0.75
Efficiency % 90.31
Mixing at Membrane Feed % 2.91
Power Savings kW 188.2
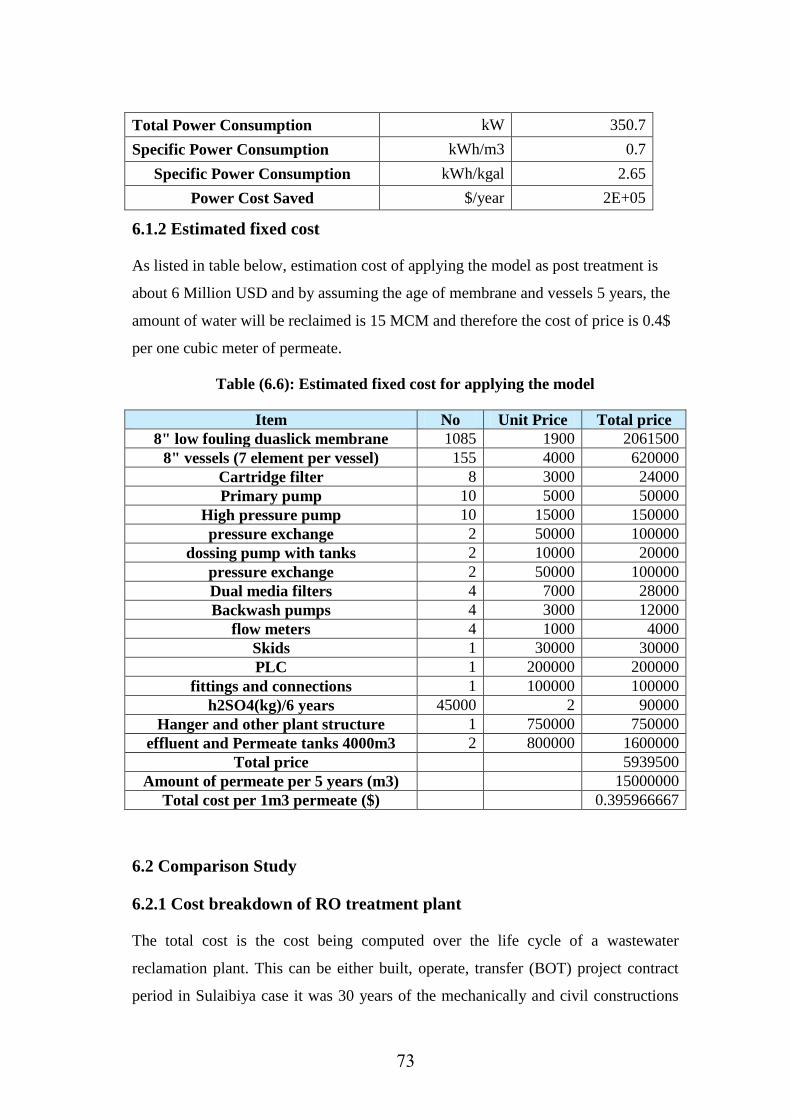
73
Total Power Consumption kW 350.7
Specific Power Consumption kWh/m3 0.7
Specific Power Consumption kWh/kgal 2.65
Power Cost Saved $/year 2E+05
6.1.2 Estimated fixed cost
As listed in table below, estimation cost of applying the model as post treatment is
about 6 Million USD and by assuming the age of membrane and vessels 5 years, the
amount of water will be reclaimed is 15 MCM and therefore the cost of price is 0.4$
per one cubic meter of permeate.
Table (6.6): Estimated fixed cost for applying the model
Item No Unit Price Total price
8" low fouling duaslick membrane 1085 1900 2061500
8" vessels (7 element per vessel) 155 4000 620000
Cartridge filter 8 3000 24000
Primary pump 10 5000 50000
High pressure pump 10 15000 150000
pressure exchange 2 50000 100000
dossing pump with tanks 2 10000 20000
pressure exchange 2 50000 100000
Dual media filters 4 7000 28000
Backwash pumps 4 3000 12000
flow meters 4 1000 4000
Skids 1 30000 30000
PLC 1 200000 200000
fittings and connections 1 100000 100000
h2SO4(kg)/6 years 45000 2 90000
Hanger and other plant structure 1 750000 750000
effluent and Permeate tanks 4000m3 2 800000 1600000
Total price 5939500
Amount of permeate per 5 years (m3) 15000000
Total cost per 1m3 permeate ($) 0.395966667
6.2 Comparison Study
6.2.1 Cost breakdown of RO treatment plant
The total cost is the cost being computed over the life cycle of a wastewater
reclamation plant. This can be either built, operate, transfer (BOT) project contract
period in Sulaibiya case it was 30 years of the mechanically and civil constructions
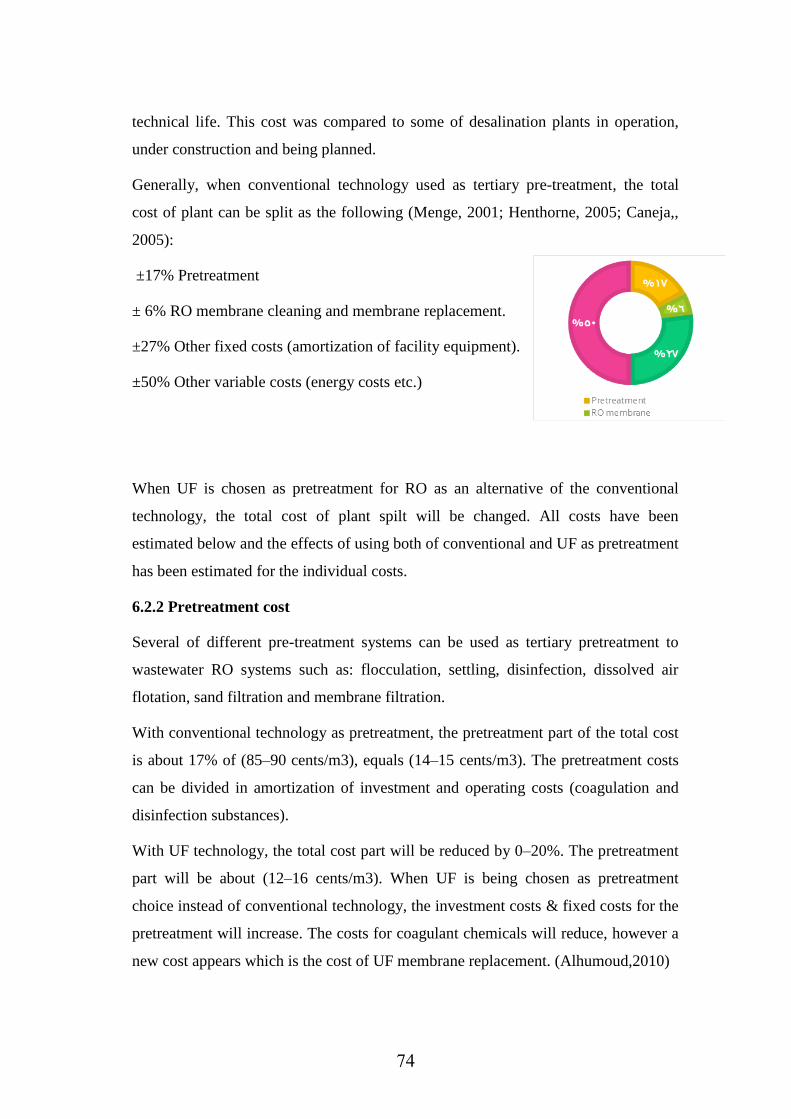
74
technical life. This cost was compared to some of desalination plants in operation,
under construction and being planned.
Generally, when conventional technology used as tertiary pre-treatment, the total
cost of plant can be split as the following (Menge, 2001; Henthorne, 2005; Caneja,,
2005):
±17% Pretreatment
± 6% RO membrane cleaning and membrane replacement.
±27% Other fixed costs (amortization of facility equipment).
±50% Other variable costs (energy costs etc.)
When UF is chosen as pretreatment for RO as an alternative of the conventional
technology, the total cost of plant spilt will be changed. All costs have been
estimated below and the effects of using both of conventional and UF as pretreatment
has been estimated for the individual costs.
6.2.2 Pretreatment cost
Several of different pre-treatment systems can be used as tertiary pretreatment to
wastewater RO systems such as: flocculation, settling, disinfection, dissolved air
flotation, sand filtration and membrane filtration.
With conventional technology as pretreatment, the pretreatment part of the total cost
is about 17% of (85–90 cents/m3), equals (14–15 cents/m3). The pretreatment costs
can be divided in amortization of investment and operating costs (coagulation and
disinfection substances).
With UF technology, the total cost part will be reduced by 0–20%. The pretreatment
part will be about (12–16 cents/m3). When UF is being chosen as pretreatment
choice instead of conventional technology, the investment costs & fixed costs for the
pretreatment will increase. The costs for coagulant chemicals will reduce, however a
new cost appears which is the cost of UF membrane replacement. (Alhumoud,2010)
75
6.2.3 RO Membrane Replacement and Cleaning
With conventional technology as pretreatment, the RO replacement and RO cleaning
part of the total cost is about 6% of (85–90 cents/m3), which equals about (5 US
cents/m3).
With UF pretreatment, the total cost part of RO membrane replacement and RO
membrane cleaning will be about (3–4 US cents/m3). The option over conventional
technology, the RO cleaning usually will be considerably minimized. (from once
every 2–3 months to once every 6–12 months). The RO membrane life time will be
maximized because of the minimized RO fouling and the minimized chemical attack
due to RO cleaning (Alhumoud,2010)
6.2.4 Other Fixed Costs
With conventional technology selected as pretreatment, the fixed costs part of the
total cost is about 27% of (85–90 cents/m3) which equals (23–24 cents/m3).
The fixed costs are a function of the service time of the treatment plant; the shorter
the service time, the more fixed costs will be. This is because the fixed costs are
being calculated divided by the total net effluent production over the service life
time. So, when the plant is not working, the net effluent production will be decreased
and the fixed costs per m3 will increases.
With UF pretreatment, it is estimated that the overall reduction of cost will be about
4% in the other fixed costs. With UF technology, the total cost part of other fixed
costs will be (22–23 cents/m3) (Alhumoud,2010)
Compared to conventional technology, UF will provide the following benefits:
Shorter construction time, so the net effluent production will increase.
RO plant will be operated more because the cleaning time is less frequency.
Other fixed costs, such as land price.
6.2.5 Other Variable Costs
With conventional technology as pretreatment, the variable costs part of the total cost
is about 50% of (85–90 cents/m3) which equals (42–45 cents/m3). With UF
membrane technology the variable costs will also be (42–45 cents/m3). Although,
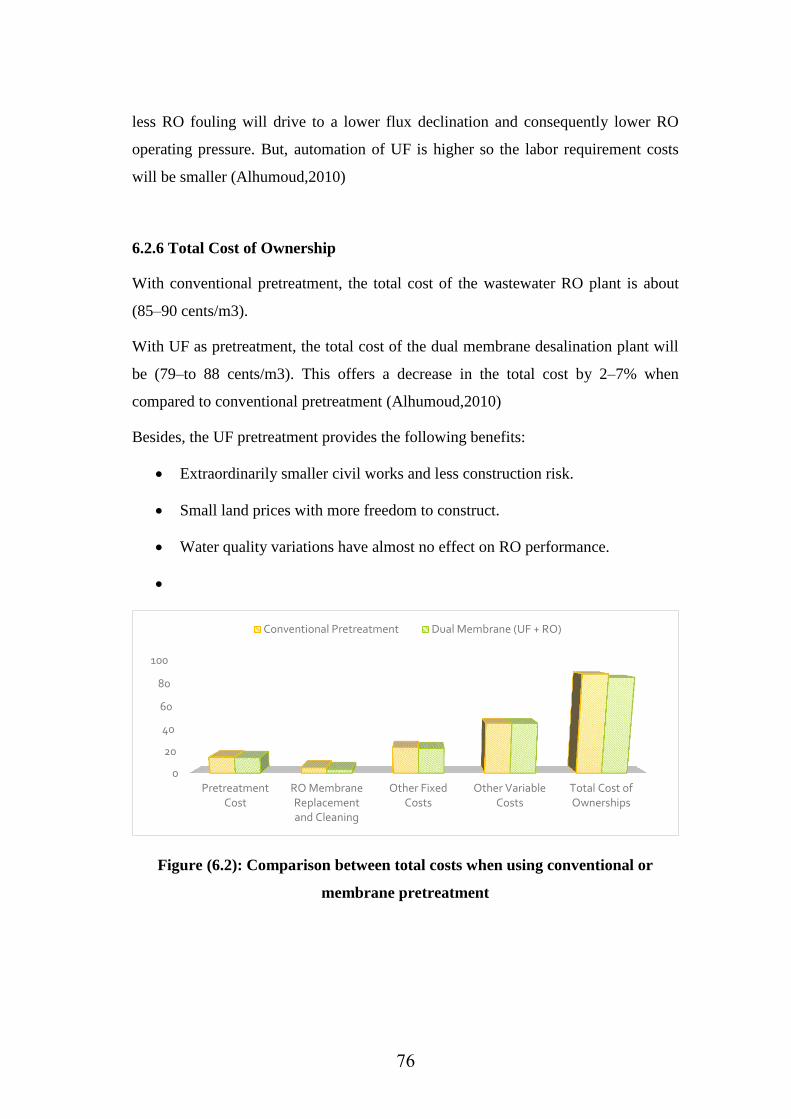
76
less RO fouling will drive to a lower flux declination and consequently lower RO
operating pressure. But, automation of UF is higher so the labor requirement costs
will be smaller (Alhumoud,2010)
6.2.6 Total Cost of Ownership
With conventional pretreatment, the total cost of the wastewater RO plant is about
(85–90 cents/m3).
With UF as pretreatment, the total cost of the dual membrane desalination plant will
be (79–to 88 cents/m3). This offers a decrease in the total cost by 2–7% when
compared to conventional pretreatment (Alhumoud,2010)
Besides, the UF pretreatment provides the following benefits:
Extraordinarily smaller civil works and less construction risk.
Small land prices with more freedom to construct.
Water quality variations have almost no effect on RO performance.
Figure (6.2): Comparison between total costs when using conventional or
membrane pretreatment
0
20
40
60
80
100
PretreatmentCost
RO MembraneReplacementand Cleaning
Other FixedCosts
Other VariableCosts
Total Cost ofOwnerships
Conventional Pretreatment Dual Membrane (UF + RO)
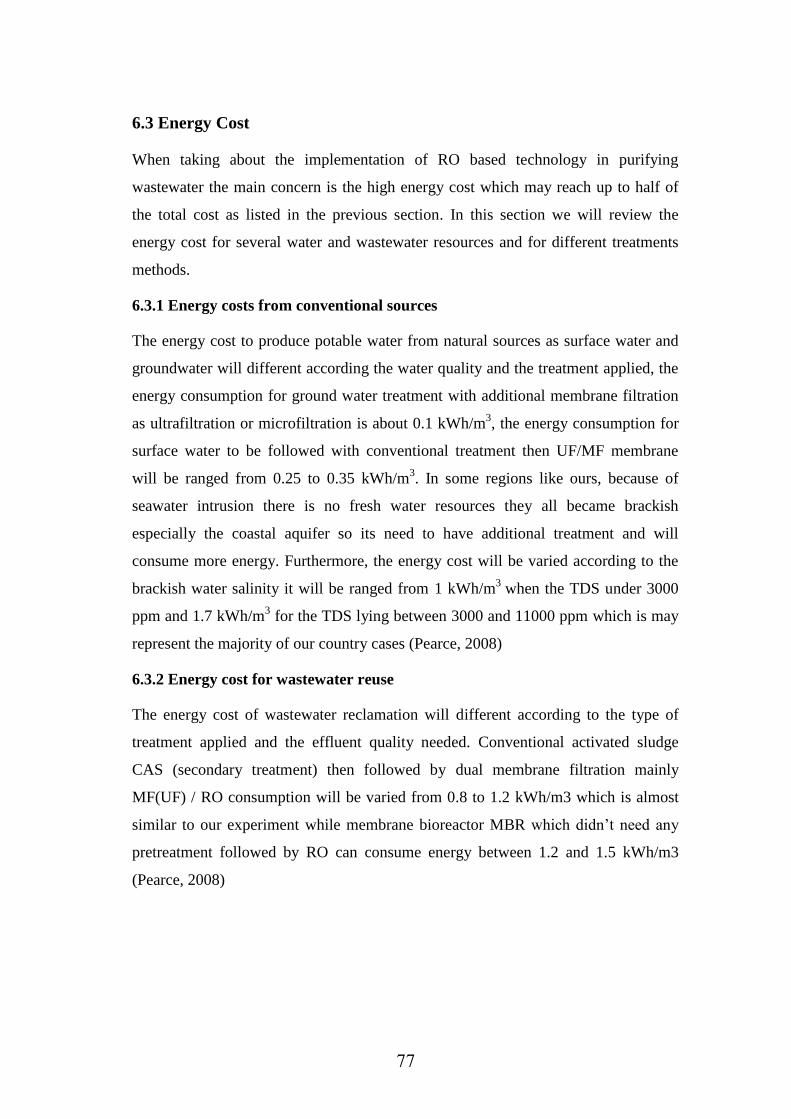
77
6.3 Energy Cost
When taking about the implementation of RO based technology in purifying
wastewater the main concern is the high energy cost which may reach up to half of
the total cost as listed in the previous section. In this section we will review the
energy cost for several water and wastewater resources and for different treatments
methods.
6.3.1 Energy costs from conventional sources
The energy cost to produce potable water from natural sources as surface water and
groundwater will different according the water quality and the treatment applied, the
energy consumption for ground water treatment with additional membrane filtration
as ultrafiltration or microfiltration is about 0.1 kWh/m3, the energy consumption for
surface water to be followed with conventional treatment then UF/MF membrane
will be ranged from 0.25 to 0.35 kWh/m3. In some regions like ours, because of
seawater intrusion there is no fresh water resources they all became brackish
especially the coastal aquifer so its need to have additional treatment and will
consume more energy. Furthermore, the energy cost will be varied according to the
brackish water salinity it will be ranged from 1 kWh/m3
when the TDS under 3000
ppm and 1.7 kWh/m3 for the TDS lying between 3000 and 11000 ppm which is may
represent the majority of our country cases (Pearce, 2008)
6.3.2 Energy cost for wastewater reuse
The energy cost of wastewater reclamation will different according to the type of
treatment applied and the effluent quality needed. Conventional activated sludge
CAS (secondary treatment) then followed by dual membrane filtration mainly
MF(UF) / RO consumption will be varied from 0.8 to 1.2 kWh/m3 which is almost
similar to our experiment while membrane bioreactor MBR which didn‟t need any
pretreatment followed by RO can consume energy between 1.2 and 1.5 kWh/m3
(Pearce, 2008)
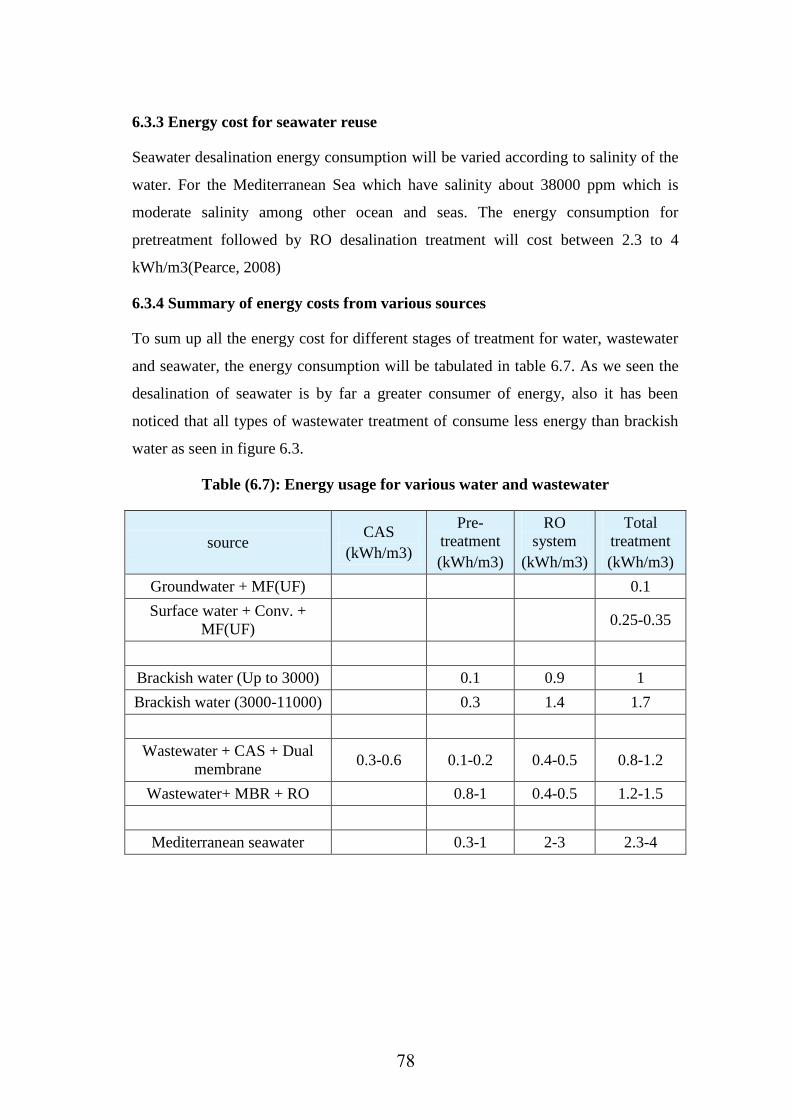
78
6.3.3 Energy cost for seawater reuse
Seawater desalination energy consumption will be varied according to salinity of the
water. For the Mediterranean Sea which have salinity about 38000 ppm which is
moderate salinity among other ocean and seas. The energy consumption for
pretreatment followed by RO desalination treatment will cost between 2.3 to 4
kWh/m3(Pearce, 2008)
6.3.4 Summary of energy costs from various sources
To sum up all the energy cost for different stages of treatment for water, wastewater
and seawater, the energy consumption will be tabulated in table 6.7. As we seen the
desalination of seawater is by far a greater consumer of energy, also it has been
noticed that all types of wastewater treatment of consume less energy than brackish
water as seen in figure 6.3.
Table (6.7): Energy usage for various water and wastewater
source CAS
(kWh/m3)
Pre-
treatment
(kWh/m3)
RO
system
(kWh/m3)
Total
treatment
(kWh/m3)
Groundwater + MF(UF) 0.1
Surface water + Conv. +
MF(UF) 0.25-0.35
Brackish water (Up to 3000) 0.1 0.9 1
Brackish water (3000-11000) 0.3 1.4 1.7
Wastewater + CAS + Dual
membrane 0.3-0.6 0.1-0.2 0.4-0.5 0.8-1.2
Wastewater+ MBR + RO 0.8-1 0.4-0.5 1.2-1.5
Mediterranean seawater 0.3-1 2-3 2.3-4
79
00.5
11.5
22.5
33.5
4
0.5 0.1 0.3 0.2 1 1 0.9
1.4 0.5 0.5
3
ENERGY CONSUMPTION
CAS Pre-treatment RO system
Figure (6.3): Energy consumption for different type of treatment
6.3 Conclusion
Post treatment for wastewater using RO technology became mature technology and
its market has rapidly increased over the last fifty years and became more
economically attractive and will be better through years.
It has been noticed that using membrane filtration like UF is better than conventional
treatment when we talk about pretreatment for RO treatment. It is estimated from the
model that the fixed cost only of 1m3 of permeate will cost about 40 cent and it‟s
estimated from comparison study that one cubic of treated wastewater will cost
around 88 cents for all stages of treatment when conventional pretreatment was
employed, followed by RO membranes and this price, with UF pretreatment. This
prices of course exclude the primary and secondary biological treatment of
wastewater.
The energy consumption for wastewater treatment using RO as post treatment
preceded by UF membrane will consume around 0.7 Kwh/m3 without the primary
and secondary biological treatment of wastewater that the will consume in average
0.45 Kwh/m3, which is by far less than the consumption from other alternative
solution as 1.7 Kwh/m3 for brackish water desalination and up to 4 Kwh/m
3 for

81
seawater desalination. So, comparing to the quality than can offered from RO post
treatment for wastewater and in country suffers from low electricity is sound
attractive solution.
Others financial benefit of reusing RO treated wastewater are the value of fresh water
saved and the cost of the alternate safe disposal of the effluent to ecosystem.

Chapter 7 :
Conclusion and Recommendations
82
Chapter (7):
Conclusion and Recommendations
7.1 Conclusion
The constructed system shows high ability to remove 92.4% of TSS, 100% of
BOD, 87.8% of TDS, 100% of FC and 100% of No3
Sand filter have the ability to reduce 40% of SS which increase the ability of
RO membrane to purify wastewater.
Using other membrane types of pretreatment such as MF or UF increase the
RO removal efficiency, minimize fouling and increase life of RO membranes.
The system able to produce effluent with potable water quality for non-
potable usage such as agriculture and groundwater recharging, and this
quality meets the Palestinian and international standards.
The estimated total cost for one cubic meter of reclaimed wastewater when
using RO as post treatment preceded by UF pretreatment is about 88 cents.
The main drivers for RO include the low energy consumption and the high
rate of contaminant removal. It‟s estimated that the UF following with RO
will seawater consume about (0.7) Kw h /m3 less than the power needed for
brackish or seawater desalination.
7.2 Recommendations
This study clarifies the ability of RO technology to improve wastewaters
quality to meet PS standards so we recommend to build additional post RO
treatment units in the current WWTPs as post treatment to use the effluent in
agriculture and groundwater recharging to aquifer replenishment instead of
dispose this enormous amount of water to seawater.
The political situation in Gaza is unstable and consequently affects the
donor‟s contribution towards developing the water sector in general and
temporarily solutions becomes permanent solution. So, RO WWTPs should
be part of the development plant of the Palestinian Authority until a real
sensible alternative is existed on the ground.

83
The consumption of power for wastewater treatment is lower than seawater or
brackish water desalination, so it is a favorite solution especially in country
has lack of electricity and has lack of traditional source of water.
Further study to identify the exact cost of treatment plant and investigate
economic feasibility for users.

84
REFERENCES
85
REFERENCES
Afifi S, Bezazew N, .Arakelyan K, Nasser A. and T. Wise. (2013). Using reed bed
system for wastewater treatment and reuse in urban semi/ urban community in
Gaza – Palestine. 36th WEDC International Conference, Nakuru, Kenya
Afifi, S. (2006). Wastewater reuse status in the Gaza Strip, Palestine. International
journal of environment and pollution, 28(1-2), 76-86.
Afifi, S.(2009). Up dated Report of - Baseline Budget under the Provision of the SAP
in Gaza Strip – Palestinian Authority. Strategic Action Programme SAP, MED-
POL, UNEP
Afifi, S., Elmanama, A., & Shubair, M. (2000). Microbiological assessment of beach
quality in Gaza Strip. Egypt. J. Med. Lab. Sci, 9(1), 51-63.
AHT Group AG (2009). Identification and Removal of Bottlenecks for extended use
of Wastewater for Irrigation or for other Purposes, MEDA-Countries, Summary
Report.
Akther, N., Sodiq, A., Giwa, A., Daer, S., Arafat, H. A., & Hasan, S. W. (2015).
Recent advancements in forward osmosis desalination: a review. Chemical
Engineering Journal, (281), 502-522.
Anderson, D., Siegrist, R., and R. Otis, (1985). Technology Assessment of
Intermlti'ent Sand Filters. Research Division. Municipal Environmental
Research Laboratory, EPA.
Anderson, J. E., Hoffman, S. J., & Peters, C. R. (1972). Factors influencing reverse
osmosis rejection of organic solutes from aqueous solution. The Journal of
Physical Chemistry, 76(26), 4006-4011.
Angelakis, A. N., & Bontoux, L. (2001). Wastewater reclamation and reuse in
Eureau countries. Water Policy, 3(1), 47-59.
APHA, AWWA and WEF. (1998). Standard Methods for the Examination of
Water and Wastewater. (20th
Edition). American public health association.
ARIJ. (2015c). Water and Environment Research Department Database. Bethlehem
- Palestine.
86
Asano, T. and Levine, A. (1998). Wastewater Reclamation, Recycling and Reuse:
Introduction. In: Asano, T. (ed.), Wastewater Reclamation and Reuse, CRC
Press, Boca Raton, Florida, USA
AWWA. (2001). AWWA Standard For granular Filter Material, USA.
Bartels, C., Franks, R., & Andes, K. (2010). Operational performance and
optimization of RO wastewater treatment plants. Technical paper, Hydranautics,
Oceanside, CA, USA.
Beril Gönde , Z , Kaya, Y , Vergili ,I and Barlas,H. (2010). Optimization of
filtration conditions for CIP wastewater treatment by Nano filtration process
using Taguchi approach, El Sevier Journal, (40), 265-270.
Bouregba, N., Benmimoun, Y., Meddah, B., Tilmatine, A., & Ouldmoumna, A.
(2016). Ozonation of wastewater in Algeria by dielectric barrier discharge.
Desalination and Water Treatment, 57(4), 1824-1835.
Coastal Municipalities Water Utility (CMWU), (2011). Summary about Water and
Wastewater Situation in Gaza Strip.
Dr. Jasem M. Alhumoud , Hanouf Al-Humaidi , Ibrahim N. Al-Ghusain , Ali M.
Alhumoud. (2010). International Business & Economics Research Journal –
Cost/Benefit Evaluation Of Sulaibiya Wastewater Treatment Plant In Kuwait
Duvel Jr, W. A., & Helfgott, T. (1975). Removal of wastewater organics by reverse
osmosis. Journal (Water Pollution Control Federation), 57-65.
Edwards, V. H., & Schubert, P. F. (1974). Removal of 2, 4‐D and Other Persistent
Organic Molecules From Water Supplies by Reverse Osmosis. Journal‐
American Water Works Association, 66(10), 610-616.
EL-Dahdouh, O.(2014). Performance Evaluation of Sand Filter in Improvement of
Effluent Wastewater from Gaza Wastewater Treatment Plant. (Unpublished
Master Thesis). The Islamic university of Gzaz.
El-Nahhal, I., Al-Najar, H., & El-Nahhal, Y. (2014). Cations and Anions in Sewage
Sludge from Gaza Waste Water Treatment Plant. American Journal of
Analytical Chemistry, 5(10), 655.
87
Feigin, A., Ravina, I., & Shalhevet, J. (2012). Irrigation with treated sewage effluent:
management for environmental protection. Springer Science & Business Media.
Hamoda, M. F., Attia, N. F., & Al-Ghusain, I. A. (2015). Performance evaluation of
a wastewater reclamation plant using ultrafiltration and reverse osmosis.
Desalination and Water Treatment, 54(11), 2928-2938
Huertas, E., Salgot, M., Hollender, J., Weber, S., Dott, W., Khan, S., ... & Chikurel,
H. (2008). Key objectives for water reuse concepts. Desalination, 218(1-3), 120-
131.
Jarboo, M., & Al-Najar, H. (2015). Climate change and its impact on domestic water
consumption in Sub-urban regions in the Gaza Strip. International Journal of
Climate Change Strategies and Management, 7(1), 3-16.
Judd, S., & Jefferson, B. (Eds.). (2003). Membranes for industrial wastewater
recovery and re-use. Elsevier.
Khan, A. M. (1995). Removal of Coliphage and Bacteria Through, Slow Sand
Filtration .Dhahran, saudi arabia: Thesis in faculty of the college of gaduate .
studies,king fahd university of petroleum
Kim, C and Lee, K. (2005). Dyeing process wastewater treatment using fouling
resistant Nano filtration and reverse osmosis membranes, El Sevier Journal,
(40), 246-250
M.F. Hamoda et al. (2015). Desalination and Water Treatment. (54), 2928–2938.
Madaeni. S.S. and Koocheki, S. (2006). Application of taguchi method in the
optimization of wastewater treatment using spiral-wound reverse osmosis
element, El Sevier Journal (chemical Engineering). (40) , 20-35
Metcalf & Eddy (2013). wastewater engineering treatment and reuse. (4th
edition).
Mizyed N. (2013). Challenges to treated wastewater reuse in arid and semi-arid
areas. Environmental science and policy 25(2013), 186-195.
New Jersey department of environmental protection. (NJDEP) (2005). Reclaimed
Water For Beneficial Reuse. Technical manual.
P.W.A (Palestinian Water Authority), (2012). Feasibility Study for the Wastewater
Reuse at Southern Part of Gaza Strip.
88
Palestine Standards Institute. (2003). Treated wastewater, Palestine Standards
Institute
Palestine. PCBS and MOA. (2011). Press Conference on the Preliminary Findings of
Agriculture Census-2010: Palestinian Central Bearue of Statistics and ministry
of Agriculture .Palestine.
Palestinian Central Bearue of Statistics. (2007). Environmental Households Survey in
West Bank and Gaza Strip Palestinian Central Bearue of Statistics. Palestinian
Central Bearue of Statistics
Palestinian Water Authority (PWA), (2011). The Comparative Study of Options for
an Additional Supply of Water for the Gaza Strip (CSO-G), The Updated Final
Report
Palestinian Water Authority (PWA), (2012a). Water Supply report. available on
15/04/2019, From: http://pwa.ps/userfiles/file .
Palestinian Water Authority (PWA), (2012b). Annual Status Report on water
resources, Water Supply, and Wastewater in the Occupied State of Palestine
2011, available at http://pwa.ps/userfiles/file ,
Palestinian Water Authority (PWA), (2013). National Water and Wastewater
Strategy for Palestine, Toward Building a Palestinian State from Water
Perspective.
Pearce, G. K. (2008). UF/MF pre-treatment to RO in seawater and wastewater reuse
applications: a comparison of energy costs. Desalination, 222(1-3), 66-73.
Polprasert, C. (1996). Organic Waste Recycling. (2nd
edition). London: John Wiley
and Sons.
S.E. Clark (2007). Runoff polishing by natural media filtration: Up flow vs
.downflow.” M. Pratap, S.E. Clark, R. Pitt, U. Khambhammettu, C. Roenning, D
Treese, C.Y.S. Siu. Pennsylvania Storm water Management Symposium,
Villanova Urban Storm water Partnership, Villanova.
Samhan, S. (2008). Obstacles to enhance groundwater aquifer by reclaimed water
using artificial recharge as a reuse option in West Bank/Palestine.
Shannon, M. A., Bohn, P. W., Elimelech, M., Georgiadis, J. G., Marinas, B. J., &
Mayes, A. M. (2010). Science and technology for water purification in the
89
coming decades. In Nanoscience And Technology: A Collection of Reviews
from Nature Journals.
Shuckrow, A. J., Pajak, A. P., & Osheka, J. W. (1981). Concentration technologies
for hazardous aqueous waste treatment.
Sourirajan, S. (1970). Reverse osmosis. London, UK: Logos Press Ltd.
Sourirajan, S., & Matsuura, T. (1985). Reverse osmosis and ultrafiltration. American
Chemical Society.
Torrens, A., Molle, P., Boutin, C., & Salgot, M. (2009). Impact of design and
operation variables on the performance of vertical-flow constructed wetlands
and intermittent sand filters treating pond effluent. Water research, 43(7), 1851-
1858.
Tubail, K. M., Jamal Y. Al-Dadah and Maged M. Yassin (2003), Present and
Prospect Situation of Wastewater and its Possible Reuse in the Gaza Strip.
UNICEF .(2000). Global Water Supply and Sanitation Assessment Report. UNICEF
Wilf, M and Long, J. (2005). Design considerations for wastewater treatment by
reverse osmosis, El Sevier Journal,(40), 7-10
Woelkers, D., Pitt, B., and S. Clark (2006). Storm water Treatment Filtration as a
Storm water Control. Storm con Denve.
World Bank, (2009). West bank and Gaza, Assessment of restrictions on Palestinian
water sector development. World Bank
World Bank. (2007). Making the most of scarcity: accountability for better water
management results in the Middle East and North Africa. World Bank
Publications.
Zurita F.,& White J., (2014). Comparative Study of Three Two-Stage Hybrid
Ecological Wastewater Treatment Systems for Producing High Nutrient ,
Reclaimed Water for Irrigation Reuse in Developing Countries, Water
journal,(6), 213-228 .