Embed Size (px)
Citation preview

/2017
No. 03
RETURN AND RISKGOVERNMENT PENSION FUND GLOBAL

Our missionis to safeguardand build financial wealth for future generations

Content
2017
INVESTMENTS
1.1 The fund’s investments _________ 2
1.2 Benchmark index _____ 10
1.3 Reference portfolio ___ 18
RETURN
2.1 Return _______________ 26
2.2 Relative return _______ 34
2.3 Return and cost ______ 46
RISK
3.1 Risk _________________ 50
3.2 Relative risk _________ 54
3.3 Risk adjustments ____ 60
APPENDIX Available on www.nbim.no
Factor and risk-adjusted return
1 2 3
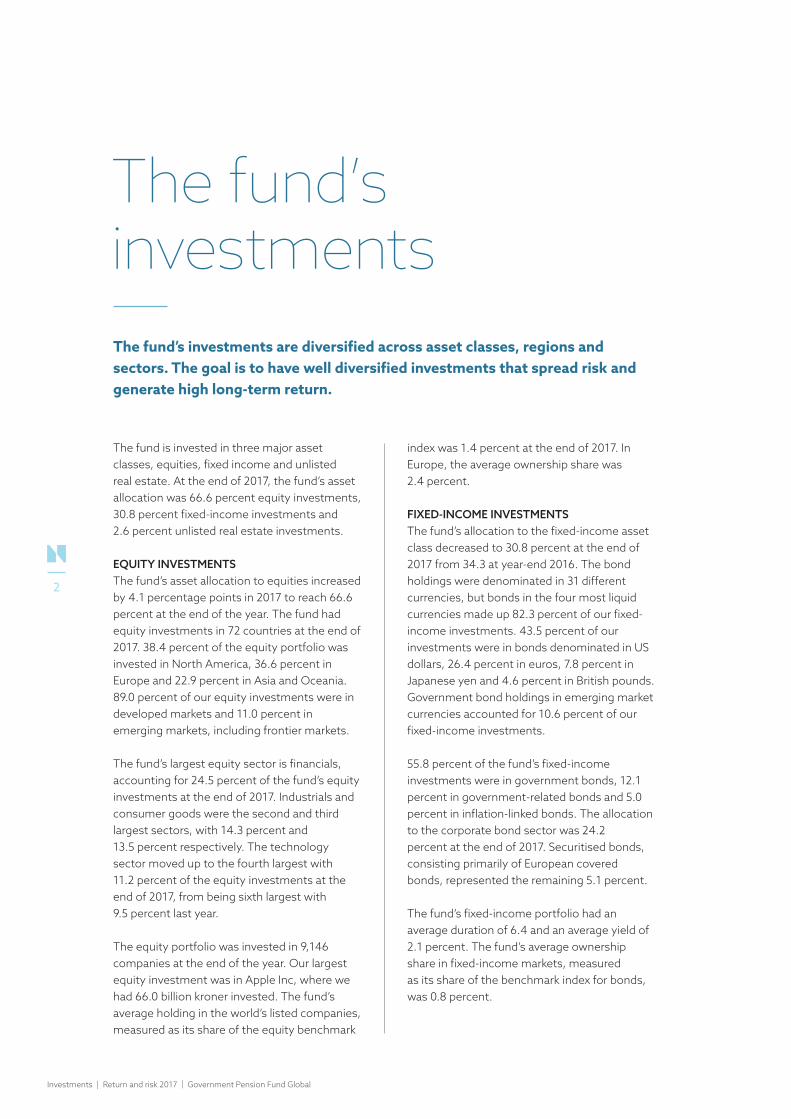
The fund’s investmentsThe fund’s investments are diversified across asset classes, regions and sectors. The goal is to have well diversified investments that spread risk and generate high long-term return.
The fund is invested in three major asset classes, equities, fixed income and unlisted real estate. At the end of 2017, the fund’s asset allocation was 66.6 percent equity investments, 30.8 percent fixed-income investments and 2.6 percent unlisted real estate investments.
EQUITY INVESTMENTSThe fund’s asset allocation to equities increased by 4.1 percentage points in 2017 to reach 66.6 percent at the end of the year. The fund had equity investments in 72 countries at the end of 2017. 38.4 percent of the equity portfolio was invested in North America, 36.6 percent in Europe and 22.9 percent in Asia and Oceania. 89.0 percent of our equity investments were in developed markets and 11.0 percent in emerging markets, including frontier markets.
The fund’s largest equity sector is financials, accounting for 24.5 percent of the fund’s equity investments at the end of 2017. Industrials and consumer goods were the second and third largest sectors, with 14.3 percent and 13.5 percent respectively. The technology sector moved up to the fourth largest with 11.2 percent of the equity investments at the end of 2017, from being sixth largest with 9.5 percent last year.
The equity portfolio was invested in 9,146 companies at the end of the year. Our largest equity investment was in Apple Inc, where we had 66.0 billion kroner invested. The fund’s average holding in the world’s listed companies, measured as its share of the equity benchmark
index was 1.4 percent at the end of 2017. In Europe, the average ownership share was 2.4 percent.
FIXED-INCOME INVESTMENTSThe fund’s allocation to the fixed-income asset class decreased to 30.8 percent at the end of 2017 from 34.3 at year-end 2016. The bond holdings were denominated in 31 different currencies, but bonds in the four most liquid currencies made up 82.3 percent of our fixed-income investments. 43.5 percent of our investments were in bonds denominated in US dollars, 26.4 percent in euros, 7.8 percent in Japanese yen and 4.6 percent in British pounds. Government bond holdings in emerging market currencies accounted for 10.6 percent of our fixed-income investments.
55.8 percent of the fund’s fixed-income investments were in government bonds, 12.1 percent in government-related bonds and 5.0 percent in inflation-linked bonds. The allocation to the corporate bond sector was 24.2 percent at the end of 2017. Securitised bonds, consisting primarily of European covered bonds, represented the remaining 5.1 percent.
The fund’s fixed-income portfolio had an average duration of 6.4 and an average yield of 2.1 percent. The fund’s average ownership share in fixed-income markets, measured as its share of the benchmark index for bonds, was 0.8 percent.
Investments | Return and risk 2017 | Government Pension Fund Global
2
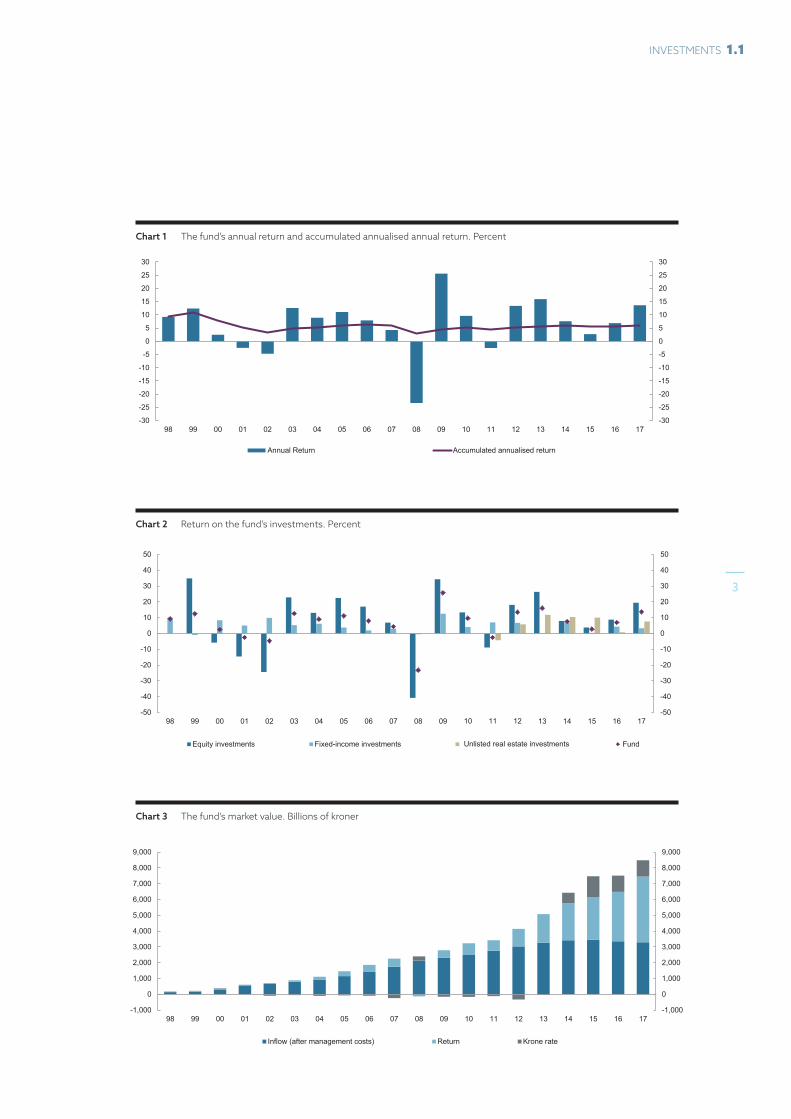
Chart 1 The fund’s annual return and accumulated annualised annual return. Percent
Chart 2 Return on the fund’s investments. Percent
Chart 3 The fund’s market value. Billions of kroner
Chart 1 The fund’s annual return and accumulated annualised return. Percent
Updated: AMF 06/02/2018
-30
-25
-20
-15
-10
-5
0
5
10
15
20
25
30
-30
-25
-20
-15
-10
-5
0
5
10
15
20
25
30
98 99 00 01 02 03 04 05 06 07 08 09 10 11 12 13 14 15 16 17
Annual Return Accumulated annualised return
-50
-40
-30
-20
-10
0
10
20
30
40
50
-50
-40
-30
-20
-10
0
10
20
30
40
50
98 99 00 01 02 03 04 05 06 07 08 09 13 14 15 16 17
Equity investments Fixed-income investments
10 11 12
Unlisted real estate investments Fund
Chart 2 Annual return for equity, fixed-income and real estate investments and total fund. Percent
Updated: AMF 06/02/2018
Chart 3 The fund’s market value. Billions of kroner
Updated: AMF 06/02/2018
-1,000
0
1,000
2,000
3,000
4,000
5,000
6,000
7,000
8,000
9,000
-1,000
0
1,000
2,000
3,000
4,000
5,000
6,000
7,000
8,000
9,000
98 99 00 01 02 03 04 05 06 07 08 09 10 11 12 13 14 15 16 17
Inflow (after management costs) Return Krone rate
3
INVESTMENTS 1.1

Table 2 Sector composition of the fund’s equity holdings
SectorMillions
of kroner 1 Percent
Financials 1,383,198 24.5
Banks 596,252 10.5
Insurance 289,389 5.1
Real estate 280,087 5.0
Financial services 217,471 3.8
Industrials 809,835 14.3
Industrial goods and services 675,593 12.0
Construction and materials 134,242 2.4
Consumer goods 765,236 13.5
Personal and household goods 317,081 5.6
Food and beverage 257,243 4.6
Automobiles and parts 190,912 3.4
Technology 632,572 11.2
Technology 632,572 11.2
Consumer services 572,093 10.1
Retail 285,602 5.1
Travel and leisure 155,323 2.7
Media 131,168 2.3
Health care 554,178 9.8
Health care 554,178 9.8
Basic materials 338,655 6.0
Chemicals 202,972 3.6
Basic resources 135,683 2.4
Oil and gas 316,470 5.6
Oil and gas 316,470 5.6
Telecommunications 160,675 2.8
Telecommunications 160,675 2.8
Utilities 147,616 2.6
Utilities 147,616 2.6
1 Does not sum up to total market value due to cash and derivatives.
Table 1 Regional composition of the fund’s equity holdings
RegionMillions
of kroner 1 Percent
North America 2,170,044 38.4
United States 2,042,110 36.1
Canada 127,934 2.3
Europe 2,067,090 36.6
United Kingdom 548,581 9.7
Germany 344,548 6.1
France 289,270 5.1
Switzerland 261,167 4.6
Sweden 102,550 1.8
Netherlands 100,803 1.8
Spain 100,020 1.8
Italy 93,130 1.6
Denmark 62,687 1.1
Belgium 48,925 0.9
Finland 32,661 0.6
Asia 1,164,973 20.6
Japan 517,074 9.1
China 202,687 3.6
South Korea 110,443 2.0
Taiwan 90,806 1.6
Hong Kong 79,600 1.4
India 66,301 1.2
Oceania 129,489 2.3
Australia 122,914 2.2
Latin America 81,003 1.4
Brazil 49,265 0.9
Africa 46,506 0.8
South Africa 40,609 0.7
Middle East 21,423 0.4
1 Does not sum up to total market value due to cash and derivatives.
Investments | Return and risk 2017 | Government Pension Fund Global
4
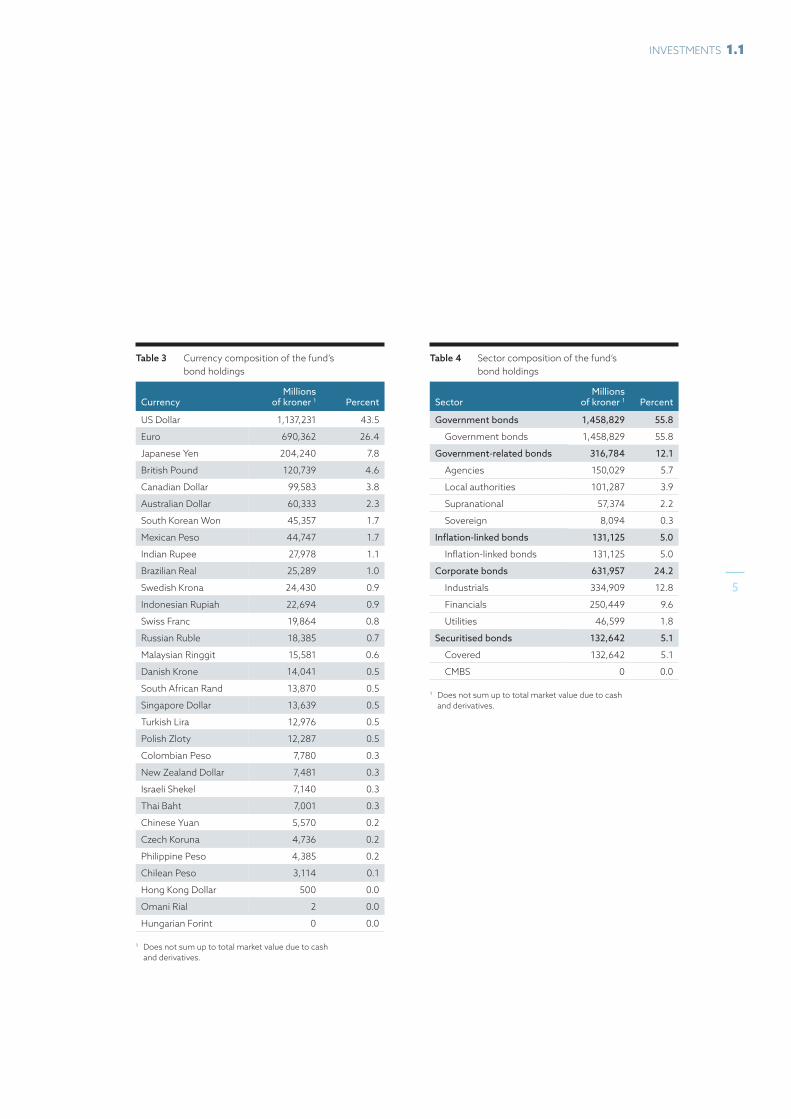
Table 4 Sector composition of the fund’s bond holdings
SectorMillions
of kroner 1 Percent
Government bonds 1,458,829 55.8
Government bonds 1,458,829 55.8
Government-related bonds 316,784 12.1
Agencies 150,029 5.7
Local authorities 101,287 3.9
Supranational 57,374 2.2
Sovereign 8,094 0.3
Inflation-linked bonds 131,125 5.0
Inflation-linked bonds 131,125 5.0
Corporate bonds 631,957 24.2
Industrials 334,909 12.8
Financials 250,449 9.6
Utilities 46,599 1.8
Securitised bonds 132,642 5.1
Covered 132,642 5.1
CMBS 0 0.0
1 Does not sum up to total market value due to cash and derivatives.
Table 3 Currency composition of the fund’s bond holdings
CurrencyMillions
of kroner 1 Percent
US Dollar 1,137,231 43.5
Euro 690,362 26.4
Japanese Yen 204,240 7.8
British Pound 120,739 4.6
Canadian Dollar 99,583 3.8
Australian Dollar 60,333 2.3
South Korean Won 45,357 1.7
Mexican Peso 44,747 1.7
Indian Rupee 27,978 1.1
Brazilian Real 25,289 1.0
Swedish Krona 24,430 0.9
Indonesian Rupiah 22,694 0.9
Swiss Franc 19,864 0.8
Russian Ruble 18,385 0.7
Malaysian Ringgit 15,581 0.6
Danish Krone 14,041 0.5
South African Rand 13,870 0.5
Singapore Dollar 13,639 0.5
Turkish Lira 12,976 0.5
Polish Zloty 12,287 0.5
Colombian Peso 7,780 0.3
New Zealand Dollar 7,481 0.3
Israeli Shekel 7,140 0.3
Thai Baht 7,001 0.3
Chinese Yuan 5,570 0.2
Czech Koruna 4,736 0.2
Philippine Peso 4,385 0.2
Chilean Peso 3,114 0.1
Hong Kong Dollar 500 0.0
Omani Rial 2 0.0
Hungarian Forint 0 0.0
1 Does not sum up to total market value due to cash and derivatives.
5
INVESTMENTS 1.1

At the end of 2017 the fund had equity investments in 9,146 companies worldwide.
Investments | Return and risk 2017 | Government Pension Fund Global
6

Table 5 Largest holdings of equities and bonds excluding sovereigns as at 31 December 2017. Covered bonds issued by financial institutions and debt issued by other underlying companies are included in bonds. Millions of kroner
Name Sector Equities Bonds Total
Apple Inc Technology 66,029 8,122 74,152
Nestlé SA Consumer goods 51,040 1,895 52,935
Royal Dutch Shell Plc Oil and gas 50,258 2,673 52,930
Microsoft Corp Technology 47,549 2,155 49,704
Alphabet Inc Technology 47,892 844 48,737
Bank of America Corp Financials 25,546 17,002 42,548
Novartis AG Health care 36,770 3,952 40,722
Amazon.com Inc Consumer services 36,579 3,428 40,006
JPMorgan Chase & Co Financials 25,823 12,730 38,553
HSBC Holdings Plc Financials 30,777 7,380 38,158
Roche Holding AG Health care 35,151 2,008 37,159
AT&T Inc Telecommunications 17,518 16,526 34,044
Tencent Holdings Ltd Technology 33,952 33,952
Berkshire Hathaway Inc Financials 26,740 6,615 33,355
Wells Fargo & Co Financials 21,626 10,031 31,657
Samsung Electronics Co Ltd Consumer goods 30,402 30,402
Facebook Inc Technology 29,759 29,759
Johnson & Johnson Health care 27,365 2,278 29,644
Credit Suisse Group AG Financials 18,875 10,521 29,395
Kreditanstalt für Wiederaufbau Government-related 28,703 28,703
BP Plc Oil and gas 24,854 1,758 26,612
Citigroup Inc Financials 16,945 9,636 26,580
Anheuser-Busch InBev SA/NV Consumer goods 20,565 5,390 25,955
UBS Group AG Financials 18,787 7,022 25,810
Verizon Communications Inc Telecommunications 16,602 8,723 25,325
Exxon Mobil Corp Oil and gas 25,266 25,266
Banco Santander SA Financials 18,177 6,559 24,736
Lloyds Banking Group Plc Financials 14,621 9,721 24,342
Canada Mortgage & Housing Corp Government-related 23,399 23,399
Taiwan Semiconductor Manufacturing Co Ltd Technology 22,550 574 23,124
Linde AG Basic materials 23,057 23,057
TOTAL SA Oil and gas 20,449 2,278 22,728
BASF SE Basic materials 21,572 1,023 22,595
SAP SE Technology 20,151 1,360 21,510
Sanofi Health care 16,504 3,684 20,188
Bayer AG Basic materials 18,894 1,251 20,145
Prudential Plc Financials 19,470 447 19,917
Vodafone Group Plc Telecommunications 15,839 3,920 19,759
European Investment Bank Government-related 19,421 19,421
Siemens AG Industrials 16,001 2,845 18,845
7
INVESTMENTS 1.1
Global investments
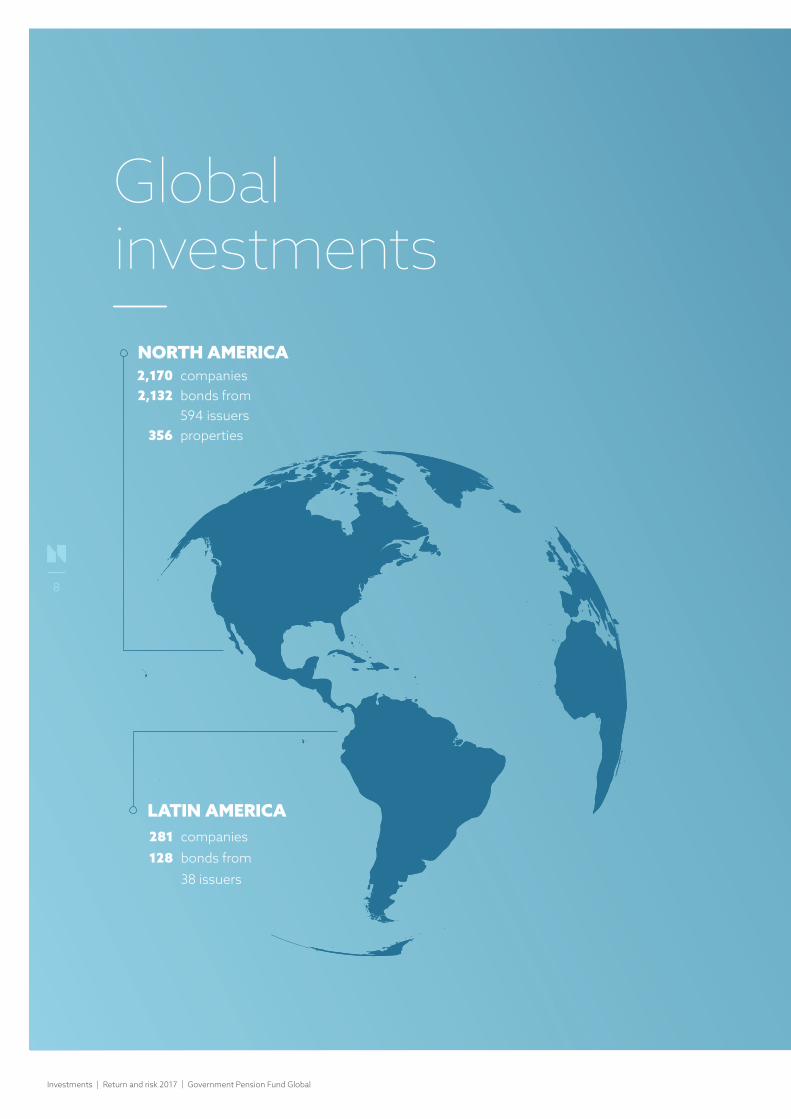
NORTH AMERICA 2,170 companies 2,132 bonds from 594 issuers 356 properties
LATIN AMERICA 281 companies 128 bonds from 38 issuers
Investments | Return and risk 2017 | Government Pension Fund Global
8
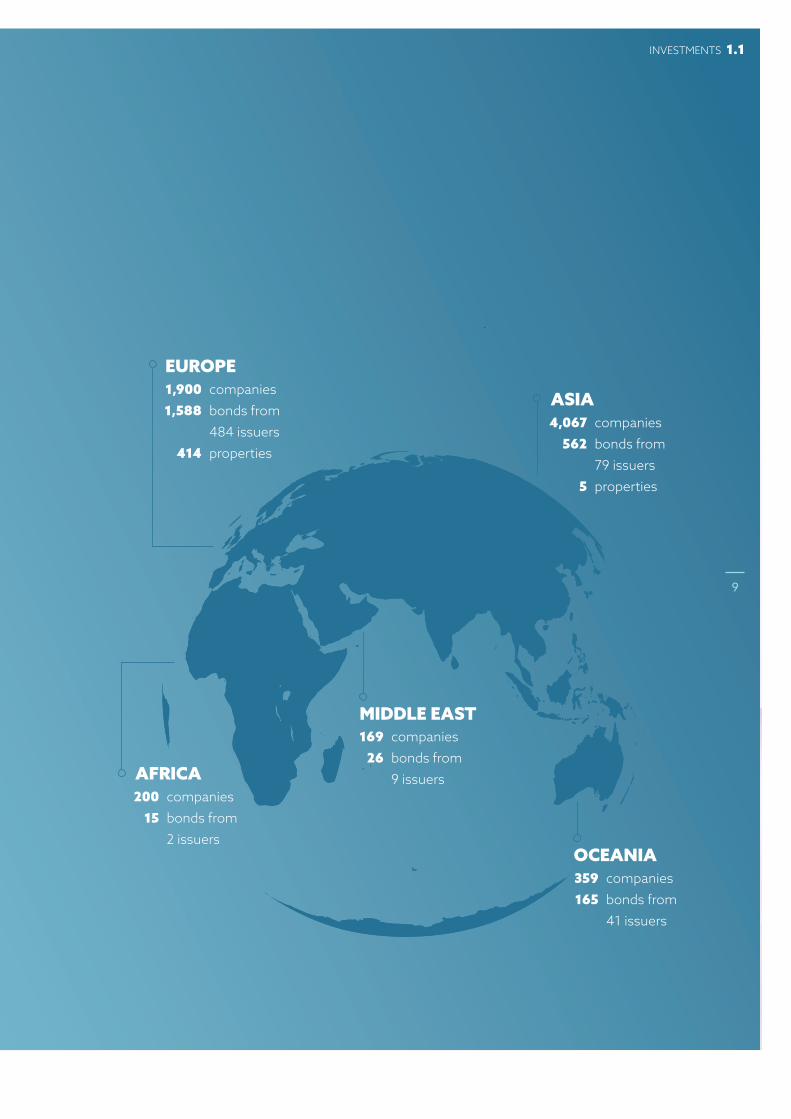
EUROPE 1,900 companies 1,588 bonds from 484 issuers 414 properties
OCEANIA 359 companies 165 bonds from 41 issuers
MIDDLE EAST 169 companies 26 bonds from 9 issuersAFRICA
200 companies 15 bonds from 2 issuers
4,067 companies 562 bonds from 79 issuers 5 properties
ASIA
9
INVESTMENTS 1.1
Benchmark indexThe strategic benchmark index is defined in the mandate set by the Ministry of Finance to regulate our management of the fund. It reflects important decisions that determines how developments in the broad markets affect the total return on the fund over time.
The first benchmark index designed for the management of the fund was introduced in January 1998. The benchmark index is the key representation of the investment strategy and has defined the main return and risk properties of the fund.
We seek to safeguard the long-term international purchasing power of the fund at acceptable risk. This has remained unchanged since inception. However, the benchmark index derived from this goal has evolved. The authority to set and change the benchmark index rests with the Ministry. The Ministry has drawn on advice from Norges Bank, and independent third party experts appointed to provide such advice. On matters of strategic importance the Ministry has used national budget documents and periodic white papers to anchor decisions on fund strategy in parliament (the Storting). The Ministry has laid down changes to the investment mandate based on these deliberations.
The investment mandate entails a number of important decisions. In financial theory, the term “market portfolio” is used to describe the most diversified portfolio. In practical terms, this theoretical construct is both unobserved and un-investable.
The Ministry defines the investment universe for the fund. The investment universe is restricted to investments in listed equities, tradable fixed-income instruments and unlisted real estate. In addition, the fund can
be invested in unlisted equity of companies where the board has expressed an intention to seek public listing.
While market-weighted portfolios are passive in the sense that they require the fewest transactions, the asset owner may choose to depart from market weights and construct a benchmark index which better reflects specific objectives and characteristics. The fund’s most important departure from market weights is the choice of equity share in the benchmark index. The recent decision to increase the equity share in the benchmark index to 70 percent was a move further away from the relative market weights of equities and bonds we observe in liquid markets. Another important departure from market weights is the regional weights the Ministry has set within asset classes.
The Ministry then needs to choose which market representation to use for the benchmark index. There is no unique market portfolio and an investor will have to create an own market representation or choose between externally provided indices to benchmark actual investments. Independent providers create capitalisation-weighted indices. This involves choosing the securities to be included in the index, choosing constituent weights, and how these weights change over time.
The Ministry has formulated a rebalancing regime for the fund. The departure from market weights requires active trading to return the portfolio to its strategic targets. Being a
Investments | Return and risk 2017 | Government Pension Fund Global
10

dynamic trading strategy, the design of the rebalancing regime will have important consequences for the long run return and risk characteristics of the fund. Rebalancing may enhance the long-run portfolio efficacy.
Finally, the Ministry has to formulate the objective for the manager. This objective has been to maximise returns within the mandate. Any deviations in the actual portfolio from the benchmark index have been contained through tracking error constraints. Since February 2016 the tracking error limit has been 125 basis points.
The 2014 review of the active management of the fund advocated that the fund should report return and risk from active decisions in each discrete phase of the investment process.
THE STRATEGIC BENCHMARK INDEXThe composition of the strategic benchmark index has evolved over time. It now consist of listed equities and bonds. At the end of 2017, while under transition from a strategic equity share of 62.5 percent towards a new strategic allocation of 70 percent, the actual equity share in the benchmark index stood at 67.1 percent equities and 32.9 percent fixed income. The sub-indices for equities and fixed income were based on publicly available, widely used, investable indices.
Table 6 The fund’s benchmark return, key figures, measured in various currencies. Annualised. Percent
Since 01.01.1998
Last 10 years
Last 5 years 2017
US Dollar 6.17 4.71 6.96 19.18
Euro1 5.70 6.79 8.98 4.68
British Pound 7.25 8.83 10.96 8.86
Norwegian Krone 6.76 9.08 15.52 13.25
Currency basket 5.81 6.01 8.96 12.96
1 Euro was introduced as currency on 01.01.1999. WM/Reuters’ Euro rate is used as estimate for 31.12.1997.
Table 7 The fund’s benchmark return, 5-year buckets, measured in various currencies. Annualised. Percent
1998 – 2002
2003 – 2007
2008 – 2012
2013 – 2017
US Dollar 2.86 12.67 2.50 6.96
Euro1 3.82 5.44 4.64 8.98
British Pound 3.46 7.99 6.74 10.96
Norwegian Krone 1.74 7.32 3.00 15.52
Currency basket 2.78 8.52 3.14 8.96
1 Euro was introduced as currency on 01.01.1999. WM/Reuters’ Euro rate is used as estimate for 31.12.1997.
11
INVESTMENTS 1.2
Unlisted real estate is a separate asset class in the portfolio, but is not reflected in the fund’s benchmark index as the decision on how much and when to invest in unlisted real estate is delegated to Norges Bank as the manager of the fund within the limits laid down in the investment mandate.
Equity benchmark indexThe equity benchmark index is based on the FTSE Global All Cap index, which is a global market-capitalisation-weighted index covering approximately 7,700 stocks in 47 countries, or roughly 98 percent of the world’s investable market capitalisation. FTSE conducts an annual review of all countries in the index, as well as those being considered for inclusion, against minimum standards of governance and investability. Eligible securities are assigned to a country and are required to pass screens for liquidity, free float and foreign ownership restrictions prior to being included.
The equity benchmark index deviates from the composition of the FTSE Global All Cap index along two important dimensions: geographical distribution and ethical exclusions. In terms of the geographical distribution, the benchmark
index has a larger weight in European developed markets and lower weight in the US and Canada compared to market capitalisation weights. The weighting of other countries is close to the FTSE Global All Cap index with the exception of Norway and securities denominated in Norwegian kroner, which are excluded. In addition, securities issued by companies excluded by Norges Bank under the guidelines for observation and ethical exclusion from the fund are not included in the benchmark index.
Investments | Return and risk 2017 | Government Pension Fund Global
12
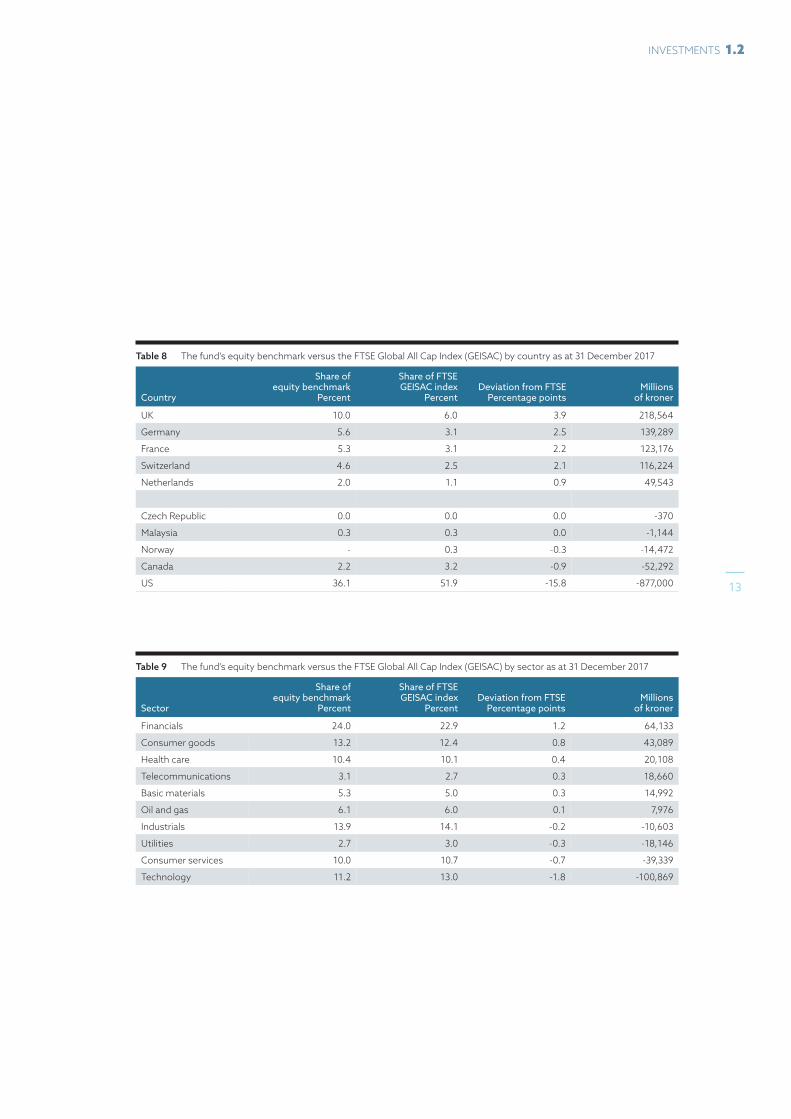
Table 8 The fund’s equity benchmark versus the FTSE Global All Cap Index (GEISAC) by country as at 31 December 2017
Country
Share of equity benchmark
Percent
Share of FTSE GEISAC index
PercentDeviation from FTSE
Percentage pointsMillions
of kroner
UK 10.0 6.0 3.9 218,564
Germany 5.6 3.1 2.5 139,289
France 5.3 3.1 2.2 123,176
Switzerland 4.6 2.5 2.1 116,224
Netherlands 2.0 1.1 0.9 49,543
Czech Republic 0.0 0.0 0.0 -370
Malaysia 0.3 0.3 0.0 -1,144
Norway - 0.3 -0.3 -14,472
Canada 2.2 3.2 -0.9 -52,292
US 36.1 51.9 -15.8 -877,000
Table 9 The fund’s equity benchmark versus the FTSE Global All Cap Index (GEISAC) by sector as at 31 December 2017
Sector
Share of equity benchmark
Percent
Share of FTSE GEISAC index
PercentDeviation from FTSE
Percentage pointsMillions
of kroner
Financials 24.0 22.9 1.2 64,133
Consumer goods 13.2 12.4 0.8 43,089
Health care 10.4 10.1 0.4 20,108
Telecommunications 3.1 2.7 0.3 18,660
Basic materials 5.3 5.0 0.3 14,992
Oil and gas 6.1 6.0 0.1 7,976
Industrials 13.9 14.1 -0.2 -10,603
Utilities 2.7 3.0 -0.3 -18,146
Consumer services 10.0 10.7 -0.7 -39,339
Technology 11.2 13.0 -1.8 -100,869
13
INVESTMENTS 1.2

Fixed-income benchmark indexThe fixed-income benchmark index consists of two sub-indices for government bonds and corporate bonds. Each sub-index is assigned a fixed weight, and the benchmark index is rebalanced back to these weights on a monthly basis. The government sub-index is assigned a weight of 70 percent and draws its constituents from three different Bloomberg Barclays indices in 24 currencies, including both developed and emerging markets. The corporate sub-index is assigned a weight of 30 percent and comprises all securities issued in seven developed markets and included in the corporate sector and the covered bond sub-sector of the Bloomberg Barclays Global Aggregate Index. Bloomberg Barclays Indices evaluates the fixed income landscape annually. To be considered for inclusion in its flagship indices, government issuers must be rated investment-grade and the currencies sufficiently tradable, convertible and hedgeable for international investors.
The Bloomberg Barclays Global Aggregate is a global market-capitalisation-weighted index of investment-grade debt from 24 local currency markets, including government, government related, corporate and securitised bonds. The most significant difference between the benchmark index for fixed income and the Bloomberg Barclays Global Aggregate is that while government bonds in the Bloomberg
Barclays index are market-weighted, government bonds in the fund’s benchmark index are weighted according to the size of the respective issuing countries’ GDP. Another difference is that agencies, local authorities, sovereigns, MBS pass-through bonds, ABS and CMBS are not included in the benchmark, while inflation linked bonds are included. For corporate bonds, the main difference is the number of currencies. The Bloomberg Barclays Global Aggregate includes corporate bonds issued in 15 currencies, while the benchmark index only includes bonds issued in US dollars, Canadian dollars, euros, British pounds, Swedish kronor, Danish kroner and Swiss francs. Furthermore, the benchmark index has a higher weight of covered bonds than the Bloomberg Barclays Global Aggregate.
Investments | Return and risk 2017 | Government Pension Fund Global
14

Table 10 The fund’s fixed-income benchmark versus the Bloomberg Barclays Global Aggregate Index by currency as at 31 December 2017
Currency
Share of fixed-income
benchmarkPercent
Share of Bloomberg Barclays Global
Aggregate indexPercent
Deviation from Bloomberg Barclays
Percentage pointsMillions
of kroner
Mexican Peso 1.7 0.3 1.4 38,201
Euro 26.8 25.5 1.2 33,670
Swiss Franc 1.5 0.6 0.9 23,267
South Korean Won 2.1 1.2 0.8 22,878
Swedish Krona 1.1 0.4 0.6 17,405
Hong Kong Dollar 0.1 0.0 0.1 2,668
Chilean Peso 0.1 0.0 0.1 2,229
South African Rand - 0.0 0.0 -424
Norwegian Krone - 0.1 -0.1 -3,278
Japanese Yen 7.0 16.2 -9.2 -250,547
Table 11 The fund’s fixed-income benchmark versus the Bloomberg Barclays Global Aggregate Barclays Global Aggregate Index by sector as at 31 December 2017
Sector
Share of fixed-income
benchmarkPercent
Share of Bloomberg Barclays Global
Aggregate indexPercent
Deviation from Bloomberg Barclays
Percentage pointsMillions
of kroner
Treasuries 60.4 53.7 6.7 183,816
Inflation-linked bonds 6.7 - 6.7 182,377
Industrial 14.4 10.5 3.9 105,873
Financial institutions 10.0 7.1 2.9 78,463
Covered 3.8 2.7 1.1 29,960
Supranational 2.9 2.2 0.6 16,843
Utility 1.8 1.5 0.4 9,803
ABS - 0.3 -0.3 -7,318
CMBS - 0.8 -0.8 -21,223
Sovereign - 1.2 -1.2 -32,047
Local authorities - 3.0 -3.0 -82,746
Agencies - 5.7 -5.7 -154,056
MBS Passthrough - 11.4 -11.4 -309,745
15
INVESTMENTS 1.2

ETHICAL EXCLUSIONSThe Ministry first issued guidelines for the observation and exclusion of companies from the Government Pension Fund Global in November 2004. The Ministry appointed a Council on Ethics to research and evaluate companies, and to make recommendations on exclusions based on the criteria set out in the guidelines. When companies are excluded from the fund, the benchmark index will be adjusted accordingly.
Two types of criteria are set out in the guidelines. One set relates to specific product types and excludes companies that produce tobacco, or weapons that violate fundamental humanitarian principles. The product-based exclusions have reduced the cumulative return on the equity index by around -2.4 percentage points, or -0.10 percentage point annually. Both the exclusion of tobacco companies and certain weapons manufacturers have reduced returns.
A separate set of criteria exclude companies where there is an unacceptable risk of conduct that contribute to serious or systematic human rights violations, serious violations of the rights of individuals in situations of war or
conflict, severe environmental damage, gross corruption or other serious violations of fundamental ethical norms. The conduct-based exclusions have increased the cumulative return on the equity index by around 0.9 percentage point, or 0.04 percentage point annually.
The Ministry revised the guidelines in February 2016. Two new criteria were introduced. First, the corporate conduct criteria were broadened to cover companies that are responsible for acts or omissions that on an aggregated company level lead to unacceptable greenhouse gas emissions. Second, a product-based coal criterion was introduced. Mining companies and power producers, that derive 30 percent or more of their revenue from thermal coal or base 30 percent or more of their operations on thermal coal, may now be excluded.
Over the last twelve years, the equity benchmark index has returned 1.6 percentage points less than an index which is unadjusted at constituent level, or 0.06 percentage point less on an annualised basis.
Investments | Return and risk 2017 | Government Pension Fund Global
16

Table 12 Contribution to return impact of equity benchmark index exclusions by exclusion criterion as at 31 December 2017. Market value in billions of kroner. Contribution measured in dollars. Percentage points
Criterion
Number of excluded companies from
benchmark
Market value in benchmark if not excluded 2017
2006-2017 annualised
Product-based exclusions 98 159 -0.02 -0.10
Production of specific weapon types 19 62 -0.18 -0.05
Production of tobacco 17 69 0.13 -0.05
Thermal coal mining or coal based power production
62 28 0.04 0.00
Conduct-based exclusions 27 43 -0.08 0.04
Serious or systematic human rights violations 2 12 -0.04 -0.01
Serious violations of the rights of individuals in situations of war or conflict
1 0 0.00 0.00
Severe environmental damage 19 29 -0.04 0.04
Gross corruption 1 0 0.00 0.00
Other particularly serious violations of fundamental ethical norms
4 2 0.00 0.00
Total 125 202 -0.10 -0.06
Chart 4 Return impact of equity benchmark index exclusions relative to an unadjusted index at constituent level. Measured in dollars. Percentage points
Chart XX Return impact of equity benchmark index exclusions relative to an unadjusted index at constituent level. Measured in US dollars. Percentage points
-2.5
-2.0
-1.5
-1.0
-0.5
0.0
0.5
1.0
-2.5
-2.0
-1.5
-1.0
-0.5
0.0
0.5
1.0
98 99 00 01 02 03 04 05 06 07 08 09 10 11 12 13 14 15 16 17
Conduct-based exclusions Product-based exclusions Total
17
INVESTMENTS 1.2
Reference portfolioA key objective in the management of the fund is to achieve the highest possible return after costs within the scope of the investment mandate.
The total return on the fund is largely determined by the strategic benchmark index. The strategic benchmark index is based on standard, publicly available indices. These indices are designed to represent liquid investment alternatives for the typical broad equity or fixed-income investor. Since the fund has different characteristics than the average investor, following these indices in a mechanical manner may exclude investment opportunities available to the fund as a large, long-term, and cross-asset investor.
Through a series of adjustments of these publicly available indices, the reference portfolio is tailored to better fit the characteristics of the fund through improving diversification, gaining exposure to additional sources of systematic risk, reducing turnover and funding of the fund’s real estate allocation. The reference portfolio serves as the starting point for our investments.
UNIVERSE EXPANSIONA number of markets are not part of the investment universe as defined by the strategic benchmark index. The rules governing the publicly available indices that make up the strategic benchmark index exclude parts of the market based on liquidity considerations and market access constraints, such as local regulations, quota systems or currency convertibility issues. Some of these accessibility constraints are not binding for long-term investors such as the fund.
The reference portfolio therefore contains a number of additional markets the fund considers investable. The largest additional country allocations in the fixed-income reference portfolio are Brazil, Indonesia and India. On the equity side, mainland China is a notable example. The strategic benchmark index excludes mainland Chinese equities
Investments | Return and risk 2017 | Government Pension Fund Global
18

because foreign investors need investment quotas to be able to invest in the local equity market. The fund has been able to invest in the local Chinese equity market since 2008.
In total, 17 additional equity markets and seven additional fixed-income markets are added to the reference portfolio. To the greatest extent possible, the internal reference portfolio adds markets and segments using the same weighting schemes as in the strategic benchmark index with market capitalisation for equities and GDP weights for government bonds. Both the strategic benchmark index and the reference portfolio adjust these market weights to take into account investability and market access.
The strategic benchmark index adjusts a company’s market capitalisation for free float. Since free float factors vary over time, following a free float adjusted market cap based index imply higher turnover than following a full market cap based one. In the reference portfolio, we adjust for the changes in these free float factors to a smaller extent than what is implied by the strategic benchmark index.
SYSTEMATIC FACTORSFor equity, the reference portfolio contains strategic allocations to systematic factors such as value, quality and size. Exposure to these systematic factor premiums is obtained by setting security weights that deviate from market weights for the securities in the investment universe. For instance, value-based investment strategies aim to capture excess returns associated with value stocks relative to growth stocks.
The performance of risk factor strategies is highly time-varying, and there can be long periods of underperformance. Exposure to systematic factors may be a suitable investment strategy for a long-term investor such as the fund.
The management mandate from the Ministry of Finance contains requirements that are not specified in the benchmark index, such as fiscal strength considerations in the management of the government bond portfolio. We use the reference portfolio to reflect these strategic exposures and their corresponding funding.
COST EFFICIENT IMPLEMENTATIONThe strategic benchmark index incorporates a set of explicit and implicit rebalancing rules to maintain its target exposures to equities, credit and currencies. To avoid excessive turnover resulting from the fixed target exposures, the reference portfolio allows significant drift before rebalancing back to the targets.
On the fixed-income side, the credit share and currency weights are rebalanced back to pre-determined weights on a monthly basis in the strategic benchmark index. Frequent rebalancing does not add meaningful returns and may be costly to implement, particularly in certain corporate bond segments and emerging market currencies. The reference portfolio therefore rebalances these exposures less often.
19
INVESTMENTS 1.3

At the end of 2017 the fund had investments in 775 properties in the US, Europe and Asia.
Investments | Return and risk 2017 | Government Pension Fund Global
20

FUNDING OF REAL ESTATEWe allocate to real estate to improve the overall risk-return profile of the fund. Real estate returns have had varying, and at times low, correlation to those of equities and fixed income. Therefore, the fund’s total risk can be reduced by including real estate.
The benchmark index expresses the asset owner’s market and currency risk preferences through the equity share and the currency composition. In addition to interest rate risk, these choices are of the most important determinants of the expected return and risk of a well-diversified equity and bond portfolio.
From January 2017, the allocation to real estate is no longer defined by the fund’s benchmark index. It is delegated to Norges Bank to decide the allocation to real estate and how it should be funded.
Our strategy is to build a global, but concentrated, portfolio of unlisted real estate, investing in a limited number of major cities in key markets and in the global logistics market. At the end of 2017, we had unlisted real estate
investments valued at 218.6 billion kroner spread across 14 countries.
We allocate to real estate to obtain a more diversified total portfolio. Allocation to real estate can add market and currency risk to the total portfolio. The additional systematic risk is controlled through balanced funding of this asset class, in order to maintain the fund’s overall market and currency risk.
We obtain exposure to real estate through both unlisted and listed markets. Our real estate portfolio comprises approximately 25 percent listed securities in real estate companies and real estate investment trusts. Our strategy is to target investments in listed real estate companies with exposure to the best real estate in the most attractive cities and sectors globally that could be seen as natural part of the unlisted real estate portfolio. The listed real estate investments amounted to 72.6 billion kroner at the end of 2017. The unlisted and listed portfolios are funded with the same model, but adjustments for market risk and currency are tailored to each investment.
21
INVESTMENTS 1.2

REFERENCE PORTFOLIO RETURNThe reference portfolio for equities has returned 12.5 percent per annum since 2013, which was in line with the return on the strategic benchmark index. Both the broad allocation to China and other emerging markets as well as the allocation to environment-related equities have made a positive contribution to the relative return.
The reference portfolio contains strategic allocations to additional systematic factors such as value, quality, and size, which together contributed positively to the relative return. It is important to note that the performance of such factor strategies is highly time-varying, and can go through long periods of underperformance. Exposure to systematic factors has overall contributed positively since 2013, but with significant variations in annual performance. The return-risk profile of these factor strategies should be evaluated over longer periods than some of the fund’s other investment strategies.
The fund reduced its strategic allocation to European equities in 2013. The reference portfolio implemented this transition over a longer horizon than the strategic benchmark index in order to avoid unnecessary transactions in European equities. The longer implementation period resulted in a relative overweight in European stocks and this overweight contributed negatively to the relative return.
The reference portfolio for bonds has returned 2.7 percent per annum since 2013, which was 0.2 percentage point less per annum than the return on the strategic benchmark index.
Efforts to improve diversification involve expanding the universe by adding markets and segments, typically to broaden the geographical exposure. The additional markets in the reference portfolio made a negative contribution to the fund’s relative return, with Russian bonds being a large contributor to this.
Investments | Return and risk 2017 | Government Pension Fund Global
22
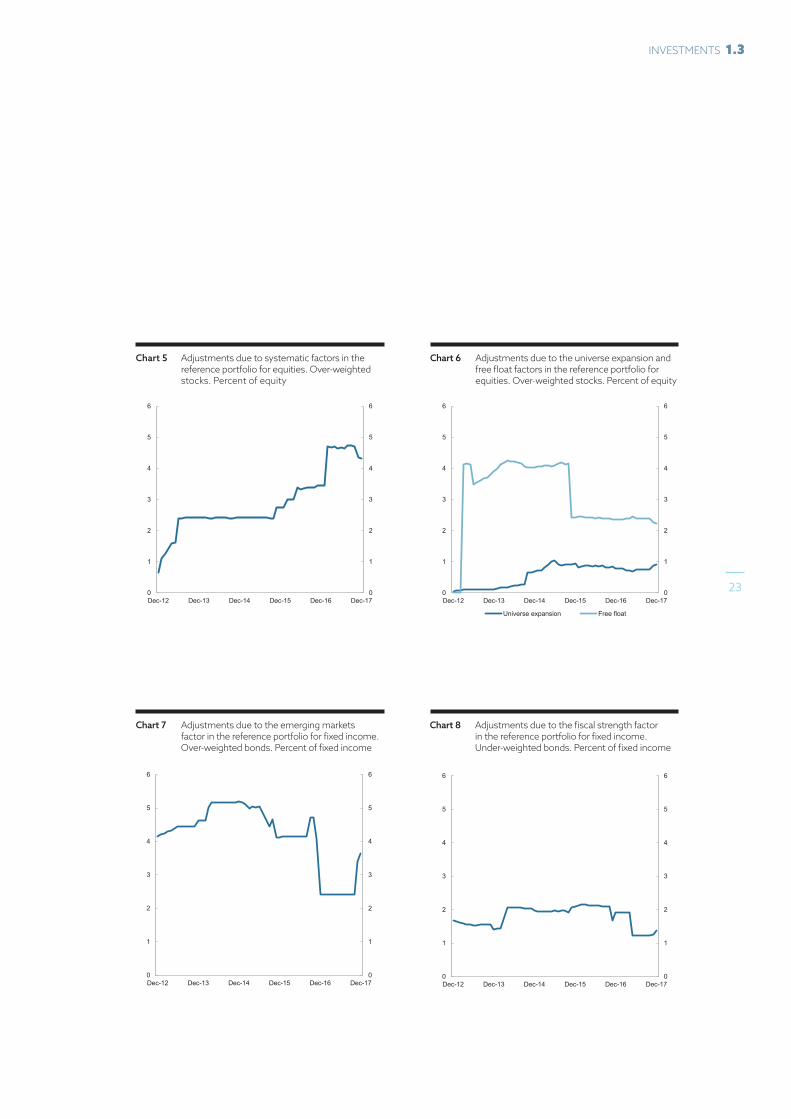
Chart 6 Adjustments due to the universe expansion and free float factors in the reference portfolio for equities. Over-weighted stocks. Percent of equity
Chart 5 Adjustments due to systematic factors in the reference portfolio for equities. Over-weighted stocks. Percent of equity
Chart 8 Adjustments due to the fiscal strength factor in the reference portfolio for fixed income. Under-weighted bonds. Percent of fixed income
Chart 7 Adjustments due to the emerging markets factor in the reference portfolio for fixed income. Over-weighted bonds. Percent of fixed income
Chart XX Adjustments due to systematic factors in the reference portfolio for equities. Over-weighted stocks. Percent of equity
Source: Norges Bank Investment Management
0
1
2
3
4
5
6
0
1
2
3
4
5
6
Dec-12 Dec-13 Dec-14 Dec-15 Dec-16 Dec-17
Updated: ady 2018-02-12
Chart XX Adjustments due to the universe expansion andfree float factors in the reference portfolio for equities. Over-weighted stocks. Percent of equity
Source: Norges Bank Investment Management
0
1
2
3
4
5
6
0
1
2
3
4
5
6
Dec-12 Dec-13 Dec-14 Dec-15 Dec-16 Dec-17
Universe expansion Free float
Updated: ady 2017-11-27, faa 2018-02-12
Chart XX Adjustments due to the emerging markets factor in the reference portfolio for fixed income. Over-weighted bonds. Percent of fixed income
Source: Norges Bank Investment Management
0
1
2
3
4
5
6
0
1
2
3
4
5
6
Dec-12 Dec-13 Dec-14 Dec-15 Dec-16 Dec-17
Updated: ady 2017-11-27, faa 2018-02-12
Chart XX Adjustments due to the fiscal strength factor in the reference portfolio for fixed income. Under-weighted bonds. Percent of fixed income
Source: Norges Bank Investment Management
0
1
2
3
4
5
6
0
1
2
3
4
5
6
Dec-12 Dec-13 Dec-14 Dec-15 Dec-16 Dec-17
Updated: ady 2017-11-27, faa 2018-02-12
23
INVESTMENTS 1.3

Table 13 Contribution to relative return differences between the fund’s reference portfolio and the benchmark index for 2013-2017. Percentage points
EquityFixed
income Total
Systematic factors 0.02 0.02
Universe expansion 0.00 -0.05 -0.05
Mandate allocations 0.01 -0.02 0.00
Universe adjustments -0.02 -0.02 -0.05
Reference portfolio versus the benchmark index 0.01 -0.09 -0.08
Russian government bonds were included in the reference portfolio from December 2011. When included in the Ministry of Finance benchmark from April 2014, Russian government bonds were included with a lower weight than in the Barclays Index after advice from Norges Bank. The actual allocation in the reference portfolio was also higher than in the Ministry of Finance benchmark, generating a loss of 60 basis points in 2014, annualised to 12 basis points for the 2013-2017 period, relative to the adjusted Ministry of Finance fixed-income benchmark.
The reference portfolio attempts to make the interest rate sensitivity more similar between different issuers of government debt. This made
a negative contribution to the relative return throughout the period.
The mandate from the Ministry of Finance requires Norges Bank to take fiscal strength into account in its bond investments. The reference portfolio therefore adjusts the weights assigned to countries in the government bond segment based on fiscal risk. This adjustment results in lower expected risk and return in this part of the reference portfolio. The fiscal strength adjustment has made a negative contribution to the relative return, as the spread, or difference in yield, between the most heavily indebted countries in the euro area and German government debt has narrowed substantially over the period.
Investments | Return and risk 2017 | Government Pension Fund Global
24

Chart 10 The equity reference portfolio versus the benchmark index. Contributions from adjustments due to universe expansion and free float. Percentage points
Chart 9 The equity reference portfolio versus the benchmark index. Contributions from adjustments due to systematic factors. Percentage points
Chart 12 The fixed-income reference portfolio versus the benchmark index. Contributions from adjustments due to fiscal strength. Percentage points
Chart 11 The fixed-income reference portfolio versus the benchmark index. Contributions from adjustments due to emerging markets.Percentage points
Chart XX The equity reference portfolio versus the benchmark index. Contributions from adjustments due to systematic factors. Percentage points
Source: Norges Bank Investment Management
-1.0
-0.5
0.0
0.5
1.0
-1.0
-0.5
0.0
0.5
1.0
Dec-12 Dec-13 Dec-14 Dec-15 Dec-16 Dec-17
Updated: faa, 2018-02-09
Chart XX The equity reference portfolio versus the benchmark index. Contributions from adjustments due to universe expansion and free float. Percentage points
Source: Norges Bank Investment Management
-1.0
-0.5
0.0
0.5
1.0
-1.0
-0.5
0.0
0.5
1.0
Dec-12 Dec-13 Dec-14 Dec-15 Dec-16 Dec-17
Universe expansion Free float
Updated: faa, 2018-02-12
Chart XX The fixed-income reference portfolio versus the benchmark index. Contributions from adjustments due to emerging markets. Percentage points
Source: Norges Bank Investment Management
-2.0
-1.5
-1.0
-0.5
0.0
0.5
1.0
-2.0
-1.5
-1.0
-0.5
0.0
0.5
1.0
Dec-12 Dec-13 Dec-14 Dec-15 Dec-16 Dec-17
Updated: faa, 2018-02-12
Chart XX The fixed-income reference portfolio versus the benchmark index. Contributions from adjustments due to fiscal strength. Percentage points
Source: Norges Bank Investment Management
-2.0
-1.5
-1.0
-0.5
0.0
0.5
1.0
-2.0
-1.5
-1.0
-0.5
0.0
0.5
1.0
Dec-12 Dec-13 Dec-14 Dec-15 Dec-16 Dec-17
Updated: faa, 2018-02-12
25
INVESTMENTS 1.3

The fund’s total market value grew 978 billion kroner to 8,488 billion kroner in 2017. The investment return for the year was 1,028 billion kroner. The krone weakened against the main currencies the fund invests in, increasing the fund’s net asset value by 15 billion kroner. Withdrawals of capital amounted to 65 billion kroner.
The fund has received a total of 3,298 billion kroner, net of management costs and withdrawals, since the first inflow of capital in May 1996. The cumulative investment return since inception has been 4,151 billion kroner. Changes in the value of the krone against the currencies we invest in account for the remaining 1,040 billion kroner of the fund’s market value. FUND RETURNIn 2017, the fund returned 13.66 percent. The return on equity investments was 19.44 percent, while the fixed-income investments returned 3.31 percent and unlisted real estate investments 7.52 percent.
Over the last five years, the fund’s annualised investment return has been 9.26 percent. Equity investments have returned 12.94 percent, fixed-income investments 2.96 percent and real estate investments 8.03 percent.
Since inception, the fund’s annualised investment return has been 6.09 percent. The return on equity investments has been 6.15 percent and the return on fixed-income investments 4.76 percent.
The fund had positive annual returns in 16 out of 20 years since inception. Equity investments had positive returns in 14 out of 19 years, and fixed-income investments in 18 out of 20 years.
ReturnThe fund’s investment return was 13.66 percent in 2017 and has been 6.09 percent annualised since inception.
Return | Return and risk 2017 | Government Pension Fund Global
26

Chart 13 The fund’s quarterly and accumulated annualised return. Percent
Chart 14 Annual return for equity, fixed income, unlisted real estate investments and the fund. Percent
The return on unlisted real estate has been positive in six out of seven years.
BENCHMARK RETURNThe fund’s equity benchmark returned 18.68 percent in 2017.
The Asian region performed well in 2017 with a 25.47 percent investment return. Europe with its greater weight in the benchmark, however, contributed the most to the benchmark’s positive performance in 2017 with a return of 20.29 percent. North American stocks returned 14.49 percent.
Benchmark returns are shown in both the fund’s currency basket and in local currency in order to show the impact of exchange rate movements on investment returns. While
European stocks outperformed North American stocks in 2017, this was as a result of a strengthening of the euro currency against the US dollar, as their returns measured in local currency were opposite, with North American stocks outperforming European stocks.
Technology stocks performed the best in 2017 with a return of 32.57 percent. Technology has also been the best performing sector when measured over the last five years. The worst performing sector in 2017 was telecommunications at 3.61 percent.
The return on the fixed-income benchmark was 2.88 percent in 2017. Europe performed well with a regional return of 8.14 percent. While the local currency return was only 1.19 percent, the
Chart 16 The fund’s quarterly and accumulated annualised return. Percent
Source: Norges Bank Investment Management
-14
-12
-10
-8
-6
-4
-2
0
2
4
6
8
10
12
14
-14
-12
-10
-8
-6
-4
-2
0
2
4
6
8
10
12
14
98 99 00 01 02 03 04 05 06 07 08 09 10 11 12 13 14 15 16 17
Quarterly Return Accumulated annualised return
Updated: AMF 06/02/2018
-50
-40
-30
-20
-10
0
10
20
30
40
50
-50
-40
-30
-20
-10
0
10
20
30
40
50
Chart 17 Annual return for equity, fixed income, real estate investments and total fund. Percent
2
98 99 00 01 02 03 04 05 06 07 08 09 10 11 12 13 14 15 16 17
Equity Fixed income Unlisted real estate Fund
Source: Norges Bank Investment Management
Updated: AMF 06/02/2018
27
RETURN 2.1

The cumulative investment return since inception has been 4,151 billion kroner.
Return | Return and risk 2017 | Government Pension Fund Global
28

strengthening of the euro and most other European currencies in the benchmark against the fund’s currency basket contributed materially to the regional outperformance. North American bonds, on the other hand, produced an overall negative return of -1.25 percent in 2017. The underperformance came as a result of a depreciating US dollar, with the return in local currency being positive at 3.71 percent. Poor performance of Japanese bonds weighed on Asia, which returned 1.48 percent in 2017.
Corporate bonds performed better than government bonds in 2017. The return on the benchmark’s corporate bonds, including covered bonds, was 4.62 percent measured in local currency, while government bonds, including supranationals returned 1.68 percent in local currency. Corporate bonds have also outperformed government bonds over the most recent five-year period, by an annualised 0.86 percentage point over the last five years, measured in local currency.
Table 14 Absolute return per year, measured in the fund’s currency basket. Percent
Year FundEquity
investmentsFixed- income
investmentsUnlisted real estate
investments1
2017 13.66 19.44 3.31 7.52
2016 6.92 8.72 4.32 0.78
2015 2.74 3.83 0.33 9.99
2014 7.58 7.90 6.88 10.42
2013 15.95 26.28 0.10 11.79
2012 13.42 18.06 6.68 5.77
20112 -2.54 -8.84 7.03 -4.37
2010 9.62 13.34 4.11 –
2009 25.62 34.27 12.49 –
2008 -23.31 -40.71 -0.54 –
2007 4.26 6.82 2.96 –
2006 7.92 17.04 1.93 –
2005 11.09 22.49 3.82 –
2004 8.94 13.00 6.10 –
2003 12.59 22.84 5.26 –
2002 -4.74 -24.39 9.90 –
2001 -2.47 -14.60 5.04 –
2000 2.49 -5.82 8.41 –
1999 12.44 34.81 -0.99 –
1998 9.26 – 9.31 –
1 Includes listed real estate investments from 1 November 2014 to the end of 2016.2 Unlisted real estate investments from 31 March 2011.
29
RETURN 2.1
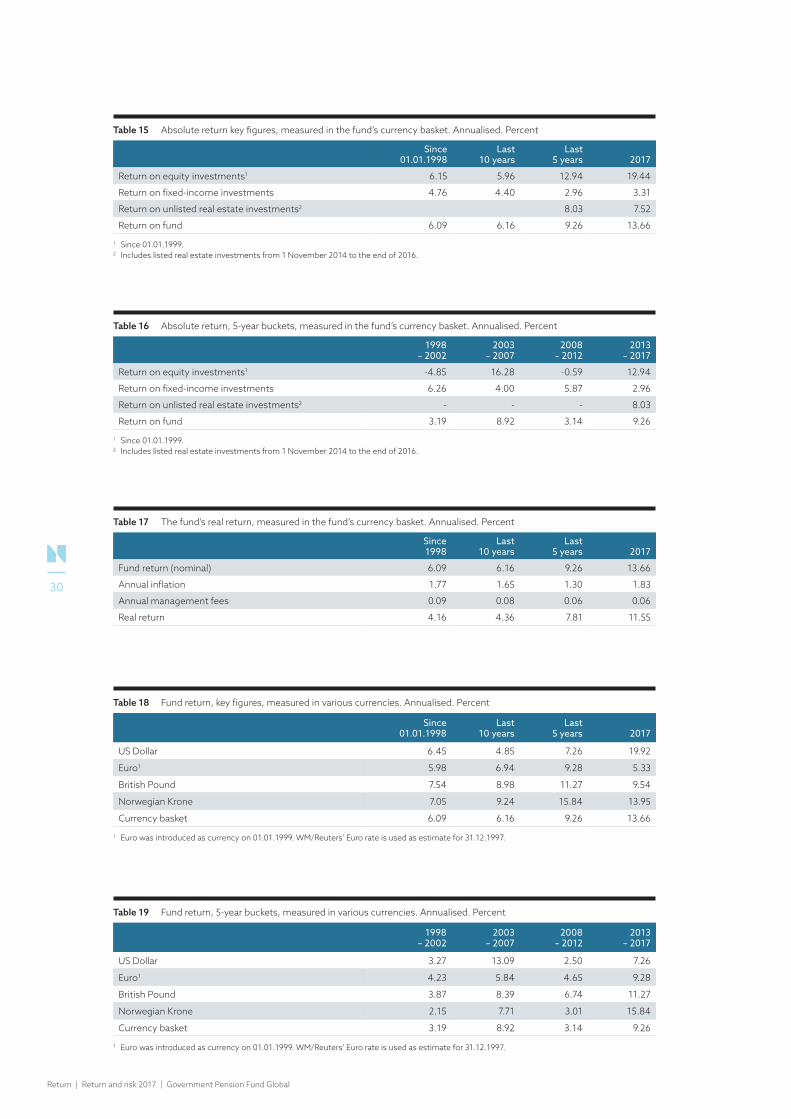
Table 15 Absolute return key figures, measured in the fund’s currency basket. Annualised. Percent
Since 01.01.1998
Last 10 years
Last 5 years 2017
Return on equity investments1 6.15 5.96 12.94 19.44
Return on fixed-income investments 4.76 4.40 2.96 3.31
Return on unlisted real estate investments2 8.03 7.52
Return on fund 6.09 6.16 9.26 13.66
1 Since 01.01.1999.2 Includes listed real estate investments from 1 November 2014 to the end of 2016.
Table 16 Absolute return, 5-year buckets, measured in the fund’s currency basket. Annualised. Percent
1998 – 2002
2003– 2007
2008 – 2012
2013 – 2017
Return on equity investments1 -4.85 16.28 -0.59 12.94
Return on fixed-income investments 6.26 4.00 5.87 2.96
Return on unlisted real estate investments2 - - - 8.03
Return on fund 3.19 8.92 3.14 9.26
1 Since 01.01.1999.2 Includes listed real estate investments from 1 November 2014 to the end of 2016.
Table 17 The fund’s real return, measured in the fund’s currency basket. Annualised. Percent
Since 1998
Last 10 years
Last 5 years 2017
Fund return (nominal) 6.09 6.16 9.26 13.66
Annual inflation 1.77 1.65 1.30 1.83
Annual management fees 0.09 0.08 0.06 0.06
Real return 4.16 4.36 7.81 11.55
Table 18 Fund return, key figures, measured in various currencies. Annualised. Percent
Since 01.01.1998
Last 10 years
Last 5 years 2017
US Dollar 6.45 4.85 7.26 19.92
Euro1 5.98 6.94 9.28 5.33
British Pound 7.54 8.98 11.27 9.54
Norwegian Krone 7.05 9.24 15.84 13.95
Currency basket 6.09 6.16 9.26 13.66
1 Euro was introduced as currency on 01.01.1999. WM/Reuters’ Euro rate is used as estimate for 31.12.1997.
Table 19 Fund return, 5-year buckets, measured in various currencies. Annualised. Percent
1998 – 2002
2003 – 2007
2008 – 2012
2013 – 2017
US Dollar 3.27 13.09 2.50 7.26
Euro1 4.23 5.84 4.65 9.28
British Pound 3.87 8.39 6.74 11.27
Norwegian Krone 2.15 7.71 3.01 15.84
Currency basket 3.19 8.92 3.14 9.26
1 Euro was introduced as currency on 01.01.1999. WM/Reuters’ Euro rate is used as estimate for 31.12.1997.
Return | Return and risk 2017 | Government Pension Fund Global
30

Table 20 Equity benchmark return by region and country. Annualised. Percent
The fund's currency basket Local Currency
2017 5-Year 2017 5-Year
North America 14.49 16.76 20.32 14.97
United States 14.74 17.58 21.06 15.42
Canada 10.44 6.06 8.87 9.01
Europe 20.29 10.31 14.29 11.09
United Kingdom 17.09 8.08 12.83 10.07
Switzerland 18.58 11.73 19.95 11.06
Germany 23.73 11.82 14.66 11.84
France 22.98 12.41 13.97 12.43
Spain 19.87 7.77 11.08 7.79
Italy 25.84 9.20 16.62 9.21
Netherlands 25.97 13.66 16.74 13.68
Denmark 29.20 18.62 19.89 18.59
Belgium 13.28 12.65 4.98 12.66
Finland 16.40 14.49 7.87 14.50
Austria 42.10 10.17 31.68 10.19
Ireland 29.20 21.09 19.73 21.11
Portugal 23.23 4.35 14.19 4.36
Greece 28.90 -9.85 19.45 -9.83
Sweden 14.16 9.81 8.55 12.86
Russian Federation -0.78 0.03 -0.77 9.42
Hungary 31.16 15.33 22.08 16.82
Czech Republic 26.08 1.88 10.39 2.24
Poland 45.50 3.85 27.78 4.33
Turkey 32.29 -3.20 50.44 10.48
Asia 25.47 11.56 26.85 12.61
Japan 19.67 14.22 21.95 18.21
China 35.86 11.03 44.51 9.17
Korea Republic of (South) 39.83 8.52 30.76 6.53
Taiwan 23.49 11.73 20.30 10.22
Hong Kong 27.88 10.14 35.97 8.29
Singapore 27.73 5.12 24.80 5.03
India 37.14 13.87 36.06 15.25
Thailand 22.10 7.42 17.23 6.73
Malaysia 22.55 0.77 16.64 4.62
Indonesia 14.31 3.86 21.45 9.18
Philippines 16.89 6.51 23.84 8.72
Pakistan -25.74 11.08 -17.17 11.84
Oceania 14.70 6.20 12.32 10.25
Australia 14.52 5.95 11.85 10.06
New Zealand 18.65 13.76 22.73 15.04
Latin America 17.16 -1.77 22.20 5.38
Mexico 7.40 -2.54 7.61 3.85
Chile 37.21 1.78 32.91 5.04
Brazil 18.69 -1.13 27.62 6.89
Colombia 8.72 -9.78 14.03 -1.65
Peru 29.03 1.39 36.13 -0.31
Africa 26.65 5.71 21.18 12.26
South Africa 27.15 5.88 21.44 12.10
Egypt 8.88 1.38 12.65 21.75
Middle East -7.48 6.80 -7.50 4.00
Israel -4.66 4.55 -9.26 1.17
United Arab Emirates (UAE) -3.80 18.10 1.50 15.93
31
RETURN 2.1

Table 21 Equity benchmark return by sector. Annualised. Percent
The fund's currency basket Local Currency
2017 5-Year 2017 5-Year
Financials 18.36 12.05 18.46 12.46
Banks 17.74 9.55 16.60 10.47
Nonlife insurance 15.51 16.18 15.26 15.62
Life insurance 24.09 15.76 24.29 16.07
Real estate investment and services 26.98 8.75 27.78 9.24
Real estate investment trusts 8.29 10.47 10.40 10.01
Financial services 24.03 17.58 26.55 17.58
Consumer goods 21.26 13.19 20.10 13.33
Automobiles and parts 20.11 13.13 18.05 13.79
Beverages 20.95 11.67 19.95 12.29
Food producers 11.46 10.91 12.73 10.59
Household goods and home construction 15.03 15.58 15.75 15.70
Leisure goods 43.64 19.42 40.66 18.79
Personal goods 27.71 12.92 24.37 12.81
Industrials 21.66 13.74 21.48 13.91
Construction and materials 17.84 12.70 16.04 13.43
Aerospace and defense 16.78 13.14 16.98 12.98
General industrials 1.50 10.79 2.16 10.51
Electronic and electrical equipment 29.56 15.88 29.75 16.04
Industrial engineering 32.05 13.13 31.55 13.48
Industrial transportation 24.58 15.23 24.08 15.22
Support services 25.56 15.58 26.09 15.82
Consumer services 15.00 14.25 16.41 14.23
Food and drug retailers 2.30 7.99 2.24 7.97
General retailers 18.74 15.44 21.50 15.40
Media 10.25 14.60 10.33 14.36
Travel and leisure 21.55 15.69 23.33 15.91
Health care 15.70 15.64 16.85 14.98
Health care equipment and services 21.21 19.99 23.17 18.86
Pharmaceuticals and biotechnology 13.63 14.14 14.50 13.63
Technology 32.57 21.07 36.17 19.70
Software and computer services 33.48 22.01 37.68 20.53
Technology hardware and equipment 31.56 20.29 34.49 18.98
Oil and gas 4.29 3.35 4.22 3.69
Oil and gas producers 7.25 4.53 6.97 5.12
Oil equipment, services and distribution -11.72 -3.52 -10.30 -4.27
Alternative energy 2.22 21.30 -1.33 20.22
Basic materials 25.48 6.94 22.88 7.49
Chemicals 24.57 12.28 21.75 12.17
Forestry and paper 27.92 19.05 24.82 20.11
Industrial metals and mining 27.28 3.72 26.15 4.68
Mining 24.87 -3.66 22.23 -1.62
Telecommunications 3.61 8.74 2.90 9.37
Fixed line telecommunications -3.81 7.70 -3.87 7.62
Mobile telecommunications 12.48 9.60 10.95 10.98
Utilities 12.43 9.18 11.29 9.31
Electricity 10.94 10.33 10.77 10.17
Gas, water and multiutilities 14.27 7.69 11.92 8.21
Return | Return and risk 2017 | Government Pension Fund Global
32
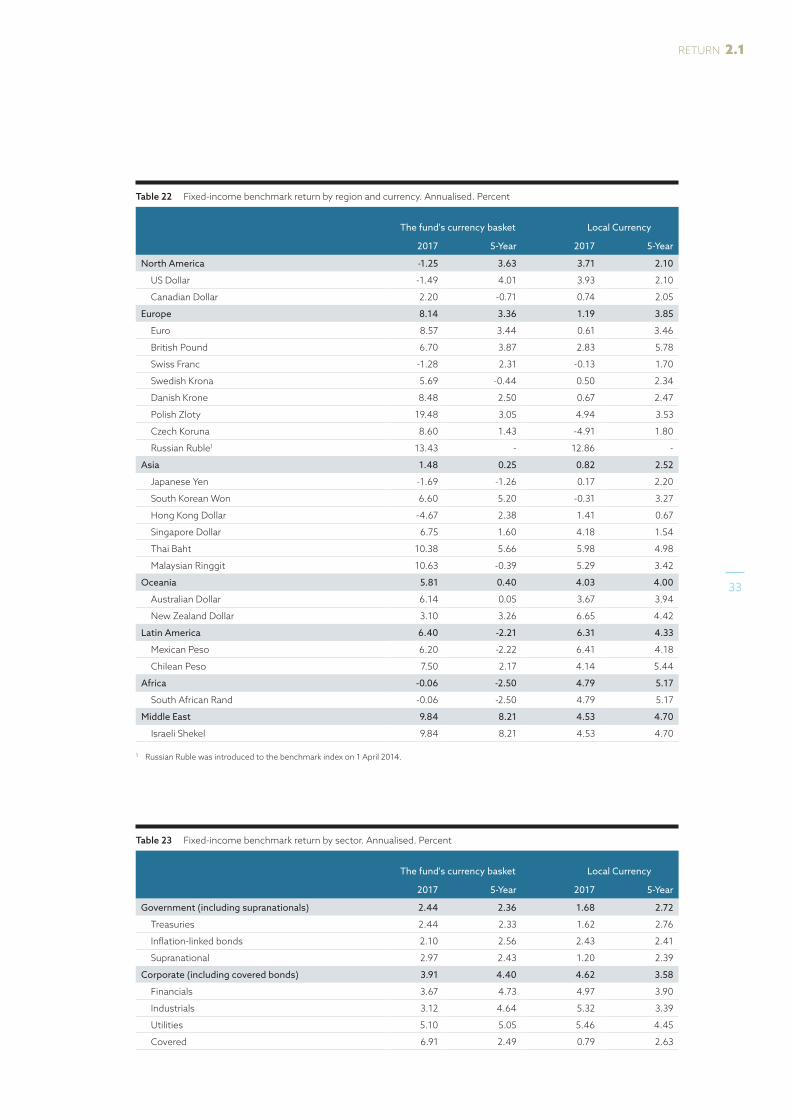
Table 22 Fixed-income benchmark return by region and currency. Annualised. Percent
The fund's currency basket Local Currency
2017 5-Year 2017 5-Year
North America -1.25 3.63 3.71 2.10
US Dollar -1.49 4.01 3.93 2.10
Canadian Dollar 2.20 -0.71 0.74 2.05
Europe 8.14 3.36 1.19 3.85
Euro 8.57 3.44 0.61 3.46
British Pound 6.70 3.87 2.83 5.78
Swiss Franc -1.28 2.31 -0.13 1.70
Swedish Krona 5.69 -0.44 0.50 2.34
Danish Krone 8.48 2.50 0.67 2.47
Polish Zloty 19.48 3.05 4.94 3.53
Czech Koruna 8.60 1.43 -4.91 1.80
Russian Ruble1 13.43 - 12.86 -
Asia 1.48 0.25 0.82 2.52
Japanese Yen -1.69 -1.26 0.17 2.20
South Korean Won 6.60 5.20 -0.31 3.27
Hong Kong Dollar -4.67 2.38 1.41 0.67
Singapore Dollar 6.75 1.60 4.18 1.54
Thai Baht 10.38 5.66 5.98 4.98
Malaysian Ringgit 10.63 -0.39 5.29 3.42
Oceania 5.81 0.40 4.03 4.00
Australian Dollar 6.14 0.05 3.67 3.94
New Zealand Dollar 3.10 3.26 6.65 4.42
Latin America 6.40 -2.21 6.31 4.33
Mexican Peso 6.20 -2.22 6.41 4.18
Chilean Peso 7.50 2.17 4.14 5.44
Africa -0.06 -2.50 4.79 5.17
South African Rand -0.06 -2.50 4.79 5.17
Middle East 9.84 8.21 4.53 4.70
Israeli Shekel 9.84 8.21 4.53 4.70
1 Russian Ruble was introduced to the benchmark index on 1 April 2014.
Table 23 Fixed-income benchmark return by sector. Annualised. Percent
The fund's currency basket Local Currency
2017 5-Year 2017 5-Year
Government (including supranationals) 2.44 2.36 1.68 2.72
Treasuries 2.44 2.33 1.62 2.76
Inflation-linked bonds 2.10 2.56 2.43 2.41
Supranational 2.97 2.43 1.20 2.39
Corporate (including covered bonds) 3.91 4.40 4.62 3.58
Financials 3.67 4.73 4.97 3.90
Industrials 3.12 4.64 5.32 3.39
Utilities 5.10 5.05 5.46 4.45
Covered 6.91 2.49 0.79 2.63
33
RETURN 2.1
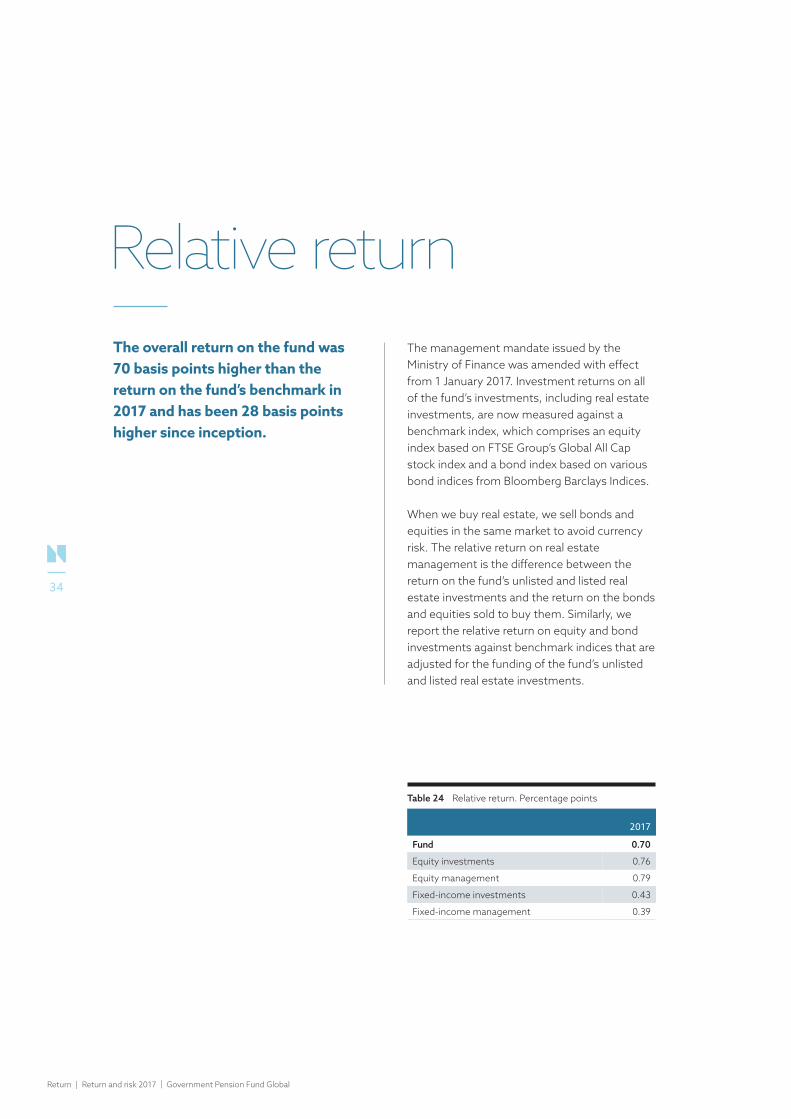
Relative returnThe overall return on the fund was 70 basis points higher than the return on the fund’s benchmark in 2017 and has been 28 basis points higher since inception.
The management mandate issued by the Ministry of Finance was amended with effect from 1 January 2017. Investment returns on all of the fund’s investments, including real estate investments, are now measured against a benchmark index, which comprises an equity index based on FTSE Group’s Global All Cap stock index and a bond index based on various bond indices from Bloomberg Barclays Indices.
When we buy real estate, we sell bonds and equities in the same market to avoid currency risk. The relative return on real estate management is the difference between the return on the fund’s unlisted and listed real estate investments and the return on the bonds and equities sold to buy them. Similarly, we report the relative return on equity and bond investments against benchmark indices that are adjusted for the funding of the fund’s unlisted and listed real estate investments.
Table 24 Relative return. Percentage points
2017
Fund 0.70
Equity investments 0.76
Equity management 0.79
Fixed-income investments 0.43
Fixed-income management 0.39
Return | Return and risk 2017 | Government Pension Fund Global
34

Chart 15 The fund’s quarterly and accumulated annualised relative return. Percentage points
Chart 16 Annual relative return on the fund’s asset management. Percentage points
Chart 18 The fund’s quarterly and accumulated annualised relative return. Percentage points
Source: Norges Bank Investment Management
-2.00
-1.75
-1.50
-1.25
-1.00
-0.75
-0.50
-0.25
0.00
0.25
0.50
0.75
1.00
1.25
1.50
1.75
2.00
-2.00
-1.75
-1.50
-1.25
-1.00
-0.75
-0.50
-0.25
0.00
0.25
0.50
0.75
1.00
1.25
1.50
1.75
2.00
98 99 00 01 02 03 04 05 06 07 08 09 10 11 12 13 14 15 16 17
Quarterly Relative Return Accumulated annualised relative return
Updated: AMF 06/02/2018
-8
-7
-6
-5
-4
-3
-2
-1
0
1
2
3
4
5
6
7
8
-8
-7
-6
-5
-4
-3
-2
-1
0
1
2
3
4
5
6
7
8
98 99 00 01 02 03 04 05 06 07 08 09 10 11 12 13 14 15 16 17
Equity management Fixed-income managementReal estate management Fund
Chart 16 Annual relative return on the fund’s asset management. Percentage points
Updated: AMF 28/02/2018
The overall return on the fund was 70 basis points higher than the return on the benchmark index in 2017. Since the fund’s inception, the annualised return on the fund has been 28 basis points higher than the return on the fund’s benchmark.
The fund has outperformed its benchmark index in 16 out of 20 years since 1 January 1998, equity management in 15 out of 19 years, and fixed-income management in 15 out of 20 years.
Equity management had a relative return of 79 basis points in 2017, measured against its actual funding. Since 1 January 1999, the annualised relative return for equity management has been 51 basis points. The relative return on the fixed-income management was 39 basis points, measured against its funding, and has been 15 basis points annualised since 1 January 1998. The real estate management returned 70 basis points more than its funding benchmark in 2017.
From 2017, all real estate investments are included in the fund’s relative return. The total real estate investments returned 9.0 percent in 2017. The return on the equities and bonds sold to finance these real estate investments was 8.3 percent. A comparison with this funding shows a relative return for the fund’s total real estate investments of 0.7 percentage point.
THE USE OF BENCHMARKSInvestment strategies and mandates are measured relative to performance benchmarks. This section provides an overview of the use of benchmarks in Norges Bank Investment Management, with an emphasis on the link between the Ministry of Finance benchmark, the internal reference portfolio, funding and performance benchmarks for particular investment mandates, and how they all fit together to produce the final investment portfolio.
35
RETURN 2.2

Fund allocation aims to improve the fund’s exposure to broad markets and sources of return, in both the medium and the long term. While the total return on the fund is largely determined by the Ministry of Finance benchmark, the internal reference portfolio is tailored to better fit the characteristics of the fund by improving geographical diversification, gaining exposure to additional sources of systematic risk, reducing turnover and funding the fund’s real estate portfolios.
The reference portfolio is rule-based and serves as a starting point for the management of the fund. The rules governing the reference portfolio are based on a trade-off between ensuring appropriate aggregate exposures while keeping the complexity low. Implementing the reference portfolio in a strictly mechanical manner may result in excessively high transaction costs or undesirable exposures relative to the Ministry of Finance benchmark. We manage the risk arising from any such relative exposures through allocation decisions. The internal reference portfolio and allocation decisions combined make up fund allocation. The relative return on the Fund allocation strategy is measured versus the Ministry of Finance benchmark.
In addition to the internal reference portfolio, we use funding benchmarks and performance benchmarks to implement the fund’s
investment strategies. These two types of benchmarks serve different purposes in implementing and measuring the fund’s investment strategies.
We need to sell assets to finance a given investment mandate, and funding benchmarks are used to express which assets we sell. The combination of funding assets is tailored to each investment mandate in order to maintain the fund’s overall sector or country exposures. The mix of assets we sell therefore does not necessarily match the assets in the performance benchmark.
The mandates within security selection are highly specialised within a certain sector or market, and we therefore use tailored performance benchmarks to measure the relative performance of any given investment mandate. Performance benchmarks are designed to match the scope of each particular investment mandate in order to accurately measure the relative performance.
The asset management strategy implements the reference portfolio, and manages the funding of mandates of the security selection investment strategy. The asset management performance is measured relative to the reference portfolio after the funding of security selection is taken out.
Return | Return and risk 2017 | Government Pension Fund Global
36
Table 26 Relative return on the fund’s asset management. Measured in the fund’s currency basket. Percentage points
Year Fund1Equity
managementFixed-income management
Real estate management
20172 0.70 0.79 0.39 0.70
2016 0.15 0.15 0.16 -
2015 0.45 0.83 -0.24 -
2014 -0.77 -0.82 -0.70 -
2013 0.99 1.28 0.25 -
2012 0.21 0.52 -0.29 -
2011 -0.13 -0.48 0.52 -
2010 1.06 0.73 1.53 -
2009 4.13 1.86 7.36 -
2008 -3.37 -1.15 -6.60 -
2007 -0.24 1.15 -1.29 -
2006 0.14 -0.09 0.25 -
2005 1.06 2.16 0.36 -
2004 0.54 0.79 0.37 -
2003 0.55 0.51 0.48 -
2002 0.30 0.07 0.49 -
2001 0.15 0.06 0.08 -
2000 0.27 0.49 0.07 -
1999 1.23 3.49 0.01 -
1998 0.18 - 0.21 -
1 Includes real estate management from 01.01.2017. Relative return prior to 2017 is calculated on the equity and fixed-income management only.2 Measured against actual funding.
Table 25 Return on real estate investments in 2017. Measured in the fund’s currency basket. Percent
2017
Return on unlisted real estate investments 7.5
Return on listed real estate investments 14.1
Return on real estate management 9.0
Funding benchmark for real estate management 8.3
37
RETURN 2.2
In combination this means that the security selection strategies are measured relative to performance benchmarks, while the asset management strategy is measured relative to the reference portfolio after taking out the effect of the corresponding funding benchmarks. The reference portfolio is measured relative to the Ministry of Finance benchmark, and the layered benchmark structure ensures that the fund allocation, combined security selection, and asset management relative performance equals the investment portfolio performance relative to the Ministry of Finance benchmark.
The fund’s allocation to real estate is funded with a combination of equity and fixed income, which is tailored to the specific real estate investments. We adjust the funding to currency and market risk. The reference portfolio, as the starting point for our equity and fixed-income investments, reflects these funding adjustments. This allows accurate measurement of the relative return contributions from all other investment strategies.
Return | Return and risk 2017 | Government Pension Fund Global
38

Table 27 Relative return. Measured in the fund’s currency basket. Annualised
Since 01.01.1998
Last 10 years
Last 5 years 2017
Return on fund (percent)1 6.09 6.16 9.25 13.66
Return on fund benchmark (percent)1 5.81 6.01 8.96 12.96
Relative return on fund (percentage points)1 0.28 0.15 0.29 0.70
Return on equity management (percent)2 6.15 5.96 12.95 19.50
Return on benchmark for equity management (percent)2
5.65 5.76 12.52 18.70
Relative return on equity management (percentage points) 2
0.51 0.20 0.42 0.79
Return on fixed-income management (percent) 4.76 4.40 2.96 3.31
Return on benchmark for fixed-income management (percent)
4.61 4.20 2.98 2.92
Relative return on fixed-income management (percentage points)
0.15 0.20 -0.02 0.39
1 Includes real estate management from 01.01.2017. Relative return prior to 2017 is calculated on the equity and fixed-income management only.2 Equity management since 01.01.1999.
Table 28 Relative return, 5-year buckets. Measured in the fund’s currency basket. Annualised
1998 – 2002
2003– 2007
2008 – 2012
2013 – 2017
Return on fund (percent)1 3.19 8.92 3.15 9.25
Return on fund benchmark (percent)1 2.78 8.52 3.14 8.96
Relative return on fund (percentage points)1 0.41 0.40 0.01 0.29
Return on equity management (percent)2 -4.85 16.28 -0.59 12.95
Return on benchmark for equity management (percent)2 -5.63 15.37 -0.59 12.52
Relative return on equity management (percentage points)2
0.78 0.90 0.01 0.42
Return on fixed-income investments (percent) 6.26 4.00 5.87 2.96
Return on benchmark for fixed-income management (percent)
6.09 3.97 5.44 2.98
Relative return on fixed-income management (percentage points)
0.17 0.03 0.43 -0.02
1 Includes real estate management from 01.01.2017. Relative return prior to 2017 is calculated on the equity and fixed-income management only.2 Equity management since 01.01.1999.
39
RETURN 2.2

INVESTMENT STRATEGIES LAST FIVE YEARSThe fund’s annualised relative return of 29 basis points over the last five years can be divided into contributions from the main investment strategies employed for the management of the fund, as well as asset classes.
Fund allocation strategies have contributed -7 basis points, security selection strategies 14 basis points and asset management strategies 22 basis points, in annualised relative return for the fund as a whole over the last five years.
Fund allocationFund allocation aims to improve the fund’s exposure to broad markets and sources of return. The three strategies it employs to achieve are the internal reference portfolio, the real estate strategy and allocation decisions.
Fund allocation had a negative contribution of 7 basis points to the fund’s relative return for the five-year period from 2013 to 2017.
Internal reference portfolioThrough a series of adjustments to publicly available equity and fixed-income indices, the internal reference portfolio is tailored to better fit the characteristics of the fund through improved diversification, efficient exposure to additional sources of systematic risk, reduced turnover and funding of the fund’s real estate allocation.
The internal reference portfolio made a negative contribution of 8 basis points to the fund’s relative return in the period from 2013 to 2017. Adjustments to the fixed-income benchmark index contributed -9 basis points to the fund’s relative return, while equity index adjustments contributed 1 basis point.
Real estateFollowing the amendment of the management mandate from the Ministry of Finance effective January 2017, the fund’s real estate investments are measured against the fund’s benchmark index of global equity and bond indices. In the operational implementation of the fund’s real estate strategy, the fund’s unlisted and listed real estate investments are measured against internal funding benchmarks that consist of tailored equity and bond holdings in the same currency as the real estate investments.
In 2017, the real estate strategy contributed 3 basis points to the fund’s relative return, which gives a total impact to the fund’s relative return over the period 2013 to 2017 of 1 basis point.
In 2017, the listed real estate investments contributed with 1 basis point. The unlisted real estate investments contributed with 2 basis points, after the unlisted real estate investments returned 7.5 percent in 2017, against a 6.8 percent return for its funding benchmark.
A more detailed review of the factor adjustments made can be found under the section “Reference portfolio return” in chapter 1.3 Reference portfolio.
Return | Return and risk 2017 | Government Pension Fund Global
40

Allocation decisionsAllocation decisions involve rebalancing the reference portfolio’s exposure to a number of return drivers, the fund’s exposure to emerging markets and factor strategies. These adjustments include changes to the equity share, duration or currency composition.
Overall, allocation decisions have added 1 basis point to the relative return of the fund for the five-year period. Cross-asset allocation decisions have contributed positively by 3 basis points, while equity related decisions have contributed negatively by 2 basis points. Fixed-income related decisions in aggregate have had a negligible impact.
Security selectionSecurity selection strategies seek to generate excess return over carefully designed benchmarks.
Security selection strategies cover both internal and external selection strategies. The combined security selection strategies have contributed 14 basis points in annualised relative return for the fund since 2013.
Internal security selectionThe main activity within internal security selection is to identify and invest in companies that will generate better long-term investment returns than their competitors.
The internal security selection strategy has contributed 2 basis points to the fund’s relative return over the last five years. The equity portfolios within internal security selection contributed 3 basis points to the fund’s annual relative return, while the internal selection strategy have had an impact of negative 1 basis point.
The fund’s investments within industry sectors change as a result of internal security selection. The impact of such changes to the fund’s equity investments made an annual contribution of 3 basis points to the fund’s relative return since 2013. The single largest positive impact came from changing the fund’s investments within the basic resources subsector. This contributed 4 basis points to the fund’s relative return. Insurance and financial services both contributed 2 basis points per year, while retail made a negative contribution of 4 basis points per year.
Although the main activity is to change the fund’s investments within industries, internal security selection also has an impact on the fund’s investments across industries. An increase in the fund’s equity investments in financial services contributed 2 basis points to the fund’s annual relative return, as financial services outperformed the market. Underweights in health care and technology each contributed -1 basis point. Overall, changes to the composition of the fund’s equity investments across industries have made an immaterial impact on the fund’s relative return.
As regards the impact of changing the fund’s equity investments within countries, the single largest impact came from changing the investments within the US. This contributed 3 basis points to the fund’s relative return. The contribution from changing the fund’s investments in Switzerland contributed -3 basis points. The combined impact on the fund’s relative return from changing the geographical distribution across regions was -1 basis point.
41
RETURN 2.2

Fund allocation aims to improve the fund’s exposure to broad markets and sources of return, in both the medium and the long term.
Return | Return and risk 2017 | Government Pension Fund Global
42
The fixed-income portfolios within internal security selection invest in corporate bonds. The contribution to the fund’s relative return over the last five years has been -1 basis point.
External security selectionNorges Bank Investment Management utilises external equity managers with expertise in markets and segments where it is not expedient to build internal expertise, and where local knowledge is important to understand the inherent environmental, social and governance risks. External equity mandates invest in emerging markets, small capitalisation companies in developed markets, and environment-related investments. On average, around 4 percent of the fund was managed by external equity managers in the period.
The external security selection strategy has contributed 11 basis points to the fund’s annualised relative return over the last five years.
Each of the mandates in emerging markets and small capitalisation developed markets is measured against a broad benchmark within its respective country or a benchmark having a market capitalisation composition corresponding to the mandate objective. Both the small capitalisation developed market mandates and the emerging market mandates have contributed positively to the relative return. Within emerging market mandates, all regions have contributed positively to the relative return, with a combined total of 10 basis points over the five-year period. The mandates in the Asian region have had the largest positive contributions with the China and India mandates as considerable positive contributors.
Asset managementAsset management encompasses a broad range of systematic strategies for both equities and fixed income. In the period from 2013 to 2017, the asset management strategy has contributed 22 basis points to the fund’s annualised relative return.
Asset positioningAsset positioning implements the targeted market exposures with an aim to enhance investment returns and lower transaction costs for the fund. In the five-year period, asset positioning has contributed 16 basis points to the annualised relative return of the fund.
The investment strategy’s equity investments have contributed 8 basis points. Of this, integrated market exposure and relative value strategies accounted for 7 basis points. European equities contributed the most with just over half of the result, followed by Asian equities.
Broken into market segments, the largest contribution came from developed large capitalisation companies, followed by emerging market companies and developed small capitalisation companies.
In addition to the risk factors inherent in the reference portfolios, the asset positioning strategy has been positioned towards dynamically managed systematic factors. These factors have contributed 1 basis point annually to the fund’s relative return over the five-year period. Adding this together with the systematic factors inherent in the reference portfolio, the factors have contributed 4 basis points in total, with positioning towards quality contributing the most.
43
RETURN 2.2

Asset positioning’s fixed-income investments have contributed 8 basis points. Several strategies are pursued, such as new issues, and relative value strategies across instruments, sectors, and issuers. In addition, there are positions that can be more large-scale, related to transition activity, and hence motivated by reduction of transaction costs.
Investments in government, government-related and covered bonds in developed markets have contributed 4 basis points. European bonds had the largest contribution with 2 basis points, while North-American bonds contributed 1 basis point.
Investments in corporate bonds have contributed 3 basis points to the fund’s relative return. The contribution has been driven by strategies focusing on variation in issuer and sector spread curves, as well as new issue premiums. Investments in emerging market bonds have contributed 1 basis point to the fund’s relative return over the five-year period. Balanced duration positions across countries have contributed most.
Securities lendingSecurities lending is an integrated part of our asset management strategies. We use both direct internal lending and external agency lending through our custodian.
The fund’s securities lending activities have contributed 6 basis points to the fund’s relative return. Lending of equity investments contributed 5 basis points. The Asia and Oceania region has contributed 45 percent of the equity revenues, while Americas and Europe split the balance with 28 and 27 percent respectively. Bond lending has contributed 1 basis point to the fund’s return over the five-year period.
Return | Return and risk 2017 | Government Pension Fund Global
44

Table 29 Contributions to fund relative return from investment strategies in 2017. Percentage points
Equitymanagement
Fixed-incomemanagement
Real estate management Allocation Total
Fund allocation 0.10 0.08 0.03 0.01 0.22
Internal reference portfolio 0.13 0.10 0.01 0.23
of which systematic factors 0.02 0.02
of which universe expansion -0.01 0.08 0.08
Allocation decisions -0.03 -0.02 0.00 -0.04
Real estate 0.03 0.03
Unlisted real estate 0.02 0.02
Listed real estate 0.01 0.01
Security selection 0.43 -0.03 0.40
Internal security selection 0.22 -0.03 0.19
External security selection 0.21 0.21
Asset management -0.04 0.10 0.03 0.08
Asset positioning -0.09 0.08 0.03 0.02
Securities lending 0.04 0.02 0.06
Total 0.49 0.14 0.03 0.04 0.70
Table 30 Contributions to fund relative return from investment strategies for 2013-2017. Annualised. Percentage points
Equitymanagement
Fixed-incomemanagement
Real estate management Allocation Total
Fund allocation -0.01 -0.10 0.01 0.03 -0.07
Internal reference portfolio 0.01 -0.09 0.00 -0.08
of which systematic factors 0.02 0.02
of which universe expansion 0.00 -0.05 -0.05
Allocation decisions -0.02 0.00 0.03 0.01
Real estate 0.01 0.01
Unlisted real estate 0.00 0.00
Listed real estate 0.00 0.00
Security selection 0.14 -0.01 0.14
Internal security selection 0.03 -0.01 0.02
External security selection 0.11 0.11
Asset management 0.13 0.08 0.01 0.22
Asset positioning 0.08 0.08 0.01 0.16
Securities lending 0.05 0.01 0.06
Total 0.27 -0.02 0.01 0.04 0.29
45
RETURN 2.2
Return and costs Norges Bank maintains a high level of cost awareness in the management of the fund. Total management costs as a share of assets under management have been relatively stable over recent years, despite the inclusion of additional markets and currencies, increased capital managed externally and the build-up of a portfolio of unlisted real estate investments.
relevant strategy based on headcount. Specific system costs are allocated to each strategy based on actual costs.
Custody costs consist of safekeeping, transaction and performance measurement costs related to external managers. Safekeeping costs are allocated to the asset management strategy, while transaction costs are split between the relevant strategies based on transaction volumes. Performance measurement costs are allocated to the external security selection strategy, as well as base- and performance fee to external managers, and costs related to the internal team managing the external managers. Costs related to ownership strategies are allocated to internal security selection.
Source: Norges Bank Investment Management
0
5
10
15
0
5
10
15
98 99 00 01 02 03 04 05 06 07 08 09 10 11 12 13 14 15 16 17
Chart 17 Total management costs versus total market value of fund. Costs reimbursed by the Ministry of Finance. Basis points
The overall goal is to seek the highest possible return after costs, and manage the fund in a cost-efficient manner.
The Ministry of Finance has delegated responsibility for the management of the fund to Norges Bank. The Ministry of Finance reimburses Norges Bank for costs incurred in connection with the management of the fund, in form of a management fee within an annual limit. Performance-based fees to external managers are reimbursed separately. Management costs are also incurred in subsidiaries of Norges Bank that have been established as part of the fund’s investments in unlisted real estate. These costs are also measured against the annual limit, but they are not reimbursed or included in the management fee, since they are expensed directly in the investment portfolio.
MANAGEMENT COSTS BY STRATEGY We pursue a variety of investment strategies in our management of the fund. These strategies complement and influence one another, and there are cost synergies between the strategies. For example, costs related to a specific system or data feed might be utilised in multiple strategies.
We allocate costs to the different strategies based on actual costs or allocation keys such as number of employees or volume. Costs related to salary, personnel, research, consultants and legal services are allocated to the relevant strategy based on actual costs. Costs related to office premises and IT infrastructure are allocated to the
Return | Return and risk 2017 | Government Pension Fund Global
46
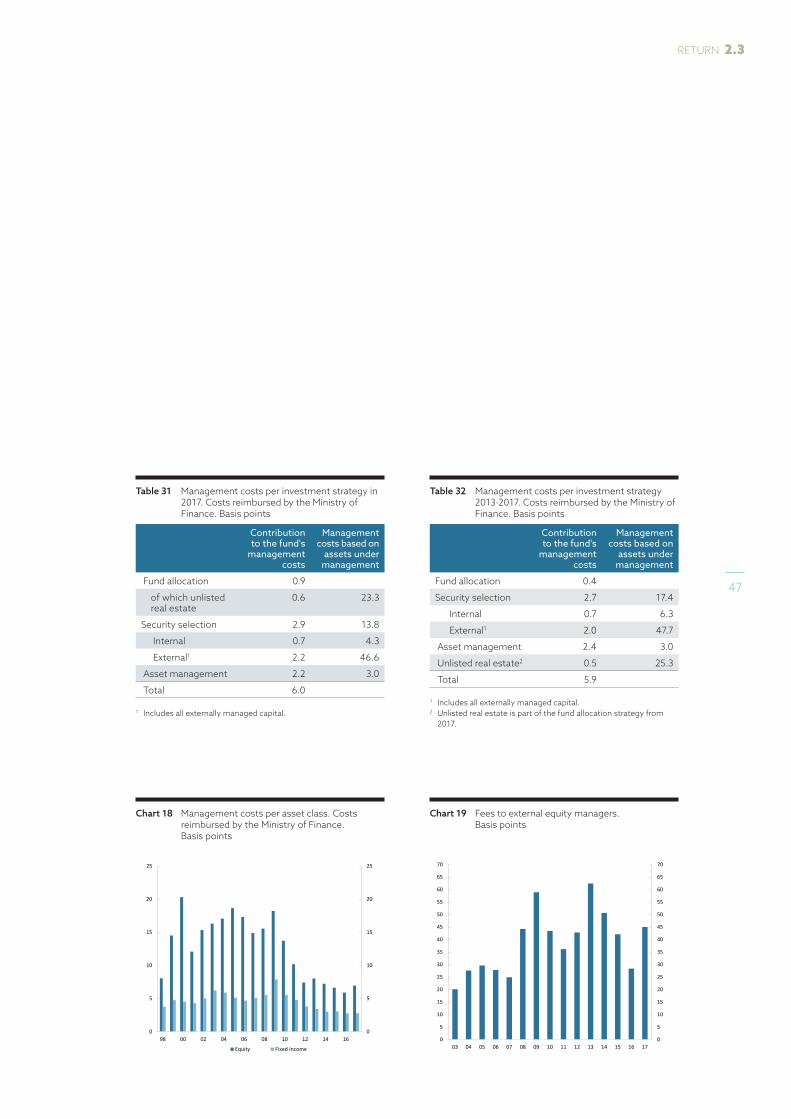
Source: Norges Bank Investment Management
0
5
10
15
20
25
0
5
10
15
20
25
98 00 02 04 06 08 10 12 14 16
Equity Fixed Income
Table 31 Management costs per investment strategy in 2017. Costs reimbursed by the Ministry of Finance. Basis points
Contribution to the fund's
management costs
Management costs based on
assets under management
Fund allocation 0.9
of which unlisted real estate
0.6 23.3
Security selection 2.9 13.8
Internal 0.7 4.3
External1 2.2 46.6
Asset management 2.2 3.0
Total 6.0
1 Includes all externally managed capital.
Table 32 Management costs per investment strategy 2013-2017. Costs reimbursed by the Ministry of Finance. Basis points
Contribution to the fund's
management costs
Management costs based on
assets under management
Fund allocation 0.4
Security selection 2.7 17.4
Internal 0.7 6.3
External1 2.0 47.7
Asset management 2.4 3.0
Unlisted real estate2 0.5 25.3
Total 5.9
1 Includes all externally managed capital.2 Unlisted real estate is part of the fund allocation strategy from
2017.
Chart 18 Management costs per asset class. Costs reimbursed by the Ministry of Finance. Basis points
Source: Norges Bank Investment Management
0
5
10
15
20
25
30
35
40
45
50
55
60
65
70
0
5
10
15
20
25
30
35
40
45
50
55
60
65
70
03 04 05 06 07 08 09 10 11 12 13 14 15 16 17
Chart 19 Fees to external equity managers. Basis points
47
RETURN 2.3

COST-ADJUSTED RELATIVE RETURNThe fund’s relative return after management costs can be compared with the investment performance that could theoretically be expected to be achieved with a passive index management strategy.
A passive investment strategy would aim at replicating a benchmark following set rules. The estimated relative return of a passive strategy is dependent on various estimated cost components. The return adjustments made are management costs of a passive strategy, revenues from securities lending, transaction costs related to replication of the benchmark index and transaction costs related to inflows and extraordinary benchmark changes.
Management costs of a passive strategyThe estimated management costs for a passive management strategy are based on the fund’s actual management costs for each year, where costs related to both internal and external active management strategies have been subtracted.
Revenues from securities lendingUnlike a theoretical index, but similar to an actively managed portfolio, a passive index portfolio would also be expected to generate income from securities lending activities. In this analysis, actual revenues from securities lending have been used, consistent with the financial reporting for the fund.
Transaction costs related to replication of the benchmark indexChanges in the equity and bond indices, such as company inclusions and periodic index re-weightings, would trigger transactions in the portfolio and subsequent costs. These index replication costs are estimates based on models and not on realised costs, and are therefore uncertain in nature.
Transaction costs related to inflows and extraordinary benchmark changesThese costs are estimated costs related to the phasing-in of new capital into the fund, costs related to the set rules for rebalancing of the asset allocation in the benchmark, and transition costs related to rule changes for the benchmark. The broad benchmark indices for equity and fixed-income investments set by the Ministry of Finance are used as the underlying indices. The costs related to inflows, rebalancing and index transition costs are estimates based on standard market assumptions about trading costs and not actual realised costs, and are therefore uncertain in nature.
The estimated relative return of a passive strategy since inception is -7 basis points. Comparing the fund’s relative return after management costs with the estimated relative return of a passive strategy, the estimated relative return difference since inception is 27 basis points. Measured over the last five years the difference is estimated at 25 basis points.
Return | Return and risk 2017 | Government Pension Fund Global
48
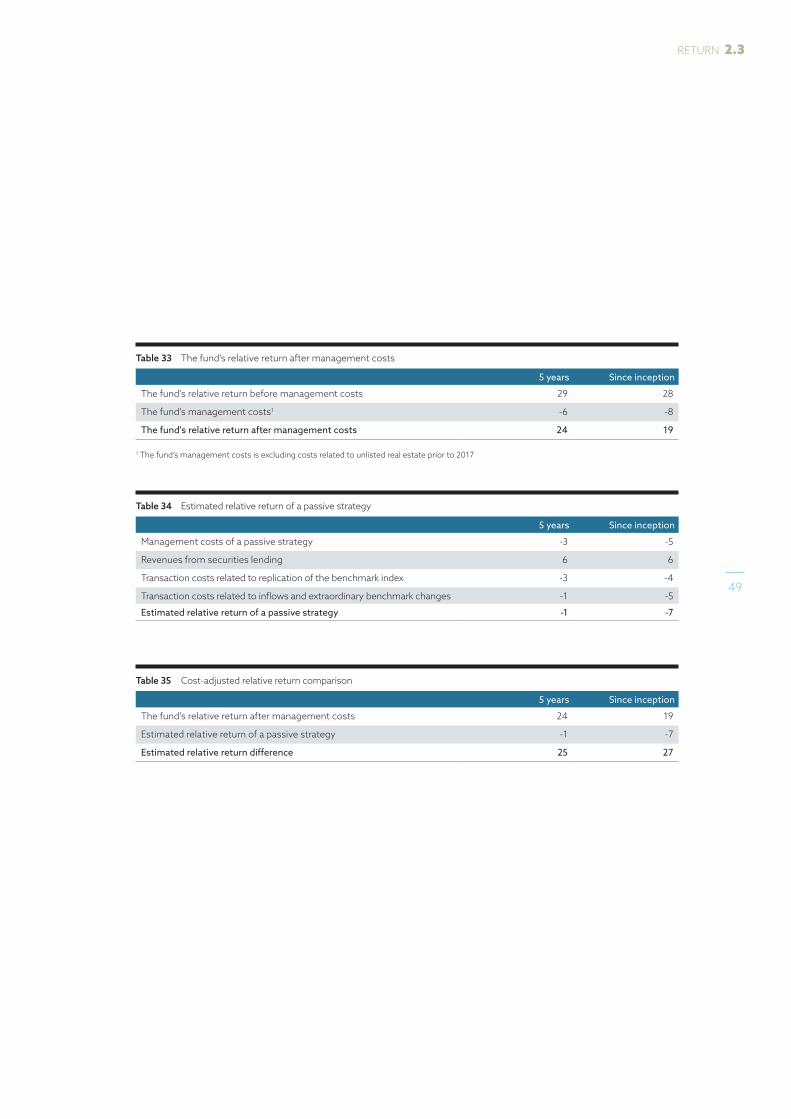
Table 33 The fund’s relative return after management costs
5 years Since inception
The fund's relative return before management costs 29 28
The fund's management costs1 -6 -8
The fund's relative return after management costs 24 19
1 The fund’s management costs is excluding costs related to unlisted real estate prior to 2017
Table 34 Estimated relative return of a passive strategy
5 years Since inception
Management costs of a passive strategy -3 -5
Revenues from securities lending 6 6
Transaction costs related to replication of the benchmark index -3 -4
Transaction costs related to inflows and extraordinary benchmark changes -1 -5
Estimated relative return of a passive strategy -1 -7
Table 35 Cost-adjusted relative return comparison
5 years Since inception
The fund's relative return after management costs 24 19
Estimated relative return of a passive strategy -1 -7
Estimated relative return difference 25 27
49
RETURN 2.3

Risk The fund’s risk is primarily driven by its asset allocation. The expected volatility of the fund was 10.8 percent at the end of 2017.
Market risk is defined as the risk of a decrease in the market value of the portfolio as a result of changes in financial market variables such as equity prices, exchange rates, interest rates, credit spreads and real estate prices. As no single measure or analysis can fully capture the fund’s overall market risk, Norges Bank Investment Management uses a variety of measures and analyses. The fund’s market risk is measured along different dimensions, including absolute exposure, volatility and correlation risk, systematic factor risk and liquidity risk.
ASSET CLASS ALLOCATIONThe strategic benchmark index in the management mandate laid down by the Ministry of Finance largely dictates the fund’s asset class allocation, which is the main driver of the fund’s overall risk. This can be demonstrated by plotting the returns of a hypothetical portfolio made up of a fixed allocation to equities and fixed income. A portfolio with a 62.5 percent allocation to equities would, since 1900, have suffered a maximum loss in a single year of around 32 percent. Changing the equity allocation to 70 percent would have resulted in a higher maximum loss of approximately 34 percent in a single year since 1900. The analysis shows that the majority of the return fluctuations in such a portfolio have been driven by equity returns. If the returns are viewed over periods of five and ten years, a large majority of these periods have had a positive return. However, this asset allocation also results in both five- and ten-year periods with negative returns.
Chart 26 The fund's absolute equity exposure. Percent
Source: Norges Bank Investment Management
30
35
40
45
50
55
60
65
70
30
35
40
45
50
55
60
65
70
99 00 01 02 03 04 05 06 07 08 09 10 11 12 13 14 15 16 17
Chart 20 The fund’s absolute equity exposure. Percent
Historical returns may not fully reflect future risks. In a stressed scenario with all asset classes falling together, losses in a single year could be higher than indicated in this analysis. The return time series is measured in US dollars but the fund value measured in Norwegian kroner fluctuates further due to exchange rate changes. If historical relationships between the Norwegian kroner and prices of bonds and equities change in the future, this could lead to losses of more than 40 percent in fund value in a single year measured in Norwegian kroner.
The management mandate requires the fund’s equity portfolio to make up between 50 and 80 percent of the total investment portfolio. From 2007 to 2009, the fund’s equity exposure increased gradually from 40 to 60 percent, mirroring the increase in the equity allocation in the strategic benchmark. Following the inclusion of unlisted real estate in the measurement of relative return in 2017, the equity allocation in
Risk | Return and risk 2017 | Government Pension Fund Global
50
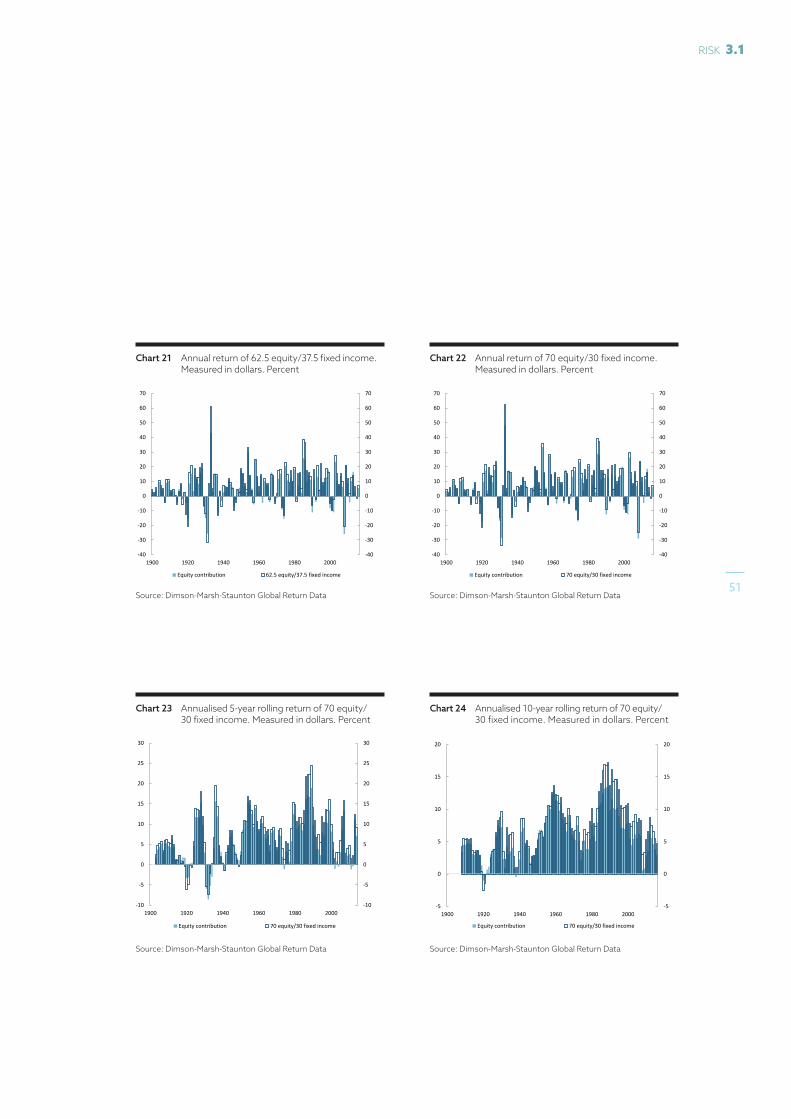
Chart 23a Annual return of 62.5 equity/37.5 fixed income.Measured in dollars. Percent
Source: Dimson-Marsh-Staunton Global Return Data
-40
-30
-20
-10
0
10
20
30
40
50
60
70
1900 1920 1940 1960 1980 2000-40
-30
-20
-10
0
10
20
30
40
50
60
70
Equity contribution 62.5 equity/37.5 fixed income
Chart 23b Annual return of 70 equity/30 fixed income.Measured in dollars. Percent
Source: Dimson-Marsh-Staunton Global Return Data
-40
-30
-20
-10
0
10
20
30
40
50
60
70
1900 1920 1940 1960 1980 2000-40
-30
-20
-10
0
10
20
30
40
50
60
70
Equity contribution 70 equity/30 fixed income
Chart 25 Annualised 10-year rolling return of 70 equity/30 fixed income. Measured in dollars. Percent.
Source: Dimson-Marsh-Staunton Global Return Data
-5
0
5
10
15
20
1900 1920 1940 1960 1980 2000-5
0
5
10
15
20
Equity contribution 70 equity/30 fixed income
Chart 24 Annualised 5-year rolling return of 70 equity/30 fixed income. Measured in dollars. Percent.
Source: Dimson-Marsh-Staunton Global Return Data
-10
-5
0
5
10
15
20
25
30
1900 1920 1940 1960 1980 2000-10
-5
0
5
10
15
20
25
30
Equity contribution 70 equity/30 fixed income
Chart 21 Annual return of 62.5 equity/37.5 fixed income. Measured in dollars. Percent
Chart 22 Annual return of 70 equity/30 fixed income. Measured in dollars. Percent
Chart 24 Annualised 10-year rolling return of 70 equity/ 30 fixed income. Measured in dollars. Percent
Chart 23 Annualised 5-year rolling return of 70 equity/ 30 fixed income. Measured in dollars. Percent
Source: Dimson-Marsh-Staunton Global Return Data Source: Dimson-Marsh-Staunton Global Return Data
Source: Dimson-Marsh-Staunton Global Return DataSource: Dimson-Marsh-Staunton Global Return Data
51
RISK 3.1

Chart 27 The fund’s expected absolute volatility. Percent
Source: Norges Bank Investment Management
0
5
10
15
20
25
30
0
5
10
15
20
25
30
02 03 04 05 06 07 08 09 10 11 12 13 14 15 16 17
Chart 28 Expected absolute volatility per asset class.Percent
Source: Norges Bank Investment Management
0
5
10
15
20
25
30
35
40
45
50
0
5
10
15
20
25
30
35
40
45
50
02 03 04 05 06 07 08 09 10 11 12 13 14 15 16 17
Equity Fixed income Unlisted real estate
Chart 25 The fund’s expected absolute volatility. Percent Chart 26 Expected absolute volatility per asset class. Percent
the strategic benchmark increased to 62.5 percent. Actual equity exposure at the end of 2017 was 66.7 percent.
EXPECTED ABSOLUTE VOLATILITYThe fund’s expected absolute volatility, calculated using the statistical measure of standard deviation, shows how much the annual return on the fund’s investments can be expected to fluctuate and takes into account the correlations between different investments in the portfolio. Volatility is annualised using the square root of time rule, which assumes independence of returns over time and that return properties are consistent.
The method for calculating expected volatility, both absolute and relative, was revised in January 2011 to make it more appropriate for the fund’s long-term investment horizon. Until the end of 2010, expected volatility had been calculated based on daily price observations, with recent days’ data having greater weight
than observations further back in time. This meant that short-term changes in market conditions had a rapid and marked effect on expected volatility. The current method calculates volatility on the basis of weekly prices using an equal-weighted three-year price history, making the measure less sensitive to short-term market turbulence and more a result of changes in the fund’s investments.
At the end of 2017, expected absolute volatility was 10.8 percent using a three-year price history, an increase of 0.2 percentage point from the end of 2016. This means that annual value fluctuations of approximately 920 billion kroner can be expected for the portfolio. The expected absolute volatility of the equity investments was 13.6 percent at the end of 2017, compared to 14.0 percent at the end of 2016, while the volatility of the fixed-income investments was 9.4 percent, compared to 9.7 percent at the end of 2016. The increase in the
Risk | Return and risk 2017 | Government Pension Fund Global
52

Table 36 Risk contribution to equity investments as at 31 December 2017. Volatility measured in Norwegian kroner. Percent
Sector Weight
Absolutevolatility
contribution
Financials 24.5 3.6
Industrials 14.3 1.9
Consumer goods 13.5 1.7
Technology 11.2 1.7
Consumer services 10.1 1.3
Health care 9.8 1.3
Basic materials 6.0 0.8
Oil and gas 5.6 0.8
Telecommunications 2.8 0.3
Utilities 2.6 0.3
Cash and derivatives -0.5 0.0
Total equities 100.0 13.6
Table 37 Risk contribution to fixed-income investments as at 31 December 2017. Volatility measured in Norwegian kroner. Percent
Sector Weight
Absolute volatility
contribution
Government bonds 55.8 5.3
Government-related bonds 12.1 1.0
Inflation-linked bonds 5.0 0.5
Corporate bonds 24.2 2.4
Securitised bonds 5.1 0.4
Cash and derivatives -2.1 -0.1
Total fixed income 100.0 9.4
fund’s expected volatility is primarily due to the increased share of equities in the portfolio.
The absolute volatility of the fund at the end of 2017 was higher than the average for the last 15 years, which was 9.6 percent at the fund level at year-end. The average absolute volatility for equity and fixed-income investments was 14.7 and 9.3 percent respectively.
Estimated by means of historical simulations of the current portfolio, expected volatility has been 11.4 percent using a ten-year sampling history. Within this ten-year period, the highest expected volatility of a consecutive three-year period was 14.3 percent and the lowest 8.1 percent.
BREAKDOWN OF EXPECTED ABSOLUTE VOLATILITYThe expected volatility of equity investments was 13.6 percent at the end of 2017. A decomposition of the portfolio by industry
shows that investments in financials contributed the most to the volatility in the portfolio, with 3.6 percentage points. This was, however, also the largest sector, representing 24.5 percent of equity investments at the end of 2017. Measured in the fund’s currency basket, the expected volatility of equity investments was 12.1 percent at the end of the year.
The expected volatility of the fund’s fixed-income investments was 9.4 percent at the end of 2017. Government bonds constituted the largest sector and contributed 5.3 percentage points of the total volatility. Volatility of the fixed-income investments was mostly due to fluctuations in the value of the krone against the fund’s currency basket. Measured in the fund’s currency basket, the expected absolute volatility of fixed-income investments was 3.1 percent at the end of 2017.
53
RISK 3.1

Relative risk Deviations from the benchmark are sources of relative risk. There are various approaches to measuring relative risk in the fund.
Chart 27 The fund’s expected relative volatility. Basis points
Chart 28 Expected relative volatility for the fixed-income and equity asset classes. Basis points
scope for deviation from the benchmark is regulated by the Ministry of Finance and Norges Bank’s Executive Board.
EXPECTED RELATIVE VOLATILITYThe limit for expected relative volatility, or tracking error, is a restriction on how much the return on the fund’s investments can be expected to deviate from the return on the benchmark index. This restriction is set out in the management mandate laid down by the Ministry of Finance. A significant change in 2017 was to the treatment of unlisted real estate investments, which are now included in the measurement against the actual benchmark. The limit for expected relative volatility for the fund is still 1.25 percentage points. The expected relative volatility, using a three-year price history, was 33 basis points at the end of 2017. Estimated by historical simulations of the current portfolio, the expected relative volatility using a ten-year price history was 46 basis
The composition of the fund differs from its benchmark index along several dimensions including currencies, sectors, countries, regions, individual stocks and bond issuers and having investments in unlisted real estate. These deviations from the benchmark are sources of relative risk.
The mandate issued by the Ministry of Finance was changed with effect from 1 January 2017. All the fund’s investments, including unlisted real estate, are now included in the calculation of expected relative volatility and measured against the fund’s benchmark index, which comprises global equity and bond indices. The
0
20
40
60
80
100
120
140
160
0
20
40
60
80
100
120
140
160
99 00 01 02 03 04 05 06 07 08 09 10 11 12 13 14 15 16 17
Chart 30 Expected relative volatility for the fixed-income andequity asset classes. Basis points
Source: Norges Bank Investment Management
0
20
40
60
80
100
120
140
160
180
200
220
0
20
40
60
80
100
120
140
160
180
200
220
99 00 01 02 03 04 05 06 07 08 09 10 11 12 13 14 15 16 17
Fixed income Equity
Chart 29 The fund’s expected relative volatility. Basis points
Source: Norges Bank Investment Management
0
20
40
60
80
100
120
140
160
0
20
40
60
80
100
120
140
160
99 00 01 02 03 04 05 06 07 08 09 10 11 12 13 14 15 16 17
Risk | Return and risk 2017 | Government Pension Fund Global
54

Table 39 Relative risk contribution to equity management as at 31 December 2017. Basis points
SectorRelative volatility
contribution
Financials 9
Industrials 5
Consumer goods 5
Oil and gas 4
Basic materials 3
Health care 3
Consumer services 2
Telecommunications 2
Technology 1
Utilities 1
Other 0
Total equity management 35
Table 40 Relative risk contribution to fixed-income management as at 31 December 2017.
Basis points
SectorRelative volatility
contribution
Government bonds 32
Government-related bonds -11
Inflation-linked bonds 4
Corporate bonds 9
Securitised bonds 0
Cash and derivatives 2
Total fixed-income management 38
Table 38 Expected relative volatility of investment strategies as at 31 December 2017. Each strategy measured stand-alone with the other strategies positioned in-line with the benchmarks. All numbers measured at fund level. Basis points
Equity management
Fixed-incomemanagement
Real estate management Allocation Total
Fund allocation 17 10 22 1 28
Internal reference portfolio 13 10 1 15
of which systematic factors1 8 8
of which universe expansion 12 9 14
Allocation decisions 6 2 6
Real estate 22 22
Unlisted real estate 16 16
Listed real estate 9 9
Security selection 13 1 13
Internal security selection 10 1 10
External security selection 6 6
Asset management 7 4 8
Asset positioning 7 4 8
Total 23 12 22 1 33
1 A considerable part of the exposure against systematic factors will in 2018 be managed and reported in a separate substrategy.
55
RISK 3.2

points. Within this ten-year period, the highest expected relative volatility of a consecutive three-year period was 67 basis points and the lowest 29 basis points. The actual average expected relative volatility of the fund over the last 15 years was 40 basis points.
Relative risk can be decomposed and calculated for the equity and fixed-income management of the fund. The expected relative volatility of portfolios under equity management was 35 basis points at the end of 2017, while that of portfolios under fixed-income management was 38 basis points.
Relative volatility can also be estimated for the fund’s established investment strategies. These calculations are performed for one strategy at a time, assuming that the rest of the fund is invested in line with the respective benchmarks. The fund’s expected relative volatility is lower than the sum of the relative volatilities of the investment strategies, reflecting diversification effects.
EXPECTED SHORTFALLExpected relative volatility is an estimate of what happens under normal market conditions, but provides no information about the distribution and magnitude of less probable outcomes (tail risk). Expected shortfall, also called conditional value at risk, is a widely used tail risk measure. It shows the average expected loss in the worst q percent of observations, where q is the tail probability and equivalent to one minus the specified confidence level. The expected shortfall for the fund’s portfolio at a 97.5 percent confidence level shows an expected annual negative deviation from the benchmark of 1.49 percentage points. The calculations are based on simulated relative returns in the currency basket over the last ten
years. The Executive Board has set a limit for expected shortfall between the return on the fund and the benchmark index. With effect from 1 January 2017, investments in unlisted real estate have also been included in the calculations. The fund is to be managed in such a way that the expected negative relative return in extreme situations does not exceed 3.75 percentage points.
FISCAL STRENGTH AND ENVIRONMENT-RELATED MANDATESThe mandate from the Ministry of Finance requires Norges Bank to take fiscal strength into account in its government bond investments. The expected relative volatility of this requirement, measured at fund level, was estimated to be 1 basis point at the end of 2017, and 5 basis points when measured at fixed-income management level. The expected shortfall was estimated at year-end to be 8 basis points at fund level, and 27 basis points at fixed-income management level.
The mandate also requires Norges Bank to establish environment-related mandates with a market value that is normally in the range of 30-60 billion kroner. The expected relative volatility of this requirement was estimated to be 3 basis points at the end of 2017, when measured at fund level, and 4 basis points, measured at equity management level. The expected shortfall was estimated to be 10 basis points at fund level, and 16 basis points at equity management level.
BENCHMARK OVERLAPBenchmark overlap is an alternative relative risk measure that shows how closely the portfolios match the benchmark index. In line with the management mandate from the Ministry of Finance, Norges Bank’s Executive Board has set
Risk | Return and risk 2017 | Government Pension Fund Global
56
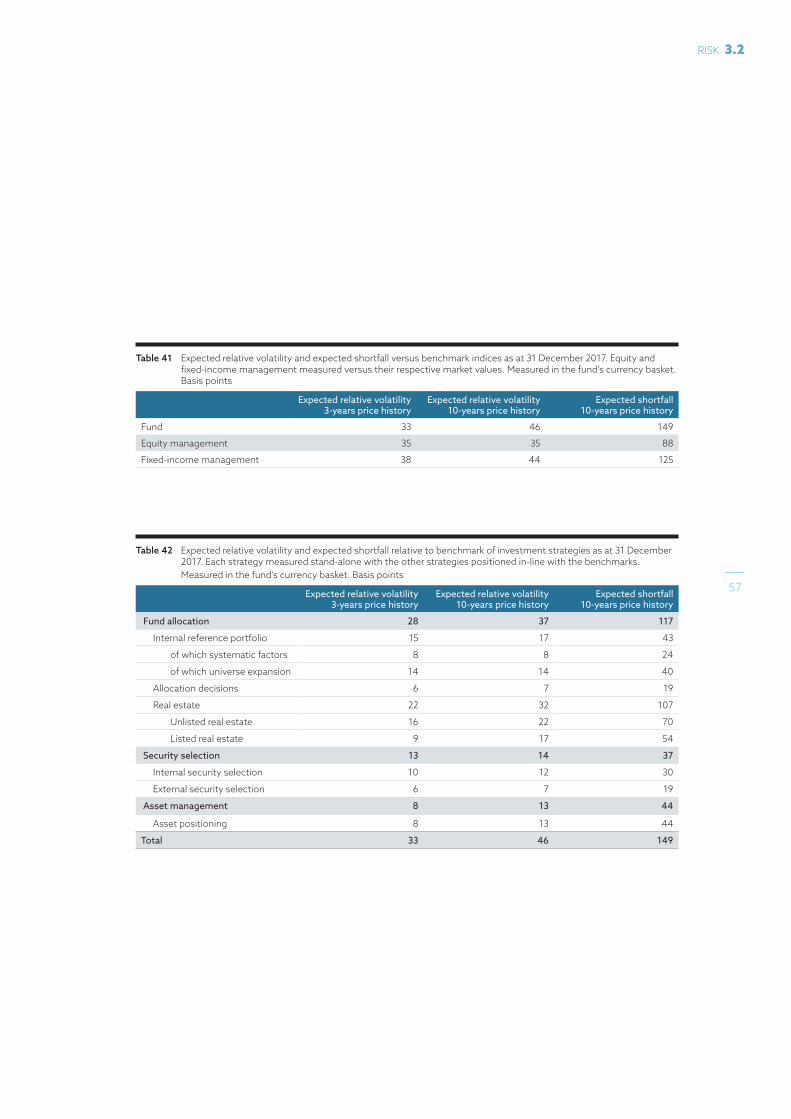
Table 41 Expected relative volatility and expected shortfall versus benchmark indices as at 31 December 2017. Equity and fixed-income management measured versus their respective market values. Measured in the fund’s currency basket. Basis points
Expected relative volatility 3-years price history
Expected relative volatility 10-years price history
Expected shortfall 10-years price history
Fund 33 46 149
Equity management 35 35 88
Fixed-income management 38 44 125
Table 42 Expected relative volatility and expected shortfall relative to benchmark of investment strategies as at 31 December 2017. Each strategy measured stand-alone with the other strategies positioned in-line with the benchmarks.
Measured in the fund’s currency basket. Basis points
Expected relative volatility 3-years price history
Expected relative volatility 10-years price history
Expected shortfall 10-years price history
Fund allocation 28 37 117
Internal reference portfolio 15 17 43
of which systematic factors 8 8 24
of which universe expansion 14 14 40
Allocation decisions 6 7 19
Real estate 22 32 107
Unlisted real estate 16 22 70
Listed real estate 9 17 54
Security selection 13 14 37
Internal security selection 10 12 30
External security selection 6 7 19
Asset management 8 13 44
Asset positioning 8 13 44
Total 33 46 149
57
RISK 3.2
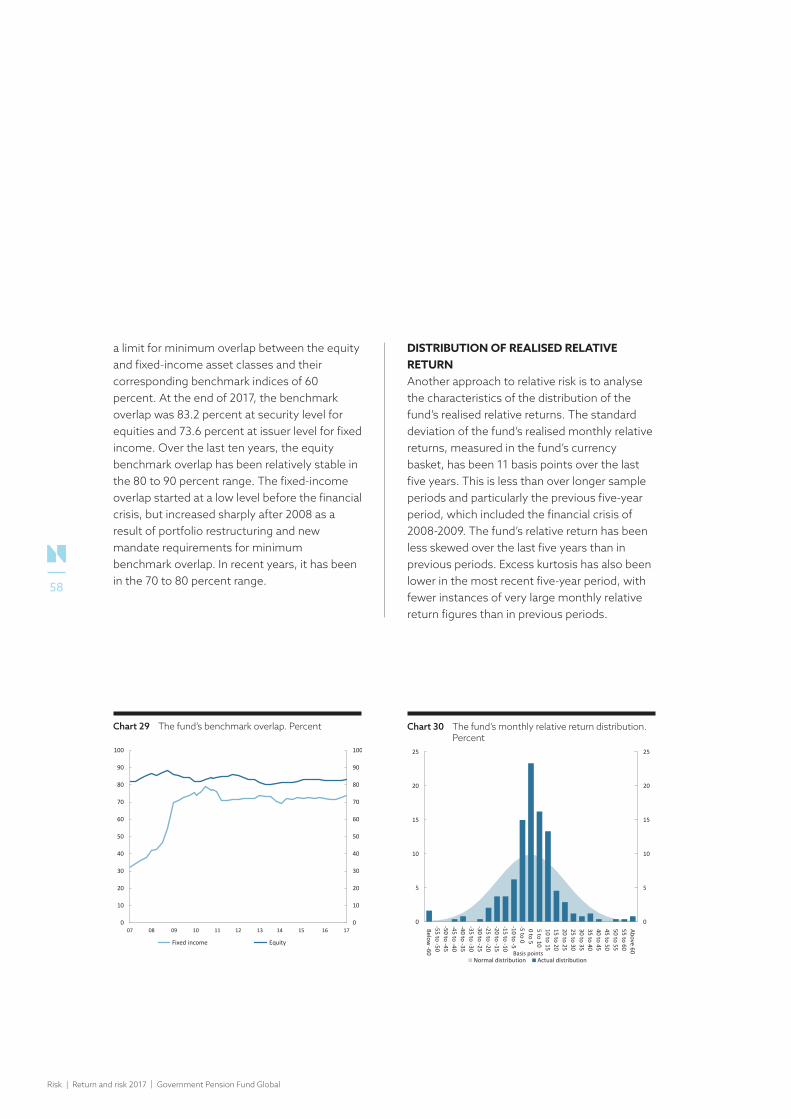
a limit for minimum overlap between the equity and fixed-income asset classes and their corresponding benchmark indices of 60 percent. At the end of 2017, the benchmark overlap was 83.2 percent at security level for equities and 73.6 percent at issuer level for fixed income. Over the last ten years, the equity benchmark overlap has been relatively stable in the 80 to 90 percent range. The fixed-income overlap started at a low level before the financial crisis, but increased sharply after 2008 as a result of portfolio restructuring and new mandate requirements for minimum benchmark overlap. In recent years, it has been in the 70 to 80 percent range.
DISTRIBUTION OF REALISED RELATIVE RETURNAnother approach to relative risk is to analyse the characteristics of the distribution of the fund’s realised relative returns. The standard deviation of the fund’s realised monthly relative returns, measured in the fund’s currency basket, has been 11 basis points over the last five years. This is less than over longer sample periods and particularly the previous five-year period, which included the financial crisis of 2008-2009. The fund’s relative return has been less skewed over the last five years than in previous periods. Excess kurtosis has also been lower in the most recent five-year period, with fewer instances of very large monthly relative return figures than in previous periods.
Chart 31 The fund's benchmark overlap. Percent
Source: Norges Bank Investment Management
0
10
20
30
40
50
60
70
80
90
100
0
10
20
30
40
50
60
70
80
90
100
07 08 12 13 16 1709 10 11
Fixed income
14 15
Equity
Chart 32 The fund's monthly relative return distribution. Percent
Source: Norges Bank Investment Management
0
5
10
15
20
25
0
5
10
15
20
25
Below -60
-55 to -50-50 to -45-45 to -40-40 to -35-35 to -30-30 to -25-25 to -20-20 to -15-15 to -10-10 to -5-5 to 00 to 55 to 1010 to 1515 to 2020 to 2525 to 3030 to 3535 to 4040 to 4545 to 5050 to 5555 to 60Above 60
Basis pointsNormal distribution Actual distribution
Chart 29 The fund’s benchmark overlap. Percent Chart 30 The fund’s monthly relative return distribution. Percent
Risk | Return and risk 2017 | Government Pension Fund Global
58

Table 43 Characteristics of the distribution for realised monthly relative return. Measured in the fund’s currency basket
Since 01.01.19981
Last 10 years
Last 5 years
Last 3 years
Fund2
Standard deviation relative return (percent) 0.20 0.26 0.11 0.10
Skewness relative return -2.30 -2.11 -0.23 -0.73
Excess kurtosis relative return 17.40 12.00 0.75 1.22
Equity management
Standard deviation relative return (percent) 0.22 0.19 0.13 0.12
Skewness relative return -0.77 -3.69 -0.99 -1.19
Excess kurtosis relative return 10.04 25.24 1.54 2.83
Fixed-income management
Standard deviation relative return (percent) 0.30 0.41 0.14 0.11
Skewness relative return -0.58 -0.45 -0.07 -0.22
Excess kurtosis relative return 16.93 8.30 -0.12 -0.02
1 Equity management start in 1999. 2 Based on aggregated equity and fixed-income management until end of 2016.
Table 44 Characteristics of the distribution for realised monthly relative return. 5-year buckets. Measured in the fund’s currency basket
1998 - 20021 2003 – 2007 2008 – 2012 2013 – 2017
Fund2
Standard deviation relative return (percent) 0.12 0.12 0.35 0.11
Skewness relative return 0.79 -1.44 -1.68 -0.23
Excess kurtosis relative return 2.44 4.47 6.18 0.75
Equity management
Standard deviation relative return (percent) 0.29 0.22 0.24 0.13
Skewness relative return 1.03 -0.23 -3.62 -0.99
Excess kurtosis relative return 3.10 0.54 20.37 1.54
Fixed-income management
Standard deviation relative return (percent) 0.09 0.11 0.57 0.14
Skewness relative return -0.55 -3.48 -0.45 -0.07
Excess kurtosis relative return 11.49 13.73 3.56 -0.12
1 Equity management start in 1999.2 Based on aggregated equity and fixed-income management until end of 2016.
59
RISK 3.2

Risk adjustmentsThere are various risk-adjusted performance measures including factor-adjusted returns.
information ratio for equity management and the overall fund in most periods. The mean relative returns show a similar pattern. The fixed-income information ratio was higher in the 2008-2012 period containing the financial crisis than the five-year periods before and after, as the large negative relative returns during 2008 were offset by strong performance in the time that followed. The opposite pattern holds for the equity investments with a lower information ratio in the period 2008-2012 than in 2003-2007 and 2013-2017. Further, the other risk-adjusted measures: Jensen’s alpha, appraisal ratio and the Sharpe ratio difference do not show the same pattern for fixed-income management, as they indicate improved performance in the most recent five years.
Jensen’s alphaUnder the assumptions of the Capital Asset Pricing Model (CAPM), all differences in expected return are explained by beta. Beta measures systematic risk and is estimated using a regression of the portfolio returns in excess of the risk-free rate on the benchmark’s excess returns. Jensen’s alpha is the residual average return after correcting for the portfolio’s beta. Again, the benchmark is used for risk adjustment. Jensen’s alpha assumes that the only relevant risk is the risk that cannot be diversified away, whereas the Sharpe ratio assumes that total risk is the relevant measure.
While the CAPM theoretically should be able to price all assets, it should be noted that it is most commonly applied to equities. Considering equity and fixed-income management separately, Jensen’s alpha is positive for all
It is important to recognise that there are a number of guidelines and restrictions in the fund’s investment mandate, which to a large extent govern the fund’s exposure to risk and consequently the potential for higher returns. Risk-adjusted performance measures aim to standardise performance results by accounting for the risks taken when obtaining these returns. Even when using risk-adjusted performance measures to compare asset managers, the differences in their investment mandates should be kept in mind. Results are reported for the following measures: Information ratio, Jensen’s alpha, appraisal ratio, and Sharpe ratio.
RELATIVE RISK ADJUSTMENTSWhen performing relative risk adjustments, the fund’s benchmark serves as a reference point. This is a natural approach given the central role of the benchmark in the investment mandate of the fund.
Information ratioThe information ratio divides the mean of the portfolio return relative to the benchmark by the standard deviation of the relative return (tracking error). The information ratio measures both return and risk in terms of deviations from the benchmark. Since inception, the fund has been constrained by an official tracking error limit versus its benchmark. By using tracking error as the risk measure, the information ratio therefore serves as a natural starting point for risk-adjusted return analysis.
The information ratio for fixed-income management has been lower than the
Risk | Return and risk 2017 | Government Pension Fund Global
60

Table 45 Relative risk-adjusted measures. Before management costs. Annualised
Since 01.01.19981 Last 10 years Last 5 years Last 3 years
Fund2
Information ratio 0.42 0.22 0.73 1.22
Jensen's alpha (percent) 0.08 -0.19 0.13 0.32
Appraisal ratio 0.14 -0.27 0.36 0.98
Sharpe ratio difference 0.01 -0.02 0.02 0.05
Equity management
Information ratio 0.68 0.37 0.88 1.36
Jensen's alpha (percent) 0.42 0.09 0.14 0.38
Appraisal ratio 0.59 0.15 0.35 1.02
Sharpe ratio difference 0.03 0.01 0.01 0.04
Fixed-income management
Information ratio 0.15 0.14 -0.06 0.24
Jensen's alpha (percent) 0.16 0.20 0.23 0.26
Appraisal ratio 0.15 0.14 0.59 0.79
Sharpe ratio difference 0.01 -0.03 0.08 0.09
1 Equity management since 01.01.1999.2 Based on aggregated equity and fixed-income management until end of 2016.
Table 46 Relative risk-adjusted measures. Before management costs. Annualised
1998 – 20021 2003 – 2007 2008 – 2012 2013 – 2017
Fund2
Information ratio 0.96 0.91 0.09 0.73
Jensen's alpha (percent) 0.43 0.16 -0.15 0.13
Appraisal ratio 1.03 0.41 -0.17 0.36
Sharpe ratio difference 0.07 0.03 -0.01 0.02
Equity management
Information ratio 0.87 1.07 0.13 0.88
Jensen's alpha (percent) 1.03 0.53 0.09 0.14
Appraisal ratio 1.06 0.72 0.13 0.35
Sharpe ratio difference 0.06 0.05 0.00 0.01
Fixed-income management
Information ratio 0.52 0.08 0.22 -0.06
Jensen's alpha (percent) 0.16 0.05 0.15 0.23
Appraisal ratio 0.52 0.13 0.08 0.59
Sharpe ratio difference 0.05 0.02 -0.11 0.08
1 Equity management since 01.01.1999. 2 Based on aggregated equity and fixed-income management until the end of 2016.
61
RISK 3.3

periods considered. For the fund, the sign of Jensen’s alpha depends more on the evaluation period. The periods containing the financial crisis in 2008-2009 stand out in particular. The differences between the fund and the equity and fixed-income management viewed alone suggest a change in the degree of co-movement between the two markets in these periods.
Appraisal ratioWhereas the Sharpe ratio measures the total risk/return trade-off, the appraisal ratio is computed after removing systematic risk. For the fund, this corresponds to adjusting risk and return for variability stemming from the benchmark. The appraisal ratio is estimated by dividing Jensen’s alpha by the standard deviation of the residuals from the CAPM regression.
The sign of the appraisal ratio is naturally the same as the sign of Jensen’s alpha. In the first periods, the appraisal ratio is higher for equity management than for fixed-income management, while the reverse is true for the most recent five-year period. However, as indicated above, care should be taken when evaluating risk using the CAPM for fixed-income investments.
Absolute risk adjustmentsWhen performing absolute risk adjustments, the fund’s benchmark and risk restrictions play no role. The performance measures are therefore reported separately for the portfolio and the benchmark, and the levels can then be compared.
Sharpe ratioThe Sharpe ratio is a widely used risk-adjusted performance measure. The Sharpe ratio is computed by dividing the average portfolio return in excess of the risk-free rate by the standard deviation of portfolio returns. A higher Sharpe ratio indicates a higher expected reward per unit of total risk. The Sharpe ratio measures
absolute risk-adjusted performance and ranks portfolios based on the estimated trade-off between total risk and return. The Sharpe ratio difference reflects this ranking and captures the change in performance relative to the benchmark.
Across all periods, the Sharpe ratio for the fund is similar to the benchmark’s Sharpe ratio. This is a consequence of the fund having limited scope to deviate from the benchmark. While the fund has had a higher volatility of returns than the benchmark, the average fund return has also tended to be higher, resulting in similar reward-to-variability ratios and consequently small differences in the Sharpe ratio.
Since periods that include the financial turmoil of 2008-2009 were characterised by both lower average returns and higher volatility of returns, the Sharpe ratios for both the fund and the benchmark in these periods were lower than for other periods. The negative Sharpe ratios in the period 1998-2002 reflect the relatively high risk-free rate compared to the average returns of the fund’s investments and the benchmark index.
The equity management’s Sharpe ratio is also close to the Sharpe ratio for the benchmark index for all periods, with both ratios displaying significant variation across time. For both equity management and the benchmark, the Sharpe ratios are lower than the ratios for the fund.
Although fixed-income management has often produced lower average returns than equity management, the returns are also less volatile resulting in higher Sharpe ratios in periods such as 2008-2012, which includes the financial crisis. Comparing fixed-income management with the benchmark, the relative performance depends on the evaluation period, although the Sharpe ratios tend to move closely together.
Risk | Return and risk 2017 | Government Pension Fund Global
62
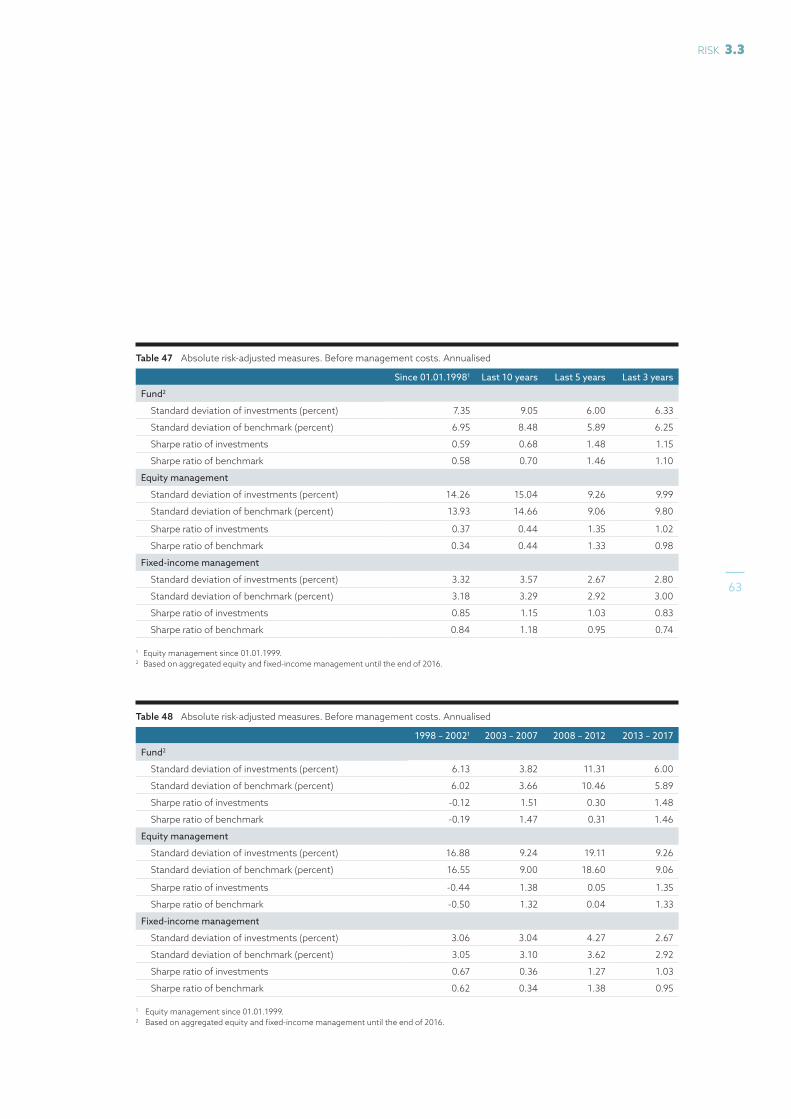
Table 47 Absolute risk-adjusted measures. Before management costs. Annualised
Since 01.01.19981 Last 10 years Last 5 years Last 3 years
Fund2
Standard deviation of investments (percent) 7.35 9.05 6.00 6.33
Standard deviation of benchmark (percent) 6.95 8.48 5.89 6.25
Sharpe ratio of investments 0.59 0.68 1.48 1.15
Sharpe ratio of benchmark 0.58 0.70 1.46 1.10
Equity management
Standard deviation of investments (percent) 14.26 15.04 9.26 9.99
Standard deviation of benchmark (percent) 13.93 14.66 9.06 9.80
Sharpe ratio of investments 0.37 0.44 1.35 1.02
Sharpe ratio of benchmark 0.34 0.44 1.33 0.98
Fixed-income management
Standard deviation of investments (percent) 3.32 3.57 2.67 2.80
Standard deviation of benchmark (percent) 3.18 3.29 2.92 3.00
Sharpe ratio of investments 0.85 1.15 1.03 0.83
Sharpe ratio of benchmark 0.84 1.18 0.95 0.74
1 Equity management since 01.01.1999. 2 Based on aggregated equity and fixed-income management until the end of 2016.
Table 48 Absolute risk-adjusted measures. Before management costs. Annualised
1998 – 20021 2003 – 2007 2008 – 2012 2013 – 2017
Fund2
Standard deviation of investments (percent) 6.13 3.82 11.31 6.00
Standard deviation of benchmark (percent) 6.02 3.66 10.46 5.89
Sharpe ratio of investments -0.12 1.51 0.30 1.48
Sharpe ratio of benchmark -0.19 1.47 0.31 1.46
Equity management
Standard deviation of investments (percent) 16.88 9.24 19.11 9.26
Standard deviation of benchmark (percent) 16.55 9.00 18.60 9.06
Sharpe ratio of investments -0.44 1.38 0.05 1.35
Sharpe ratio of benchmark -0.50 1.32 0.04 1.33
Fixed-income management
Standard deviation of investments (percent) 3.06 3.04 4.27 2.67
Standard deviation of benchmark (percent) 3.05 3.10 3.62 2.92
Sharpe ratio of investments 0.67 0.36 1.27 1.03
Sharpe ratio of benchmark 0.62 0.34 1.38 0.95
1 Equity management since 01.01.1999.2 Based on aggregated equity and fixed-income management until the end of 2016.
63
RISK 3.3

FACTOR-ADJUSTED RETURNThe analyses introduced here involve multivariate regressions of relative returns against sets of historical factor return series. Estimated regression coefficients can be interpreted as exposures to systematic factors over the historical period. Regression intercepts can be interpreted as performance attributable to manager value creation over and above the exposure to the set of factors considered in the regression. All regressions are conducted using relative returns before management costs and with returns measured in dollars. The regressions for the fund’s relative return are based on the aggregated equity and fixed-income management until the end of 2016. For 2017, real estate investments are also included. Additional information and regressions, including analyses based on relative return data after management costs, are available in the appendix published on our website www.nbim.no.
For equity management, the factor set used is the five-factor model of Fama and French (2017)1 and factor return data are global research factors downloaded from Kenneth French’s website. In these regressions, factors explain between 35 and 45 percent of the variability in the relative returns of equity management for the three periods: since inception, last ten years and last five years. The relative returns of equity management are estimated to have had positive active exposures to the market factor (MKT) and the small firm factor (SMB), and a negative active exposure to the investment factor (CMA) both for the full sample period and for the last ten-year period. In the last five-year period, only the market factor is significant at conventional statistical confidence levels.
For fixed-income management, the factor set is based on Fama and French (1993)2, who use a default factor and a term factor. The factor return data have been calculated by Norges Bank Investment Management, based on Bloomberg Barclays Indices data. Both have been constructed as global factors, and the default factor has been adjusted to take duration differences in the credit and government segments of the fixed-income benchmark into account. The construction of global factors introduces sovereign risk into the term factor due to differences in currency composition between global long-maturity and global short-maturity indices. This is discussed in more detail in the appendix. In the fixed-income regressions, factors explain between 28 and 41 percent of the variability in the relative returns. The relative returns of fixed-income management are estimated to have had exposure to the default premium factor over the full sample period and the last ten-year period. Over the last five-year period, only the regression coefficient for the negative term premium is significant at conventional statistical confidence levels.
For the fund, the factor set is the combination of the factors used for each asset class. In these regressions, factors explain 55 to 65 percent of the variability in relative returns and the signs of the estimated exposures are qualitatively in line with the results for the asset classes. However, the profitability (RMW) coefficient is positive for the last five and ten years, and the value (HML) coefficient is positive since inception.
1 Fama, E. and French, K. (2017): “International tests of a five-factor asset pricing model”, Journal of Financial Economics 123(3), 441-463.2 Fama, E. and French, K. (1993): “Common risk factors in the returns on stocks and bonds”, Journal of Financial Economics 33(1), 3-56.
Risk | Return and risk 2017 | Government Pension Fund Global
64

Table 49 Equity management. Regression analysis of relative return in dollars before management costs
Inte
rcep
t, b
ps
annu
alis
ed
Regression coefficients
Sample period Mar
ket
(MKT
)
Smal
l vs
larg
e(S
MB)
Che
ap v
s ex
pens
ive
(HM
L)
Profi
tabl
e vs
un
profi
tabl
e(R
MW
)
Con
serv
ativ
e vs
agg
ress
ive
inve
stm
ent
(CM
A)
Varia
nce
expl
aine
d in
pe
rcen
t (R
squ
ared
)
Since 01.01.1999 37 0.02 0.05 -0.01 0.01 -0.02 45
Last 10 years 24 0.02 0.03 0.00 -0.02 -0.04 45
Last 5 years 26 0.02 0.02 0.01 -0.02 -0.03 35
Source: Norges Bank Investment Management, Kenneth French. Bold indicates significant at 5 percent confidence level.Note: After management cost regressions are available in the appendix.
Table 51 The fund. Regression analysis of relative return in dollars before management costs
Inte
rcep
t, b
ps
annu
alis
ed
Regression coefficients
Sample period Mar
ket
(MKT
)
Smal
l vs
larg
e(S
MB)
Che
ap v
s ex
pens
ive
(HM
L)
Profi
tabl
e vs
un
profi
tabl
e(R
MW
)
Con
serv
ativ
e vs
agg
ress
ive
inve
stm
ent
(CM
A)
Def
ault
(d
urat
ion
ad
just
ed)
Term
Var
ianc
e ex
plai
ned
in
perc
ent
(R s
quar
ed)
Since 01.01.1998 7 0.02 0.03 0.01 0.02 -0.02 0.03 -0.01 55
Last 10 years -3 0.02 0.04 0.02 0.02 -0.04 0.03 -0.01 65
Last 5 years 18 0.02 0.02 0.00 0.01 0.02 0.01 -0.04 60
Source: Norges Bank Investment Management, Kenneth French, Bloomberg Barclays Indices. Bold indicates significant at 5 percent confidence level. Note: After management cost regressions are available in the appendix.
Table 50 Fixed-income management. Regression analysis of relative return in dollars before management costs
Inte
rcep
t, b
ps
annu
alis
ed
Regression coefficients
Sample period Def
ault
(dur
atio
n ad
just
ed)
Term
Varia
nce
expl
aine
d in
pe
rcen
t (R
squ
ared
)
Since 01.01.1998 11 0.07 -0.01 28
Last 10 years 3 0.09 -0.02 35
Last 5 years 17 0.00 -0.05 41
Source: Norges Bank Investment Management, Bloomberg Barclays Indices. Bold indicates significant at 5 percent confidence level. Note: After management cost regressions are available in the appendix.
65
RISK 3.3


ISSN 2535-3225 | Design: Scandinavian Design GroupPhotos: Norges Bank Investment Management,
Offset, Shutterstock Paper: Galerie Art Silk 300 g / Matt 150 g
Production: 07 Media AS | Print run: 400

NORGES BANK INVESTMENT MANAGEMENTBankplassen 2, P.O. Box 1179 Sentrum, NO-0107 Oslo, Norway
T: +47 24 07 30 00, www.nbim.no


![· Special light alloy scooter wheels ... Vespa [Piaggio] 2.10 x 10 Pinasco The loads applied are related to rear alloy wheels suitable for scooter listed before. ... 1,360 (3 50](https://img.pdfslide.us/doc/110x75/5c657ec809d3f2a36e8ce64b/-special-light-alloy-scooter-wheels-vespa-piaggio-210-x-10-pinasco-the.jpg)