Embed Size (px)
Citation preview
REAL ESTATEINVESTMENTSGOVERNMENT PENSION FUND GLOBAL
No. 03
/2017


Our missionis to safeguard
and build financial wealth for future
generations
8.6 billion kr
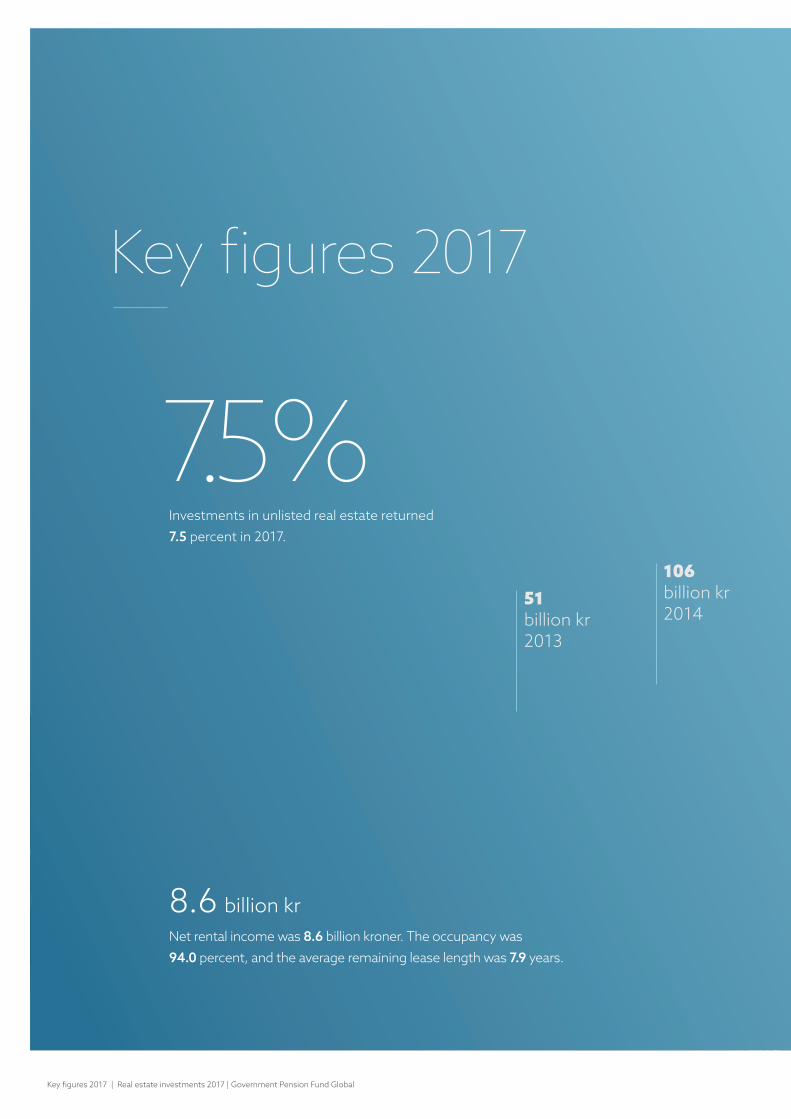
Investments in unlisted real estate returned 7.5 percent in 2017.
7.5%
Net rental income was 8.6 billion kroner. The occupancy was 94.0 percent, and the average remaining lease length was 7.9 years.
Key figures 2017
106 billion kr2014
51 billion kr2013
Key figures 2017 | Real estate investments 2017 | Government Pension Fund Global
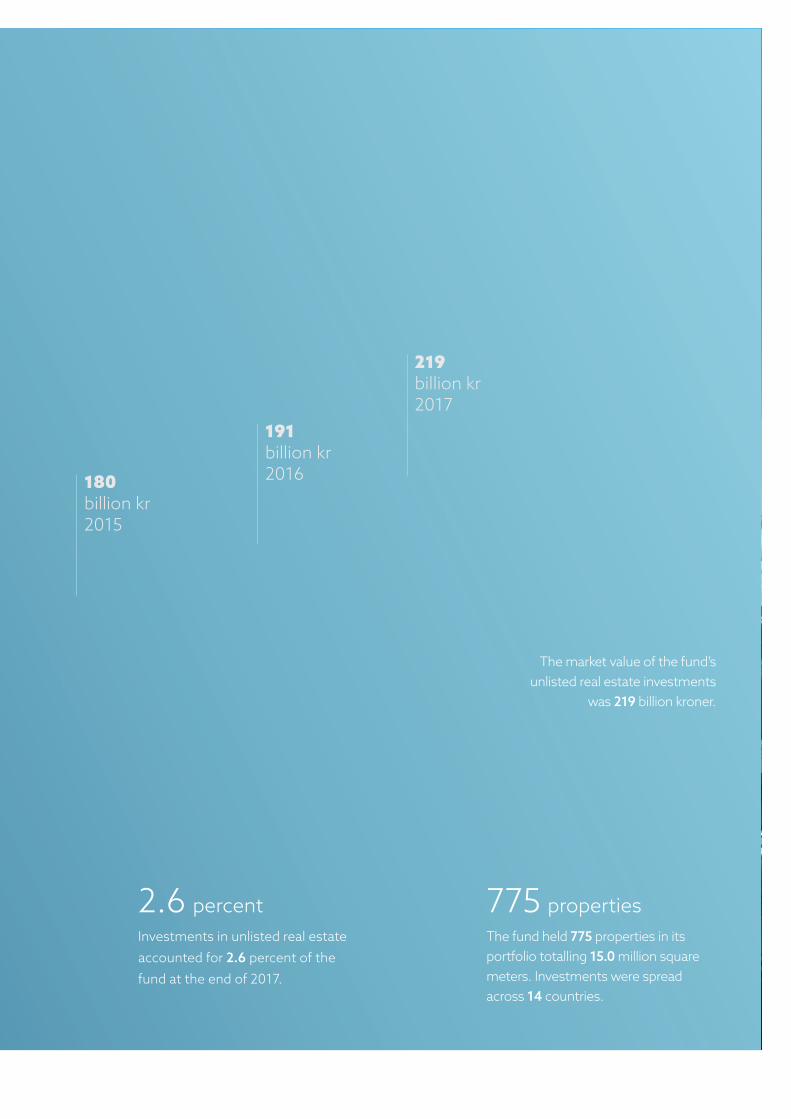
775 properties 2.6 percent Investments in unlisted real estate accounted for 2.6 percent of the fund at the end of 2017.
The fund held 775 properties in its portfolio totalling 15.0 million square meters. Investments were spread across 14 countries.
The market value of the fund’s unlisted real estate investments
was 219 billion kroner.
180 billion kr2015
191 billion kr2016
219 billion kr2017
Contents
2017
RESULTS
1.1 CEO letter _________________________6
1.2 Investing in real estate _____________8
1.3 Results ___________________________12
INVESTMENTS
2.1 Investments in Europe ____________ 20
2.2 Investments in the US ____________ 28
2.3 Investments in Asia ______________ 36
1 2
Real estate investments 2017 | Government Pension Fund Global

REAL ESTATE MANAGEMENT
3.1 Investment process ______________ 41
3.2 Risk management _______________ 44
3.3 Valuations ________________________ 50
INCOME AND COSTS
4.1 Income ___________________________ 52
4.2 Costs ___________________________ 54
4.3 Cash flow ________________________60
43

66 Chief Executive Officerof Norges Bank Real Estate Management
Karsten Kallevig
Results | Real estate investments 2017 | Government Pension Fund Global
6
The fund’s unlisted real estate investments returned 7.5 percent in 2017. Although we cannot expect positive returns every year going forward, our real estate investments will continue to generate stable rental income to the fund.
2017 was characterised by continued market uncertainty, and global investment activity was similar to that of 2016, albeit with local variations. Capital value growth continued, but investors are finding it difficult to assess what direction markets will take. Property yields are still record-low, yet the gap to the risk-free rate is wide in many markets, making real estate a relatively attractive asset class.
As usual, our approach in 2017 was to make acquisitions in line with our strategy, rather than taking a deliberate view on market timing. While we did not complete any particularly large transactions in 2017, the year ended with our first transaction in Asia when we acquired five assets in Tokyo.
At the beginning of 2017, the fund adopted a new financing model. Until then, the Ministry of Finance had required real estate acquisitions to be financed by a decrease in the fund’s fixed-income holdings. Under the new model, Norges Bank decides what combination of equities and fixed income to sell in order to acquire real estate assets. Our strategy is not affected by this change in any significant way. We will continue to acquire good assets in good locations, which we believe will produce satisfactory income for the foreseeable future. Unlisted real estate continues to diversify the fund.
We are a well-established organisation. Our experienced global team in six offices and five time zones ensures that we understand local markets and tenant dynamics, review investment opportunities as they arise, and are close to the assets we are already invested in. This local presence allows us to operate efficiently, professionally and commercially, for the benefit of the fund and its stakeholders.
Oslo, 13 March 2018
Karsten KallevigChief Executive Officer of Norges Bank Real Estate Management
Gradually expanding the portfolio
7
RESULTS 1.1
construction costs, and may mitigate inflation. Real estate has historically preserved its real value over time, in addition to providing income through rents.
The income return is typically not sensitive to short-term market changes, as it is usually based on stable long-term leases that expire at different times. This protection is particularly evident in our high-quality buildings with low vacancy.
Our strategy is based on the fund’s overall objective and aims to take advantage of our long-term investment horizon, limited liquidity requirement, and significant available capital. We invest in high-quality properties that can deliver good returns over time.
STRATEGIC CITIES We target a limited number of global cities in Europe, the US and Asia, with common characteristics. These cities have transparent real estate markets with sufficient scale,
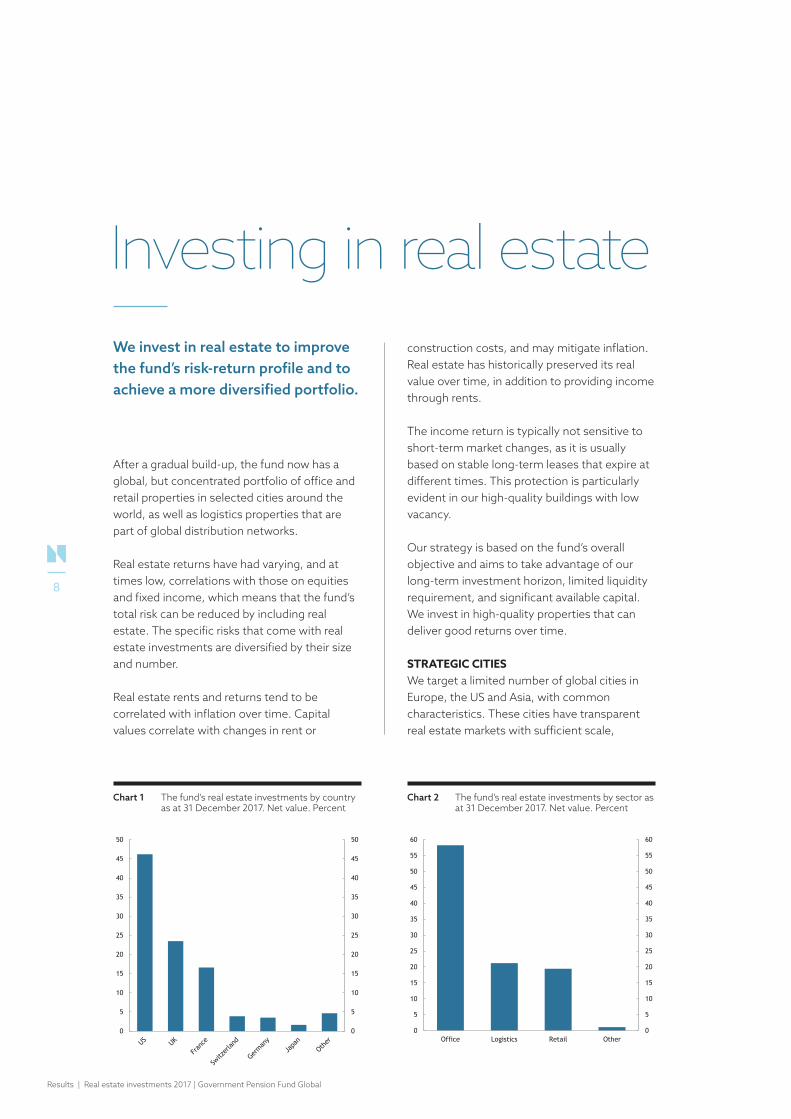
Investing in real estateWe invest in real estate to improve the fund’s risk-return profile and to achieve a more diversified portfolio.
Chart 1 The fund’s real estate investments by country as at 31 December 2017. Net value. Percent
Chart 2 The fund’s real estate investments by sector as at 31 December 2017. Net value. Percent
Figur 1 The fund’s real estate investments by country as at 31 December 2017. Net value. Percent
Oppdatert: AMF 14012018
0
5
10
15
20
25
30
35
40
45
50
0
5
10
15
20
25
30
35
40
45
50
Figur 4 The fund’s real estate investments by sector as at 31 December 2017. Net value. Percent
Oppdatert: AMF 14012018
0
5
10
15
20
25
30
35
40
45
50
55
60
0
5
10
15
20
25
30
35
40
45
50
55
60
Office Logistics Retail Other
After a gradual build-up, the fund now has a global, but concentrated portfolio of office and retail properties in selected cities around the world, as well as logistics properties that are part of global distribution networks.
Real estate returns have had varying, and at times low, correlations with those on equities and fixed income, which means that the fund’s total risk can be reduced by including real estate. The specific risks that come with real estate investments are diversified by their size and number.
Real estate rents and returns tend to be correlated with inflation over time. Capital values correlate with changes in rent or
Results | Real estate investments 2017 | Government Pension Fund Global
8
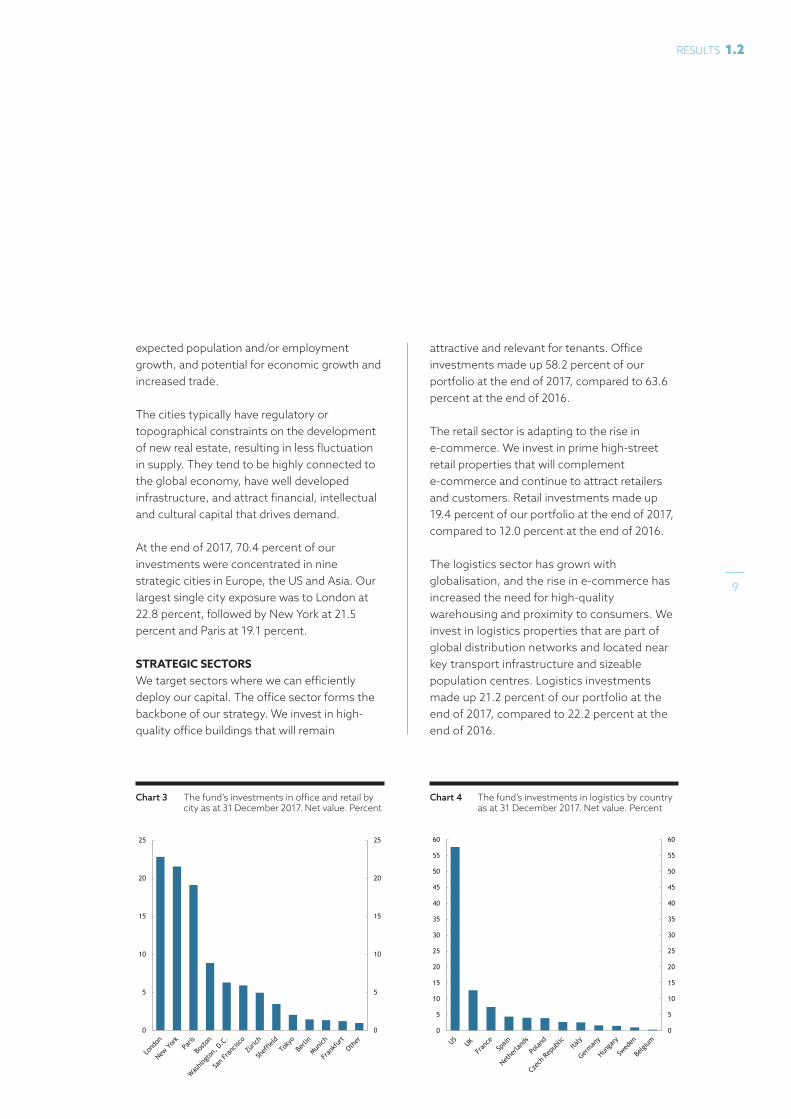
Chart 3 The fund’s investments in office and retail by city as at 31 December 2017. Net value. Percent
expected population and/or employment growth, and potential for economic growth and increased trade.
The cities typically have regulatory or topographical constraints on the development of new real estate, resulting in less fluctuation in supply. They tend to be highly connected to the global economy, have well developed infrastructure, and attract financial, intellectual and cultural capital that drives demand.
At the end of 2017, 70.4 percent of our investments were concentrated in nine strategic cities in Europe, the US and Asia. Our largest single city exposure was to London at 22.8 percent, followed by New York at 21.5 percent and Paris at 19.1 percent.
STRATEGIC SECTORS We target sectors where we can efficiently deploy our capital. The office sector forms the backbone of our strategy. We invest in high-quality office buildings that will remain
attractive and relevant for tenants. Office investments made up 58.2 percent of our portfolio at the end of 2017, compared to 63.6 percent at the end of 2016.
The retail sector is adapting to the rise in e-commerce. We invest in prime high-street retail properties that will complement e-commerce and continue to attract retailers and customers. Retail investments made up 19.4 percent of our portfolio at the end of 2017, compared to 12.0 percent at the end of 2016.
The logistics sector has grown with globalisation, and the rise in e-commerce has increased the need for high-quality warehousing and proximity to consumers. We invest in logistics properties that are part of global distribution networks and located near key transport infrastructure and sizeable population centres. Logistics investments made up 21.2 percent of our portfolio at the end of 2017, compared to 22.2 percent at the end of 2016.
Chart 4 The fund’s investments in logistics by country as at 31 December 2017. Net value. PercentFigur 3 The fund's logistics investments by country as at 31 December 2017. Net value. Percent
Oppdatert: AMF 14012018
0
5
10
15
20
25
30
35
40
45
50
55
60
0
5
10
15
20
25
30
35
40
45
50
55
60
Figur 2 The fund’s retail and office real estate investments by city as at 31 December 2017. Net value. Percent
Oppdatert: AMF 14012018
0
5
10
15
20
25
0
5
10
15
20
25
9
RESULTS 1.2
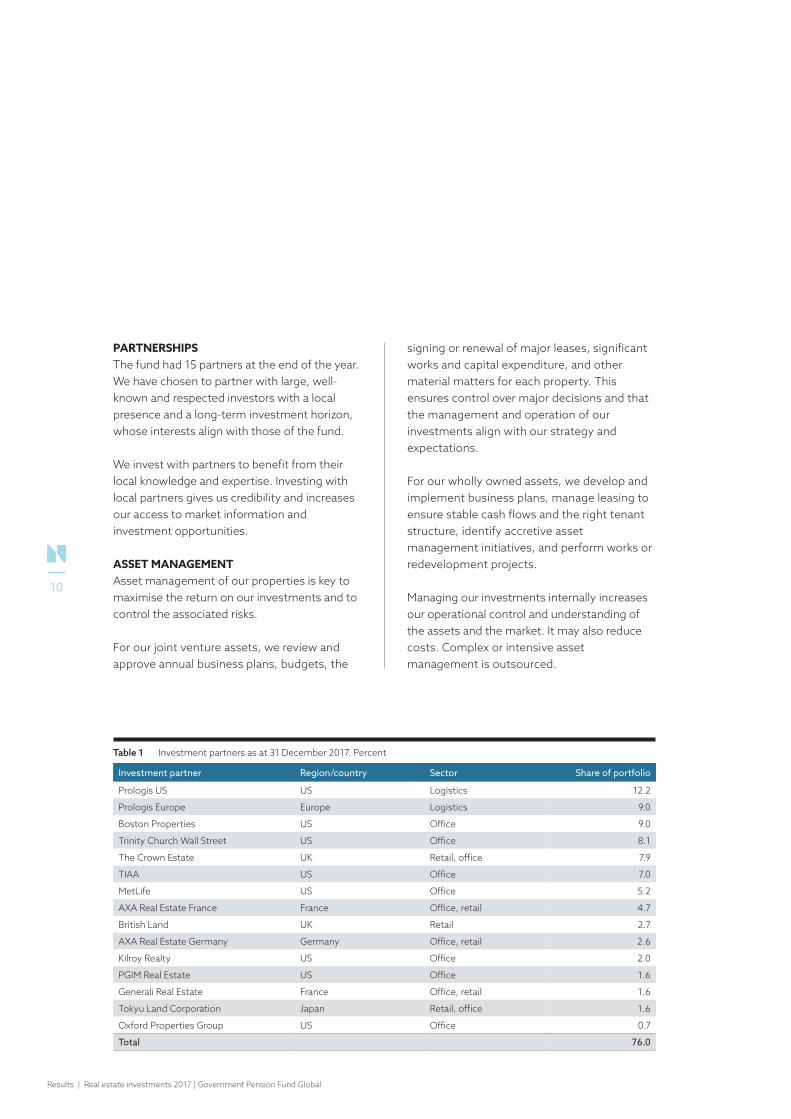
Table 1 Investment partners as at 31 December 2017. Percent
Investment partner Region/country Sector Share of portfolio
Prologis US US Logistics 12.2
Prologis Europe Europe Logistics 9.0
Boston Properties US Office 9.0
Trinity Church Wall Street US Office 8.1
The Crown Estate UK Retail, office 7.9
TIAA US Office 7.0
MetLife US Office 5.2
AXA Real Estate France France Office, retail 4.7
British Land UK Retail 2.7
AXA Real Estate Germany Germany Office, retail 2.6
Kilroy Realty US Office 2.0
PGIM Real Estate US Office 1.6
Generali Real Estate France Office, retail 1.6
Tokyu Land Corporation Japan Retail, office 1.6
Oxford Properties Group US Office 0.7
Total 76.0
PARTNERSHIPS The fund had 15 partners at the end of the year. We have chosen to partner with large, well-known and respected investors with a local presence and a long-term investment horizon, whose interests align with those of the fund.
We invest with partners to benefit from their local knowledge and expertise. Investing with local partners gives us credibility and increases our access to market information and investment opportunities.
ASSET MANAGEMENT Asset management of our properties is key to maximise the return on our investments and to control the associated risks.
For our joint venture assets, we review and approve annual business plans, budgets, the
signing or renewal of major leases, significant works and capital expenditure, and other material matters for each property. This ensures control over major decisions and that the management and operation of our investments align with our strategy and expectations.
For our wholly owned assets, we develop and implement business plans, manage leasing to ensure stable cash flows and the right tenant structure, identify accretive asset management initiatives, and perform works or redevelopment projects.
Managing our investments internally increases our operational control and understanding of the assets and the market. It may also reduce costs. Complex or intensive asset management is outsourced.
Results | Real estate investments 2017 | Government Pension Fund Global
10
ENVIRONMENTALLY SUSTAINABLE MANAGEMENT We invest and manage our portfolio in a focused, responsible and environmentally sustainable manner.
Environmentally sustainable management of our properties supports our objective of a high long-term return.
Our goal over time is to obtain a green building certification for all our office and retail properties. We believe that green building certifications will be increasingly important for a building’s competitiveness.
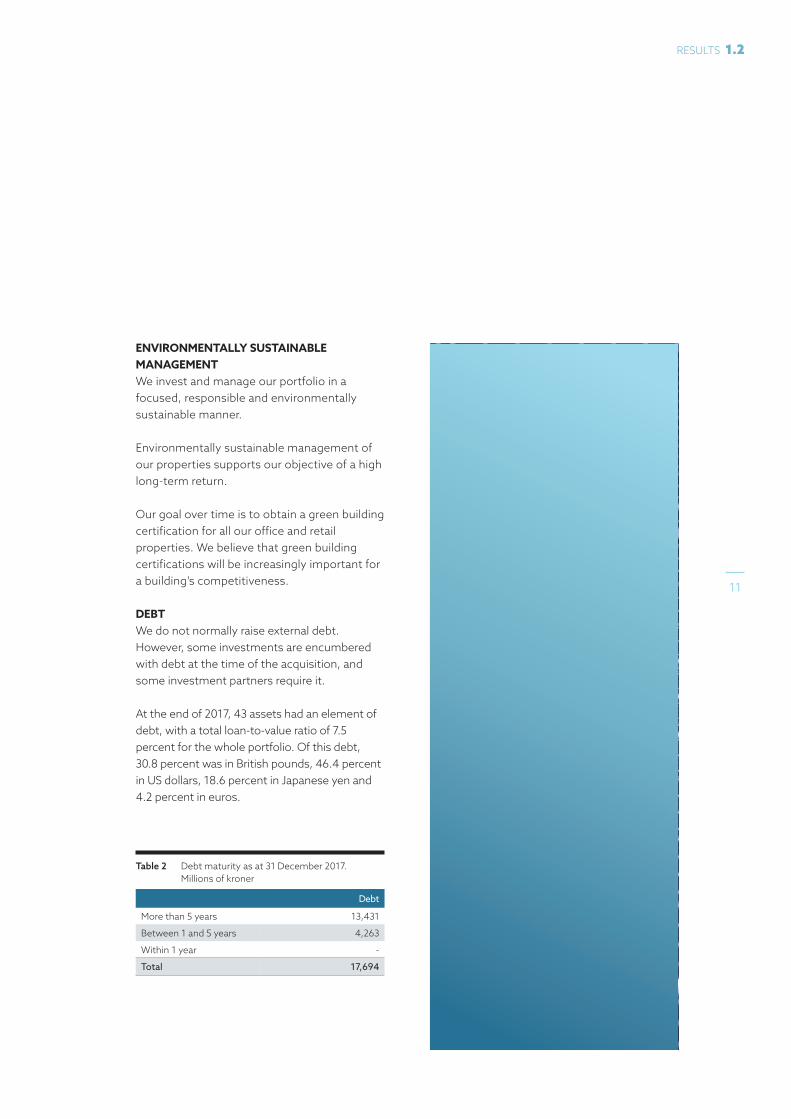
DEBT We do not normally raise external debt. However, some investments are encumbered with debt at the time of the acquisition, and some investment partners require it.
At the end of 2017, 43 assets had an element of debt, with a total loan-to-value ratio of 7.5 percent for the whole portfolio. Of this debt, 30.8 percent was in British pounds, 46.4 percent in US dollars, 18.6 percent in Japanese yen and 4.2 percent in euros.
Table 2 Debt maturity as at 31 December 2017. Millions of kroner
Debt
More than 5 years 13,431
Between 1 and 5 years 4,263
Within 1 year -
Total 17,694
11
RESULTS 1.2
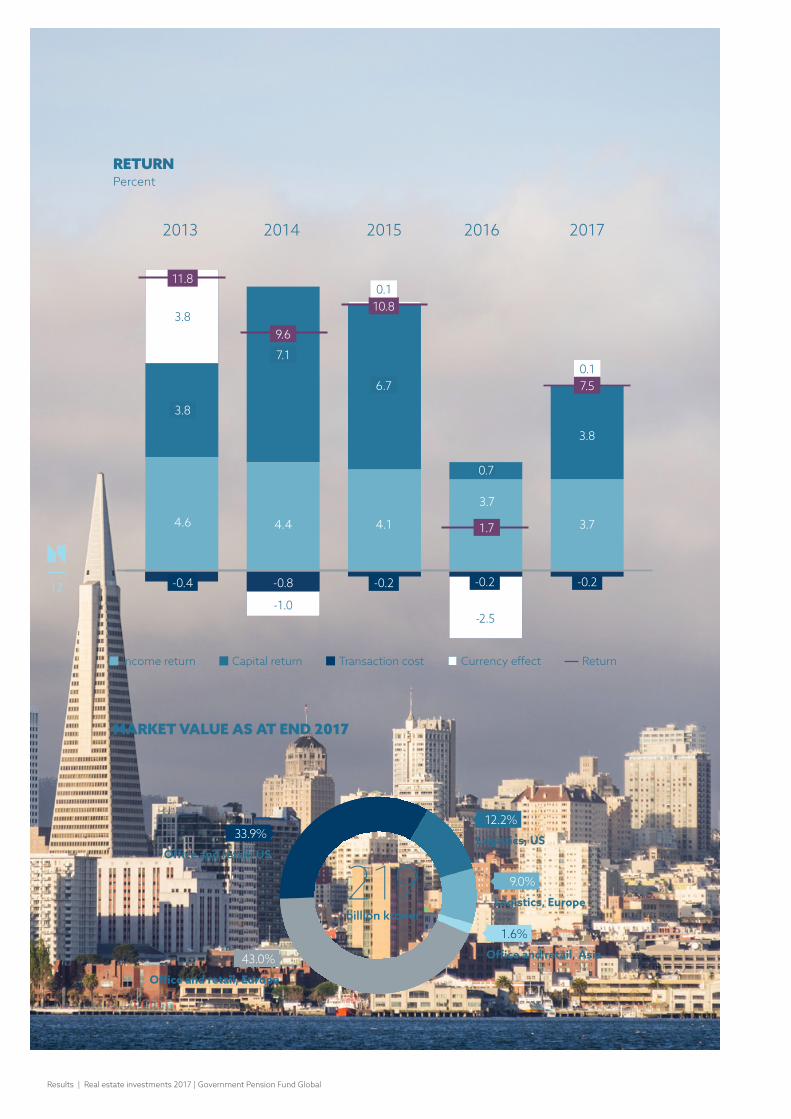
MARKET VALUE AS AT END 2017
RETURNPercent
12.2%
1.6%
43.0%
33.9% Logistics, US
Office and retail, Asia
Office and retail, Europe
Office and retail, US
-0.4
-1.0
-0.2
0.7
3.8
7.1
6.7
3.7
4.6 4.4 4.1 1.7
11.8
9.6
10.8
-2.5
3.8
-0.8
0.1
-0.2
Income return Capital return Currency effectTransaction cost Return
2013 2014 2015 2016 2017
-0.2
9.0%
Logistics, Europe
3.8
0.1
3.7
7.5
billion kroner
219
Results | Real estate investments 2017 | Government Pension Fund Global
12
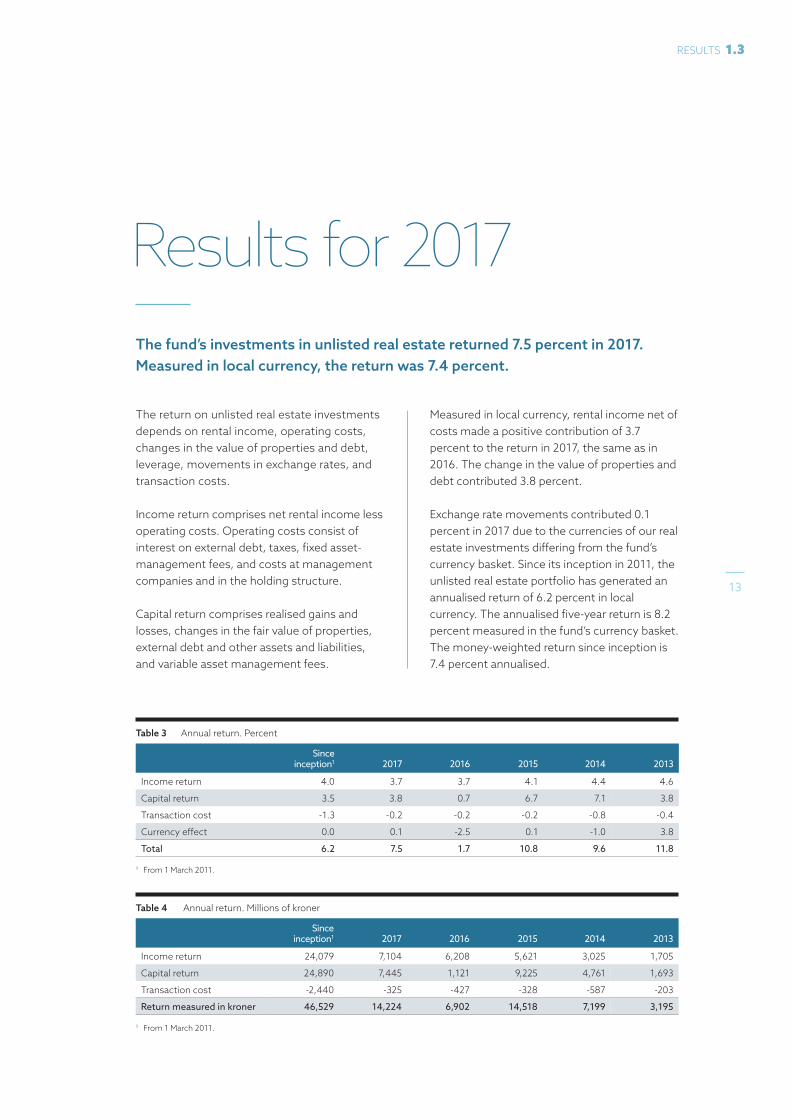
The return on unlisted real estate investments depends on rental income, operating costs, changes in the value of properties and debt, leverage, movements in exchange rates, and transaction costs.
Income return comprises net rental income less operating costs. Operating costs consist of interest on external debt, taxes, fixed asset-management fees, and costs at management companies and in the holding structure.
Capital return comprises realised gains and losses, changes in the fair value of properties, external debt and other assets and liabilities, and variable asset management fees.
Measured in local currency, rental income net of costs made a positive contribution of 3.7 percent to the return in 2017, the same as in 2016. The change in the value of properties and debt contributed 3.8 percent.
Exchange rate movements contributed 0.1 percent in 2017 due to the currencies of our real estate investments differing from the fund’s currency basket. Since its inception in 2011, the unlisted real estate portfolio has generated an annualised return of 6.2 percent in local currency. The annualised five-year return is 8.2 percent measured in the fund’s currency basket. The money-weighted return since inception is 7.4 percent annualised.
Results for 2017The fund’s investments in unlisted real estate returned 7.5 percent in 2017. Measured in local currency, the return was 7.4 percent.
Table 3 Annual return. Percent
Since inception1 2017 2016 2015 2014 2013
Income return 4.0 3.7 3.7 4.1 4.4 4.6
Capital return 3.5 3.8 0.7 6.7 7.1 3.8
Transaction cost -1.3 -0.2 -0.2 -0.2 -0.8 -0.4
Currency effect 0.0 0.1 -2.5 0.1 -1.0 3.8
Total 6.2 7.5 1.7 10.8 9.6 11.8
1 From 1 March 2011.
Table 4 Annual return. Millions of kroner
Since inception1 2017 2016 2015 2014 2013
Income return 24,079 7,104 6,208 5,621 3,025 1,705
Capital return 24,890 7,445 1,121 9,225 4,761 1,693
Transaction cost -2,440 -325 -427 -328 -587 -203
Return measured in kroner 46,529 14,224 6,902 14,518 7,199 3,195
1 From 1 March 2011.
13
RESULTS 1.3
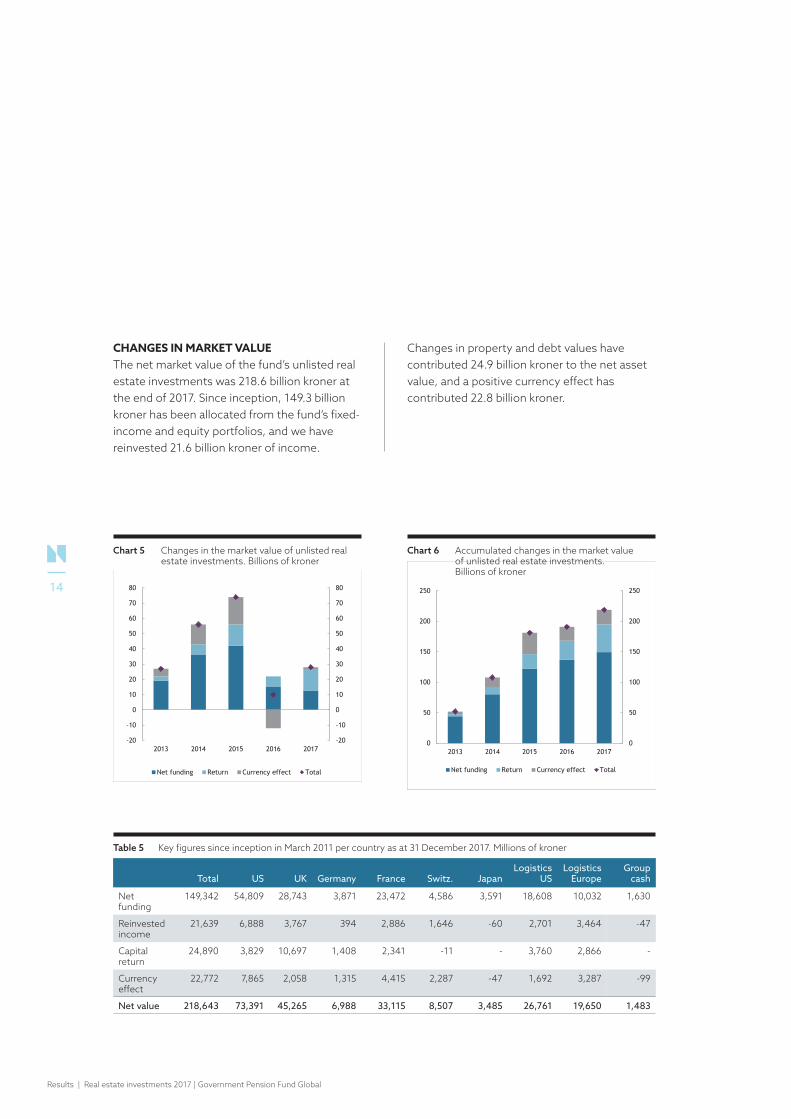
Table 5 Key figures since inception in March 2011 per country as at 31 December 2017. Millions of kroner
Total US UK Germany France Switz. JapanLogistics
USLogistics
EuropeGroup
cash
Net funding
149,342 54,809 28,743 3,871 23,472 4,586 3,591 18,608 10,032 1,630
Re invested income
21,639 6,888 3,767 394 2,886 1,646 -60 2,701 3,464 -47
Capital return
24,890 3,829 10,697 1,408 2,341 -11 - 3,760 2,866 -
Currency effect
22,772 7,865 2,058 1,315 4,415 2,287 -47 1,692 3,287 -99
Net value 218,643 73,391 45,265 6,988 33,115 8,507 3,485 26,761 19,650 1,483
CHANGES IN MARKET VALUE The net market value of the fund’s unlisted real estate investments was 218.6 billion kroner at the end of 2017. Since inception, 149.3 billion kroner has been allocated from the fund’s fixed-income and equity portfolios, and we have reinvested 21.6 billion kroner of income.
Changes in property and debt values have contributed 24.9 billion kroner to the net asset value, and a positive currency effect has contributed 22.8 billion kroner.
Responsible area
Chart name:
Chart (update by right click on chart edit data edit data:
Updated by (initials):
Comments:
Source:
Updated date:
Chart 5 Changes in the market value of unlisted real estate investments. Billions of kroner
CRO (VPM)
CSU 18/1
01.02.2017
28 total12,7 net funding14,1 net income1,2 NOK in fx
-20
-10
0
10
20
30
40
50
60
70
80
-20
-10
0
10
20
30
40
50
60
70
80
2013 2014 2015 2016 2017
Net funding Return Currency effect Total
1
Responsible area
Chart name:
Chart (update by right click on chart edit data edit data:
Updated by (initials):
Comments:
Source:
Updated date:
Chart 6 Accumulated changes in the market value for unlisted real estate investments. Billions of kroner
CRO (VPM)
cs
18/1
0
50
100
150
200
250
0
50
100
150
200
250
2013 2014 2015 2016 2017
Net funding Return Currency effect Total
9
Chart 5 Changes in the market value of unlisted real estate investments. Billions of kroner
Chart 6 Accumulated changes in the market value of unlisted real estate investments. Billions of kroner
Results | Real estate investments 2017 | Government Pension Fund Global
14
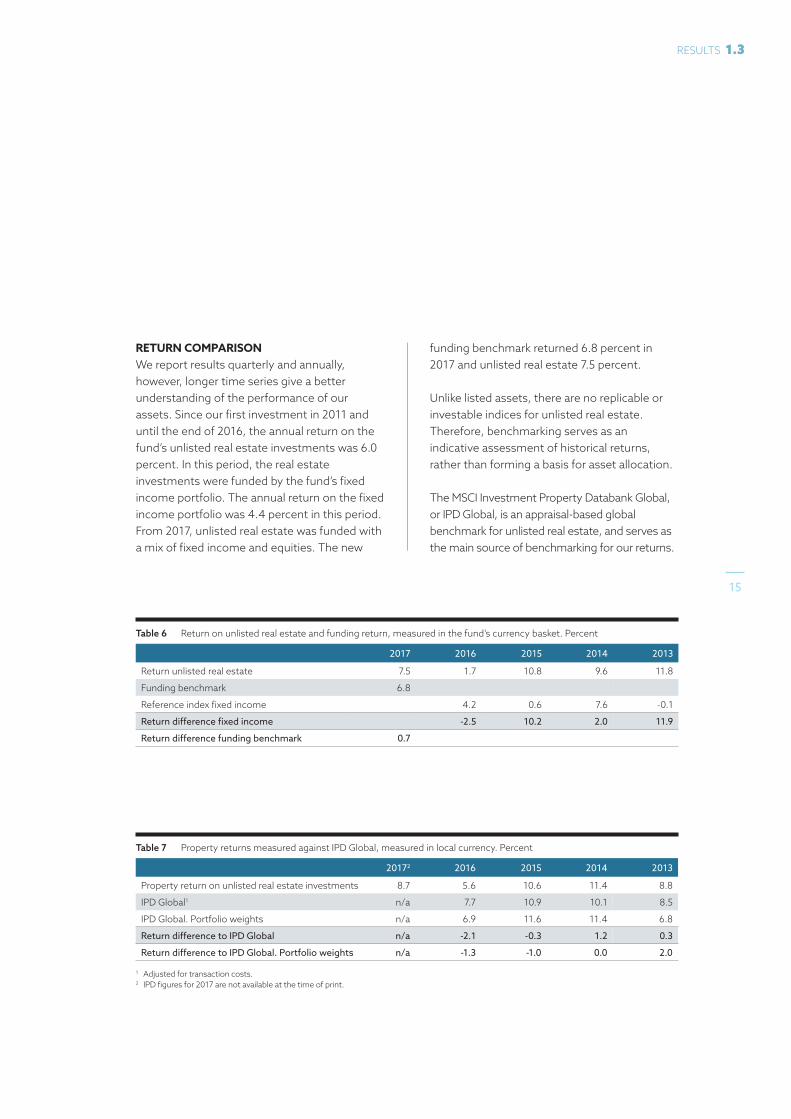
RETURN COMPARISON We report results quarterly and annually, however, longer time series give a better understanding of the performance of our assets. Since our first investment in 2011 and until the end of 2016, the annual return on the fund’s unlisted real estate investments was 6.0 percent. In this period, the real estate investments were funded by the fund’s fixed income portfolio. The annual return on the fixed income portfolio was 4.4 percent in this period. From 2017, unlisted real estate was funded with a mix of fixed income and equities. The new
funding benchmark returned 6.8 percent in 2017 and unlisted real estate 7.5 percent.
Unlike listed assets, there are no replicable or investable indices for unlisted real estate. Therefore, benchmarking serves as an indicative assessment of historical returns, rather than forming a basis for asset allocation.
The MSCI Investment Property Databank Global, or IPD Global, is an appraisal-based global benchmark for unlisted real estate, and serves as the main source of benchmarking for our returns.
Table 7 Property returns measured against IPD Global, measured in local currency. Percent
20172 2016 2015 2014 2013
Property return on unlisted real estate investments 8.7 5.6 10.6 11.4 8.8
IPD Global1 n/a 7.7 10.9 10.1 8.5
IPD Global. Portfolio weights n/a 6.9 11.6 11.4 6.8
Return difference to IPD Global n/a -2.1 -0.3 1.2 0.3
Return difference to IPD Global. Portfolio weights n/a -1.3 -1.0 0.0 2.0
1 Adjusted for transaction costs. 2 IPD figures for 2017 are not available at the time of print.
Table 6 Return on unlisted real estate and funding return, measured in the fund’s currency basket. Percent
2017 2016 2015 2014 2013
Return unlisted real estate 7.5 1.7 10.8 9.6 11.8
Funding benchmark 6.8
Reference index fixed income 4.2 0.6 7.6 -0.1
Return difference fixed income -2.5 10.2 2.0 11.9
Return difference funding benchmark 0.7
15
RESULTS 1.3
The benchmark covers 25 countries, including all markets and sectors we are invested in.
The office and retail sectors are the main sectors in the index, similar to the fund’s portfolio. IPD Global measures property-level performance, excluding elements related to corporate structures such as impacts of leverage, cash, tax and management fees.
It is important to note that the portfolio’s focused investment strategy leads to differences between portfolio and benchmark performance. The IPD Global data are not published until the second quarter, and 2017 figures were not available at the time of finalising this report. In the following, we evaluate the fund’s historical property-level returns from 2011 to 2016 against the IPD Global and the constituent country indices.
ResultsIn the period 2011-2016, the fund’s property-level annualised return was 8.2 percent, compared to an IPD Global return of 8.1 percent. Although the return is in line with the index, there are regional and sectoral differences between the two. The fund had a more concentrated portfolio than the IPD Global, and was present in countries that outperformed the benchmark. The overweight in outperforming countries had a 1.2 percentage point impact on the fund’s return difference. The fund was not present in the logistics sector in the period 2011-2013 and is not invested in the residential or hotel sectors, which are included in the IPD Global. These sectors had strong returns in the period, resulting in negative impact on the portfolio’s relative return.
Compared to the respective IPD country benchmarks, the UK and the US had a relative return of 2.0 and -2.6 percentage points respectively. France and Germany were in line with the country indices, with a relative return of 0.0 and -0.1 percentage point respectively.
The positive relative return in the UK was driven by office and retail investments and an overweight in UK logistics investments. The US relative return was driven primarily by office and retail investments underperforming the benchmark.
Results | Real estate investments 2017 | Government Pension Fund Global
16
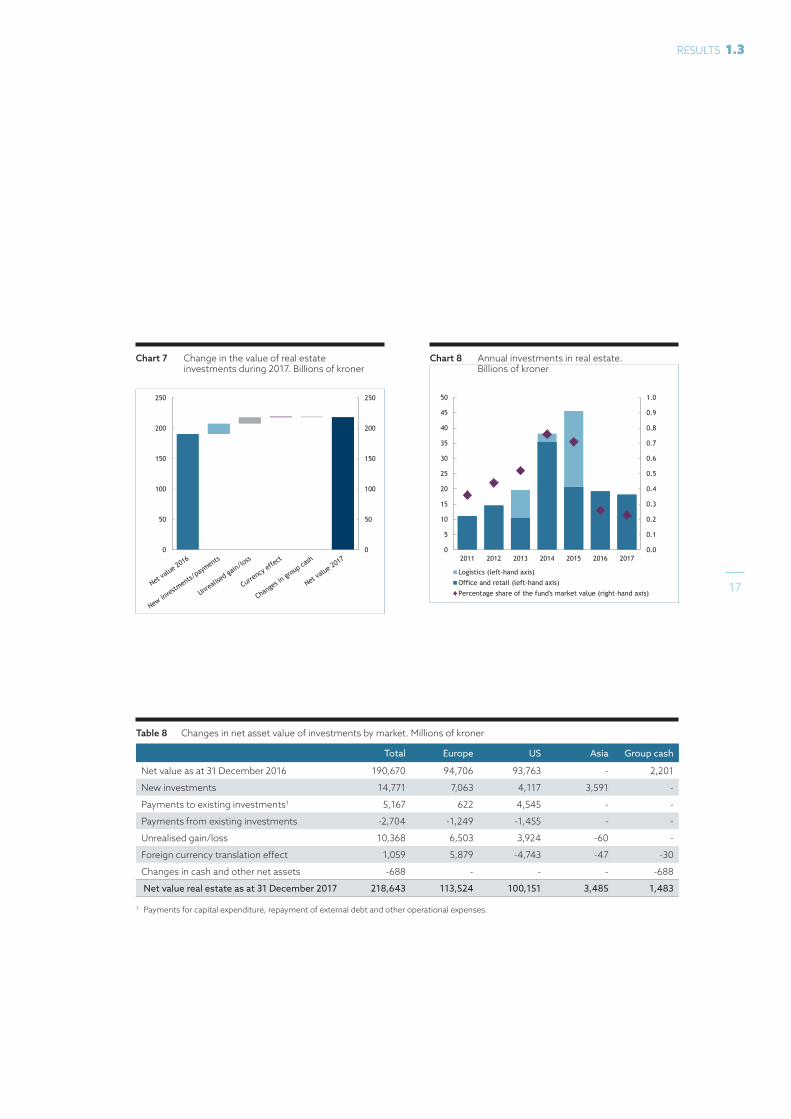
Table 8 Changes in net asset value of investments by market. Millions of kroner
Total Europe US Asia Group cash
Net value as at 31 December 2016 190,670 94,706 93,763 - 2,201
New investments 14,771 7,063 4,117 3,591 -
Payments to existing investments1 5,167 622 4,545 - -
Payments from existing investments -2,704 -1,249 -1,455 - -
Unrealised gain/loss 10,368 6,503 3,924 -60 -
Foreign currency translation effect 1,059 5,879 -4,743 -47 -30
Changes in cash and other net assets -688 - - - -688
Net value real estate as at 31 December 2017 218,643 113,524 100,151 3,485 1,483
1 Payments for capital expenditure, repayment of external debt and other operational expenses.
Responsible area
Chart name:
Chart (update by right click on chart edit data edit data:
Updated by (initials):
Comments:
Source:
Updated date:
Chart 7 Change in the value of real estate investments during 2017. Billions of kroner
COO
TEN
1/2/18
As of Q4 17
Alternative including cash + net consolidated assets 0
50
100
150
200
250
0
50
100
150
200
250
Responsible area
Chart name:
Chart (update by right click on chart edit data edit data:
Updated by (initials):
Comments:
Source:
Updated date:
Chart 8 Annual investments in real estate. Billions of kroner
COO
FEI
13/02/2018
ALTERNATIVE with logistics
0.0
0.1
0.2
0.3
0.4
0.5
0.6
0.7
0.8
0.9
1.0
0
5
10
15
20
25
30
35
40
45
50
2011 2012 2013 2014 2015 2016 2017
Logistics (left-hand axis)
Office and retail (left-hand axis)
Percentage share of the fund's market value (right-hand axis)
Chart 7 Change in the value of real estate investments during 2017. Billions of kroner
Chart 8 Annual investments in real estate. Billions of kroner
17
RESULTS 1.3
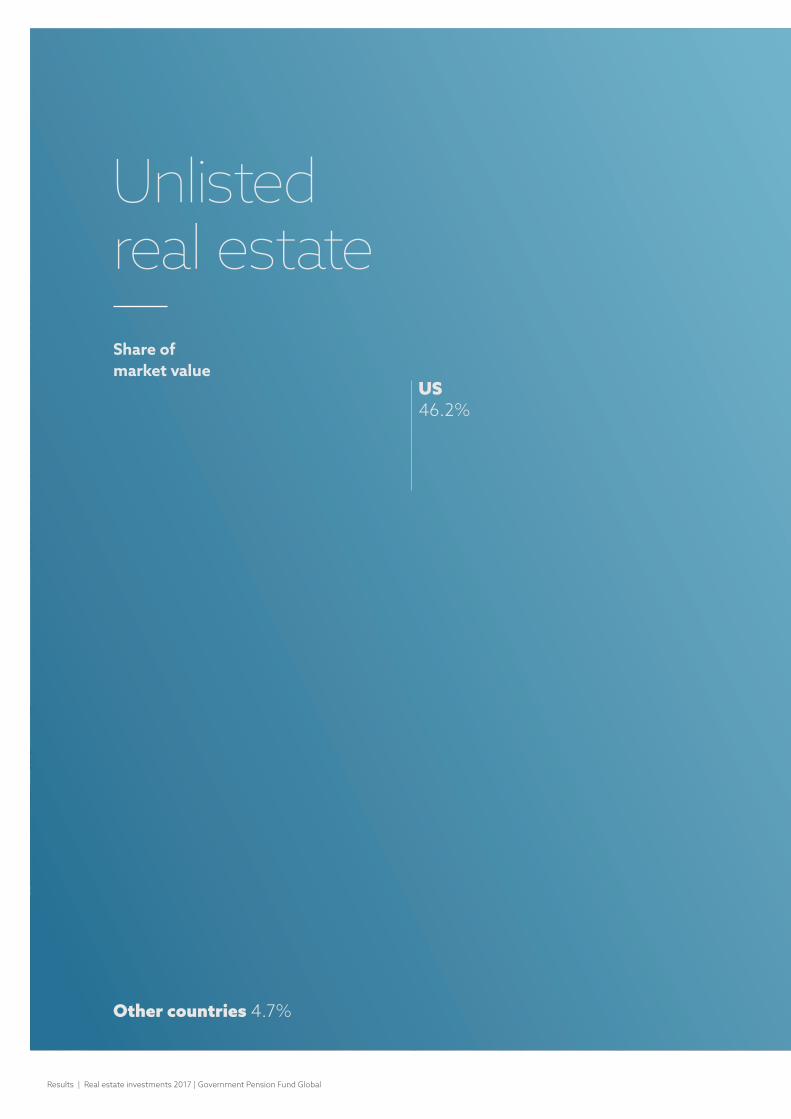
Share of market value
Unlisted real estate
US46.2%
Other countries 4.7%
Results | Real estate investments 2017 | Government Pension Fund Global

UK23.5%
FRANCE16.6%
SWITZERLAND3.9%
JAPAN1.6%
GERMANY3.5%
RESULTS 1.3

PARIS, FRANCEIn July, the fund acquired the full 100 percent interest in 6-8 boulevard Haussmann in central Paris.
6-8 boulevard Haussmann
Investments | Real estate investments 2017 | Government Pension Fund Global
20
Investments in EuropeRental growth in the European office and retail markets varied. Regent Street was one of the best performing districts within the UK high-street retail market, and both Paris and Berlin saw higher rents.
MARKET TRENDS European markets varied in 2017. Offices in Germany and France had stronger occupier activity, while some weakness was witnessed in the UK. In prime retail, vacancy rates remained low, and retailers maintained their presence in the streets most visited by tourists. In logistics, vacancy rates decreased across many countries, as tenant demand for logistics space continued to be strong in most major markets.
The UK marketOffice occupancy levels in London remained relatively stable with the exception of a few submarkets. City and Docklands saw vacancy rates rise to 6 and 8 percent respectively. Vacancy rates in the West End, Southbank and Midtown were between 3 and 4 percent and saw declines between 0.2 and 1 percentage points. Having adjusted in the six to nine months following the Brexit vote, office rents remained stable or improved in most London submarkets.
Prime West End office rents ended at 105 pounds per square foot per year. In the City, rents decreased to 69 pounds, down from 70 pounds at the end of 2016. Midtown office rents ended at 80 pounds, up from 78 pounds at the end of 2016.
Central London office investment transactions rose 30 percent in 2017 despite economic uncertainty. Transaction volumes ended at around 15 billion pounds, which was a return to the average level seen in the five years prior to the Brexit vote.
The London high-street retail market was resilient despite some difficulties during the year. In most prime locations in Central London, rents either remained the same or increased. Regent Street was one of the best performing districts, where rents increased around 6 percent. In neighbouring New Bond Street, which generally has the highest retail rents in London, rents were stable.
In the UK logistics market, vacancy rates decreased, despite an increase in the stock of new logistics properties being developed, but supported by continued growth in e-commerce. Transaction volumes were the highest ever recorded at 12 billion pounds, after having slowed down 10 percent in 2016.
The French market In France, the office market saw stronger occupier activity, and Paris showed further signs of improvement. Rising tenant demand reduced vacancy rates, which fell sharply in the Central Business District. Office vacancy was around 3 percent in Paris Centre West, a decline of around 0.8 percentage points since the end of the previous year.
Office rents in Paris’ Central Business District had the biggest increase in seven years at 3 percent, providing some evidence that the value of incentive packages to secure tenants is starting to ease. Prime office rents were higher in Paris Centre West and the Western Crescent, where rents rose 6 and 11 percent respectively compared to the previous year. The La Défense submarket has yet to see rental increases since
21
INVESTMENTS 2.1
economic conditions have strengthened, although vacancy rates fell 1 percentage point to 8 percent, the lowest level since 2013.
Central Paris office transaction volumes fell around 35 percent despite improved occupier dynamics to 4 billion euros.
Retail rents for prime and luxury property in Paris remained high. Prime retail rents in Place Vendôme and Place de la Madeleine were up around 10 percent with the biggest increases occurring in rue St Honoré and boulevard Haussmann at around 20 percent growth.
In the French logistics market, vacancy rates have fallen to the lowest level in over 10 years.
The German marketIn Germany, Berlin recorded 9 percent annual rental growth, the highest among the large office markets in Germany for the second consecutive year. Rental growth in Berlin has been strong in the last two years, but rents remain 18 percent below that of Munich and 25 percent below that of Frankfurt. Munich was the second best performing metropolitan area of the larger German cities, with a 4 percent rise in rents. In the high-street retail market, rents declined 4-5 percent across most major German metros during the third quarter, but stabilised in the fourth quarter after strong growth in 2016.
Central Berlin office transaction volumes rose 28 percent to the highest level of deal activity in recent history at 4 billion euros.
In the German logistics market, transaction volumes almost doubled on 2016 volumes.
Both take up and vacancy trends supported favourable rental dynamics.
OUR INVESTMENTS IN EUROPEInvestments in Europe made up 52.0 percent of our real estate investments at the end of the year and returned 8.6 percent.
Our office and retail investments We had investments in 179 office and retail properties in Europe at the end of 2017. 148 of these properties were part of our Regent Street and Pollen Estate portfolios in London, in Paris we had 19 assets, and in Munich, Berlin and Frankfurt we had 6 assets. Investments in office and retail made up 82.7 percent of the total European portfolio and returned 8.4 percent in local currency.
The investments consisted of 56.3 percent offices, 42.5 percent retail and 1.2 percent other. The three largest tenants were Credit Suisse with 11.6 percent, Bank of America Merrill Lynch with 10.5 percent and Chanel with 2.9 percent. The ten largest tenants generated 35.8 percent of rental income, and the average remaining lease term was 11.3 years.
Investments | Real estate investments 2017 | Government Pension Fund Global
22
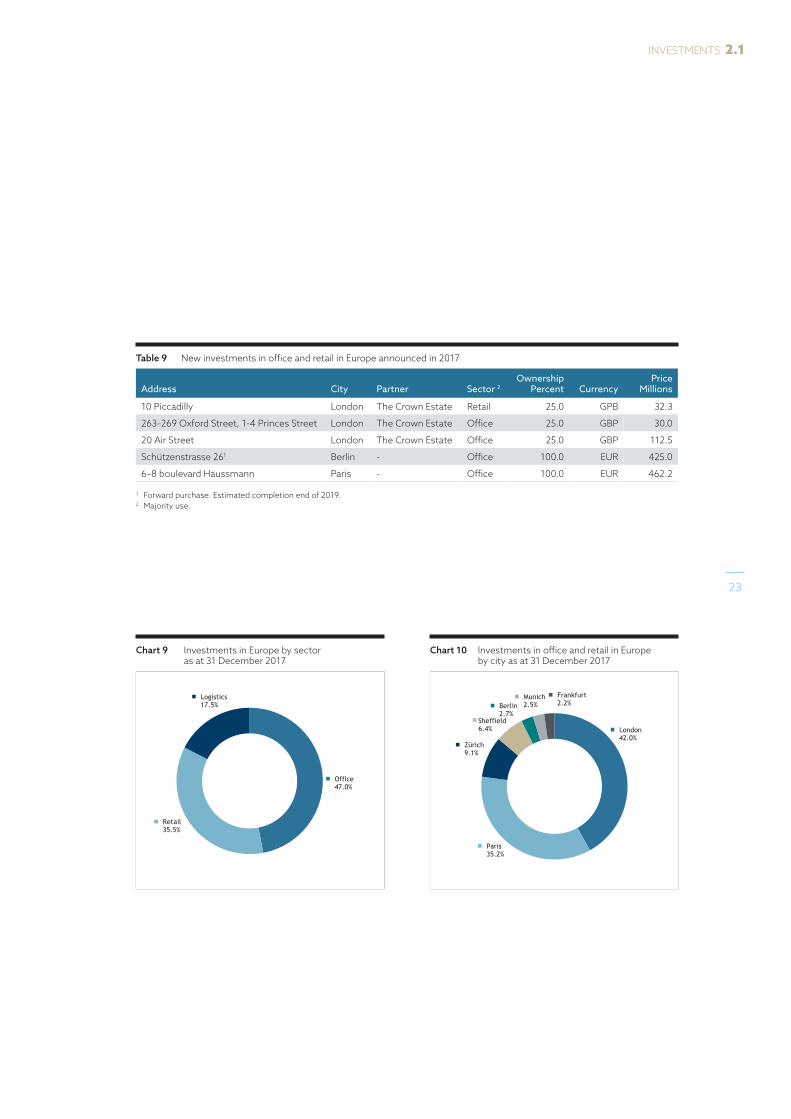
Table 9 New investments in office and retail in Europe announced in 2017
Address City Partner Sector 2Ownership
Percent CurrencyPrice
Millions
10 Piccadilly London The Crown Estate Retail 25.0 GPB 32.3
263–269 Oxford Street, 1-4 Princes Street London The Crown Estate Office 25.0 GBP 30.0
20 Air Street London The Crown Estate Office 25.0 GBP 112.5
Schützenstrasse 261 Berlin - Office 100.0 EUR 425.0
6–8 boulevard Haussmann Paris - Office 100.0 EUR 462.2
1 Forward purchase. Estimated completion end of 2019.2 Majority use.
Responsible area
Chart name:
Chart (update by right click on chart edit data edit data:
Updated by (initials):
Comments:
Source:
Updated date:
Chart 9 Investments in Europe by sector as at 31 December 2017
CRO
CCA
16.01.18
FILTERS: NorgesBank cash excluded
Country filter applied to exclude Japan, Lux, Norway, Singapore, USA
Industrial excluded
CSU – OK
CHANGED 12/2 ON REQUES OF YS
Office47.0%
Retail35.5%
Logistics17.5%
Responsible area
Chart name:
Chart (update by right click on chart edit data edit data:
Updated by (initials):
Comments:
Source:
Updated date:
Chart 10 Investments in office and retail in Europe by city as at 31 December 2017
CRO
FEI
03/02/18
FILTERS: NorgesBank cash excluded
Nerva and Reagan removed using family filter and US investments using Country filter.
Japan, Lux, Singapore and Norway also removed.
CSU - OK
London42.0%
Paris35.2%
Zürich9.1%
Sheffield6.4%
Berlin2.7%
Munich2.5%
Frankfurt2.2%
Chart 9 Investments in Europe by sector as at 31 December 2017
Chart 10 Investments in office and retail in Europe by city as at 31 December 2017
23
INVESTMENTS 2.1

20 Air Street, London In September 2017, the fund expanded its partnership with The Crown Estate, acquiring an additional 25 percent interest in 20 Air Street in central London. The property comprises 270,000 square feet of office and retail space, and nine residential units.
Investments | Real estate investments 2017 | Government Pension Fund Global
24

10 Piccadilly, London In January 2017, the Regent Street partnership acquired a long leasehold interest in 10 Piccadilly. The property comprises 99,000 square feet of office and retail space.
263-269 Oxford Street, 1 to 4 Princes Street, London In May 2017, the Regent Street partnership made an add-on investments in three properties in central London totalling 54,000 square feet of office and retail space.
Schützenstrasse 26, Berlin In July 2017, the fund acquired a 100 percent interest in the Axel Springer Neubau office building, located at the corner of Axel-Springer-Strasse and Zimmerstrasse in Berlin Mitte. The property is under development and will comprise 52,200 square meters of office space when it is completed at the end of 2019.
6-8 boulevard Haussmann, Paris In October 2017, the fund acquired a 100 percent interest in 6-8 boulevard Haussmann. The property comprises 24,500 square metres of office space.
25
INVESTMENTS 2.1
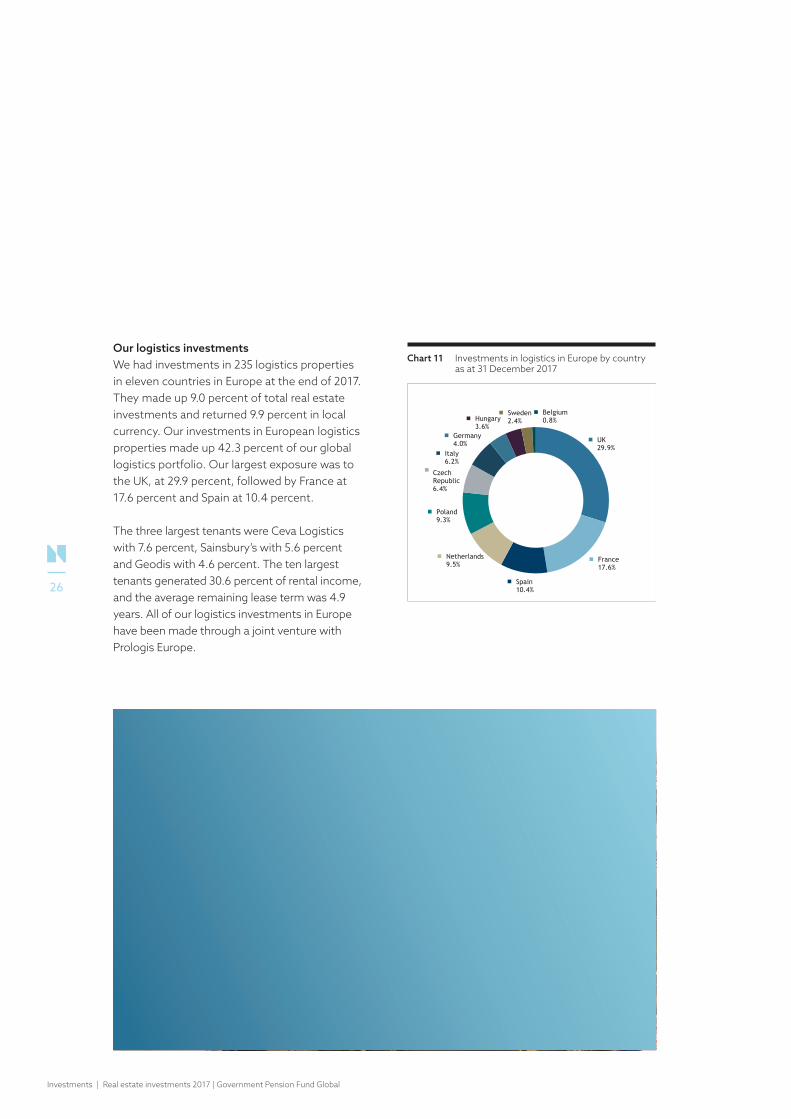
Our logistics investments We had investments in 235 logistics properties in eleven countries in Europe at the end of 2017. They made up 9.0 percent of total real estate investments and returned 9.9 percent in local currency. Our investments in European logistics properties made up 42.3 percent of our global logistics portfolio. Our largest exposure was to the UK, at 29.9 percent, followed by France at 17.6 percent and Spain at 10.4 percent.
The three largest tenants were Ceva Logistics with 7.6 percent, Sainsbury’s with 5.6 percent and Geodis with 4.6 percent. The ten largest tenants generated 30.6 percent of rental income, and the average remaining lease term was 4.9 years. All of our logistics investments in Europe have been made through a joint venture with Prologis Europe.
Responsible area
Chart name:
Chart (update by right click on chart edit data edit data:
Updated by (initials):
Comments:
Source:
Updated date:
Chart 11 Investments in logistics in Europe by country as at 31 December 2017
CRO
FEI
03/02/18
Family filter applied –Nerva only.
No other filters
UK29.9%
France17.6%
Spain10.4%
Netherlands9.5%
Poland9.3%
Czech Republic6.4%
Italy6.2%
Germany4.0%
Hungary3.6%
Sweden2.4%
Belgium0.8%
Chart 11 Investments in logistics in Europe by country as at 31 December 2017
Investments | Real estate investments 2017 | Government Pension Fund Global
26
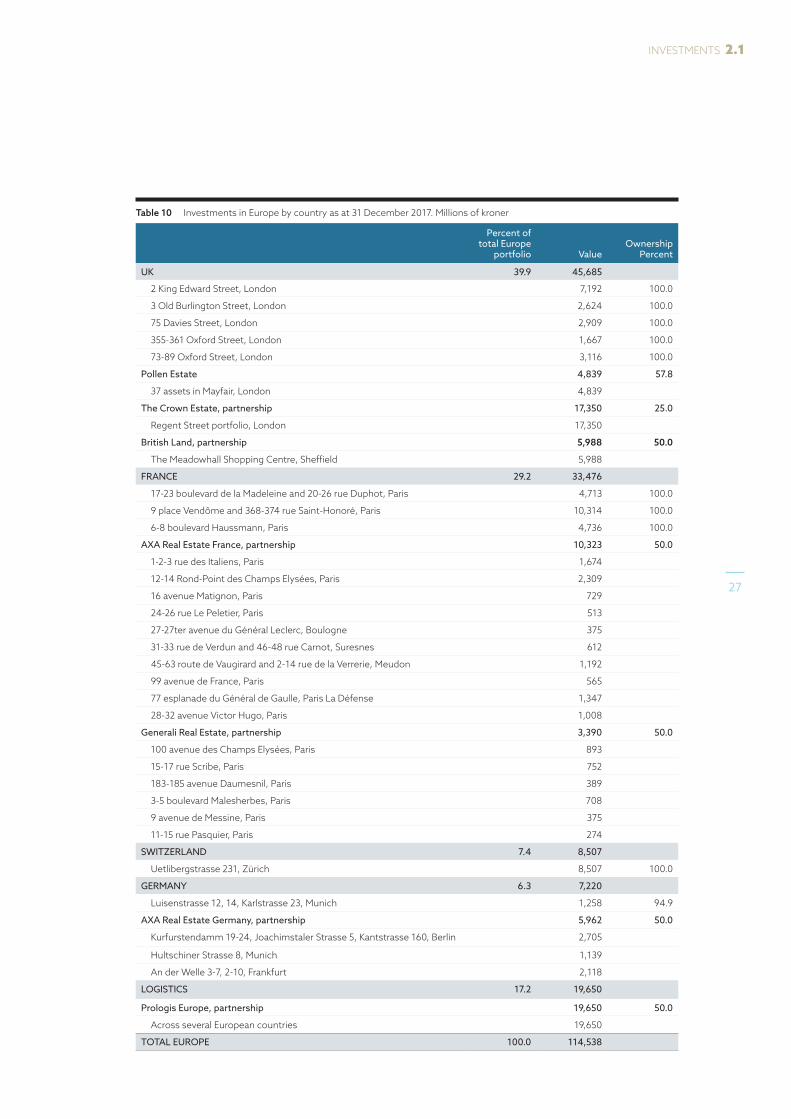
Table 10 Investments in Europe by country as at 31 December 2017. Millions of kroner
Percent of total Europe
portfolio ValueOwnership
Percent
UK 39.9 45,685
2 King Edward Street, London 7,192 100.0
3 Old Burlington Street, London 2,624 100.0
75 Davies Street, London 2,909 100.0
355-361 Oxford Street, London 1,667 100.0
73-89 Oxford Street, London 3,116 100.0
Pollen Estate 4,839 57.8
37 assets in Mayfair, London 4,839
The Crown Estate, partnership 17,350 25.0
Regent Street portfolio, London 17,350
British Land, partnership 5,988 50.0
The Meadowhall Shopping Centre, Sheffield 5,988
FRANCE 29.2 33,476
17-23 boulevard de la Madeleine and 20-26 rue Duphot, Paris 4,713 100.0
9 place Vendôme and 368-374 rue Saint- Honoré, Paris 10,314 100.0
6-8 boulevard Haussmann, Paris 4,736 100.0
AXA Real Estate France, partnership 10,323 50.0
1-2-3 rue des Italiens, Paris 1,674
12-14 Rond-Point des Champs Elysées, Paris 2,309
16 avenue Matignon, Paris 729
24-26 rue Le Peletier, Paris 513
27-27ter avenue du Général Leclerc, Boulogne 375
31-33 rue de Verdun and 46-48 rue Carnot, Suresnes 612
45-63 route de Vaugirard and 2-14 rue de la Verrerie, Meudon 1,192
99 avenue de France, Paris 565
77 esplanade du Général de Gaulle, Paris La Défense 1,347
28-32 avenue Victor Hugo, Paris 1,008
Generali Real Estate, partnership 3,390 50.0
100 avenue des Champs Elysées, Paris 893
15-17 rue Scribe, Paris 752
183-185 avenue Daumesnil, Paris 389
3-5 boulevard Malesherbes, Paris 708
9 avenue de Messine, Paris 375
11-15 rue Pasquier, Paris 274
SWITZERLAND 7.4 8,507
Uetlibergstrasse 231, Zürich 8,507 100.0
GERMANY 6.3 7,220
Luisenstrasse 12, 14, Karlstrasse 23, Munich 1,258 94.9
AXA Real Estate Germany, partnership 5,962 50.0
Kurfurstendamm 19-24, Joachimstaler Strasse 5, Kantstrasse 160, Berlin 2,705
Hultschiner Strasse 8, Munich 1,139
An der Welle 3-7, 2-10, Frankfurt 2,118
LOGISTICS 17.2 19,650
Prologis Europe, partnership 19,650 50.0
Across several European countries 19,650
TOTAL EUROPE 100.0 114,538
27
INVESTMENTS 2.1

900 16th Street, NW
1101 New York Avenue, NW
WASHINGTON, D.C.In 2017, the fund acquired a 49 percent interest in two properties located at 900 16th Street, NW, and 1101 New York Avenue, NW, in joint venture with Oxford Properties Group.
Investments | Real estate investments 2017 | Government Pension Fund Global
28
MARKET TRENDSRents for high-quality US offices continued to rise in 2017, but at a slower pace. At a national level, rents were marginally higher, up 0.4 percent. The slightly higher rents were also seen across our strategic cities at metro level, although there was some variation within submarkets. Capital values for offices in central business districts rose at a slower pace in all four of our strategic cities, with values flat in Washington, D.C. on a year earlier. Office transaction volumes fell 8 percent in the US, although the picture was not uniform at metro level.
The New York office market Rents in New York City were relatively stable during 2017. In the central business district submarkets, rents decreased by 1 percent in Midtown Manhattan, but rose by around 6 percent in both Downtown Manhattan and Midtown South. Vacancy rates were largely unchanged during the year despite a 2 percent increase in the stock of office space. Office transaction volumes on Manhattan fell 35 percent compared to the previous year to around 15 billion dollars.
The Boston office marketRents in central Boston increased 2 percent, assisted by the Back-Bay District, where rents increased by 4 percent. Office rents in the Financial District rose more modestly, by 3 percent. Office transaction volumes in Boston came in at 8 billion dollars for the third consecutive year, of which around 5 billion dollars targeted central Boston.
The Washington, D.C. office marketWashington, D.C. office rents were relatively constant at metro level compared to the previous year, but the market remained slow, evidenced by increased tenant incentives and
Investments in the USRents in the US office market increased by 0.4 percent, while transaction volumes fell 8 percent. In logistics, vacancy was 7 percent and rents increased by 5 percent.
29
INVESTMENTS 2.2
rising concessions from landlords to secure tenants.
Vacancy rates remain the most elevated among our US strategic cities at around 15 percent, although they did fall back marginally during the year. In the central business districts and Capitol Hill submarkets, average vacancy was below 11 percent during 2017. Office transaction volumes increased by 48 percent to 5 billion dollars in 2017, after a 24 percent decline in the previous year.
The San Francisco office marketIn San Francisco, office rents finished the year around one percent higher. In the wider City market, rents were broadly unchanged on the previous year. After having increased for much of 2016, vacancy rates ended the year around 0.5 percentage points lower at 6 percent. Vacancy rates were low in several of the submarkets where we are invested, including South of Market and the Central Business District, at 4 percent and 6 percent respectively. Office transaction volumes decreased by 32 percent in San Francisco compared to the previous year, at around 5 billion dollars.
The logistics marketVacancy in the US logistics market was 7 percent, while rents increased by 5 percent nationwide. The strongest growth was found near San Francisco, in markets such as Walnut Creek, Oakland and San Jose, where rents rose 10–30 percent. At the other end of the scale, metros in Texas continued their decline. In Dallas, rents decreased by 11 percent because of the delayed impact of earlier declines in oil and commodity prices.
OUR INVESTMENTS IN THE USInvestments in the US made up 46.2 percent of our real estate investments at the end of the year and returned 6.2 percent.
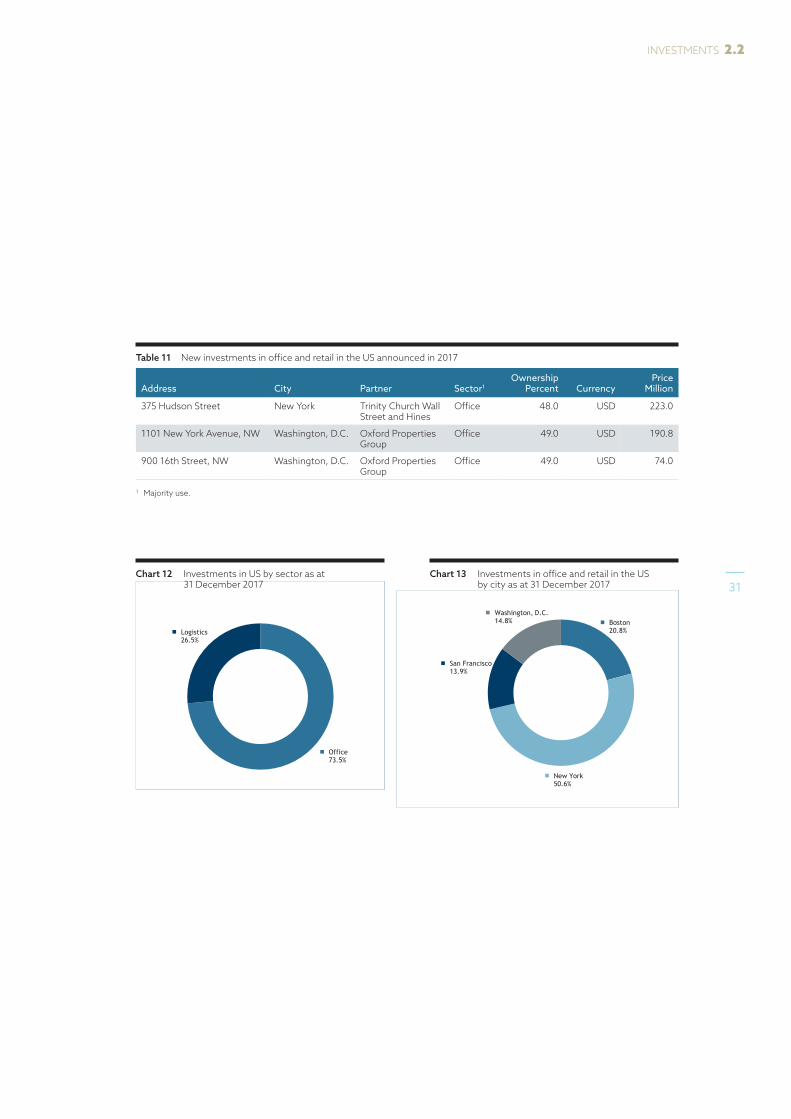
Our office and retail investments We had investments in 38 office and retail properties in the US at the end of 2017. Investments in office and retail in the US are concentrated in four cities: New York, Boston, San Francisco and Washington, D.C. Our largest exposure was to New York, at 50.6 percent of total US office and retail investments. Investments in office and retail made up 73.5 percent of the total US portfolio and returned 4.3 percent in local currency.
None of our office and retail properties in the US is classified as retail properties. Some properties have a retail component, but they are still classified as office buildings because income from the office component is greater than that of the retail component. The three largest tenants were Kirkland & Ellis with 3.7 percent, Proskauer Rose with 3.0 percent and Wellington with 3.0 percent. The ten largest tenants generated 24.4 percent of rental income, and the average remaining lease term was 7.1 years.
Investments | Real estate investments 2017 | Government Pension Fund Global
30
Responsible area
Chart name:
Chart (update by right click on chart edit data edit data:
Updated by (initials):
Comments:
Source:
Updated date:
Chart 16 Investments in office and retail in the US by city as at 31 December 2017
CRO
CCA
16.01.18
FILTERS:
Sector filter: office and retail only
Country filter: US only
CS - OK
Boston20.8%
New York50.6%
San Francisco13.9%
Washington, D.C.14.8%
Chart 13 Investments in office and retail in the US by city as at 31 December 2017
Table 11 New investments in office and retail in the US announced in 2017
Address City Partner Sector1Ownership
Percent CurrencyPrice
Million
375 Hudson Street New York Trinity Church Wall Street and Hines
Office 48.0 USD 223.0
1101 New York Avenue, NW Washington, D.C. Oxford Properties Group
Office 49.0 USD 190.8
900 16th Street, NW Washington, D.C. Oxford Properties Group
Office 49.0 USD 74.0
1 Majority use.
Responsible area
Chart name:
Chart (update by right click on chart edit data edit data:
Updated by (initials):
Comments:
Source:
Updated date:
Chart 15 Investments in US by sector as at 31 December 2017
CRO
CCA
16.01.18
CCA: note properties are classified on majority use basis. There are no stand-alone US retail properties and so NBREM’s retail units form part of buildings where the majority use is offices. CSU - oK
Office73.5%
Logistics26.5%
Chart 12 Investments in US by sector as at 31 December 2017 31
INVESTMENTS 2.2

1101 New York Avenue, NW, Washington, D.C. In July 2017, the fund acquired a 49 percent interest in 1101 New York Avenue, NW, in Washington, D.C., in joint venture with Oxford Properties Group. The property comprises approximately 385,000 square feet of office, retail and storage space.
900 16th Street, NW, Washington, D.C. In June 2017, the fund acquired a 49 percent interest in 900 16th Street, NW, in joint venture with a new partner, Oxford Properties Group. The property comprises approximately 121,000 square feet of office and retail space.
375 Hudson Street, New York In August 2017, the fund acquired a 48 percent interest in 375 Hudson Street in New York, in joint venture with Trinity Church Wall Street and Hines. The property comprises approximately 1.1 million square feet of office and retail space.
Investments | Real estate investments 2017 | Government Pension Fund Global
32
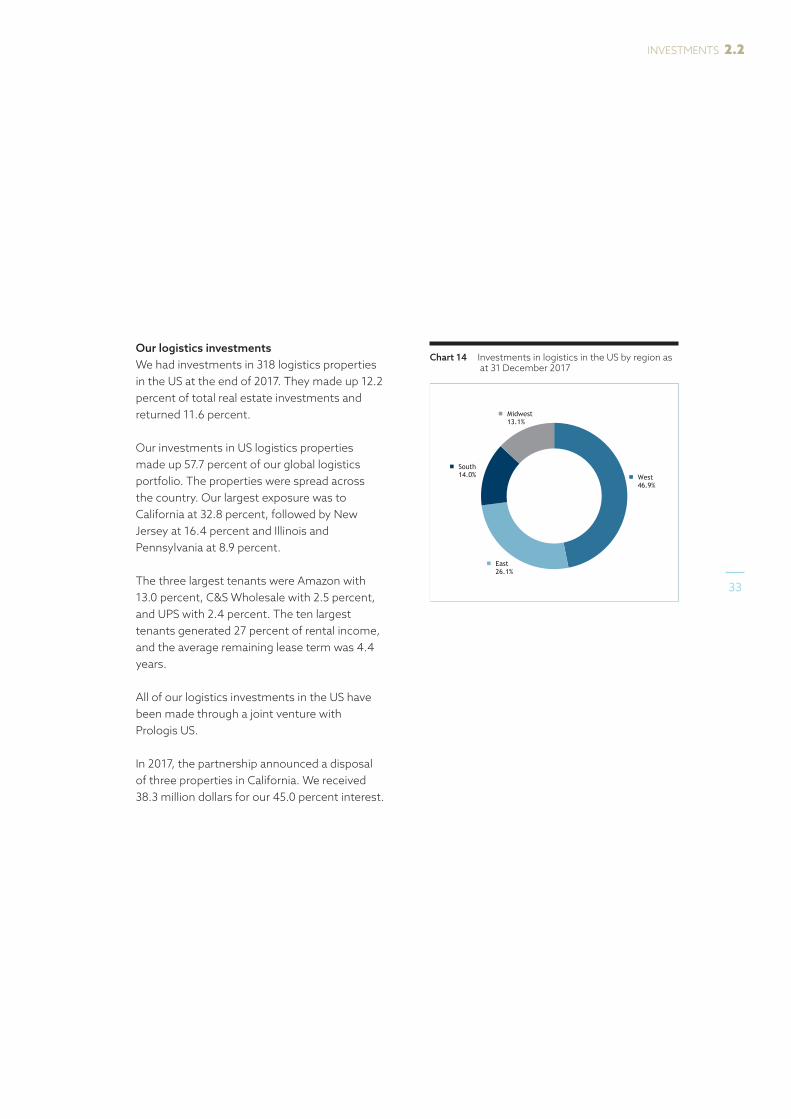
Our logistics investments We had investments in 318 logistics properties in the US at the end of 2017. They made up 12.2 percent of total real estate investments and returned 11.6 percent.
Our investments in US logistics properties made up 57.7 percent of our global logistics portfolio. The properties were spread across the country. Our largest exposure was to California at 32.8 percent, followed by New Jersey at 16.4 percent and Illinois and Pennsylvania at 8.9 percent.
The three largest tenants were Amazon with 13.0 percent, C&S Wholesale with 2.5 percent, and UPS with 2.4 percent. The ten largest tenants generated 27 percent of rental income, and the average remaining lease term was 4.4 years.
All of our logistics investments in the US have been made through a joint venture with Prologis US.
In 2017, the partnership announced a disposal of three properties in California. We received 38.3 million dollars for our 45.0 percent interest.
Responsible area
Chart name:
Chart (update by right click on chart edit data edit data:
Updated by (initials):
Comments:
Source:
Updated date:
Chart 17 Investments in logistics in the US by region as at 31 December 2017
CRO (VPM)
FEI
03/02/18
Region splits based on PRE2 Barra Area in REDW
Family filter: Reagan only
No other filters
CS
XXXXXX
West46.9%
East26.1%
South14.0%
Midwest13.1%
Chart 14 Investments in logistics in the US by region as at 31 December 2017
33
INVESTMENTS 2.2
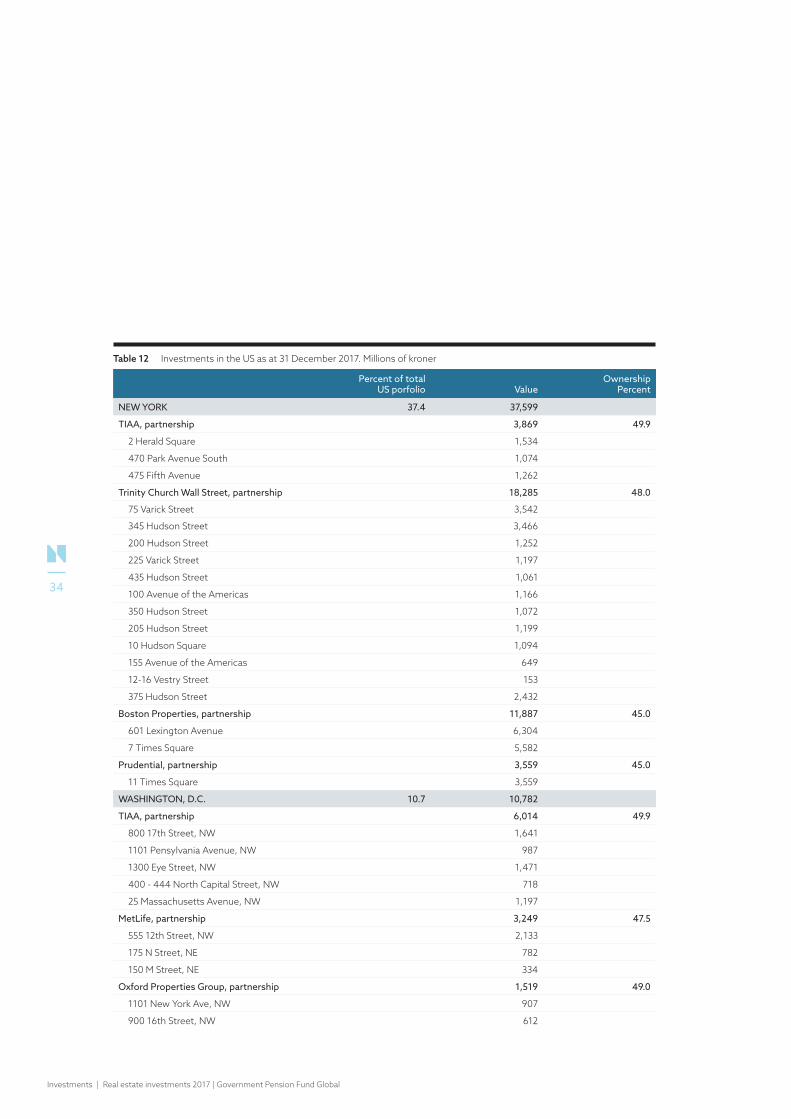
Table 12 Investments in the US as at 31 December 2017. Millions of kroner
Percent of total US porfolio Value
OwnershipPercent
NEW YORK 37.4 37,599
TIAA, partnership 3,869 49.9
2 Herald Square 1,534
470 Park Avenue South 1,074
475 Fifth Avenue 1,262
Trinity Church Wall Street, partnership 18,285 48.0
75 Varick Street 3,542
345 Hudson Street 3,466
200 Hudson Street 1,252
225 Varick Street 1,197
435 Hudson Street 1,061
100 Avenue of the Americas 1,166
350 Hudson Street 1,072
205 Hudson Street 1,199
10 Hudson Square 1,094
155 Avenue of the Americas 649
12-16 Vestry Street 153
375 Hudson Street 2,432
Boston Properties, partnership 11,887 45.0
601 Lexington Avenue 6,304
7 Times Square 5,582
Prudential, partnership 3,559 45.0
11 Times Square 3,559
WASHINGTON, D.C. 10.7 10,782
TIAA, partnership 6,014 49.9
800 17th Street, NW 1,641
1101 Pensylvania Avenue, NW 987
1300 Eye Street, NW 1,471
400 - 444 North Capital Street, NW 718
25 Massachusetts Avenue, NW 1,197
MetLife, partnership 3,249 47.5
555 12th Street, NW 2,133
175 N Street, NE 782
150 M Street, NE 334
Oxford Properties Group, partnership 1,519 49.0
1101 New York Ave, NW 907
900 16th Street, NW 612
Investments | Real estate investments 2017 | Government Pension Fund Global
34
Percent of total US porfolio Value
OwnershipPercent
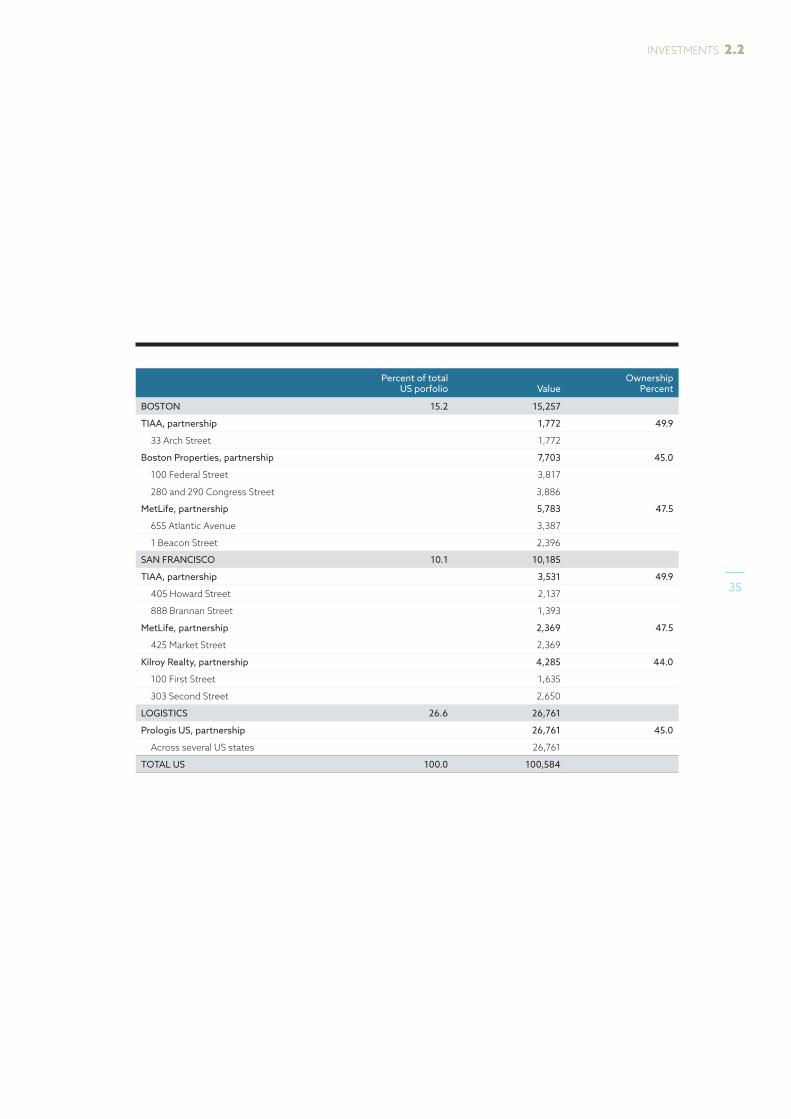
BOSTON 15.2 15,257
TIAA, partnership 1,772 49.9
33 Arch Street 1,772
Boston Properties, partnership 7,703 45.0
100 Federal Street 3,817
280 and 290 Congress Street 3,886
MetLife, partnership 5,783 47.5
655 Atlantic Avenue 3,387
1 Beacon Street 2,396
SAN FRANCISCO 10.1 10,185
TIAA, partnership 3,531 49.9
405 Howard Street 2,137
888 Brannan Street 1,393
MetLife, partnership 2,369 47.5
425 Market Street 2,369
Kilroy Realty, partnership 4,285 44.0
100 First Street 1,635
303 Second Street 2,650
LOGISTICS 26.6 26,761
Prologis US, partnership 26,761 45.0
Across several US states 26,761
TOTAL US 100.0 100,584
35
INVESTMENTS 2.2
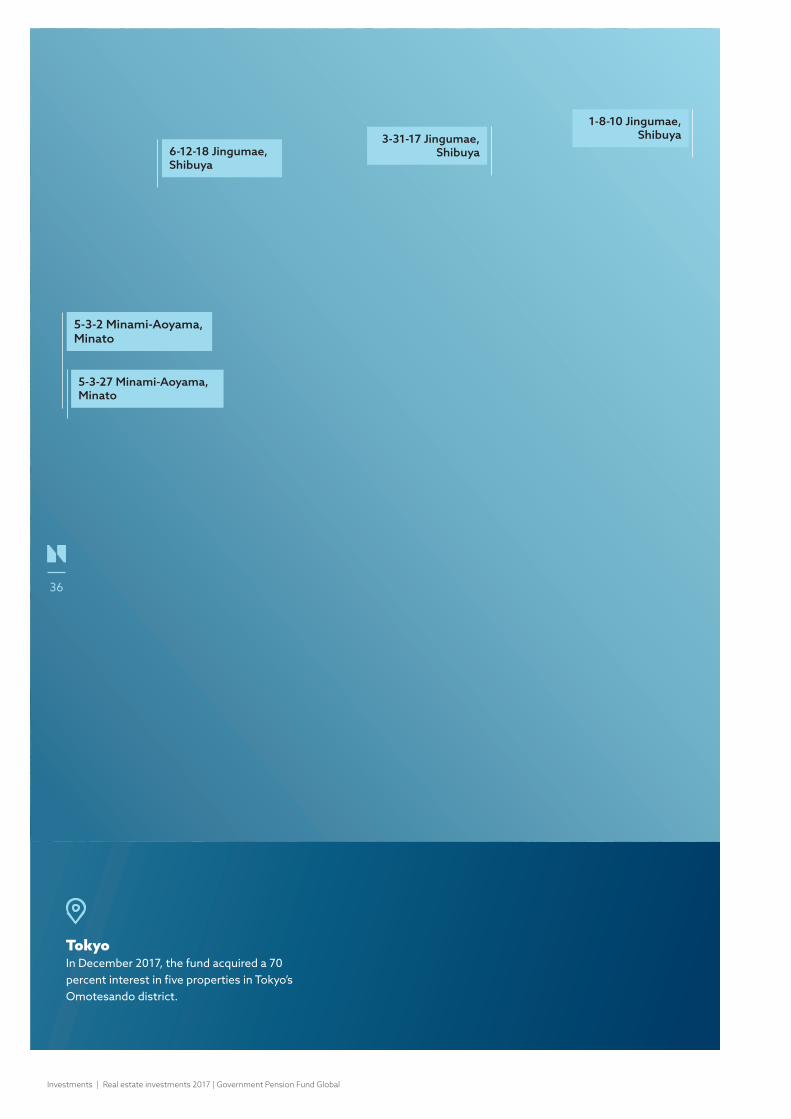
6-12-18 Jingumae, Shibuya
5-3-2 Minami-Aoyama,Minato
5-3-27 Minami-Aoyama, Minato
3-31-17 Jingumae, Shibuya
1-8-10 Jingumae,Shibuya
TokyoIn December 2017, the fund acquired a 70 percent interest in five proper ties in Tokyo’s Omotesando district.
Investments | Real estate investments 2017 | Government Pension Fund Global
36
Investments in AsiaThe Tokyo market has been characterised by declining vacancy rates in the office sector and low vacancy in prime retail over the last five years.
MARKET TRENDSRents in the Tokyo office and retail market were broadly stable during 2017. Office vacancy rates are now at a 10-year low, having declined for the last five years, and prime retail vacancy is below 2 percent.
Overall investment volumes increased in the greater Tokyo area due to strong appetite from overseas investors. In central Tokyo, office transactions were down 8 percent on 2016, however.
Office vacancy rates are now below 2 percent in many of the key central business district submarkets. Given these tight conditions, prime office rent increased by 1.4 percent in 2017. Central Tokyo saw around 583 billion yen of office transaction volumes in 2017.
In the retail market, occupier activity improved in prime high street areas as consumer confidence and retail sales displayed stronger trends. Prime rents and capital values remained relatively constant during 2017. The Omotesando district, where we own five properties, has seen very tight vacancy levels amid a high share of new store openings. Omotesando accounted for 43 percent of new retail store openings in Tokyo in the fourth quarter of 2017 and offers a variety of retail formats appealing to a broader mix of consumers and retail operators.
Transaction volumes for retail assets in central Tokyo came in at 229 billion yen in 2017, which was broadly in line with the previous year, when excluding our own 2017 transaction.
OUR INVESTMENTS IN ASIAInvestments in Asia made up 1.6 percent of our real estate investments at the end of the year. We had investments in five office and retail properties in Tokyo at the end of 2017.
Investments in office and retail made up 100 percent of our Asian investments. We had no logistics investments in Asia at the end of 2017.
The investments comprised 71.8 percent retail and 28.2 percent offices. The three largest tenants were WeWork with 25.6 percent, H&M with 25.0 percent and Zara with 14.4 percent. The ten largest tenants generated 96.2 percent of rental income, and the average remaining lease term was 7.7 years.
37
INVESTMENTS 2.3

6-31-17 Jingumae, Shibuya, Tokyo.
INVESTMENTS IN TOKYOIn December 2017, the fund acquired a 70 percent interest in five properties in Tokyo, Japan, in a joint venture with a new partner, Tokyu Land Corporation, at a price of 92.8 billion yen. The portfolio comprises approximately 3,720 tsubo of retail and office space in Tokyo’s Omotesando district.
5-3-2 Minami-Aoyama, Minato, Tokyo.
6-12-18 Jingumae, Shibuya, Tokyo
Investments | Real estate investments 2017 | Government Pension Fund Global
38

Table 14 Investments in Asia by country as at 31 December 2017. Millions of kroner
Value Ownership in percent
JAPAN 3,457
Tokyu Land Corporation, partnership 70.0
1-8-10 Jingumae, Shibuya, Tokyo 912
6-31-17 Jingumae, Shibuya, Tokyo 726
6-12-18 Jingumae, Shibuya, Tokyo 981
5-3-2 Minami-Aoyama, Minato, Tokyo 727
5-3-27 Minami-Aoyama, Minato, Tokyo 111
TOTAL ASIA 3,457
5-3-27 Minami-Aoyama, Minato, Tokyo. 1-8-10 Jingumae, Shibuya, Tokyo.
39
INVESTMENTS 2.3

New York, US In July 2017, the fund acquired a 48 percent interest in 375 Hudson Street.
375 Hudson Street
Income | Real estate investments 2017 | Government Pension Fund Global
40
Investment processReal estate investments require extensive analysis, in-depth evaluation and efficient decision-making.
When considering an investment opportunity, we assess and make assumptions about rents, capitalisation rates, vacancy periods, lease terms, refurbishment costs and other costs. We carry out a thorough due diligence analysis of financial, legal, regulatory, tax-related, structural, operational, technical, environmental and insurance-related matters.
APPROVAL PROCESSThe decision process for real estate investments is governed by investment mandates, committees and job descriptions. All significant investments are considered by boards and committees consisting of internal and external advisors, and all processes are well documented.
Norges Bank’s Executive Board approves investments above 1.5 billion dollars, based on the Real Estate Investment Board’s recommendations.
The Executive Board consists of eight members appointed by the King in Council and is chaired by the Governor of Norges Bank.
The Executive Board has established a Risk and Investment Committee. This sub-committee supports the Executive Board in its risk and real estate management, and in major investment decisions. The committee consists of one of the Deputy Governors of Norges Bank, who chairs the committee, and two of the Executive Board’s external members.
The Real Estate Investment Board reviews and approves investments above 500 million
dollars, and makes recommendations to the Executive Board on investments above 1.5 billion dollars. The Real Estate Investment Board ensures that investments are made in accordance with our mandate and strategy plan. The board consists of the Chief Executive Officer of Norges Bank Investment Management, who chairs the board, the Chief Executive Officer of Norges Bank Real Estate Management, the Chief Risk Officer of Norges Bank Investment Management, and two external board members.
The Real Estate Investment Committee considers a range of issues related to new investments, including aspects of the transaction and the decision-making process. Investments that involve new partners, new markets, new asset managers and/or new holding structures are reviewed by the Real Estate Investment Committee. The committee consists of Norges Bank Real Estate Management’s leader group.
Norges Bank Real Estate Management has three Real Estate Advisory Boards – one for Europe, one for the US and one for Asia. The respective Real Estate Advisory Board advises on all investments, including aspects of structure, commerciality, pricing, risk and strategy. The boards consist of the relevant chief investment officer, the Chief Risk Officer and two external advisors.
41
REAL ESTATE MANAGEMENT 3.1

When the relevant body has approved an investment, the transaction documents are finalised. Generally, a subsidiary of Norges Bank will enter into a purchase or sale agreement. The process of closing a transaction and the transfer of funds for payment of the purchase price will vary from market to market.
INVESTING THROUGH SUBSIDIARIES Real estate investments are made through subsidiaries to ensure sound risk management and to protect Norges Bank and the fund’s assets.
Investments in real estate differ from investments in listed equities and bonds. A real estate transaction will often take months from first discussions to completion. Purchase contracts, joint venture agreements when the investment is made with a joint venture partner, and asset management and property management agreements need to be negotiated individually in line with local market conventions and rules. Due diligence analyses of various risk factors are also performed ahead of each investment.
The Ministry of Finance has set rules for real estate investments in the fund’s mandate.
These rules permit Norges Bank Real Estate Management to invest in real estate through Norwegian or foreign entities. Unlisted companies and real estate structures must be registered in countries that Norway has tax treaties with or countries that give Norway the right to obtain tax information under other international agreements.
The investment risk associated with real estate is not necessarily limited to the sum invested. Norges Bank Real Estate Management has
assessed suitable holding and operating platforms for the implementation of real estate investments to protect against these risks.
It is good risk management and standard practice in the real estate industry to invest through subsidiaries.
The fund’s tax position depends on local rules and on the bilateral tax treaties that Norway is party to. It is important for the fund that it pays tax in accordance with local rules, but also that it does not incur more tax than necessary. Expected tax costs are therefore among the factors considered when deciding on a holding structure.
INVESTMENTS IN CONTINENTAL EUROPE Since 2011, Norges Bank has invested in continental Europe, including France, Germany and Switzerland, through a holding and management platform in Luxembourg. Logistics investments in the UK are also held from Luxembourg.
We intend to migrate the Luxembourg companies to Norway once the relevant provisions in Norwegian law enable company migration.
The subsidiaries in continental Europe are financed with equity and intercompany loans. The use of intercompany loans helps promote efficient cash management, including the repatriation of income back to the fund. These loans also reduce the tax base. All our structures, including the use of intercompany loans, comply with relevant laws and regulations on tax allowances, capitalisation and transfer pricing.
Income | Real estate investments 2017 | Government Pension Fund Global
42
The fund’s investments in Germany and Switzerland are held directly by subsidiaries in Luxembourg. The assets in France are held by French special-purpose entities also owned by subsidiaries in Luxembourg.
The partnership with Prologis Europe for the European logistics portfolio is held through a Luxembourg company with more than 190 underlying property companies in Luxembourg and the European markets we invest in.
INVESTMENTS IN THE UK Under English law, foreign sovereign investors are exempt from income tax and capital gains tax on property sales. The fund has established holding structures in the UK that meet the requirements for such an exemption, using tax-transparent English Limited Partnerships for real estate investments.
INVESTMENTS IN THE US In the US, the fund is exempt from taxation under local laws because it is owned by a foreign government. The real estate holding structures take the form of local tax-transparent entities with limited liability. Properties are held by private real estate investment trusts.
The US subsidiaries are registered in Delaware. Because the fund is exempt from US taxation, the choice of state for the establishment of the subsidiary has no tax implications for the fund, but Delaware has well developed company laws and an efficient and respected court system for dealing with company law disputes. It is therefore widely used in the US as a preferred state for forming and registering companies.
INVESTMENTS IN ASIA The investment in Asia was made through a Japanese regulated joint venture company, which in turn has acquired ownership interests in five underlying real estate assets.
This structure is a common way of owning real estate in Japan. The ownership is held through two Norwegian subsidiaries of Norges Bank.
TRANSPARENCYTransparency about the management of the fund and the results we achieve is important. We report the return on our investments each quarter and announce all purchases and sales above 25 million dollars on www.nbim.no. We normally make announcements when agreements are signed. The announcement date usually differs from the date when the investment is recognised in the financial statements. All recognised purchases and sales are reflected in the annual holdings list on our website www.nbim.no.
43
REAL ESTATE MANAGEMENT 3.1
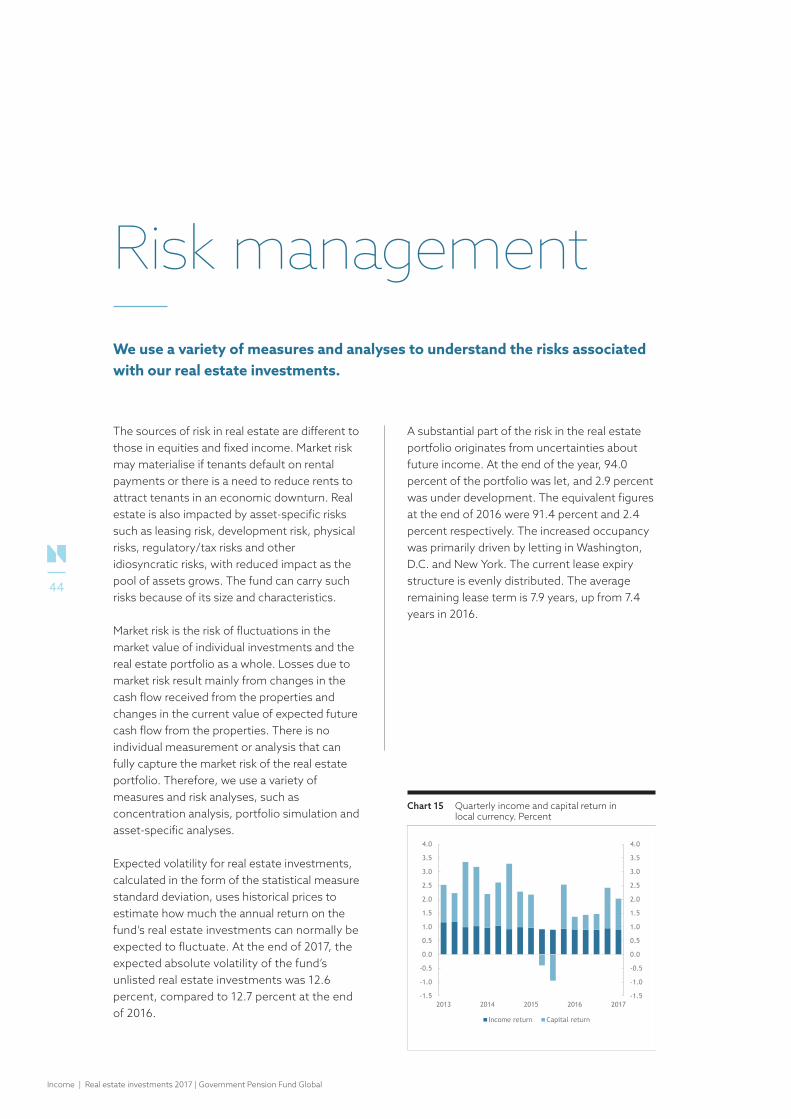
Risk managementWe use a variety of measures and analyses to understand the risks associated with our real estate investments.
A substantial part of the risk in the real estate portfolio originates from uncertainties about future income. At the end of the year, 94.0 percent of the portfolio was let, and 2.9 percent was under development. The equivalent figures at the end of 2016 were 91.4 percent and 2.4 percent respectively. The increased occupancy was primarily driven by letting in Washington, D.C. and New York. The current lease expiry structure is evenly distributed. The average remaining lease term is 7.9 years, up from 7.4 years in 2016.
The sources of risk in real estate are different to those in equities and fixed income. Market risk may materialise if tenants default on rental payments or there is a need to reduce rents to attract tenants in an economic downturn. Real estate is also impacted by asset-specific risks such as leasing risk, development risk, physical risks, regulatory/tax risks and other idiosyncratic risks, with reduced impact as the pool of assets grows. The fund can carry such risks because of its size and characteristics.
Market risk is the risk of fluctuations in the market value of individual investments and the real estate portfolio as a whole. Losses due to market risk result mainly from changes in the cash flow received from the properties and changes in the current value of expected future cash flow from the properties. There is no individual measurement or analysis that can fully capture the market risk of the real estate portfolio. Therefore, we use a variety of measures and risk analyses, such as concentration analysis, portfolio simulation and asset-specific analyses.
Expected volatility for real estate investments, calculated in the form of the statistical measure standard deviation, uses historical prices to estimate how much the annual return on the fund’s real estate investments can normally be expected to fluctuate. At the end of 2017, the expected absolute volatility of the fund’s unlisted real estate investments was 12.6 percent, compared to 12.7 percent at the end of 2016.
Responsible area
Chart name:
Chart (update by right click on chart edit data edit data:
Updated by (initials):
Comments:
Source:
Updated date:
Chart 17 Quarterly income and capital return in local currency. Percent
Risk
FEI
12/02/18
-1.5
-1.0
-0.5
0.0
0.5
1.0
1.5
2.0
2.5
3.0
3.5
4.0
-1.5
-1.0
-0.5
0.0
0.5
1.0
1.5
2.0
2.5
3.0
3.5
4.0
2013 2014 2015 2016 2017
Income return Capital return
Chart 15 Quarterly income and capital return in local currency. Percent
Income | Real estate investments 2017 | Government Pension Fund Global
44
RISK MANAGEMENT PROCESS We seek to balance risks and returns through holistic asset management and investment management.
As the unlisted real estate portfolio grows, asset management is gradually becoming more important. A vital element of asset management is letting space, ensuring that properties are generating the highest possible long-term rental income, either through the renewal of existing leases or by signing new leases for available space. We monitor and assess leases, tenants and markets to ensure that the risk is reflected in new agreements.
Responsible area
Chart name:
Chart (update by right click on chart edit data edit data:
Updated by (initials):
Comments:
Source:
Updated date:
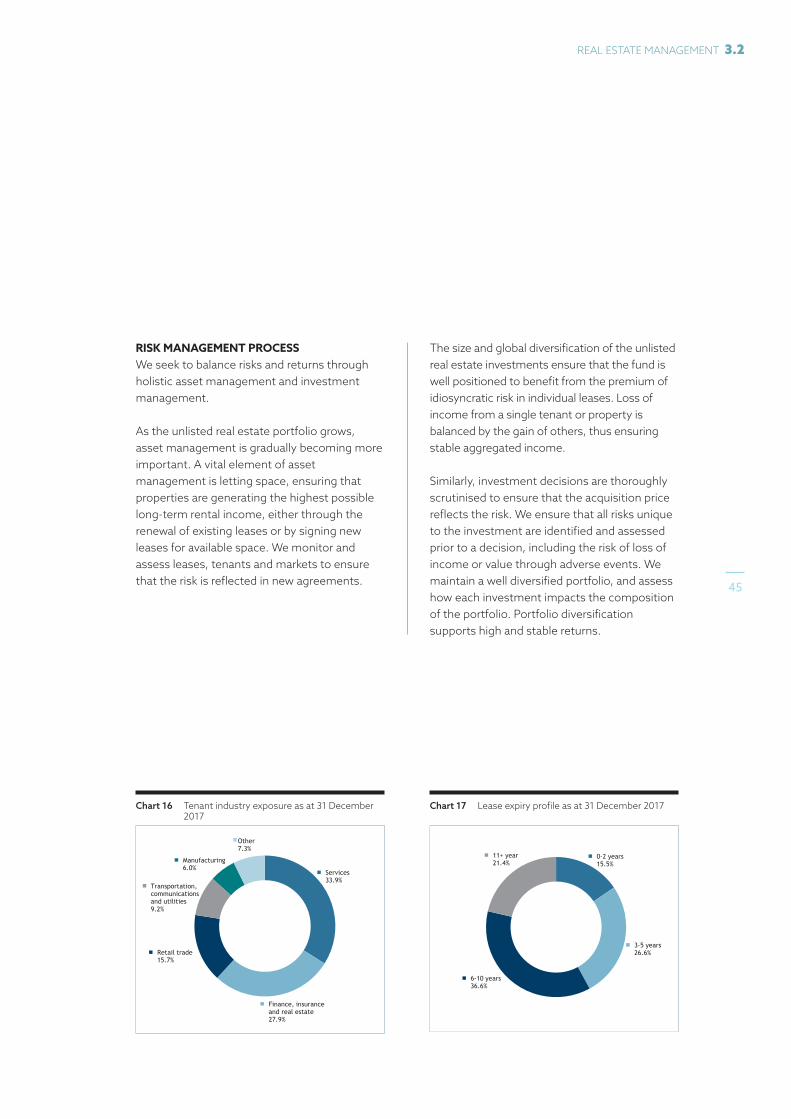
Chart 19 Lease expiry profile as at 31 December 2017
CRO
FEI
22.01.2018
years
0-2 years15.5%
3-5 years26.6%
6-10 years36.6%
11+ year21.4%
Chart 17 Lease expiry profile as at 31 December 2017
Responsible area
Chart name:
Chart (update by right click on chart edit data edit data:
Updated by (initials):
Comments:
Source:
Updated date:
Chart 18 Tenant industry exposure as at 31 December 2017
CRO
FEI
22.01.2018Services33.9%
Finance, insurance and real estate27.9%
Retail trade15.7%
Transportation, communications and utilities9.2%
Manufacturing6.0%
Other7.3%
Chart 16 Tenant industry exposure as at 31 December 2017
The size and global diversification of the unlisted real estate investments ensure that the fund is well positioned to benefit from the premium of idiosyncratic risk in individual leases. Loss of income from a single tenant or property is balanced by the gain of others, thus ensuring stable aggregated income.
Similarly, investment decisions are thoroughly scrutinised to ensure that the acquisition price reflects the risk. We ensure that all risks unique to the investment are identified and assessed prior to a decision, including the risk of loss of income or value through adverse events. We maintain a well diversified portfolio, and assess how each investment impacts the composition of the portfolio. Portfolio diversification supports high and stable returns.
45
REAL ESTATE MANAGEMENT 3.2
Responsible area
Chart name:
Chart (update by right click on chart edit data edit data:
Updated by (initials):
Comments:
Source:
Updated date:
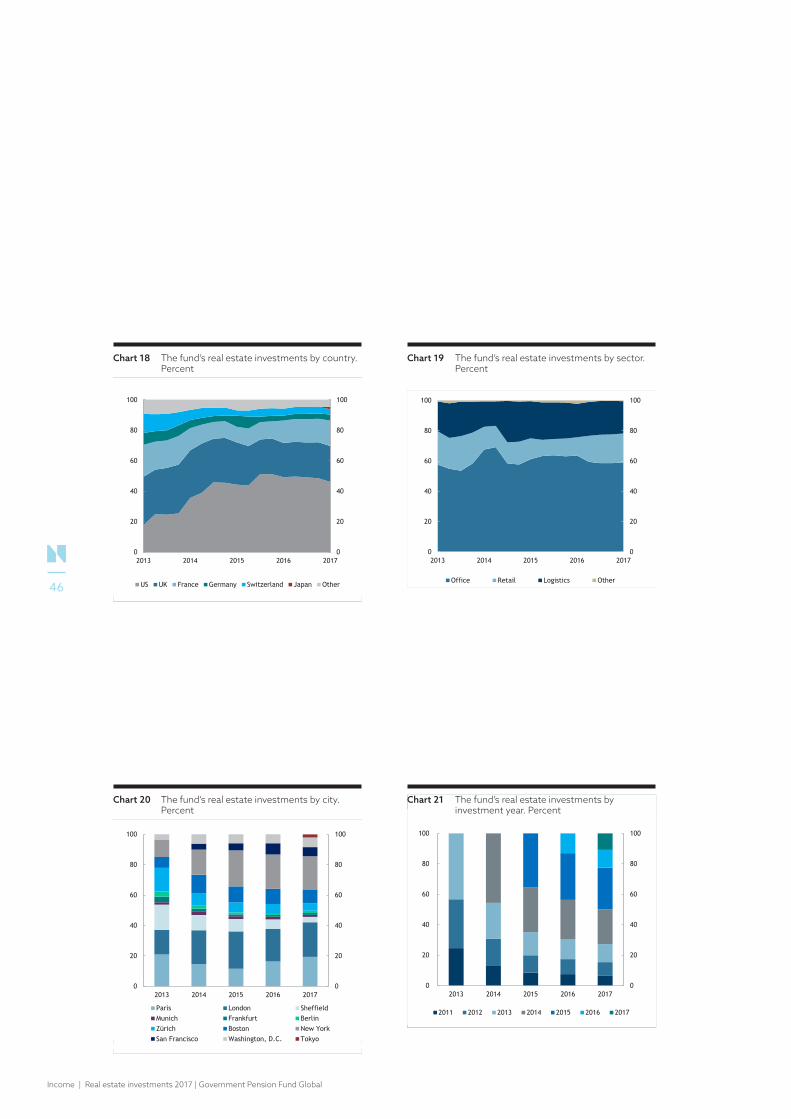
Chart 22 The fund’s real estate investments by city. Percent
CRO
FEI
23/01/2018
Norges Bank Real Estate Management
0
20
40
60
80
100
0
20
40
60
80
100
2013 2014 2015 2016 2017
Paris London SheffieldMunich Frankfurt BerlinZürich Boston New YorkSan Francisco Washington, D.C. Tokyo
Office and retail only
Responsible area
Figur navn/ Chart name:
Figur/ Chart (update by right click on chart edit data edit data:
Updated by (initials):
Comments:
Kilde / Source:
Updated date:
Chart 21 The fund’s real estate investments by sector. Percent
CRO
FEI
23/01/2018
Norges Bank Real Estate Management
0
20
40
60
80
100
0
20
40
60
80
100
2013 2014 2015 2016 2017
Office Retail Logistics Other
Responsible area
Figur navn/ Chart name:
Figur/ Chart (update by right click on chart edit data edit data:
Updated by (initials):
Comments:
Kilde / Source:
Updated date:
Chart 23 The fund’s real estate investments by investment year. Percent
Risk
FEI
23/01/2018
Sum of (from table 26) -14,771-5,1671,816-23
Norges Bank Real Estate Management
0
20
40
60
80
100
0
20
40
60
80
100
2013 2014 2015 2016 2017
2011 2012 2013 2014 2015 2016 2017
Chart 20 The fund’s real estate investments by city. Percent
Chart 19 The fund’s real estate investments by sector. Percent
Chart 21 The fund’s real estate investments by investment year. Percent
Responsible area
Figur navn/ Chart name:
Figur/ Chart (update by right click on chart edit data edit data:
Updated by (initials):
Comments:
Kilde / Source:
Updated date:
Chart 20 The fund’s real estate investments by country. Percent
CRO
FEI
22/01/2018
Norges Bank Real Estate Management
0
20
40
60
80
100
0
20
40
60
80
100
2013 2014 2015 2016 2017
US UK France Germany Switzerland Japan Other
Chart 18 The fund’s real estate investments by country. Percent
Income | Real estate investments 2017 | Government Pension Fund Global
46
CONCENTRATION RISK The most important way in which we can reduce market risk is to diversify the portfolio. Concentration risk relates to absolute exposure to different segments of the investment universe. Before each new investment, we assess the related risks and how they might affect the portfolio. The composition of the fund’s real estate investments is continuously evaluated, with a particular emphasis on geography, sector, industry and investment year.
We aim to avoid making numerous major investments in any one year, as this reduces the risk of investing excessively in a period when the market subsequently turns out to have been overpriced.
The largest exposure to any one investment year is to 2015, which accounted for 27.4 percent of the total portfolio at the end of 2017.
The equivalent figure at the end of 2016 was 31.8 percent. The fund’s largest sector allocation is to offices, which accounted for 58.2 percent of the portfolio at the end of 2017, compared to 63.6 percent at the end of 2016. The fund’s largest exposure to a tenant industry was to services, at 33.9 percent. The largest exposure to a subindustry was to legal services, at 11.7 percent.
Furthermore, the real estate portfolio is exposed to idiosyncratic risks from investments in individual properties and from leases with individual tenants. Large individual investments will expose the fund to risks. The largest exposure to an individual investment was to Meadowhall Shopping Centre, at 4.4 percent of the portfolio’s gross asset value. The fund assesses individual investments by analysing selected comparable risk factors, and measures the properties’ risk by using simulation models.
47
REAL ESTATE MANAGEMENT 3.2
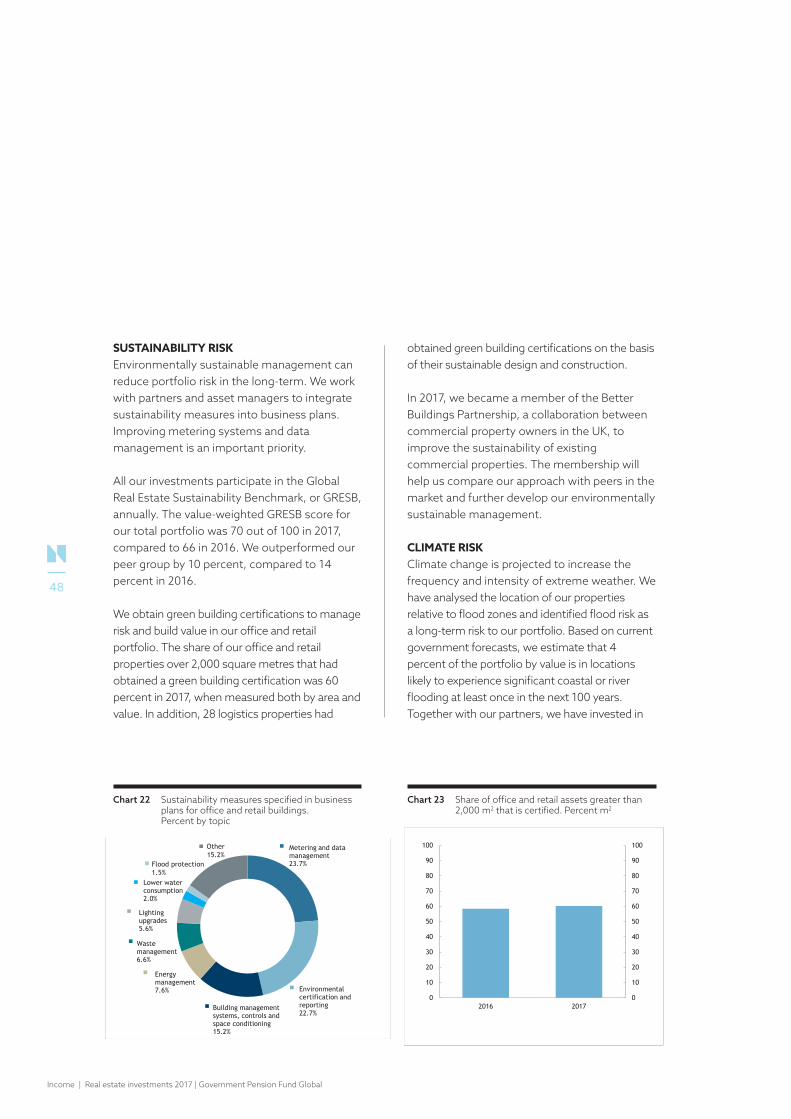
SUSTAINABILITY RISKEnvironmentally sustainable management can reduce portfolio risk in the long-term. We work with partners and asset managers to integrate sustainability measures into business plans. Improving metering systems and data management is an important priority.
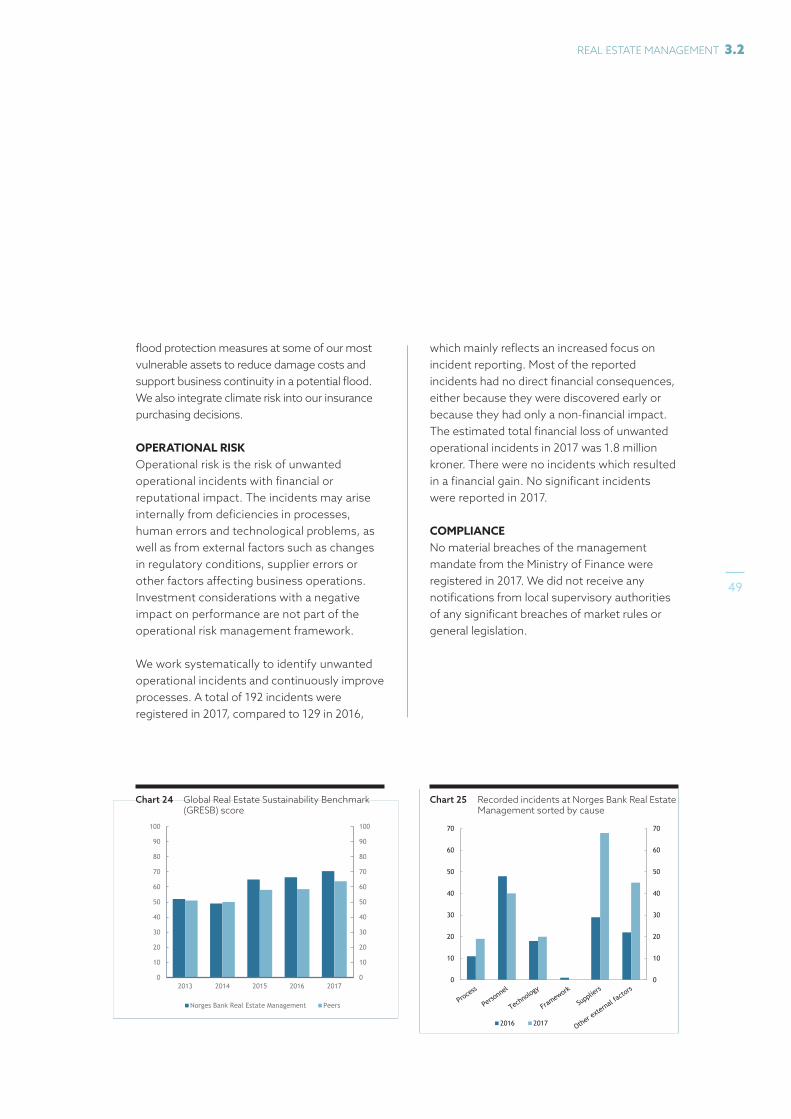
All our investments participate in the Global Real Estate Sustainability Benchmark, or GRESB, annually. The value-weighted GRESB score for our total portfolio was 70 out of 100 in 2017, compared to 66 in 2016. We outperformed our peer group by 10 percent, compared to 14 percent in 2016.
We obtain green building certifications to manage risk and build value in our office and retail portfolio. The share of our office and retail properties over 2,000 square metres that had obtained a green building certification was 60 percent in 2017, when measured both by area and value. In addition, 28 logistics properties had
obtained green building certifications on the basis of their sustainable design and construction.
In 2017, we became a member of the Better Buildings Partnership, a collaboration between commercial property owners in the UK, to improve the sustainability of existing commercial properties. The membership will help us compare our approach with peers in the market and further develop our environmentally sustainable management.
CLIMATE RISK Climate change is projected to increase the frequency and intensity of extreme weather. We have analysed the location of our properties relative to flood zones and identified flood risk as a long-term risk to our portfolio. Based on current government forecasts, we estimate that 4 percent of the portfolio by value is in locations likely to experience significant coastal or river flooding at least once in the next 100 years. Together with our partners, we have invested in
Responsible area
Chart name:
Chart (update by right click on chart edit data edit data:
Updated by (initials):
Comments:
Source:
Updated date:
Chart 24 Sustainability measures specified in business plans for office and retail buildings. Percent by topic
CRO
CMW
February 12 2018
Figures based on those figures verified by Pedro and Aleena / CIO Europe on Jan 30 2018.
CMW included George and Victoria BP 2017-18.
Metering and data management23.7%
Environmental certification and reporting22.7%
Building management systems, controls andspace conditioning 15.2%
Energy management7.6%
Waste management6.6%
Lighting upgrades5.6%
Lower water consumption2.0%
Other15.2%
Flood protection 1.5%
Chart 22 Sustainability measures specified in business plans for office and retail buildings. Percent by topic
Responsible area
Chart name:
Chart (update by right click on chart edit data edit data:
Updated by (initials):
Comments:
Source:
Updated date:
Chart 26 Share of office retail assets > 2,000m2 that is certified. Percent m2
CRO
CMW
January 30 2018
Figures verified by Pedro / CIO Europe.
Sustainability model: Master Green Building Model.xlsx (Desktop, Web, Mobile)
0
10
20
30
40
50
60
70
80
90
100
0
10
20
30
40
50
60
70
80
90
100
2016 2017
Chart 23 Share of office and retail assets greater than 2,000 m2 that is certified. Percent m2
Income | Real estate investments 2017 | Government Pension Fund Global
48
Responsible area
Chart name:
Chart (update by right click on chart edit data edit data:
Updated by (initials):
Comments:
Source:
Updated date:
Chart 27 Unwanted events at Norges Bank Real Estate Management sorted by cause
CCO (Control)
BTO
29.01.2018
Final numbers
0
10
20
30
40
50
60
70
0
10
20
30
40
50
60
70
2016 2017
28
Chart 25 Recorded incidents at Norges Bank Real Estate Management sorted by cause
flood protection measures at some of our most vulnerable assets to reduce damage costs and support business continuity in a potential flood. We also integrate climate risk into our insurance purchasing decisions.
OPERATIONAL RISK Operational risk is the risk of unwanted operational incidents with financial or reputational impact. The incidents may arise internally from deficiencies in processes, human errors and technological problems, as well as from external factors such as changes in regulatory conditions, supplier errors or other factors affecting business operations. Investment considerations with a negative impact on performance are not part of the operational risk management framework.
We work systematically to identify unwanted operational incidents and continuously improve processes. A total of 192 incidents were registered in 2017, compared to 129 in 2016,
Responsible area
Chart name:
Chart (update by right click on chart edit data edit data:
Updated by (initials):
Comments:
Source:
Updated date:
Chart 25 Norges Bank Real Estate Management’s GRESB score
CRO
CMW
February 12 2018
Figures to be verified by Pedro / CIO Europe.
Sustainability model: Master GRESB Model.xlsx (Desktop, Web, Mobile)
0
10
20
30
40
50
60
70
80
90
100
0
10
20
30
40
50
60
70
80
90
100
2013 2014 2015 2016 2017
Norges Bank Real Estate Management Peers
Chart 24 Global Real Estate Sustainability Benchmark (GRESB) score
which mainly reflects an increased focus on incident reporting. Most of the reported incidents had no direct financial consequences, either because they were discovered early or because they had only a non-financial impact. The estimated total financial loss of unwanted operational incidents in 2017 was 1.8 million kroner. There were no incidents which resulted in a financial gain. No significant incidents were reported in 2017.
COMPLIANCE No material breaches of the management mandate from the Ministry of Finance were registered in 2017. We did not receive any notifications from local supervisory authorities of any significant breaches of market rules or general legislation.
49
REAL ESTATE MANAGEMENT 3.2
ValuationsWe obtain external valuations and report the value of our real estate investments on a quarterly basis.
The value of a real estate portfolio is the sum of its assets and liabilities. The fair value is the estimated price that would have been obtained from the sale of a property or transfer of a liability between two market participants.
VALUING REAL ESTATE The value of a property before it is sold will always be subject to a degree of uncertainty, because real estate is an asset class with less frequent trading than listed equities and bonds. Having a diverse base of different valuers helps increase the quality of estimated values.
Valuations are performed in accordance with internationally recognised standards. We quality-assure the information on which valuers base their valuations.
VALUING DEBT At the end of 2017, the portfolio’s financial leverage was 7.5 percent, compared to 7.7 percent at the end of 2016. As with the properties themselves, debt is measured at fair value. Where there are no observable prices, debt is valued by external valuers or by using various relevant models.
VALUATION UNCERTAINTY Property valuations are based on forward-looking judgements. The estimates generally reflect comparable recent transactions for properties with similar characteristics.
These estimates of property values are particularly sensitive to changes in discount rates and assumptions that affect future income. The uncertainty can be measured by looking at the effect of changes in these variables. An increase in the discount rate of 0.2 percentage point and a decrease in expected rental income of 2.0 percent, will reduce the estimated value of the portfolio at the end of 2017 by around 6.0 percent, compared to 5.1 percent at the end of 2016. Similarly, a decrease in the discount rate of 0.2 percentage point and an increase in expected rental income of 2.0 percent will raise the estimated value by 6.9 percent, compared to 5.7 percent at the end of 2016.
We review the value of the investments at the end of each quarter. This includes documenting the results of controls and analyses, and presenting the most important sources of valuation uncertainty.
Income | Real estate investments 2017 | Government Pension Fund Global
50
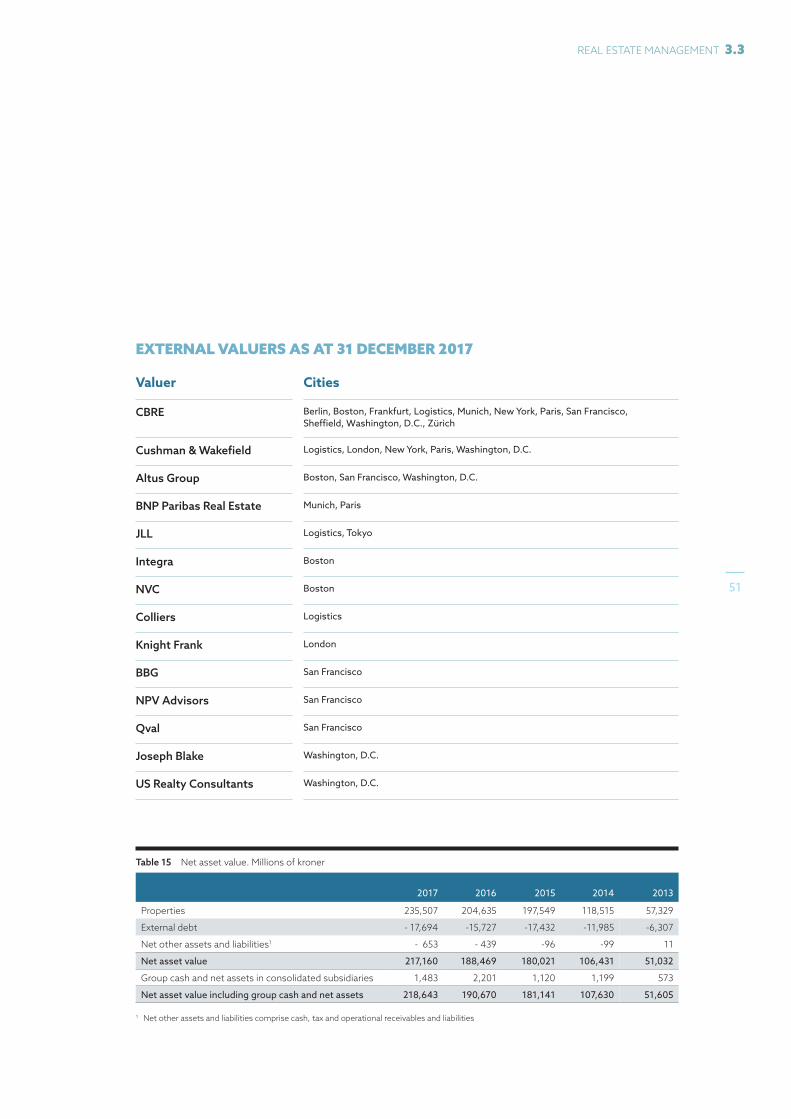
Table 15 Net asset value. Millions of kroner
2017 2016 2015 2014 2013
Properties 235,507 204,635 197,549 118,515 57,329
External debt - 17,694 -15,727 -17,432 -11,985 -6,307
Net other assets and liabilities1 - 653 - 439 -96 -99 11
Net asset value 217,160 188,469 180,021 106,431 51,032
Group cash and net assets in consolidated subsidiaries 1,483 2,201 1,120 1,199 573
Net asset value including group cash and net assets 218,643 190,670 181,141 107,630 51,605
1 Net other assets and liabilities comprise cash, tax and operational receivables and liabilities
EXTERNAL VALUERS AS AT 31 DECEMBER 2017
Valuer Cities
CBRE Berlin, Boston, Frankfurt, Logistics, Munich, New York, Paris, San Francisco, Sheffield, Washington, D.C., Zürich
Cushman & Wakefield Logistics, London, New York, Paris, Washington, D.C.
Altus Group Boston, San Francisco, Washington, D.C.
BNP Paribas Real Estate Munich, Paris
JLL Logistics, Tokyo
Integra Boston
NVC Boston
Colliers Logistics
Knight Frank London
BBG San Francisco
NPV Advisors San Francisco
Qval San Francisco
Joseph Blake Washington, D.C.
US Realty Consultants Washington, D.C.
51
REAL ESTATE MANAGEMENT 3.3
Net rental income amounted to 8,579 million kroner in 2017. This is an increase of 934 million kroner on 2016, due primarily to new investments.
The real estate portfolio has a diversified tenant base of 2,747 tenants in different industries in Europe, the US and Asia. In some cases, we own the land but not the building, in which case we only receive a ground rent.
In 2017, movements in exchange rates had only a limited impact on rental income in Norwegian kroner. The US dollar weakened 5.0 percent against the Norwegian krone, whereas the euro and the British pound strengthened by 8.2 and 4.0 percent respectively.
IncomeThe fund receives a stable rental income from tenants.
Organisation | Real estate investments 2017 | Government Pension Fund Global
52
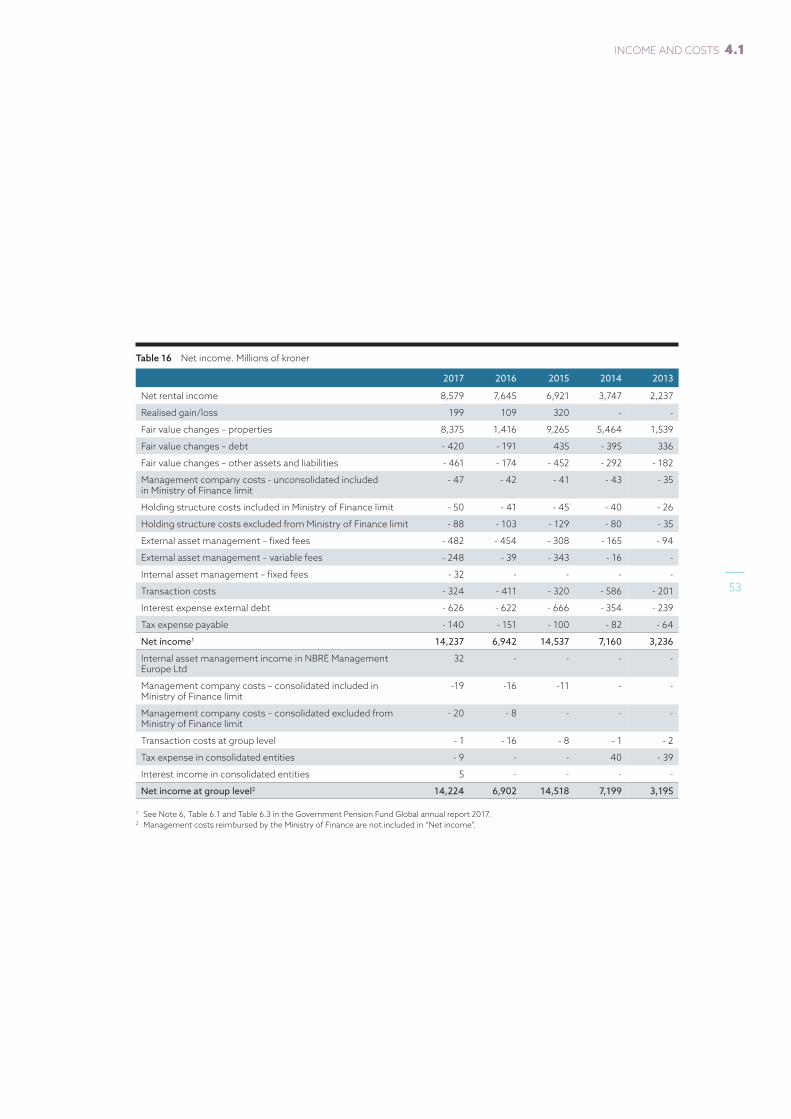
Table 16 Net income. Millions of kroner
2017 2016 2015 2014 2013
Net rental income 8,579 7,645 6,921 3,747 2,237
Realised gain/loss 199 109 320 - -
Fair value changes – properties 8,375 1,416 9,265 5,464 1,539
Fair value changes – debt - 420 - 191 435 - 395 336
Fair value changes – other assets and liabilities - 461 - 174 - 452 - 292 - 182
Management company costs - unconsolidated included in Ministry of Finance limit
- 47 - 42 - 41 - 43 - 35
Holding structure costs included in Ministry of Finance limit - 50 - 41 - 45 - 40 - 26
Holding structure costs excluded from Ministry of Finance limit - 88 - 103 - 129 - 80 - 35
External asset management – fixed fees - 482 - 454 - 308 - 165 - 94
External asset management – variable fees - 248 - 39 - 343 - 16 -
Internal asset management – fixed fees - 32 - - - -
Transaction costs - 324 - 411 - 320 - 586 - 201
Interest expense external debt - 626 - 622 - 666 - 354 - 239
Tax expense payable - 140 - 151 - 100 - 82 - 64
Net income1 14,237 6,942 14,537 7,160 3,236
Internal asset management income in NBRE Management Europe Ltd
32 - - - -
Management company costs – consolidated included in Ministry of Finance limit
-19 -16 -11 - -
Management company costs – consolidated excluded from Ministry of Finance limit
- 20 - 8 - - -
Transaction costs at group level - 1 - 16 - 8 - 1 - 2
Tax expense in consolidated entities - 9 - - 40 - 39
Interest income in consolidated entities 5 - - - -
Net income at group level2 14,224 6,902 14,518 7,199 3,195
1 See Note 6, Table 6.1 and Table 6.3 in the Government Pension Fund Global annual report 2017.2 Management costs reimbursed by the Ministry of Finance are not included in “Net income”.
53
INCOME AND COSTS 4.1

MANAGEMENT COSTS
OTHER COSTS
PurposeEnsure an organisation that can contribute to a highest possible return on the fund’s real estate investments, by finding investment opportunities, completing transactions and following up on existing investments.
CostsPersonnel costs, IT services,legal fees and consulting fees.
INVESTMENT MANAGEMENT COSTS
PurposeSafeguard the fund’s financial interests. Risk management and limitation of liability.
CostsAudit fees, accounting services, IT services, legal fees and board remuneration.
HOLDING STRUCTURE COSTS
PurposeEnsure the highest possible rental income and return on investments by continuous asset management.
CostsFixed fees to asset managers. Variable fees to asset managers.
ASSET MANAGEMENT COSTS
PurposeEnsure net rental income from tenants.
CostsMaintenance, letting, cleaning, electricity, insurance, health and safety, security, caretaking, billing and day-to-day tenant services.
PROPERTY COSTS
PurposeEnsure transfer of ownership, and thorough due diligence to mitigate risks.
CostsStamp duty and other taxes, and cost of due diligence.
TRANSACTION COSTS
Costs for external loans.
INTEREST COSTS
Costs to local tax authorities.
TAX COSTS
Organisation | Real estate investments 2017 | Government Pension Fund Global
54
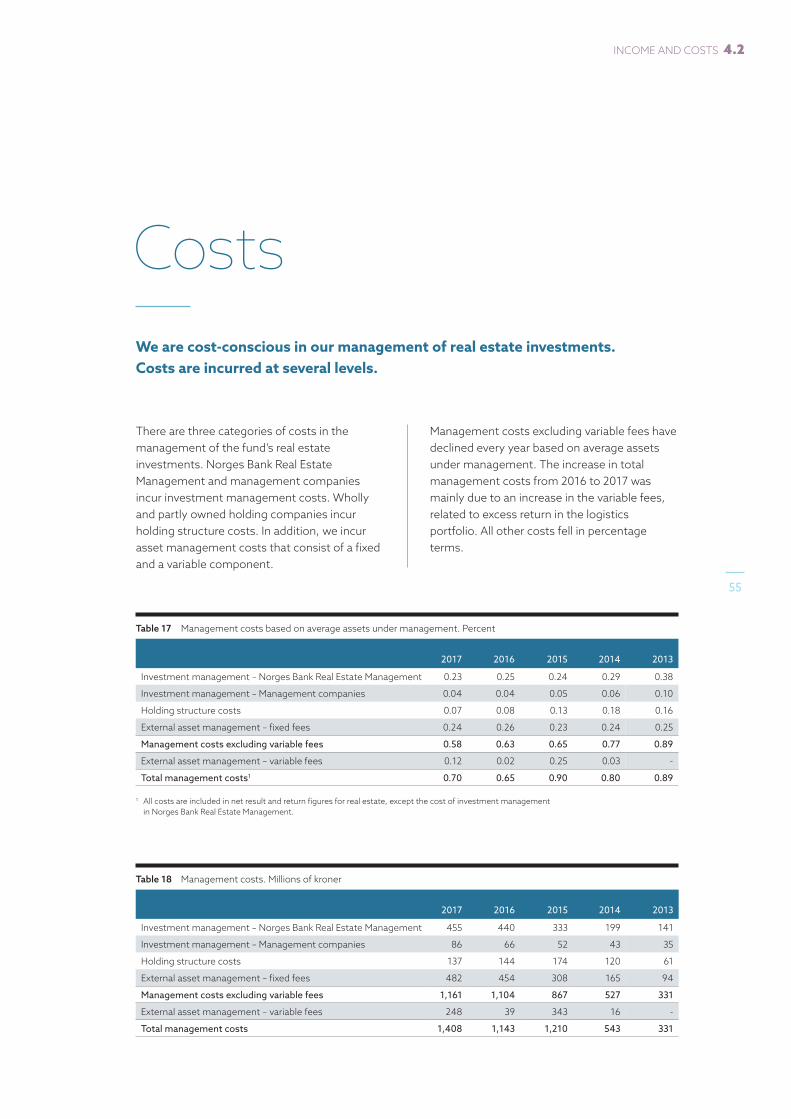
CostsWe are cost-conscious in our management of real estate investments. Costs are incurred at several levels.
There are three categories of costs in the management of the fund’s real estate investments. Norges Bank Real Estate Management and management companies incur investment management costs. Wholly and partly owned holding companies incur holding structure costs. In addition, we incur asset management costs that consist of a fixed and a variable component.
Management costs excluding variable fees have declined every year based on average assets under management. The increase in total management costs from 2016 to 2017 was mainly due to an increase in the variable fees, related to excess return in the logistics portfolio. All other costs fell in percentage terms.
Table 17 Management costs based on average assets under management. Percent
2017 2016 2015 2014 2013
Investment management – Norges Bank Real Estate Management 0.23 0.25 0.24 0.29 0.38
Investment management – Management companies 0.04 0.04 0.05 0.06 0.10
Holding structure costs 0.07 0.08 0.13 0.18 0.16
External asset management – fixed fees 0.24 0.26 0.23 0.24 0.25
Management costs excluding variable fees 0.58 0.63 0.65 0.77 0.89
External asset management – variable fees 0.12 0.02 0.25 0.03 -
Total management costs1 0.70 0.65 0.90 0.80 0.89
1 All costs are included in net result and return figures for real estate, except the cost of investment management in Norges Bank Real Estate Management.
Table 18 Management costs. Millions of kroner
2017 2016 2015 2014 2013
Investment management – Norges Bank Real Estate Management 455 440 333 199 141
Investment management – Management companies 86 66 52 43 35
Holding structure costs 137 144 174 120 61
External asset management – fixed fees 482 454 308 165 94
Management costs excluding variable fees 1,161 1,104 867 527 331
External asset management – variable fees 248 39 343 16 -
Total management costs 1,408 1,143 1,210 543 331
55
INCOME AND COSTS 4.2
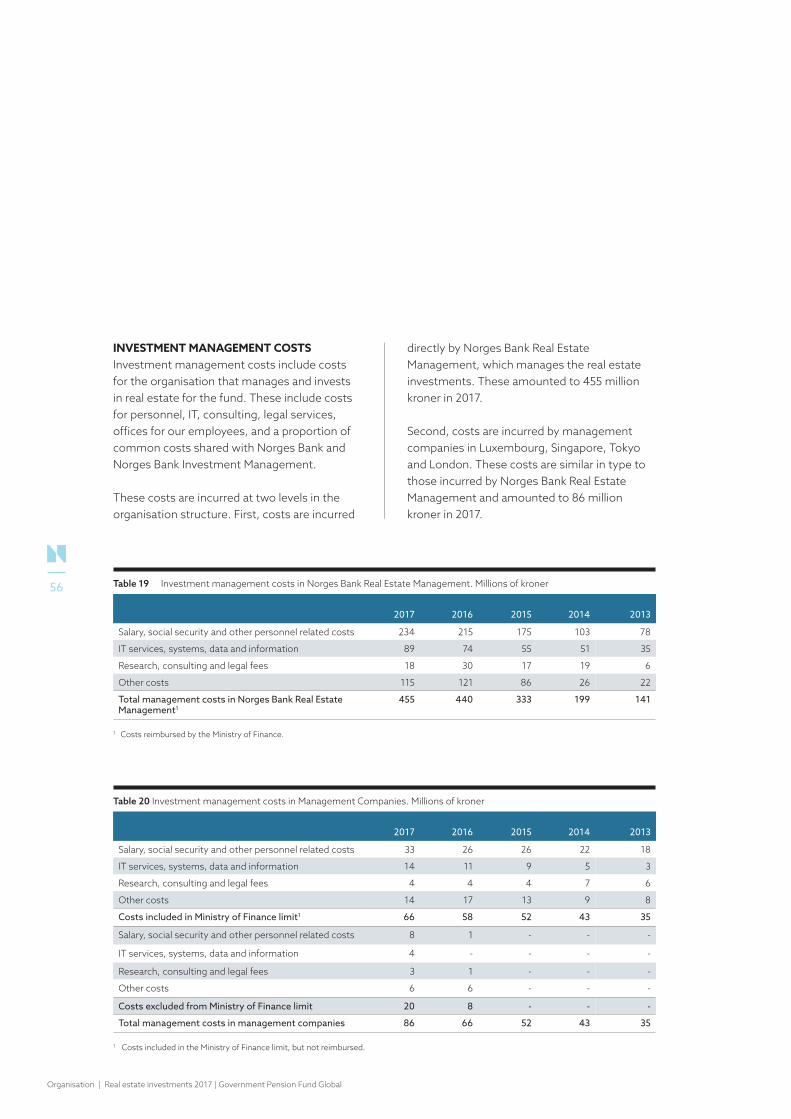
INVESTMENT MANAGEMENT COSTS Investment management costs include costs for the organisation that manages and invests in real estate for the fund. These include costs for personnel, IT, consulting, legal services, offices for our employees, and a proportion of common costs shared with Norges Bank and Norges Bank Investment Management.
These costs are incurred at two levels in the organisation structure. First, costs are incurred
directly by Norges Bank Real Estate Management, which manages the real estate investments. These amounted to 455 million kroner in 2017.
Second, costs are incurred by management companies in Luxembourg, Singapore, Tokyo and London. These costs are similar in type to those incurred by Norges Bank Real Estate Management and amounted to 86 million kroner in 2017.
Table 19 Investment management costs in Norges Bank Real Estate Management. Millions of kroner
2017 2016 2015 2014 2013
Salary, social security and other personnel related costs 234 215 175 103 78
IT services, systems, data and information 89 74 55 51 35
Research, consulting and legal fees 18 30 17 19 6
Other costs 115 121 86 26 22
Total management costs in Norges Bank Real Estate Management1
455 440 333 199 141
1 Costs reimbursed by the Ministry of Finance.
Table 20 Investment management costs in Management Companies. Millions of kroner
2017 2016 2015 2014 2013
Salary, social security and other personnel related costs 33 26 26 22 18
IT services, systems, data and information 14 11 9 5 3
Research, consulting and legal fees 4 4 4 7 6
Other costs 14 17 13 9 8
Costs included in Ministry of Finance limit1 66 58 52 43 35
Salary, social security and other personnel related costs 8 1 - - -
IT services, systems, data and information 4 - - - -
Research, consulting and legal fees 3 1 - - -
Other costs 6 6 - - -
Costs excluded from Ministry of Finance limit 20 8 - - -
Total management costs in management companies 86 66 52 43 35
1 Costs included in the Ministry of Finance limit, but not reimbursed.
Organisation | Real estate investments 2017 | Government Pension Fund Global
56
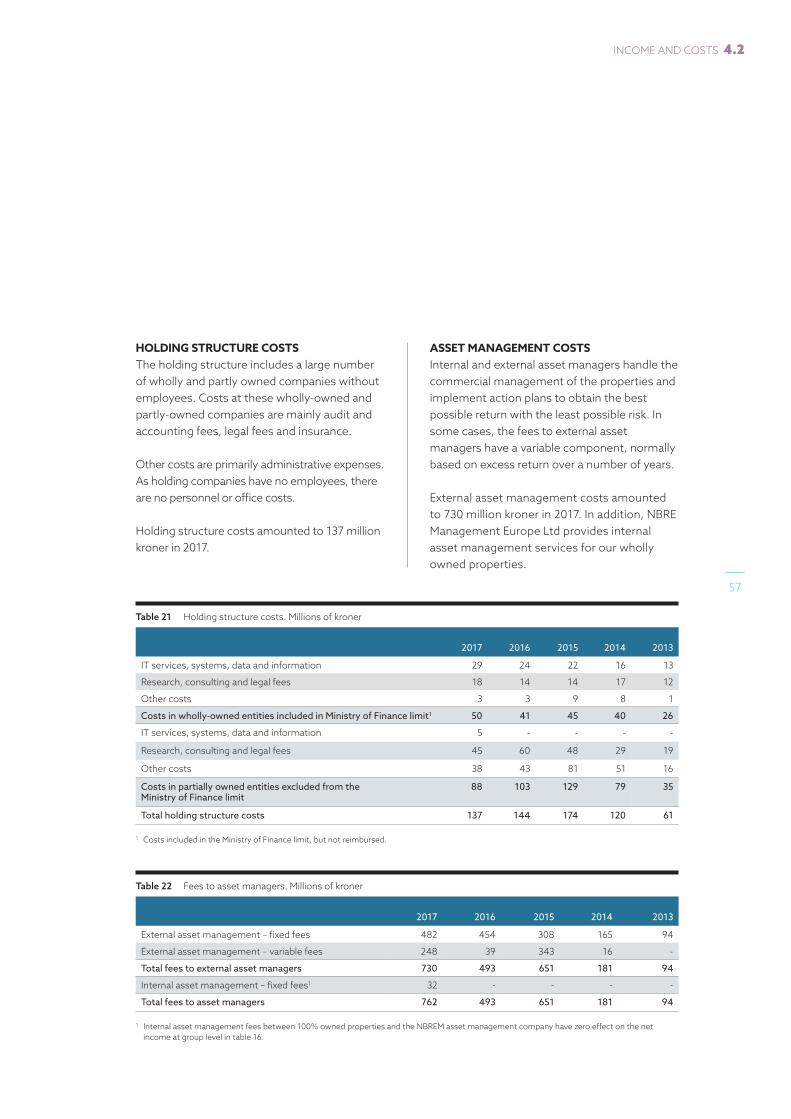
HOLDING STRUCTURE COSTS The holding structure includes a large number of wholly and partly owned companies without employees. Costs at these wholly-owned andpartly-owned companies are mainly audit and accounting fees, legal fees and insurance.
Other costs are primarily administrative expenses. As holding companies have no employees, there are no personnel or office costs.
Holding structure costs amounted to 137 million kroner in 2017.
ASSET MANAGEMENT COSTS Internal and external asset managers handle the commercial management of the properties and implement action plans to obtain the best possible return with the least possible risk. In some cases, the fees to external asset managers have a variable component, normally based on excess return over a number of years.
External asset management costs amounted to 730 million kroner in 2017. In addition, NBRE Management Europe Ltd provides internal asset management services for our wholly owned properties.
Table 21 Holding structure costs. Millions of kroner
2017 2016 2015 2014 2013
IT services, systems, data and information 29 24 22 16 13
Research, consulting and legal fees 18 14 14 17 12
Other costs 3 3 9 8 1
Costs in wholly-owned entities included in Ministry of Finance limit1 50 41 45 40 26
IT services, systems, data and information 5 - - - -
Research, consulting and legal fees 45 60 48 29 19
Other costs 38 43 81 51 16
Costs in partially owned entities excluded from theMinistry of Finance limit
88 103 129 79 35
Total holding structure costs 137 144 174 120 61
1 Costs included in the Ministry of Finance limit, but not reimbursed.
Table 22 Fees to asset managers. Millions of kroner
2017 2016 2015 2014 2013
External asset management – fixed fees 482 454 308 165 94
External asset management – variable fees 248 39 343 16 -
Total fees to external asset managers 730 493 651 181 94
Internal asset management – fixed fees1 32 - - - -
Total fees to asset managers 762 493 651 181 94
1 Internal asset management fees between 100% owned properties and the NBREM asset management company have zero effect on the net income at group level in table 16.
57
INCOME AND COSTS 4.2
PROPERTY COSTS Costs for the day-to-day operation and maintenance of the buildings in the portfolio are incurred by the property companies that own the buildings and are therefore not directly related to investment activities. These costs include activities relating to letting, cleaning, electricity, insurance, health and safety, security, caretaking, billing and day-to-day tenant services. A significant amount of the operating costs is reimbursed by tenants. Sometimes operating costs are met by the tenant directly. In cases where we own the land but not the building itself, we do not incur operating costs for the building.
Property management costs amounted to 2,966 million kroner in 2017 before reimbursement of 1,601 million kroner by tenants.
TAX COSTS The fund’s tax position depends on local regulations and on the tax treaties with each country. Taxes on real estate investments totalled 149 million kroner in 2017, which include 9 million kroner in management companies.
INTEREST COSTS Our investments are financed mainly with equity and intercompany loans. Some investments, however, also involve external debt. External interest costs amounted to 626 million kroner in 2017.
TRANSACTION COSTS Transaction costs are incurred when buying and selling properties. They include stamp duty and other taxes and fees to the local authorities. These costs can vary considerably and amounted to 217 million kroner in 2017.
Costs are also incurred for the due diligence reviews that precede an investment. These are carried out to mitigate risks in line with the management mandate and include analyses of market, liquidity, credit, counterparty, operational, legal, tax, technical and environmental risks. These costs are relatively stable in percentage terms for each new investment and totalled 107 million kroner in 2017.
Transaction costs for uncompleted deals are expensed at group level when a subsidiary is not established. These costs came to 1 million kroner in 2017. Total transaction costs amounted to 325 million kroner in 2017.
Organisation | Real estate investments 2017 | Government Pension Fund Global
58
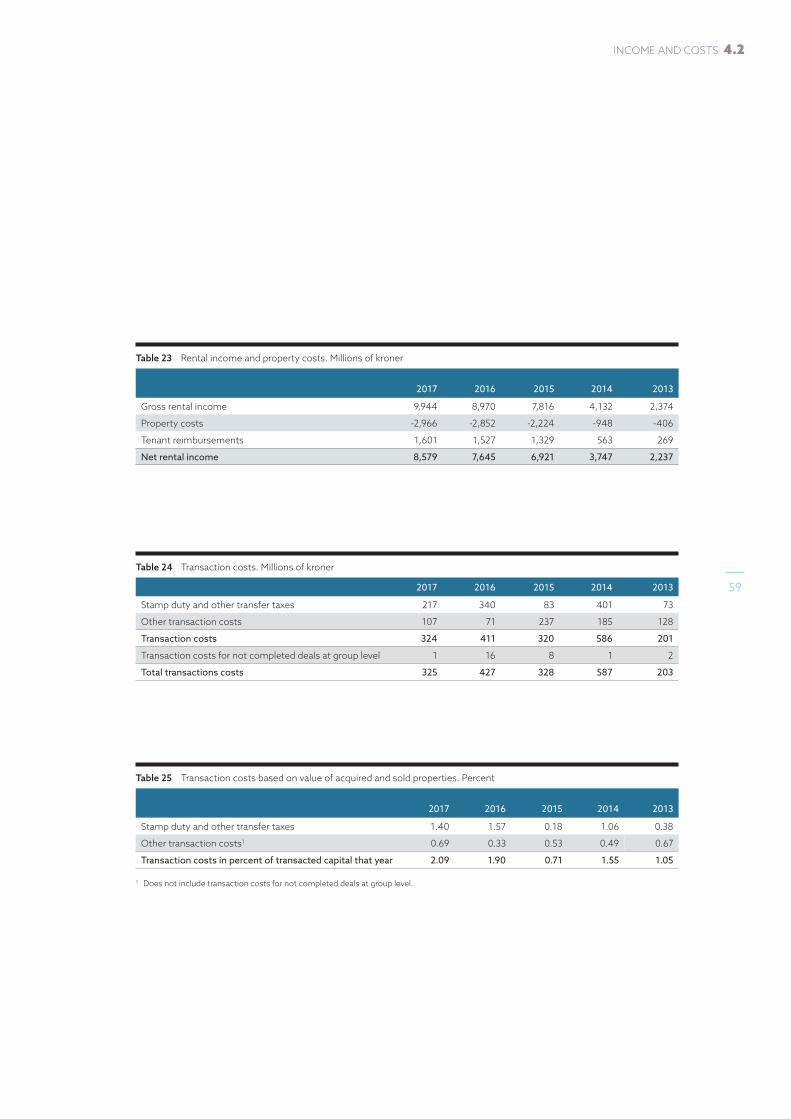
Table 23 Rental income and property costs. Millions of kroner
2017 2016 2015 2014 2013
Gross rental income 9,944 8,970 7,816 4,132 2,374
Property costs -2,966 -2,852 -2,224 -948 -406
Tenant reimbursements 1,601 1,527 1,329 563 269
Net rental income 8,579 7,645 6,921 3,747 2,237
Table 24 Transaction costs. Millions of kroner
2017 2016 2015 2014 2013
Stamp duty and other transfer taxes 217 340 83 401 73
Other transaction costs 107 71 237 185 128
Transaction costs 324 411 320 586 201
Transaction costs for not completed deals at group level 1 16 8 1 2
Total transactions costs 325 427 328 587 203
Table 25 Transaction costs based on value of acquired and sold properties. Percent
2017 2016 2015 2014 2013
Stamp duty and other transfer taxes 1.40 1.57 0.18 1.06 0.38
Other transaction costs1 0.69 0.33 0.53 0.49 0.67
Transaction costs in percent of transacted capital that year 2.09 1.90 0.71 1.55 1.05
1 Does not include transaction costs for not completed deals at group level.
59
INCOME AND COSTS 4.2
New real estate investments amounted to 14,771 million kroner. In addition, 5,167 million kroner was used to repay external debt and to finance property upgrades. Total cash holdings relating to unlisted real estate in the fund decreased by 668 million kroner in 2017.
Norges Bank Real Estate Management invests through subsidiaries and underlying property companies. The subsidiaries are financed with equity and intercompany loans. Cash generated at the property companies in the form of net rental income is distributed to the fund in the form of dividends, interest on intercompany loans, or repayments of intercompany loans and equity.
The dividends paid to the fund and interest on intercompany loans are less than net rental income at the underlying companies that own the properties. The remaining income covers costs in the holding structure, is used to repay external debt or is reinvested, for example in upgrading buildings.
The cash flow from rental income at the underlying property companies amounted to 8,195 million kroner in 2017. The subsidiaries’ total cash holdings increased by 854 million kroner.
Cash flowNet transfers from the fund’s fixed-income and equity investments to the fund’s real estate investments amounted to 12,720 million kroner in 2017. The subsidiaries repaid 4,756 million kroner from operational activities and 1,816 million kroner from property sales and drawdown of external debt.
Organisation | Real estate investments 2017 | Government Pension Fund Global
60
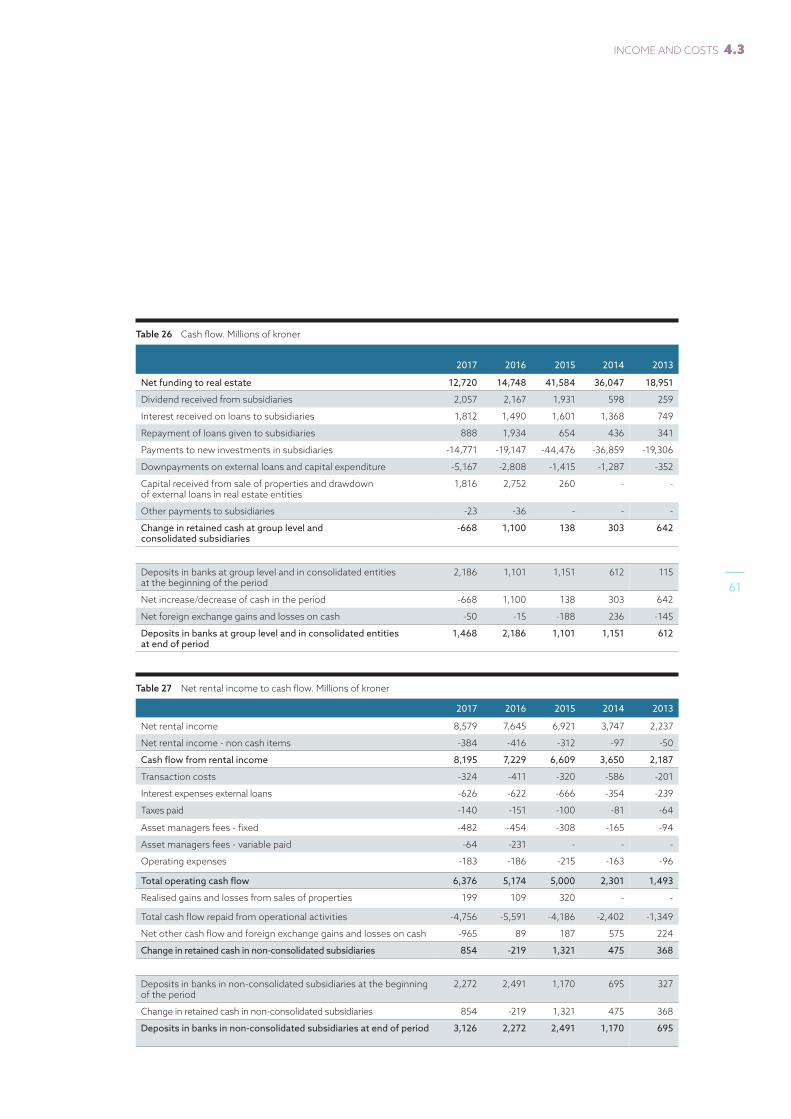
Table 26 Cash flow. Millions of kroner
2017 2016 2015 2014 2013
Net funding to real estate 12,720 14,748 41,584 36,047 18,951
Dividend received from subsidiaries 2,057 2,167 1,931 598 259
Interest received on loans to subsidiaries 1,812 1,490 1,601 1,368 749
Repayment of loans given to subsidiaries 888 1,934 654 436 341
Payments to new investments in subsidiaries -14,771 -19,147 -44,476 -36,859 -19,306
Downpayments on external loans and capital expenditure -5,167 -2,808 -1,415 -1,287 -352
Capital received from sale of properties and drawdown of external loans in real estate entities
1,816 2,752 260 - -
Other payments to subsidiaries -23 -36 - - -
Change in retained cash at group level and consolidated subsidiaries
-668 1,100 138 303 642
Deposits in banks at group level and in consolidated entities at the beginning of the period
2,186 1,101 1,151 612 115
Net increase/decrease of cash in the period -668 1,100 138 303 642
Net foreign exchange gains and losses on cash -50 -15 -188 236 -145
Deposits in banks at group level and in consolidated entities at end of period
1,468 2,186 1,101 1,151 612
Table 27 Net rental income to cash flow. Millions of kroner
2017 2016 2015 2014 2013
Net rental income 8,579 7,645 6,921 3,747 2,237
Net rental income - non cash items -384 -416 -312 -97 -50
Cash flow from rental income 8,195 7,229 6,609 3,650 2,187
Transaction costs -324 -411 -320 -586 -201
Interest expenses external loans -626 -622 -666 -354 -239
Taxes paid -140 -151 -100 -81 -64
Asset managers fees - fixed -482 -454 -308 -165 -94
Asset managers fees - variable paid -64 -231 - - -
Operating expenses -183 -186 -215 -163 -96
Total operating cash flow 6,376 5,174 5,000 2,301 1,493
Realised gains and losses from sales of properties 199 109 320 - -
Total cash flow repaid from operational activities -4,756 -5,591 -4,186 -2,402 -1,349
Net other cash flow and foreign exchange gains and losses on cash -965 89 187 575 224
Change in retained cash in non-consolidated subsidiaries 854 -219 1,321 475 368
Deposits in banks in non-consolidated subsidiaries at the beginning of the period
2,272 2,491 1,170 695 327
Change in retained cash in non-consolidated subsidiaries 854 -219 1,321 475 368
Deposits in banks in non-consolidated subsidiaries at end of period 3,126 2,272 2,491 1,170 695
61
INCOME AND COSTS 4.3

Real estate investments 2017 | Government Pension Fund Global
62

63


ISSN 2464-3351 | Design: Scandinavian Design Group Photos: Norges Bank Investment Management,
Tomoaki Nozawa/EyeEm/NTB, Hans Fredrik Asbjørnsen, Offset, Shutterstock, Rieger Bertrand/Hemis.fr,
Buyenlarge/GettyImages, Alamy Paper: Galerie Art Silk 300 g / Matt 150 g
Production: 07 Media AS | Print run: 1,000

NORGES BANK REAL ESTATE MANAGEMENTBankplassen 2, P.O. Box 1179 Sentrum, NO-0107 Oslo, Norway
T: +47 24 07 30 00, www.nbim.no