Embed Size (px)
Citation preview

Remote Sensing of Environment 113 (2009) S67–S77
Contents lists available at ScienceDirect
Remote Sensing of Environment
j ourna l homepage: www.e lsev ie r.com/ locate / rse
Retrieval of foliar information about plant pigment systems from highresolution spectroscopy
Susan L. Ustin a,⁎, A.A. Gitelson b, Stéphane Jacquemoud c, Michael Schaepman d, Gregory P. Asner e,John A. Gamon f, Pablo Zarco-Tejada g
a Center for Spatial Technologies and Remote Sensing, Department of Land, Air, and Water Resources, University of California, Davis 95616, USAb CALMIT, School of Natural Resources, University of Nebraska-Lincoln, 303 Hardin Hall, 3310 Holdrege Lincoln, NE 68583-0973, USAc Institut de Physique du Globe de Paris, Université Paris Diderot & Institut de Physique du Globe de Paris, Géophysique spatiale et planétaire - Bâtiment Lamarck Case 7011,35 rue Hélène Brion 75013 Paris, Franced Center for Geo-Information, Wageningen University, 6700AA Wageningen, The Netherlandse Department of Global Ecology, Carnegie Institution of Science, 260 Panama Street, Stanford, CA 94305, USAf California State University Los Angeles, CA, USAg Instituto de Agricultura Sostenible (IAS), Consejo Superior de Investigaciones Científicas (CSIC), Spain
⁎ Corresponding author. Tel.: +1 530 752 0621.E-mail addresses: [email protected] (S.L. Ustin), a
(A.A. Gitelson), [email protected] (S. Jacquemoud), m(M. Schaepman), [email protected] (G.P. Asner), [email protected] (P. Zarco-Tejada).
0034-4257/$ – see front matter © 2009 Published by Edoi:10.1016/j.rse.2008.10.019
a b s t r a c t
a r t i c l e i n f oArticle history:Received 17 November 2007Received in revised form 6 October 2008Accepted 8 October 2008
Keywords:Plant pigmentsChlorophyll a, bCarotenesXanthophyll pigmentsAnthocyanin pigmentsAbsorption featuresSpectral measures of pigmentsSpectroscopy
Life on Earth depends on photosynthesis. Photosynthetic systems evolved early in Earth history and havebeen stable for 2.5 billion years, providing prima facie evidence for the significance of pigments in plantfunctions. Photosynthetic pigments fill multiple roles from increasing the range of energy captured forphotosynthesis to protective functions. Given the importance of pigments to leaf functioning, greater effort isneeded to determine whether individual pigments can be identified and quantified in vivo using high fidelityspectroscopy. We review recent advances in detecting plant pigments at the leaf level and discuss successesand reasons why challenges remain for robust remote observation and quantification. New methods toidentify and quantify individual pigments in the presence of overlapping absorption features would provide amajor advance in understanding their biological functions, quantifying net carbon exchange, and identifyingplant stresses.
© 2009 Published by Elsevier Inc.
1. Introduction
Life on Earth is driven by photosynthesis, producing both oxygenand organic matter (Nelson & Yocum, 2006). Photosynthesis is one ofthe earliest biological processes to evolve and the pigment systems inmodern photosynthetic bacteria, algae, and higher plants appeared atleast 2.5 billion years ago (Olson & Blankenship, 2004; Kiang et al.,2007). Photosynthetic pigments including chlorophylls a, b, andseveral carotenoid pigments date from this period. The length andstability of this record, and the various roles of pigments inphotosynthesis, protection and defense, demonstrate the functionalimportance of their composition, associated protein complexes, andchloroplast structure. Their significance for life on Earth provides therationale for improving our capability to remotely measure them.Furthermore, the stability of chlorophyll molecules makes them a
[email protected]@[email protected] (J.A. Gamon),
lsevier Inc.
target, along with water, in the search for extraterrestrial life (Arnoldet al., 2002; Wolstencroft & Raven, 2002; Seager et al., 2005). Therange of characteristic reflectance patterns varies among differenttaxonomic groups of photosynthetic organisms in the visible andnear-infrared spectrum as illustrated in Fig. 1 (Kiang et al., 2007).Although terrestrial and aquatic plants and mosses share a commonphotosynthetic apparatus, in contrast to some algae, lichens, andbacteria, reflectance differences among different taxa exist across therange of wavelengths that relate to both structure and biochemistry.
Developingmethods to quantify pigment content and compositionfrom remotely sensed data would clearly provide a capability thatcould advance understanding of photosynthetic processes (e.g., lightregulation, photooxidation, chlorophyll fluorescence) and provideinsight into detection and monitoring of foliar condition (e.g., envi-ronmental stressors). This review provides a brief summary of themajor plant pigments and their ecophysiological functions and themost widely used spectroscopic methods for retrieving informationfrom high spectral resolution remote sensing. This paper is dedicatedto Professor Alexander F.H. Goetz, who led a major investigation intothe potential for measuring plant biochemistry from narrow-bandimaging spectrometry in the early 1990s. This activity stimulated

Fig. 1. Characteristic reflectance patterns among major groups of photosynthetic organisms in the visible and near-infrared spectrum. The oxygen absorption band, included forreference, is the vertical bar at 761 nm on the near-infrared plateau, shorter wavelength bars indicate the primary chlorophyll band at 680 nm and the region of the red-edgeinflection point (reproduced from Kiang et al., 2007).
S68 S.L. Ustin et al. / Remote Sensing of Environment 113 (2009) S67–S77
international research in the detection of plant biochemicals andmany advances in measuring leaf pigments from reflectance dataoriginate from this effort. To narrow the scope of this review, we focusprimarily on reflectance measurements, at the leaf level, emphasizingadvances in the past 15–20 years, and examining two types of quan-titative approaches: (1) empirical methods and (2) physically basedradiative transfer models and quantitative methods.
2. Photosynthesis and other functions of leaf pigments
Absorption of light in the visible spectrum by plant pigmentsproduces a unique spectral reflectance signature. Light is capturedby the process of photosynthesis (Govindjee & Krogmann, 2004) andthe light energy is stored as carbohydrate, through a series of electrontransfers that occur on the thylakoid membranes in chloroplasts. Inthe intact chloroplast, pigment–protein complexes are organizedinto two photosystems that harvest light and transfer energy tothe reaction centers. Besides chlorophyll a and b, the photosyntheticantenna (the organized association of pigments that capture photonsand transfer energy to the reaction centers) contain other mem-
brane-bound accessory pigments that include β-carotene, lutein andxanthophyll cycle pigments (Lichtenthaler, 1987). Fig. 2 shows theabsorption spectra of chlorophyll a and b and β-carotene. Accessorypigments increase the spectrum over which light can be absorbedand also perform other functions, not all of which are fullyunderstood, but which alter the efficiency of photon capture and/or provide protective and defensive functions, e.g., avoiding damageto the reaction centers under excess UV light or freezing tempera-tures. For example, under high illumination conditions, lightintensity may exceed the capacity for electron transfer between thephotosystems and some carotenoid pigments, such as xanthophylls,are involved with protection from photooxidation and photoinhibi-tion (Demmig-Adams & Adams, 1996) and with release of excesssolar energy through leaf fluorescence.
3. Measuring the absorption spectra of foliar pigments from highresolution spectroscopy
One factor that has limited our ability to quantify individualpigments from reflectance data is that we do not precisely know their
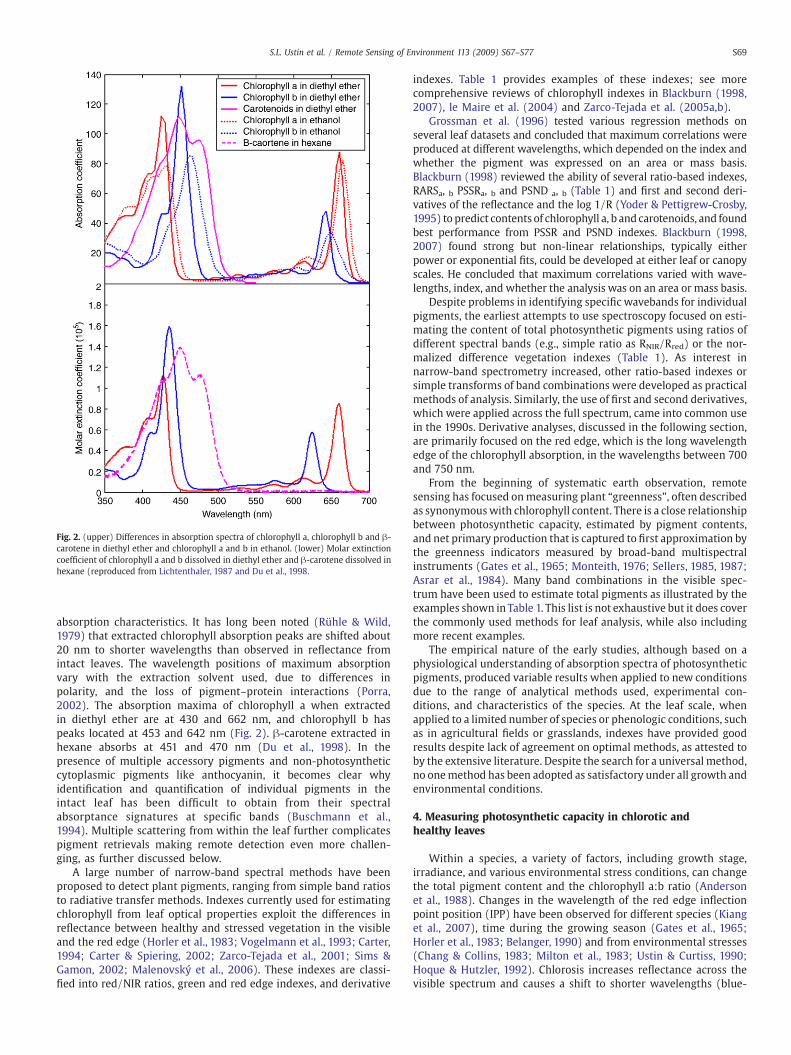
Fig. 2. (upper) Differences in absorption spectra of chlorophyll a, chlorophyll b and β-carotene in diethyl ether and chlorophyll a and b in ethanol. (lower) Molar extinctioncoefficient of chlorophyll a and b dissolved in diethyl ether and β-carotene dissolved inhexane (reproduced from Lichtenthaler, 1987 and Du et al., 1998.
S69S.L. Ustin et al. / Remote Sensing of Environment 113 (2009) S67–S77
absorption characteristics. It has long been noted (Rühle & Wild,1979) that extracted chlorophyll absorption peaks are shifted about20 nm to shorter wavelengths than observed in reflectance fromintact leaves. The wavelength positions of maximum absorptionvary with the extraction solvent used, due to differences inpolarity, and the loss of pigment–protein interactions (Porra,2002). The absorption maxima of chlorophyll a when extractedin diethyl ether are at 430 and 662 nm, and chlorophyll b haspeaks located at 453 and 642 nm (Fig. 2). β-carotene extracted inhexane absorbs at 451 and 470 nm (Du et al., 1998). In thepresence of multiple accessory pigments and non-photosyntheticcytoplasmic pigments like anthocyanin, it becomes clear whyidentification and quantification of individual pigments in theintact leaf has been difficult to obtain from their spectralabsorptance signatures at specific bands (Buschmann et al.,1994). Multiple scattering from within the leaf further complicatespigment retrievals making remote detection even more challen-ging, as further discussed below.
A large number of narrow-band spectral methods have beenproposed to detect plant pigments, ranging from simple band ratiosto radiative transfer methods. Indexes currently used for estimatingchlorophyll from leaf optical properties exploit the differences inreflectance between healthy and stressed vegetation in the visibleand the red edge (Horler et al., 1983; Vogelmann et al., 1993; Carter,1994; Carter & Spiering, 2002; Zarco-Tejada et al., 2001; Sims &Gamon, 2002; Malenovský et al., 2006). These indexes are classi-fied into red/NIR ratios, green and red edge indexes, and derivative
indexes. Table 1 provides examples of these indexes; see morecomprehensive reviews of chlorophyll indexes in Blackburn (1998,2007), le Maire et al. (2004) and Zarco-Tejada et al. (2005a,b).
Grossman et al. (1996) tested various regression methods onseveral leaf datasets and concluded that maximum correlations wereproduced at different wavelengths, which depended on the index andwhether the pigment was expressed on an area or mass basis.Blackburn (1998) reviewed the ability of several ratio-based indexes,RARSa, b PSSRa, b and PSND a, b (Table 1) and first and second deri-vatives of the reflectance and the log 1/R (Yoder & Pettigrew-Crosby,1995) to predict contents of chlorophyll a, b and carotenoids, and foundbest performance from PSSR and PSND indexes. Blackburn (1998,2007) found strong but non-linear relationships, typically eitherpower or exponential fits, could be developed at either leaf or canopyscales. He concluded that maximum correlations varied with wave-lengths, index, and whether the analysis was on an area or mass basis.
Despite problems in identifying specific wavebands for individualpigments, the earliest attempts to use spectroscopy focused on esti-mating the content of total photosynthetic pigments using ratios ofdifferent spectral bands (e.g., simple ratio as RNIR/Rred) or the nor-malized difference vegetation indexes (Table 1). As interest innarrow-band spectrometry increased, other ratio-based indexes orsimple transforms of band combinations were developed as practicalmethods of analysis. Similarly, the use of first and second derivatives,which were applied across the full spectrum, came into common usein the 1990s. Derivative analyses, discussed in the following section,are primarily focused on the red edge, which is the long wavelengthedge of the chlorophyll absorption, in the wavelengths between 700and 750 nm.
From the beginning of systematic earth observation, remotesensing has focused onmeasuring plant “greenness”, often describedas synonymouswith chlorophyll content. There is a close relationshipbetween photosynthetic capacity, estimated by pigment contents,and net primary production that is captured to first approximation bythe greenness indicators measured by broad-band multispectralinstruments (Gates et al., 1965; Monteith, 1976; Sellers, 1985, 1987;Asrar et al., 1984). Many band combinations in the visible spec-trum have been used to estimate total pigments as illustrated by theexamples shown in Table 1. This list is not exhaustive but it does coverthe commonly used methods for leaf analysis, while also includingmore recent examples.
The empirical nature of the early studies, although based on aphysiological understanding of absorption spectra of photosyntheticpigments, produced variable results when applied to new conditionsdue to the range of analytical methods used, experimental con-ditions, and characteristics of the species. At the leaf scale, whenapplied to a limited number of species or phenologic conditions, suchas in agricultural fields or grasslands, indexes have provided goodresults despite lack of agreement on optimal methods, as attested toby the extensive literature. Despite the search for a universal method,no onemethod has been adopted as satisfactory under all growth andenvironmental conditions.
4. Measuring photosynthetic capacity in chlorotic andhealthy leaves
Within a species, a variety of factors, including growth stage,irradiance, and various environmental stress conditions, can changethe total pigment content and the chlorophyll a:b ratio (Andersonet al., 1988). Changes in the wavelength of the red edge inflectionpoint position (IPP) have been observed for different species (Kianget al., 2007), time during the growing season (Gates et al., 1965;Horler et al., 1983; Belanger, 1990) and from environmental stresses(Chang & Collins, 1983; Milton et al., 1983; Ustin & Curtiss, 1990;Hoque & Hutzler, 1992). Chlorosis increases reflectance across thevisible spectrum and causes a shift to shorter wavelengths (blue-
Table 1Spectral indexes developed as chlorophyll indicators.
Index Short Formula Source
Single wavelengthsReciprocal Reflectance RR R700
−1 Gitelson et al. (1999)Logarithm of ReciprocalReflectance
LRR Log R737−1 Yoder and Pettigrew-Crosby (1995)
Combinations of wavelengthsWaveband Ratios Ratios RNIR/RB, RNIR/RG, RNIR/RR, RNIR/RRE, RB/RG,
RB/RR, RR/RGAoki et al. (1980, 1986), Vogelmann et al. (1993), Carter (1994), Gitelson and Merzlyak(1994, 1996, 1997), Datt (1998), Maccioni et al. (2001), Sims and Gamon (2002)
Modified Red-edge Ratio mSR mSR=(R750−R445)/(R705−R445) Sims and Gamon (2002)Pigment Specific Simple Ratio PSSR PSSRa=R800/R675 Blackburn (1998, 1999), Sims and Gamon (2002)
PSSRb=R800/R650Ratio Analysis of ReflectanceSpectra
RARS RARSa=R675/R700 Chappelle et al. (1992), Blackburn (1999)RARSb=R675/(R650×R700)
Normalized Difference VegetationIndex
NDVI NDVi=(RNIR−RR)/(RNIR+RR) Deering (1978), Datt (1998)
Red-edge NDVI mNDVI mNDVI=(R750−R705)/(R750+R705) Gitelson and Merzlyak (1994), Gamon and Surfus (1999), Datt (1999), Simsand Gamon (2002))
Modified Red-edge NormalizedDifference Vegetation Index
mNDI mNDVI=(R750−R705)/(R750+R705−2R445) Sims and Gamon (2002)
Green NDVI gNDVI gNDVI=(R750−RG)/(R750+RG) Gitelson et al. (1996), Datt (1998, 1999)Pigment Specific NormalizedDifference
PSND PSNDa=(R800−R675)/(R800+R675) Blackburn (1998)PSNDb=(R800−R650)/(R800+R650)
Eucalyptus Pigment Indexes EPI Chla,b=αa,b×(R672/(R550×R708))βa,b Datt (1998)Summed Reflectance Index SRI S1 =
R 750700 Rλ = R555 − 1ð Þdλ Gitelson and Merzlyak (1994)
S2 =R 750700 Rλ = R705 − 1ð Þdλ
Red edge positionRed Edge Inflexion Point Position IPP R″(λi)=0 Horler et al. (1983), Curran et al. (1995), Gitelson et al. (1996), Kochubey
and Kazantsev (2007)
S70 S.L. Ustin et al. / Remote Sensing of Environment 113 (2009) S67–S77
shift) of the red-edge IPP, due to narrowing of the chlorophyllabsorption feature and a reduction in depth (Ustin & Curtiss, 1990).Gates et al. (1965) and Collins (1978) provided early observations of ablue shift of the red edge which was attributed to the loss ofchlorophyll. Rock et al. (1988) noted a disproportional loss ofchlorophyll b accompanied by a blue shift of the IPP for foliageexposed to air pollution. In contrast, under increased chlorophyllcontent, the chlorophyll absorption feature deepens and broadens(e.g., Buschmann & Nagel, 1993) causing a red-shift of IPP (Collins,1978). Kiang et al. (2007) note that the red-edge shifts of IPP fromshorter to longer wavelengths for species ranging from algae, lichens,mosses, to aquatic and terrestrial plants. Thus, this index isbest applied to variation within a vegetation type to detect stressand between types when it is used to identify taxa. Several indexmethods have been used to detect red-edge shifts in narrow bandspectra (Table 1).
5. Using the red edge to detect stress
Most early studies of the red edge used a first or second derivativeor the amplitude of the derivative to identify the wavelength at theinflection point, which was then correlated with chlorophyll content(Horler et al., 1983; Wessman, 1990). Fig. 3 illustrates how environ-mental stressors, in this case oil contamination, in a grassland sitewith relatively little variation in leaf area index can affect thewavelength position of the inflection point (Fig. 3a) and how the IPPcan be used tomap spatial variation in chlorophyll content due to theoil contamination (Fig. 3b).
Despite 30 years of research defining the relationships betweenpigment content and the red edge using various spectral indexes,the red edge remains an area of active research (e.g., Gitelson et al.,1996; le Maire et al., 2004; Asner et al., 2005; Zarco-Tejada et al.,2005a; Sims et al., 2006). Although the use of derivatives to estimatethe red edge position is widely used, because of their sensitivity tonoise, other methods e.g., the inverted Gaussian of Miller et al.(1990) are now preferred. Recently, Cho and Skidmore (2006)
proposed an improved method to estimate the red-edge inflectionwavelength using intersecting lines originating from the shouldersof the derivative. More research is needed to understand preciselywhat controls the position of long wavelength side of thechlorophyll absorption band. For example, Curtiss and Ustin(1989) observed a broadening of the chlorophyll absorption bandin ponderosa pine needles following exposure to atmospheric ozone,which they interpreted as a red-shift that mimicked increasedchlorophyll content rather than a blue-shift which is expected underlower chlorophyll content. This effect was hypothesized to be due toincreasing disorder in the chloroplast with ozone exposure, apattern consistent with observations that an early sign of ozoneinjury is granulation of the thylakoid membranes. Recently Noomenet al. (2006) reported that exposure to natural ethane gas caused asmall red shift in corn reflectance and a significant decrease inabsorption in the 550–750 nm region.
6. Leaf fluorescence and stress detection
Use of remotely sensed fluorescence to estimate photosyntheticactivity began in the oceanography community to detect phyto-plankton productivity (e.g., Kim, 1973). For both marine and terres-trial applications, two types of systems have been used, active andpassive lasers. Marine systems usually use lasers in the blue spectralregion to excite photosystem II activity, with chlorophyll fluores-cence being observed in the 730 nm region. Passive systems rely onmeasuring natural fluorescence stimulated by sunlight. Althoughthe signal is small, as spectral resolution in the visible spectrumand signal/noise in spectrometers have increased, interest in usingthis technology to directly observe photosynthetic functioninghas become of more interest to plant physiologists and ecologists(Lichtenthaler, 1988). Fig. 4 shows the wavelength specific absorp-tion of light excitation by a UV laser and corresponding chlorophyllfluorescence emission for a typical leaf.
Several authors have noted a double peak in the first derivative ofleaf reflectance around 700–725 nm (Horler et al., 1983; Boochs et al.,

Fig. 3. Correlation between the red-edge position (REP) and chlorophyll concentration(upper panel) of a grass canopy, Isle of Grain, Kent, United Kingdom for plot averages(r=0.84, n=23). Error bars show the standard deviation of the chlorophyll determina-tion. The airborne CASI hyperspectral image (lower panel) of the site illustrates spatialvariation in REP response to oil contamination at the site. The grassland is reported tobe relatively uniform with little variation in leaf area index, however REP indicates sub-stantial differences in chlorophyll concentration (reproduced from Jago et al., 1999).
Fig. 4. Comparison of absorption spectrum for pure chlorophyll a, its active fluorescenceexcitation and its emission spectrum (reproduced from Cerovic et al., 2002).
S71S.L. Ustin et al. / Remote Sensing of Environment 113 (2009) S67–S77
1990). It was later shown that the reflectance derivative could exhibitseveral local maxima in the red edge area in measured (Gitelson et al.,1996) and simulated (le Maire et al., 2004) spectra. The nature ofthis multiple-peak feature is not well understood. Zarco-Tejada et al.(2003) suggested that the double-peak is due to steady-state fluo-rescence emission. LeMaire et al. (2004) showed that the double-peakcan be simulated by the PROSPECTmodel by increasing the chlorophyllcontent alone, regardless of the values of other parameters. It can bealso simulated by increasing the structure parameter alone if the totalchlorophyll content exceeds 400 mg cm−2.
The potential to use fluorescence spectroscopy as a non-destruc-tive method to detect plant stress was recognized in several earlystudies (e.g., Buschmann & Schrey, 1981; Chappelle et al., 1984;Lichtenthaler & Rinderle, 1988). Fluorescence emission maxima wereobserved at 440–450, 525–535, 680–685, and 735–740 nm (e.g.,Richards et al., 2003) and related to components of photosynthesisand leaf pigments (e.g., Buschmann et al., 2000). Gitelson et al. (1999)used a ratio offluorescence at 735/700 nmwhich provided an accurate
prediction of chlorophyll content in intact leaves. Recent authors havecontinued to explore active (e.g., laser-induced) fluorescence (Corpet al., 2006; Richards et al., 2003) and solar-induced fluorescence(Zarco-Tejada et al., 2003; Dobrowski et al., 2005) to detect environ-mental stresses. Carter et al. (2004) measured solar-induced fluores-cence in 10 nm bands at 690 and 760 nm using the Fraunhofer LineDepth Principle to detect stress, and more recently, Meroni andColombo (2006) used very high resolution (0.06 nm) spectrometry at687 and 760 nm to detect chlorophyll fluorescence in an oxygen bandwhere solar irradiance is reduced.
7. Detecting and quantifying foliar pigment composition inrelation to ecological condition
The concept of ecological convergence expresses the “economy ofform” or the efficiency that particular sets of traits provide in exploi-ting limited environmental resources (Field et al., 1992). This conceptimplies that the cost of biochemical investments should be relatedto growth potential and thus better measurements of pigmentdistributions and concentrations could provide a basis formonitoringphysiological and ecological processes. It is known that pigmentcomposition varies with species and environmental conditions (e.g.,Peñuelas et al., 1995a; Carter & Knapp, 1991; Asner et al., 2008).Deciduous species have leaves that are generally adapted for fastergrowth rates and higher photosynthetic capacity (e.g., higherchlorophyll and nitrogen concentrations) than needles in evergreenspecies where the cost of producing lower photosynthetic capacityfoliage can be amortized over several years (Wright et al., 2004).Fig. 5 illustrates differences in the amount and composition ofphotosynthetic pigments in leaves from a deciduous oak grown in thehigher light environment of the savanna compared to leaves from themore closed canopy of the evergreen oak community (Ustin et al.,1993). Reflectance from the evergreen oak leaves is lower acrossthe visible spectrum and the spectral shape is different. The totalamount of pigments is lower in leaves from the evergreen oakand their relative proportions differ from the deciduous species.Note that small absorption features (at this presentation scale) areobserved in these leaves near 585 nm, 620 nm, and 650 nm, sug-gesting that it may be possible to identify the basis for these features,particularly at the canopy level where absorption features areenhanced by transmission through multiple leaf layers (Allen &Richardson, 1968; Knipling, 1970; Curran, 1980; Stylinski et al., 2001;Roberts et al., 2004).
8. Detection of foliar stress using the Photochemical ReflectanceIndex (PRI)
Under high light, it is well established that xanthophyll cyclepigments function to prevent photooxidation of the reaction centers
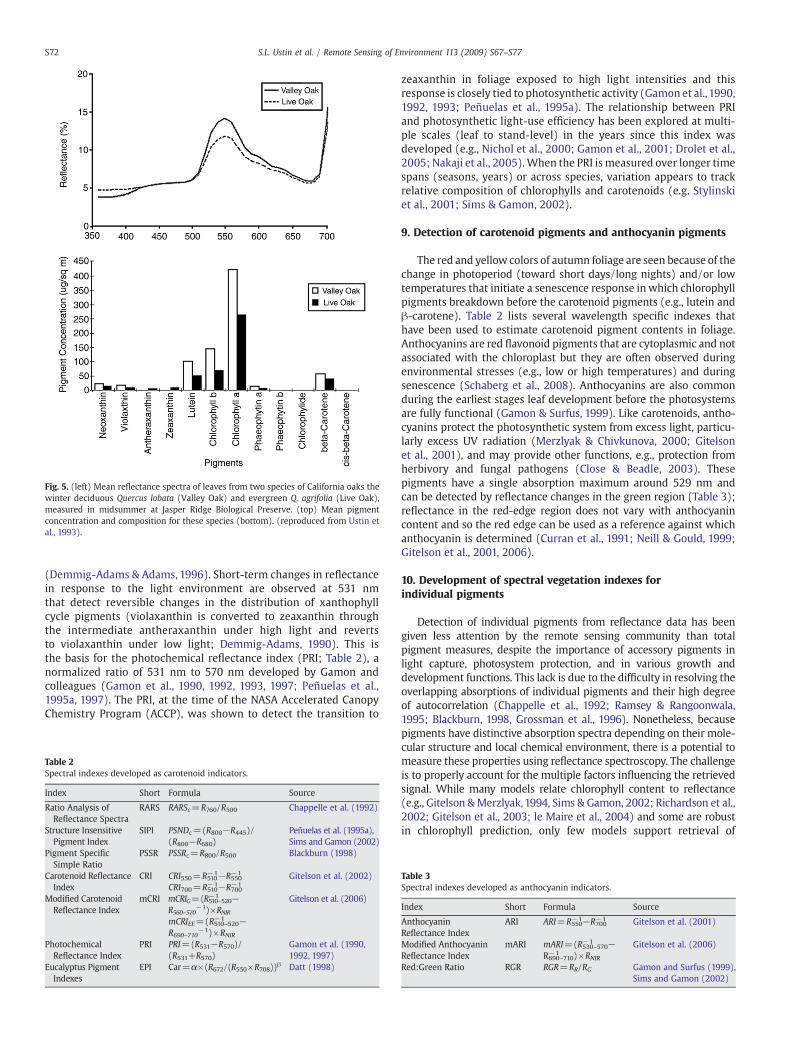
Fig. 5. (left) Mean reflectance spectra of leaves from two species of California oaks thewinter deciduous Quercus lobata (Valley Oak) and evergreen Q. agrifolia (Live Oak),measured in midsummer at Jasper Ridge Biological Preserve. (top) Mean pigmentconcentration and composition for these species (bottom). (reproduced from Ustin etal., 1993).
S72 S.L. Ustin et al. / Remote Sensing of Environment 113 (2009) S67–S77
(Demmig-Adams & Adams, 1996). Short-term changes in reflectancein response to the light environment are observed at 531 nmthat detect reversible changes in the distribution of xanthophyllcycle pigments (violaxanthin is converted to zeaxanthin throughthe intermediate antheraxanthin under high light and revertsto violaxanthin under low light; Demmig-Adams, 1990). This isthe basis for the photochemical reflectance index (PRI; Table 2), anormalized ratio of 531 nm to 570 nm developed by Gamon andcolleagues (Gamon et al., 1990, 1992, 1993, 1997; Peñuelas et al.,1995a, 1997). The PRI, at the time of the NASA Accelerated CanopyChemistry Program (ACCP), was shown to detect the transition to
Table 2Spectral indexes developed as carotenoid indicators.
Index Short Formula Source
Ratio Analysis ofReflectance Spectra
RARS RARSc=R760/R500 Chappelle et al. (1992)
Structure InsensitivePigment Index
SIPI PSNDc=(R800−R445)/(R800−R680)
Peñuelas et al. (1995a),Sims and Gamon (2002)
Pigment SpecificSimple Ratio
PSSR PSSRc=R800/R500 Blackburn (1998)
Carotenoid ReflectanceIndex
CRI CRI550=R510−1−R550
−1 Gitelson et al. (2002)CRI700=R510
−1−R700−1
Modified CarotenoidReflectance Index
mCRI mCRIG=(R510–520−1 −R560–570
−1)×RNIR
Gitelson et al. (2006)
mCRIEE=(R510–520−1 −R690–710
−1)×RNIRPhotochemicalReflectance Index
PRI PRI=(R531−R570)/(R531+R570)
Gamon et al. (1990,1992, 1997)
Eucalyptus PigmentIndexes
EPI Car=α×(R672/(R550×R708))β Datt (1998)
zeaxanthin in foliage exposed to high light intensities and thisresponse is closely tied to photosynthetic activity (Gamon et al.,1990,1992, 1993; Peñuelas et al., 1995a). The relationship between PRIand photosynthetic light-use efficiency has been explored at multi-ple scales (leaf to stand-level) in the years since this index wasdeveloped (e.g., Nichol et al., 2000; Gamon et al., 2001; Drolet et al.,2005; Nakaji et al., 2005).When the PRI is measured over longer timespans (seasons, years) or across species, variation appears to trackrelative composition of chlorophylls and carotenoids (e.g. Stylinskiet al., 2001; Sims & Gamon, 2002).
9. Detection of carotenoid pigments and anthocyanin pigments
The red and yellow colors of autumn foliage are seen because of thechange in photoperiod (toward short days/long nights) and/or lowtemperatures that initiate a senescence response inwhich chlorophyllpigments breakdown before the carotenoid pigments (e.g., lutein andβ-carotene). Table 2 lists several wavelength specific indexes thathave been used to estimate carotenoid pigment contents in foliage.Anthocyanins are red flavonoid pigments that are cytoplasmic and notassociated with the chloroplast but they are often observed duringenvironmental stresses (e.g., low or high temperatures) and duringsenescence (Schaberg et al., 2008). Anthocyanins are also commonduring the earliest stages leaf development before the photosystemsare fully functional (Gamon & Surfus, 1999). Like carotenoids, antho-cyanins protect the photosynthetic system from excess light, particu-larly excess UV radiation (Merzlyak & Chivkunova, 2000; Gitelsonet al., 2001), and may provide other functions, e.g., protection fromherbivory and fungal pathogens (Close & Beadle, 2003). Thesepigments have a single absorption maximum around 529 nm andcan be detected by reflectance changes in the green region (Table 3);reflectance in the red-edge region does not vary with anthocyanincontent and so the red edge can be used as a reference against whichanthocyanin is determined (Curran et al., 1991; Neill & Gould, 1999;Gitelson et al., 2001, 2006).
10. Development of spectral vegetation indexes forindividual pigments
Detection of individual pigments from reflectance data has beengiven less attention by the remote sensing community than totalpigment measures, despite the importance of accessory pigments inlight capture, photosystem protection, and in various growth anddevelopment functions. This lack is due to the difficulty in resolving theoverlapping absorptions of individual pigments and their high degreeof autocorrelation (Chappelle et al., 1992; Ramsey & Rangoonwala,1995; Blackburn, 1998, Grossman et al., 1996). Nonetheless, becausepigments have distinctive absorption spectra depending on their mole-cular structure and local chemical environment, there is a potential tomeasure these properties using reflectance spectroscopy. The challengeis to properly account for the multiple factors influencing the retrievedsignal. While many models relate chlorophyll content to reflectance(e.g., Gitelson &Merzlyak,1994, Sims & Gamon, 2002; Richardson et al.,2002; Gitelson et al., 2003; le Maire et al., 2004) and some are robustin chlorophyll prediction, only few models support retrieval of
Table 3Spectral indexes developed as anthocyanin indicators.
Index Short Formula Source
AnthocyaninReflectance Index
ARI ARI=R550−1−R700
−1 Gitelson et al. (2001)
Modified AnthocyaninReflectance Index
mARI mARI=(R530–570−1 −R690–710−1 )×RNIR
Gitelson et al. (2006)
Red:Green Ratio RGR RGR=RR/RG Gamon and Surfus (1999),Sims and Gamon (2002)
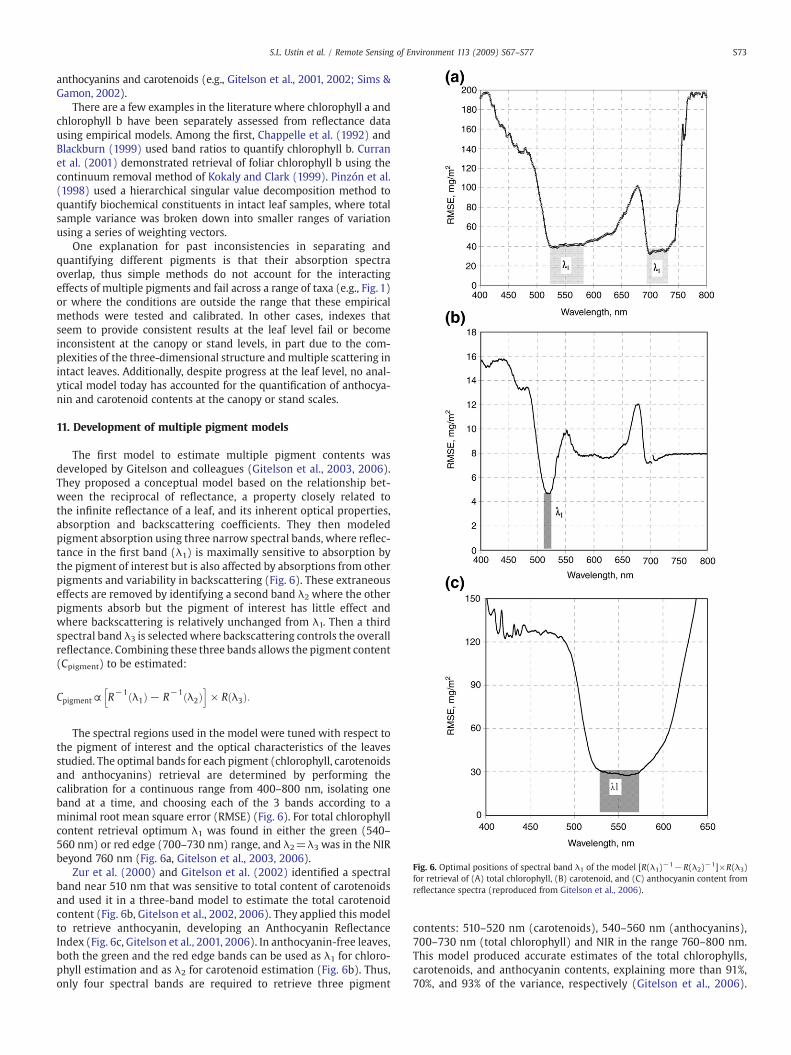
Fig. 6. Optimal positions of spectral band λ1 of the model [R(λ1)−1−R(λ2)−1]×R(λ3)for retrieval of (A) total chlorophyll, (B) carotenoid, and (C) anthocyanin content fromreflectance spectra (reproduced from Gitelson et al., 2006).
S73S.L. Ustin et al. / Remote Sensing of Environment 113 (2009) S67–S77
anthocyanins and carotenoids (e.g., Gitelson et al., 2001, 2002; Sims &Gamon, 2002).
There are a few examples in the literature where chlorophyll a andchlorophyll b have been separately assessed from reflectance datausing empirical models. Among the first, Chappelle et al. (1992) andBlackburn (1999) used band ratios to quantify chlorophyll b. Curranet al. (2001) demonstrated retrieval of foliar chlorophyll b using thecontinuum removal method of Kokaly and Clark (1999). Pinzón et al.(1998) used a hierarchical singular value decomposition method toquantify biochemical constituents in intact leaf samples, where totalsample variance was broken down into smaller ranges of variationusing a series of weighting vectors.
One explanation for past inconsistencies in separating andquantifying different pigments is that their absorption spectraoverlap, thus simple methods do not account for the interactingeffects of multiple pigments and fail across a range of taxa (e.g., Fig. 1)or where the conditions are outside the range that these empiricalmethods were tested and calibrated. In other cases, indexes thatseem to provide consistent results at the leaf level fail or becomeinconsistent at the canopy or stand levels, in part due to the com-plexities of the three-dimensional structure andmultiple scattering inintact leaves. Additionally, despite progress at the leaf level, no anal-ytical model today has accounted for the quantification of anthocya-nin and carotenoid contents at the canopy or stand scales.
11. Development of multiple pigment models
The first model to estimate multiple pigment contents wasdeveloped by Gitelson and colleagues (Gitelson et al., 2003, 2006).They proposed a conceptual model based on the relationship bet-ween the reciprocal of reflectance, a property closely related tothe infinite reflectance of a leaf, and its inherent optical properties,absorption and backscattering coefficients. They then modeledpigment absorption using three narrow spectral bands, where reflec-tance in the first band (λ1) is maximally sensitive to absorption bythe pigment of interest but is also affected by absorptions from otherpigments and variability in backscattering (Fig. 6). These extraneouseffects are removed by identifying a second band λ2 where the otherpigments absorb but the pigment of interest has little effect andwhere backscattering is relatively unchanged from λ1. Then a thirdspectral band λ3 is selectedwhere backscattering controls the overallreflectance. Combining these three bands allows the pigment content(Cpigment) to be estimated:
Cpigment~ R−1 λ1ð Þ− R−1 λ2ð Þh i
× R λ3ð Þ:
The spectral regions used in the model were tuned with respect tothe pigment of interest and the optical characteristics of the leavesstudied. The optimal bands for each pigment (chlorophyll, carotenoidsand anthocyanins) retrieval are determined by performing thecalibration for a continuous range from 400–800 nm, isolating oneband at a time, and choosing each of the 3 bands according to aminimal root mean square error (RMSE) (Fig. 6). For total chlorophyllcontent retrieval optimum λ1 was found in either the green (540–560 nm) or red edge (700–730 nm) range, and λ2=λ3 was in the NIRbeyond 760 nm (Fig. 6a, Gitelson et al., 2003, 2006).
Zur et al. (2000) and Gitelson et al. (2002) identified a spectralband near 510 nm that was sensitive to total content of carotenoidsand used it in a three-band model to estimate the total carotenoidcontent (Fig. 6b, Gitelson et al., 2002, 2006). They applied this modelto retrieve anthocyanin, developing an Anthocyanin ReflectanceIndex (Fig. 6c, Gitelson et al., 2001, 2006). In anthocyanin-free leaves,both the green and the red edge bands can be used as λ1 for chloro-phyll estimation and as λ2 for carotenoid estimation (Fig. 6b). Thus,only four spectral bands are required to retrieve three pigment
contents: 510–520 nm (carotenoids), 540–560 nm (anthocyanins),700–730 nm (total chlorophyll) and NIR in the range 760–800 nm.This model produced accurate estimates of the total chlorophylls,carotenoids, and anthocyanin contents, explaining more than 91%,70%, and 93% of the variance, respectively (Gitelson et al., 2006).

S74 S.L. Ustin et al. / Remote Sensing of Environment 113 (2009) S67–S77
However, the model for carotenoids retrieval was found to be speciesspecific.
12. Leaf radiative transfer models
Physically based RT models have the potential to produce moreaccurate and consistent predictions of pigment interactions becausethey are based in physics and use the full spectrum rather thanindividual bands and therefore, do not require calibration each timethey are used. However, RT model predictions of the optical proper-ties of monocot or dicot leaves or needles depend on how wellunderstood all processes affecting reflectance are and how they areaccounted for in the models. Although they have potential to predictpigment content more consistently and accurately than empiricalmethods, they require more input parameters, which if wrong, resultin poor model performance. Thus, empirical models can be moreaccurate than physical models if the components are improperlymodeled or the input data is wrong.
Several leaf models, e.g., PROSPECT (Leaf Optical PropertiesSpectra, Jacquemoud and Baret, 1990), LIBERTY (Leaf IncorporatingBiochemistry Exhibiting Reflectance and Transmittance Yields, Dawsonet al., 1998), LEAFMOD (Leaf Experimental Absorptivity FeasibilityMODel, Ganapol et al., 1998), and SLOP (Stochastic model for LeafOptical Properties, Maier et al., 1999; Maier, 2000), have been usedsince the 1990s to estimate total chlorophyll concentration (seereview in Ustin et al., 2004). Instead of modeling multiple pigments,RT models currently assume that leaf pigments are entirely com-posed of chlorophyll and that the horizontal and vertical distributionof these absorbers is homogeneous within foliar tissues.
Characterization of in situ absorption coefficients for xanthophylls,carotenes and even chlorophyll b need to be added to leaf RT modelsto estimate individual pigments. This will require defining in vivoabsorption coefficients for all individual pigments but also betterknowledge of the spectral variation of the refractive index of leaves,information that is not currently available and which may varydepending upon the chemical environment within the leaf. Maieret al. (1999) and Berdnik and Mukhamed'yarov (2001) followed thisapproach and utilized separate in vitro absorption spectra ofchlorophyll a, b and several carotenoids in developing their leafoptical propertiesmodel. An advanced version of the PROSPECTmodel(PROSPECT 5) that can discriminate chlorophylls from total carote-noids has been developed (Feret et al., 2008). This required a longphase of calibration using datasets carefully selected to cover a widerange of leaf photosynthetic pigments. Feret et al. (2008) showed thatsome improvements in prediction of leaf reflectance, on the order of5% in the visible, could be made by better characterization of pigment
Fig. 7. Predicted and measured total chlorophyll (left) and total carotenoid (right)pigments based on an inversion of the PROSPECT 5 model (reproduced from Feret et al.,2008) using leaves from four sources: (● LOPEX (Hosgood et al., 1994) □ CALMIT(Gitelson et al., 2002, 2003) ♦ ANGERS (INRA, France) ○ HAWAI (Asner & Martin,2008).
contributions. Fig. 7 shows the comparison between measured andPROSPECT-5 predicted total chlorophyll (left) and total carotenoid(right) contents from leaves representing a wide range of ecologicalconditions and communities, from mesic and semiarid temperateforests, shrublands, and agriculture, to subtropical and tropicalsystems.
The fact that light can be propagated through leaves withoutencountering foliar pigments, for instance in veins, is a phenomenonknown as the sieve effect which has been accounted for in RT modelsto better interpret absorption spectra of leaves (Latimer, 1983;McClendon & Fukshansky, 1990). Additionally, bifacial leaves withdifferent chlorophyll content in the palisade and spongy mesophyllscan be simulated using the Kubelka–Munk theory applied to two ormore stacked layers (Yamada & Fujimura, 1991; Richter & Fukshansky,1996). With this added level of physical detail being built into RT leafreflectance models, it is likely that it will lead to better characteriza-tion of individual pigments.
A recent European program to develop methods to detect leaf andcanopy fluorescence has produced a new model, FluorMOD, withlinked leaf and canopy models to detect the effects of steady-statesolar-induced chlorophyll fluorescence (Zarco-Tejada et al., 2006;Middleton et al., 2008).
13. Challenges in imaging spectroscopy of vegetation pigments
The application of narrow-band spectral methods for pigmentdetection to airborne and spaceborne spectrometers has been theintended goal of much of the leaf-level research since the time of theACCP program that Dr. Goetz headed. Field- and laboratory-basedspectroscopy of plant pigments has had a long period of developmentand today, a large number of studies have explored the detection ofpigments in many leaf types originating from a wide range ofecosystems and using a wide range of methods. The use of airborneand space-based imaging spectrometers to detect and map foliarpigments is still relatively new (e.g., Collins, 1978; Rock et al., 1988;Zarco-Tejada & Miller, 1999). These examples highlight the potentialcontribution of imaging spectroscopy for detecting and quanti-fying foliar pigments from imaging spectroscopy to studies of can-opy physiology and ecology. At this time, current methods have notdelivered unambiguous results and operational methods for thislevel of biochemical retrieval. Advances in algorithm developmentas highlighted above indicate that numerous challenges remain tobe solved before pigment concentrations can be routinely retrievedfrom space. Imaging spectrometer design is a key issue in the questfor more quantitative approaches to identification of pigments. Thiswill require an instrument that has high spectral resolution, ~3–5 nmto measure pigment details but which has good signal to noisecharacteristics of up to 1000:1 in the visible and infrared region. Thefidelity of the sensor, which includes signal-to-noise performance,uniformity of the image, and stability of the electronics all affectthe outcome of a canopy chemical analysis. Instruments must becalibrated in terms of wavelength (i.e., avoiding keystone and smile)and have radiometric stability.
A good example of current technological capability is found bylooking at the evolution of the Jet Propulsion Laboratory's AdvancedVisible Infared Imaging Spectrometer (AVIRIS) program, whichstarted under the leadership of Dr. A.F.H. Goetz in 1982. In the early1990s, AVIRIS signal-to-noise ratio was in the 10–100 rangedepending upon wavelength region (Vane et al., 1993). Since then,AVIRIS has evolved, through major upgrades and constant hardwareand software adjustment, to provide spectra with effective signal-to-noise performances of many 100 s to 1000 s (Green et al., 2003). Theresolution, stability, and sensitivity of the sensor technology bearssquarely upon the state of hyperspectral algorithm development.With the high fidelity of AVIRIS today and a few other sensors, it ispossible to use physically-based methods, such as canopy RT models,
S75S.L. Ustin et al. / Remote Sensing of Environment 113 (2009) S67–S77
to explore spectra in some detail. Thus, advances in modelingpigments at the leaf level can be incorporated into models suitablefor imaging spectrometers. However, since most remote mapping ofecosystems will be at canopy level, solid coupling of leaf radiativetransfer models with canopy scale models will be key to successfulretrieval of multiple pigments from air- or spaceborne spectro-meters. At canopy scale, the simultaneous assessment of canopyheterogeneity as well as pigments will require a better representa-tion of clumped and sparse canopies in coupled RT models. Futuresensors, having capabilities similar to the proposed NASA HyspIRImission and the German EnMap program (Kaufmann et al., 2006),will eventually deliver spectroscopic measurements of sufficientlyhigh fidelity to advance the mapping of canopy pigments and otherchemicals.
Acknowledgements
This paper is dedicated to Dr. Alexander Goetz, who as chair of theNASA HIRIS Canopy Chemistry Program stimulated much of the earlyresearch on plant pigments and continues to impact research today,through the use of plant biochemical databases and various analyticalapproaches that developed during this program. His vision of imagingspectrometry has allowed the development of techniques andmeasurements that have linked a detailed understanding of plantphysiological functioning with optical properties, and provided theopportunity to study biological processes from the leaf to planetaryscales. S.U. wishes to thank the Department of Biological Science,Victoria University, Wellington, New Zealand for providing space andsupport while this paper was written during her sabbatic leave andsupport from the USDA Agricultural Experiment Station Hatchprogram, #5661-H “Identification of canopy chemistry using reflec-tance and imaging spectroscopy”.
References
Allen, W. A., & Richardson, A. J. (1968). Interaction of light with a plant canopy. Journalof the Optical Society of America, 58, 1023−1028.
Anderson, J., Chow, W., & Godchild, D. (1988). Thylakoid membrane organisation insun/shade acclimation. Australian Journal of Plant Physiology, 15, 11−26.
Aoki, M., Yabuki, K., & Totsuka, T. (1980). Remote sensing of the physiological functionsof plants by infrared color aerial photography. I. Relation between leaf reflectivityratio, bi-band ratio and photosynthetic function of leaves in several woody plants.Research Report from the National Institute for Environmental Studies, 11, 225−237.
Aoki, M., Yabuki, K., Totsuka, T., & Nishida, M. (1986). Remote sensing of chlorophyllcontent of leaf (I) Effective spectral reflection characteristics of leaf for theevaluation of chlorophyll content in leaves of Dicotyledons. Environmental Controlin Biology, 24, 21−26.
Arnold, L., Gillet, S., Lardiere, O., Riaud, P., & Schneider, J. (2002). A test for the search forlife on extrasolar planets. Astronomy and Astrophysics, 392, 231−237.
Asner, G. P., Elmore, A. J., Flint, R., Hughes, R., Warner, A. S., & Vitousek, P. M. (2005).Ecosystem structure along bioclimatic gradients in Hawai'i from imaging spectro-scopy. Remote Sensing of Environment, 96, 497−508.
Asner, G. P., Jones, M. O., Martin, R. E., Knapp, D. E., Hughes, R. F., & Flint, R. (2008).Remote sensing of native and invasive species in Hawaiian forests. Remote Sensingof Environment, 112, 1912−1926.
Asner, G. P., & Martin, R. E. (2008). Airborne spectranomics: Mapping canopy chemicaland taxonomic diversity in tropical ecosystems. Frontiers in Ecology and theEnvironment, 7. doi:10.1890/070152.
Asrar, G., Fuchs, H., Kanemasu, E. T., & Hatfield, J. L. (1984). Estimating absorbedphotosynthetic radiation and leaf-area index from spectral reflectance in wheat.Agronomy Journal, 76, 300−306.
Belanger, M. J. (1990), A seasonal perspective of several leaf developmental charac-teristics as related to the red edge of plant leaf reflectance, Master of ScienceThesis, Faculty of Graduate Studies, York University, North York (Ontario, Canada),110 pp.
Berdnik, V. V., & Mukhamed'yarov, R. D. (2001). Radiation transfer in plant leaves.Optics and Spectroscopy, 90, 580−591.
Blackburn, G. A. (1998). Quantifying chlorophylls and carotenoids at leaf and canopyscales: An evaluation of some hyperspectral approaches. Remote Sensing ofEnvironment, 66, 273−285.
Blackburn, G. A. (1999). Relationships between spectral reflectance and pigmentconcentrations in stacks of deciduous broadleaves. Remote Sensing of Environment,70, 224−237.
Blackburn, G. A. (2007). Hyperspectral remote sensing of plant pigments. Journal ofExperimental Botany, 58, 855−867.
Boochs, F., Kupfer, G., Dockter, K., & Kuhbauch, W. (1990). Shape of the red edge asvitality indicator for plants. International Journal of Remote Sensing, 11, 1741−1753.
Buschmann, C., Langsdorf, G., & Lichtenthaler, H. K. (2000). Imaging of the blue, green, andred fluorescence emission of plants: An overview. Photosynthetica, 38, 483−491.
Buschmann, C., & Nagel, E. (1993). In vivo spectroscopy and internal optics of leaves asbasis for remote-sensing of vegetation. International Journal of Remote Sensing, 14,711−722.
Buschmann, C., Nagel, E., Szabo, K., & Kocsanyi, L. (1994). Spectrometer for fastmeasurements of in vivo reflectance, absorptance, and fluorescence in the visibleand near-infrared. Remote Sensing of Environment, 48, 18−24.
Buschmann, C., & Schrey, H. (1981). Fluorescence inductionkinetics of green andetiolatedleaves by recording the complete in-vivo emissions spectra. Photosynthesis Research,1, 233−241.
Carter, G. A. (1994). Ratios of leaf reflectances in narrow wavebands as indicators ofplant stress. International Journal of Remote Sensing, 15(3), 697−703.
Carter, G. A., Freedman, A., Kebabian, P. L., & Scott, H. E. (2004). Use of a prototypeinstrument to detect short-term changes in solar-excited leaf fluorescence. Inter-national Journal of Remote Sensing, 25, 1779−1784.
Carter, G. A., & Knapp, A. K. (1991). Leaf optical properties in higher plants: Linkingspectral characteristics to stress and chlorophyll concentration. American Journal ofBotany, 88, 677−684.
Carter, G. A., & Spiering, B. A. (2002). Optical properties of intact leaves for estimatingchlorophyll concentration. Journal of Environmental Quality, 31, 1424−1432.
Cerovic, Z. G., Ounis, A., Cartelat, A., Latouche, G., Goulas, Y., Meyer, S., et al. (2002). Theuse of chlorophyll fluorescence excitation spectra for the non-destructive in situassessment of UV-absorbing compounds in leaves. Plant, Cell and Environment, 25,1663−1676.
Chang, S. H., & Collins, W. (1983). Confirmation of the airborne biogeophysical mineralexploration technique using laboratory methods. Economic Geology, 78, 723−726.
Chappelle, E. W., Kim, M. S., & McMurtrey, J. E., III (1992). Ratio analysis of reflectancespectra (RARS): An algorithm for the remote estimation of the concentrations ofchlorophyll a, chlorophyll b, and carotenoids in soybean leaves. Remote Sensing ofEnvironment, 39, 239−247.
Chappelle, E.W., McMurtrey, J. E., Wood, F. M., & Newcomb,W.W. (1984). Laser-inducedfluorescence of green plants. 2. LIF caused by nutrient deficiencies in corn. AppliedOptics, 23, 139−142.
Cho, M. A., & Skidmore, A. K. (2006). A new technique for extracting the red edgeposition from hyperspectral data: The linear extrapolation method. Remote Sensingof Environment, 101, 181−193.
Close, D. C., & Beadle, C. L. (2003). The ecophysiology of foliar anthocyanin. BotanicalReview, 69, 149−161.
Collins, W. (1978). Remote sensing of crop type and maturity. PhotogrammetricEngineering and Remote Sensing, 44, 43−55.
Corp, L. A., Middleton, E. M., McMurtrey, J. E., Campbell, P. K. E., & Butcher, L. M. (2006).Fluorescence sensing techniques for vegetation assessment.AppliedOptics,45,1023−1033.
Curran, P. J. (1980). Multispectral remote sensing of vegetation amount. Progress inPhysical Geography, 4, 315−341.
Curran, P. J., Dungan, J. L., Macler, B. A., & Plummer, S. E. (1991). The effect of a redpigment on the relationship between red edge and chlorophyll concentration. Re-mote Sensing of Environment, 35, 69−76.
Curran, P. J., Dungan, J. L., & Peterson, D. L. (2001). Estimating the foliar biochemicalconcentration of leaves with reflectance spectrometry. Remote Sensing of Environ-ment, 76, 349−359.
Curran, P. J., Windham, W. R., & Gholz, H. L. (1995). Exploring the relationship betweenreflectance red edge and chlorophyll concentration in slash pine leaves. TreePhysiology, 15, 203−206.
Curtiss, B., & Ustin, S. L. (1989). Parameters affecting reflectance of coniferous forests inthe region of chlorophyll pigment absorption. IGARSS '89 Proceedings of theInternational Geoscience and Remote Sensing Symposium, Vancouver, BC, Canada. July,1989. IEEE 89CH2768-0, vol. 4. (pp. 2633−2636).
Datt, B. (1998). Remote sensing of chlorophyll a, chlorophyll b, chlorophyll a + b, andtotal carotenoid content in Eucalyptus leaves. Remote Sensing of Environment, 66,111−121.
Datt, B. (1999). Visible/near infrared reflectance and chlorophyll content in Eucalyptusleaves. International Journal of Remote Sensing, 20, 2741–2759.
Dawson, T. P., Curran, P. J., & Plummer, S. E. (1998). LIBERTY — modeling the effects ofleaf biochemical concentration on reflectance spectra. Remote Sensing of Environ-ment, 65, 50−60.
Deering, D. W. (1978). Rangeland reflectance characteristics measured by aircraft andspacecraft sensors. Ph.D. diss. Texas A&M Univ., College Station. 338p.
Demmig-Adams, B. (1990). Carotenoids and photoprotection in plants: A role for thexanthophyll zeaxanthin. Biochemica and Biophysica Acta, 1020, 1−24.
Demmig-Adams, B., & Adams, W. W. (1996). The role of xanthophyll cycle carotenoidsin the protection of photosynthesis. Trends in Plant Science, 1, 20−26.
Dobrowski, S. Z., Pushnik, J. C., Zarco-Tejeda, P. J., & Ustin, S. L. (2005). Simple reflectanceindices track heat and water stress-induced changes in steady-state chlorophyllfluorescence at the canopy scale. Remote Sensing of Environment, 97, 403−414.
Drolet, G. G., Huemmrich, K. F., Hall, F. G., Middleton, E. M., Black, T. A., Barr, A. G., et al.(2005). A MODIS-derived photochemical reflectance index to detect interannualvariations in the photosynthetic light-use efficiency of a boreal deciduous forest.Remote Sensing of Environment, 98, 212−224.
Du, H., Fuh, R. C. A., Li, J., Corkan, L. A., & Lindsey, J. S. (1998). PhotochemCAD: Acomputer-aided design and research tool in photochemistry. Photochemistry andPhotobiology, 68, 141−142.
Feret, J.-B., François, C., Asner, G. P., Gitelson, A. A., Martin, R. E., Bidel, L. P. R., Ustin, S. L., leMaire, G. & Jacquemoud, S. (2008). PROSPECT-4 and 5: Advances in the leaf optical

S76 S.L. Ustin et al. / Remote Sensing of Environment 113 (2009) S67–S77
propertiesmodel separating photosynthetic pigments.Remote Sensing of Environment,112, 3030–3043.
Field, C. B., Chapin, F. S., III, Matson, P. A., &Mooney, H. A. (1992). Responses of terrestrialecosystems to the changing atmosphere: A resource-based approach. AnnualReview of Ecology and Systematics, 23, 201−235.
Gamon, J. A., Field, C. B., Bilger, W., Björkman, O., Fredeen, A. L., & Peñuelas, J. (1990).Remote sensing of the xanthophyll cycle and chlorophyll fluorescence in sunflowerleaves and canopies. Oecologia, 85, 1−7.
Gamon, J. A., Filella, I., & Peñuelas, J. (1993). The dynamic 531 nm reflectance signal: Asurvey of twenty angiosperm species. In H. Y. Yamamoto, & C. M. Smith (Eds.),Photosynthetic Responses to the Environment (pp. 172−177). Rockville AmericanSociety of Plant Physiologists.
Gamon, J. A., Peñuelas, J., & Field, C. B. (1992). A narrow waveband spectral index thattracks diurnal changes in photosynthetic efficiency. Remote Sensing of Environment,41, 35−44.
Gamon, J. A., Serrano, L., & Surfus, J. S. (1997). The photochemical reflectance index: Anoptical indicator of photosynthetic radiation use efficiency across species,functional types, and nutrient levels. Oecologia, 112, 492−501.
Gamon, J. A., & Surfus, J. S. (1999). Assessing leaf pigment content and activity with areflectometer. New Phytologist, 143, 105−117.
Gamon, J. A., Field, C. B., Fredeen, A. L. & Thayer, S. (2001). Assessing photosyntheticdownregulation in sunflower stands with an optically-based model. PhotosynthesisResearch, 67, 113–125.
Ganapol, B., Johnson, L., Hammer, P., Hlavka, C., & Peterson, D. (1998). LEAFMOD: A newwithin-leaf radiative transfer model. Remote Sensing of Environment, 6, 182−193.
Gates, D. M., Keegan, H. J., Schleter, J. C., & Weider, V. R. (1965). Spectral properties ofplants. Applied Optics, 4, 11−20.
Gitelson, A. A., Buschmann, C., & Lichtenthaler, H. K. (1999). The chlorophyll fluorescenceratio R735/F700 as an accurate measure of the chlorophyll content in plants. RemoteSensing of Environment, 69, 296−302.
Gitelson, A. A., Gritz, U., & Merzlyak, M. N. (2003). Relationships between leaf chlorophyllcontent and spectral reflectance and algorithms for non-destructive chlorophyllassessment in higher plant leaves. Journal of Plant Physiology, 160, 271−282.
Gitelson, A. A., Keydan, G. P., & Merzlyak, M. N. (2006). Three-band model for non-invasive estimation of chlorophyll, carotenoids, and anthocyanin contents in higherplant leaves. Geophysical Research Letters, 33, L11402.
Gitelson, A. A., & Merzlyak, M. N. (1994). Quantitative estimation of chlorophyll-a usingreflectance spectra-experiments with autumn chestnut and maple leaves. Journalof Photochemistry and Photobiology. B, Biology, 22, 247−252.
Gitelson, A. A., & Merzlyak, M. N. (1997). Remote estimation of chlorophyll content inhigher plant leaves. International Journal of Remote Sensing, 18, 2691−2697.
Gitelson, A. A., Merzlyak, M. N., & Chivkunova, O. B. (2001). Optical properties and non-destructive estimation of anthocyanin content in plant leaves. Photochemistry andPhotobiology, 74, 38−45.
Gitelson, A. A., Zur, Y., Chivkunova, O. B., & Merzlyak, M. N. (2002). Assessing carotenoidcontent in plant leaves with reflectance spectroscopy. Photochemistry andPhotobiology, 75, 272−281.
Gitelson, A., & Merzlyak, M. (1996). Signature analysis of leaf reflectance spectra: Algo-rithm development for remote sensing of chlorophyll. Journal of Plant Physiology,148, 495−500.
Gitelson, A., Merzlyak, M., & Lichtenthaler, H. (1996). Detection of red edge position andchlorophyll content by reflectance measurements near 700 nm. Journal of PlantPhysiology, 148, 501−508.
Govindjee, & Krogmann, D. (2004). Discoveries in oxygenic photosynthesis (1727–2003):A perspective. Photosynthesis Research, 80, 15−57.
Green, R. O., Pavri, B. E., & Chrien, T. G. (2003). On-orbit radiometric and spectralcalibration characteristics of EO-1 Hyperion derived with an underflight of AVIRISand in situ measurements at Salar de Arizaro, Argentina. IEEE Transactions onGeoscience and Remote Sensing, 41, 1194−1203.
Grossman, Y. L., Ustin, S. L., Sanderson, E., Jacquemoud, J., Schmuck, G., & Verdebout, J.(1996). Critique of stepwise multiple linear regression for the extraction of leafbiochemistry information from leaf reflectance data. Remote Sensing of Environ-ment, 56, 182−193.
Hoque, E., & Hutzler, P. J. S. (1992). Spectral blue shift of red edgemonitors damage classof beech trees. Remote Sensing of Environment, 39, 81−84.
Horler, D. N., Dockray, M., & Barber, J. (1983). The red edge of plant leaf reflectance.International Journal of Remote Sensing, 4, 273−288.
Hosgood, B., Jacquemoud, S., Andreoli, G., Verdebout, J., Pedrini, G., & Schmuck, G.(1994). Leaf Optical Properties EXperiment 93 (LOPEX93), European Commission–Joint Research Centre, Ispra (Italy), EUR 16095 EN 20 pp. [http://www-gvm.jrc.it/stars/lopex.htm].
Jacquemoud, S., & Baret, F. (1990). PROSPECT: A model of leaf optical properties. RemoteSensing of Environment, 34, 75−91.
Jago, R. A., Cutler, M. E. J., & Curran, P. J. (1999). Estimating Canopy ChlorophyllConcentration from Field and Airborne Spectra. Remote Sensing of Environment, 68,217–224.
Kaufmann, H., Segl, K., Chabrillat, S., Hofer, S., Stuffier, T., Mueller, A., et al. (2006).EnMAP – A hyperspectral sensor for environmental mapping and analysis. Inter-national Geoscience and Remote Sensing Symposium (IGARSS) (pp. 1617−1619).
Kiang, N. Y., Siefert, J., Govindjee, & Blankenship, R. E. (2007). Spectral signatures ofphotosynthesis. I. Review of Earth organisms. Astrobiology, 7, 222−251.
Kim,H. H. (1973). Newalgaemapping techniques by theuse of airborne laserfluorosensor.Applied Optics, 12, 1454−1459.
Knipling, E. B. (1970). The physical and physiological basis for the reflectance of visibleand near-infrared radiation from vegetation. Remote Sensing of Environment, 1,155−159.
Kochubey, S. M., & Kazantsev, T. A. (2007). Changes in the first derivatives of leafreflectance spectra of various plants induced by variations of chlorophyll content.Journal of Plant Physiology, 164, 1648−1655.
Kokaly, R. F., & Clark, R. N. (1999). Spectroscopic determination of leaf biochemistryusing band-depth analysis of absorption features and stepwise multiple regression.Remote Sensing of Environment, 67, 267−287.
Latimer, P. (1983). The deconvulation of absorption spectra of green plant materials –
Improved corrections for the sieve effect. Photochemistry and Photobiology,38, 731−734.le Maire, G., Francois, C., & Dufrene, E. (2004). Towards universal broad leaf chlorophyll
indices using PROSPECT simulated database and hyperspectral reflectancemeasurements. Remote Sensing of Environment, 89, 1−28.
Lichtenthaler, H. K. (1987). Chlorophylls and carotenoids: Pigments of photosyntheticbiomembranes. Methods in Enzymology, 148, 350−382.
Applications of chlorophyll fluorescence. Lichtenthaler, H. K. (Ed.). (1988). Photo-synthesis Research, Stress Physiology, Hydrobiology, and Remote Sensing : Springer384 pp.
Lichtenthaler, H. K., & Rinderle, U. (1988). The role of chlorophyll fluorescence in thedetection of stress conditions in plants. CRC Critical Reviews in Analytical Chemistry,19(Suppl. 1), S29−S85.
Maccioni, A., Agati, G., & Mazzinghi, P. (2001). New vegetation indices for remotemeasurement of chlorophylls based on leaf directional reflectance spectra. Journalof Photochemistry and Photobiology. B, Biology, 61, 52−61.
Maier, S. W. (2000), Modeling the radiative transfer in leaves in the 300 nm to 2.5 µmwavelength region taking into consideration chlorophyllfluorescence– The leafmodelSLOPE. PhD Thesis – Technische Universität München (München), 124 pages.
Maier, S.W., Lüdeker, W., & Günther, K. P. (1999). SLOP: A revised version of the stochasticmodel for leaf optical properties. Remote Sensing of Environment, 68, 273−280.
Malenovský, Z., Ufer, C., Lhotáková, Z., Clevers, J. G. P. W., Schaepman, M. E., Albrechtová,J., et al. (2006). A new hyperspectral index for chlorophyll estimation of a forest canopy:Area under curve normalised to maximal band depth between 650–725 nmEARSeLeProceedings, vol. 5. (pp. 161−172).
McClendon, J. H., & Fukshansky, L. (1990). On the interpretation of absorption spectra ofleaves. II. The non-absorbed ray of the sieve effect and the mean optical pathlengthin the remainder of the leaf. Photochemistry and Photobiology, 51, 211−216.
Meroni, M., & Colombo, R. (2006). Leaf level detection of solar induced chlorophyllfluorescence by means of a subnanometer resolution spectroradiometer. RemoteSensing of Environment, 103, 438−448.
Merzlyak, M. N., & Chivkunova, O. B. (2000). Light stress induced pigment changes andevidence for anthocyanin photoprotection in apple fruit. Journal of Photochemistryand Photobiology (B), 55, 154−162.
Middleton, E. M., Corp, L. A., & Campbell, P. K. E. (2008). Comparison of measurementsand FluorMOD simulations for solar-induced chlorophyll fluorescence and reflec-tance of a corn crop under nitrogen treatments. International Journal of RemoteSensing, 29, 5193−5213.
Miller, J. R., Hare, E. W., & Wu, J. (1990). Quantitative characterization of the vegetationred edge reflectance.1. An inverted-Gaussian reflectance model. InternationalJournal of Remote Sensing, 11, 1755−1773.
Milton, N. M., Collins, W., Chang, S-H., & Schmidt, R. G. (1983). Remote detection ofmetal anomalies on Pilot Mountain, Randolph County, North Carolina. EconomicGeology, 78, 605−617.
Monteith, J. L. (1976). Vegetation and the atmosphere, vol. 2. (pp. )New York: AcademicPress.
Nakaji, T., Takeda, T., Fujinuma, Y., & Oguma, H. (2005). Effect of autumn senescence onthe relationship between the PRI and LUE of young Japanese larch trees. Phyton-Annales Rei Botanicae, 45, 535−542.
Neill, S., & Gould, K. S. (1999). Optical properties of leaves in relation to anthocyaninconcentration and distribution. Canadian Journal of Botany, 77, 1777−1782.
Nelson, N., & Yocum, C. F. (2006). Structure of function of photosystems I and II. AnnualReview of Plant Biology, 57, 521−565.
Nichol, C. J., Huemmrich, K. F., Black, T. A., Jarvis, P. G., Walthall, C. L., Grace, J., et al.(2000). Remote sensing of photosynthetic-light-use efficiency of boreal forest.Agricultural and Forest Meteorology, 101, 131−142.
Noomen, M. F., Skidmore, A. K., van der Meer, F. D., & Prins, H. H. T. (2006). Continuumremoved band depth analysis for detecting the effects of natural gas, methane andethane on maize reflectance. Remote Sensing of Environment, 105, 262−270.
Olson, J. M., & Blankenship, R. E. (2004). Thinking about the evolution of photosynth-esis. Photosynthetic Research, 80, 373−386.
Peñuelas, J., Baret, F., & Filella, I. (1995). Semi-empirical indices to assess carotenoids/chlorophyll a ratio from leaf spectral reflectance. Photosynthetica, 31, 221−230.
Peñuelas, J., Llusia, J., Piñol, J., & Filella, I. (1997). Photochemical reflectance index andleaf photosynthetic radiation-use-efficiency assessment in Mediterranean trees.International Journal of Remote Sensing, 18, 2863−2868.
Pinzón, J. E., Ustin, S. L., Castaneda, C. M., & Smith, M. O. (1998). Investigation of leafbiochemistry by hierarchical foreground/background analysis. IEEE Transactions onGeoscience and Remote Sensing, 36, 1913−1927.
Porra, R. J. (2002). The chequered history of the development and use of simultaneousequations for the accurate determination of chlorophylls a and b. PhotosynthesisResearch, 73, 149−156.
Ramsey, E., & Rangoonwala, A. (1995). Leaf optical property changes associated with theoccurrence of Spartina alterniflora dieback in coastal Louisiana related to remotesensing mapping. Photogrammetric Engineering and Remote Sensing, 71, 299−311.
Richards, J. T., Schuerger, A. C., Capelle, G., & Guikema, J. A. (2003). Laser-inducedfluorescence spectroscopy of dark-and light-adapted bean (Phaseolus vulgaris L.)and wheat (Triticum aestivum L.) plants grown under three irradiance levels andsubjected to fluctuating lighting conditions. Remote Sensing of Environment, 84,323−341.

S77S.L. Ustin et al. / Remote Sensing of Environment 113 (2009) S67–S77
Richardson, A. D., Duigan, S. P., & Berlyn, G. P. (2002). An evaluation of noninvasivemethods to estimate foliar chlorophyll content. New Phytologist, 153, 185−194.
Richter, T., & Fukshansky, L. (1996). Optics of a bifacial leaf: 1. A novel combinedprocedure for deriving the optical parameters. Photochemistry and Photobiology, 63,507−516.
Roberts, D. A., Ustin, S. L., Ogunjemiyo, S., Greenberg, J., Dobrowski, S. Z., Chen, J., et al.(2004). Spectral and structural measures of northwest forest vegetation at leaf tolandscape scale. Ecosystems, 7, 545−562.
Rock, B. N., Hoshizaki, T., & Miller, J. R. (1988). Comparison of in situ and airbornespectral measurements of the blue shift associated with forest decline. RemoteSensing of Environment, 24, 109−127.
Rühle, W., & Wild, A. (1979). The intensification of absorbances in leaves by light-dispersion. Planta, 146, 551−557.
Schaberg, P. G., Murakami, P. F., Turner, M. R., Heitz, H. K., & Hawley, G. J. (2008).Association of red coloration with senescence of sugar maple leaves in autumn.Trees- Structure and Function, 22, 573−578.
Seager, S., Turner, E. L., Schafer, J., & Ford, E. B. (2005). Vegetation's red edge: A possiblespectroscopic biosignature of extraterrestrial plants. Astrobiology, 5, 372−390.
Sellers, P. J. (1985). Canopy reflectance, photosynthesis and transpiration. InternationalJournal of Remote Sensing, 6, 1335−1372.
Sellers, P. J. (1987). Canopy reflectance, photosynthesis, and transpiration. 2. The role ofbiophysics in the linearity of their interdependence. Remote Sensing of Environment,21, 143−183.
Sims, D. A., & Gamon, J. A. (2002). Relationships between leaf pigment content andspectral reflectance across a wide range of species, leaf structures, and develop-mental stages. Remote Sensing of Environment, 81, 337−354.
Sims, D. A., Luo, H., Hastings, S., Oechel, W. C., Rahman, A. F., & Gamon, J. A. (2006).Parallel adjustments in vegetation greenness and ecosystem CO2 exchange inresponse to drought in a Southern California chaparral ecosystem. Remote Sensingof Environment, 103, 289−303.
Stylinski, C. D., Gamon, J. A., & Oechel, W. C. (2001). Seasonal patterns of reflectanceindices, carotenoid pigments and photosynthesis of evergreen chaparral species.Oecologia, 131, 366−374.
Ustin, S. L., & Curtiss, B. (1990). Spectral characteristics of ozone treated conifer species.Environmental and Experimental Botany, 30, 293−308.
Ustin, S. L., Jacquemoud, S., Zarco-Tejada, P. & Asner, G. (2004), Remote sensing ofenvironmental processes: State of the science and new directions,” in Manual ofRemote Sensing vol. 4. Remote Sensing for Natural Resource Management andEnvironmental Monitoring. S.L. Ustin, vol. Ed. ASPRS. New York: JohnWiley and Sons,pp. 679–730.
Ustin, S. L., Sanderson, E. W., Grossman, Y., Hart, Q. J., & Haxo, R. S. (1993). Relationshipsbetween pigment composition variation and reflectance for plant species from acoastal savannah in California. In Robert O. Green (Ed.), Fourth Annual JPL AirborneGeoscience Workshop (pp. 181−184). Washington, D.C.: NASA, Jet PropulsionLaboratory Oct. 25–27, 1993 JPL 93-26.
Vane, G., Green, R. O., Chrien, T. G., Enmark, H. T., Hansen, E. G., & Porter, W. M. (1993).The airborne visible/infrared imaging spectrometer (AVIRIS). Remote Sensing ofEnvironment, 44, 127−143.
Vogelmann, J. E., Rock, B. N., & Moss, D. M. (1993). Red edge spectral measurementsfrom sugar maple leaves. International Journal of Remote Sensing, 14, 1563−1575.
Wessman, C. A. (1990). Evaluation of canopy biochemistry. In R. J. Hobbs, & H. A.Mooney (Eds.), Remote Sensing of Biosphere Functioning (pp. 135−156). New York:Springer-Verlag.
Wolstencroft, R. D., & Raven, J. A. (2002). Photosynthesis: Likelihood of occurrence andpossibility of detection on Earth-like planets. Icarus, 157, 535−548.
Wright, I. J., Reich, P. B., Westoby, M., Ackerly, D. D., Baruch, Z., Bongers, F., et al. (2004).The worldwide leaf economics spectrum. Nature, 428, 821−827.
Yamada, N., & Fujimura, S. (1991). Nondestructive measurement of chlorophyll pigmentcontent in plant leaves from three-color reflectance and transmittance. AppliedOptics, 30, 3964−3973.
Yoder, B. J., & Pettigrew-Crosby, R. E. (1995). Predicting nitrogen and chlorophyllcontent and concentrations from reflectance spectra (400–2500 nm) at leaf andcanopy scales. Remote Sensing of Environment, 53, 199−211.
Zarco-Tejada, P. J., & Miller, J. R. (1999). Land cover mapping at BOREAS using red edgespectral parameters from CASI imagery. Journal of Geophysical Research, 104(D22),27921−27933.
Zarco-Tejada, P. J., Miller, J. R., Noland, T. L., Mohammed, G. H., & Sampson, P. H. (2001).Scaling-up and model inversion methods with narrowband optical indices forchlorophyll content estimation in closed forest canopies with hyperspectral data.IEEE Transactions on Geoscience and Remote Sensing, 39, 1491−1507.
Zarco-Tejada, P. J., Miller, J. R., Pedros, R., Verhoef, W., & Berger, M. (2006). FluorMODguiV3.0: A graphic user interface for the spectral simulation of leaf and canopychlorophyll fluorescence. Computers and Geosciences, 32, 577−591.
Zarco-Tejada, P. J., Pushnik, J. C., Dobrowski, S., & Ustin, S. L. (2003). Steady-statechlorophyll fluorescence detection from canopy derivative reflectance and double-peak effects. Remote Sensing of Environment, 84, 283−294.
Zarco-Tejada, P. J., Ustin, S. L., & Whiting, M. L. (2005). Temporal and spatialrelationships between within-field yield variability in cotton and high-spatialhyperspectral remote sensing imagery. Agronomy Journal, 97, 641−653.
Zarco-Tejada, P. J., Berjón, A., López-Lozano, R., Miller, J. R., Martín, P., Cachorro, V., et al.(2005). Assessing vineyard condition with hyperspectral indices: Leaf and canopyreflectance simulation in a row-structured discontinuous canopy. Remote Sensing ofEnvironment, 99, 271−287.
Zur, Y., Gitelson, A. A., Chivkunova, O. B., & Merzlyak, M. N. (2000). The spectralcontribution of carotenoids to light absorption and reflectance in green leaves. Pro-ceedings of the Second International onGeospatial Information inAgriculture and ForestryConference, Lake Buena Vista, Florida, 10–12 January, 2000, vol. 2. (pp. II−17–II-23).