Embed Size (px)
Citation preview

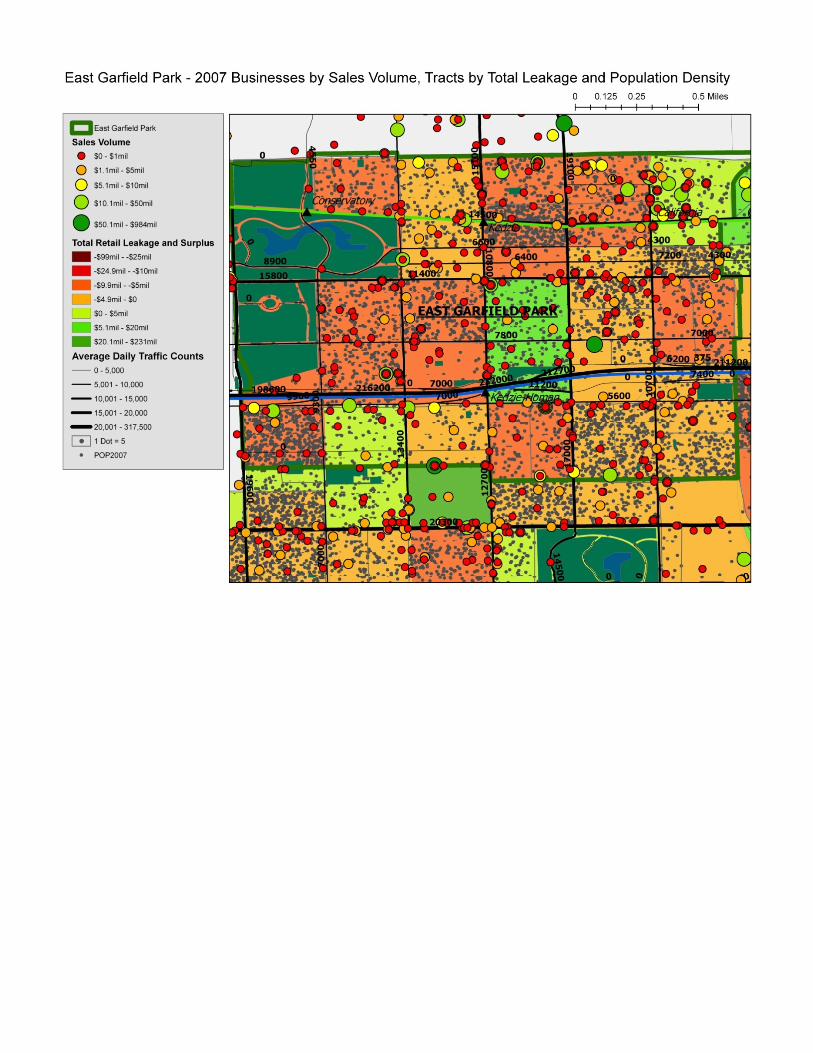
Retail Leakage
Leakage is an important gauge of both retail performance and retail demand. Leakage measures the difference between the potential sales for an area (based on the population and buying power of that area) and actual sales. This demonstrates whether money is coming into a neighborhood or “leaking” out of it.
In 2007 East Garfield Park’s total leakage was more than $60 million – roughly half of its buying potential. One reason for this was the low business presence. In retail, service, and restaurants, East Garfield Park had considerably fewer establishments per 1,000 residents than the city as a whole. Additionally, the substantial majority of those businesses were very small, with annual sales of less than $1million and fewer than five employees. So, despite high population density and decent traffic counts in many areas, there is substantial leakage.
Actual Sales Potential Sales (Leakage)/Surplus Total # of Businesses 2007 Sales
Total Retail Sales $58,569,354 $119,973,331 ($61,403,977) 73
Selected Retail Sectors Motor Vehicles and Parts $1,701,017 $22,678,067 ($20,977,050) 4Furniture and Home Furnishings
$6,972,863 $3,360,638 $3,612,225 5
Electronics and Appliances $0 $324,770 ($324,770) 0
Building Material and Garden Equipment
$1,362,509 $3,224,859 ($1,862,350) 4
Food and Beverage (Grocery)
$15,021,040 $20,765,233 ($5,744,193) 20
Health and Personal Care $2,180,880 $4,186,864 ($2,005,984) 3Gas Stations $2,629,031 $12,982,378 ($10,353,347) 2Clothing and Clothing Accessories
$10,865,086 $6,730,269 $4,134,817 2
Sporting, Hobby, Book, and Music
$1,105,868 $1,627,021 ($521,153) 3
General Merchandise $4,919,535 $15,910,182 ($10,990,647) 3Restaurants and Bars $7,260,096 $18,079,689 ($10,819,593) 19
Motor vehicle and auto parts sales were the largest single source of leakage, at approximately $21 million, while gas stations, general merchandise, and restaurants all surpassed $10 million in lost revenue. The furniture and clothing sectors were the neighborhood’s strengths, meeting community needs and attracting a combined surplus of approximately $7.7 million.

Access is an issue as well. For instance, only a very small portion of East Garfield Park and its population are within walking distance of a large, full-service grocery store. While smaller stores may fill immediate needs, they often lack fresh produce, pharmacies, and other amenities that improve quality of life. Similar accessibility constraints exist for other retail sectors