Embed Size (px)
Citation preview

What The Credit Crunch Has What The Credit Crunch Has Brought to Northern Virginia:Brought to Northern Virginia:The Retail & Real Estate The Retail & Real Estate PerspectivePerspective
Metropolitan Washington Council of GovernmentsMetropolitan Washington Council of Governments
Metropolitan Development Policy CommitteeMetropolitan Development Policy Committee July 8, 2009July 8, 2009

2
Order of Presentation
• Introduction
• Housing
• Consumer Spending
• Retail
• Banking
• Local Government
Why the Research
• Response to information gap: Local perspective on the credit crisis given less attention
• Focus on Northern Virginia– Our view: Regional economy
weakened but better off than other regions, especially close-in areas
• Employment levels higher than national average
• Proximity to Washington, DC• Advantage: relevant data in one place
– Local governments – great asset in the research
• Intention – Data-based trend analysis and
insights for policy making– Audience: local government,
business, thought leaders
2

3
Macroeconomic Adjustment I: Unsustainable Budget Deficit
• Federal government demand for funds rising to record levels– Support of financial and auto industries– Stimulus spending– Rising interest payments and entitlements– Inevitable assistance to certain states running large deficits?
• Financing sources constrained– Competition for the global savings: upward limit on foreign investment in U.S. debt – Rising U.S. savings rate from low level
• One rough estimate: Federal Government on pace to absorb 90% of savings pool
• Federal government competing with corporate, mortgage, consumer borrowers = upward pressure on rates without continued Fed intervention

4
Macroeconomic Adjustment 2:Consumer Behavior Shift
• Consumer spending led economic growth until the recession
• New dynamic: savings rate grows, consumer debt slows
• Consumer spending no longer counted on as dominant economic growth driver– Negative wealth effect– Employment anxiety– Probability of rising aggregate tax levels– Less Available Credit + Shift in Consumer Savings/Debt Attitude = Deleveraged Consumer
5
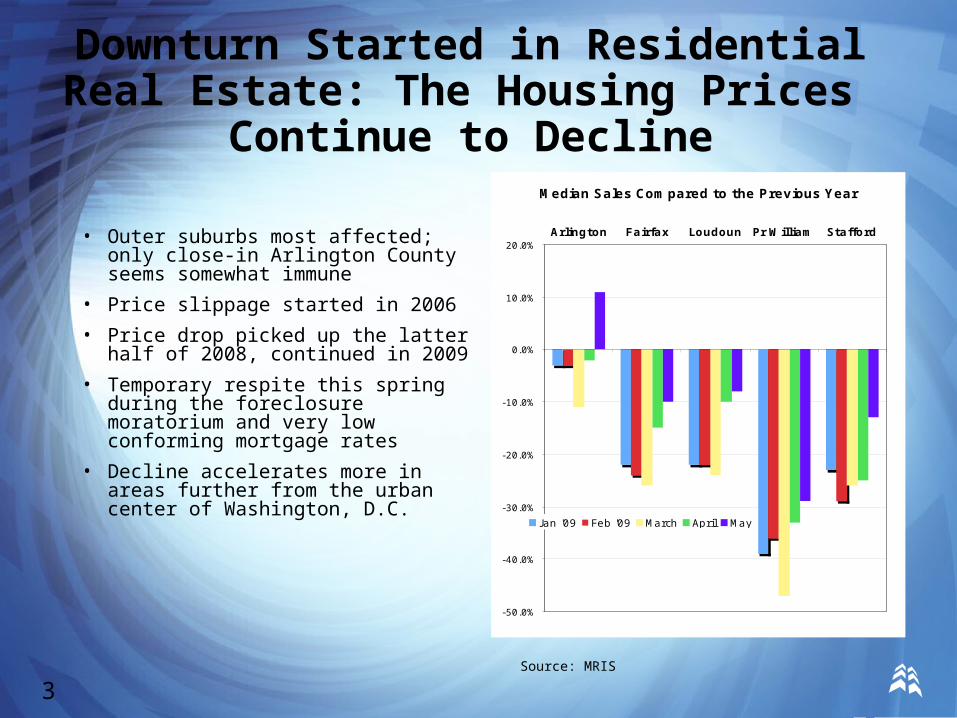
Downturn Started in Residential Real Estate: The Housing Prices
Continue to Decline
• Outer suburbs most affected; only close-in Arlington County seems somewhat immune
• Price slippage started in 2006
• Price drop picked up the latter half of 2008, continued in 2009
• Temporary respite this spring during the foreclosure moratorium and very low conforming mortgage rates
• Decline accelerates more in areas further from the urban center of Washington, D.C.
3Source: MRIS
Median Sales Compared to the Previous Year
-50.0%
-40.0%
-30.0%
-20.0%
-10.0%
0.0%
10.0%
20.0%Arlington Fairfax Loudoun Pr William Stafford
Jan '09 Feb '09 March April May

6
Residential Property Tax Assessments Fall in Line
• Sales prices falling more than anticipated
• Commercial assessments now declining as well.
• Steeper assessment declines on the way?
Notes: Assessments based on most recent county reports as of May 2009 and MRIS for median price change
4
Average Residential Assessment Value Change Compared to Median Price Change -
J an-May 2009
- 40.0%
- 35.0%
- 30.0%
- 25.0%
- 20.0%
- 15.0%
- 10.0%
- 5.0%
0.0%Arlington Fairfax Loudoun Pr William
CY2009 Assessment Change
Median. Sales Price Change J an- May'09
7
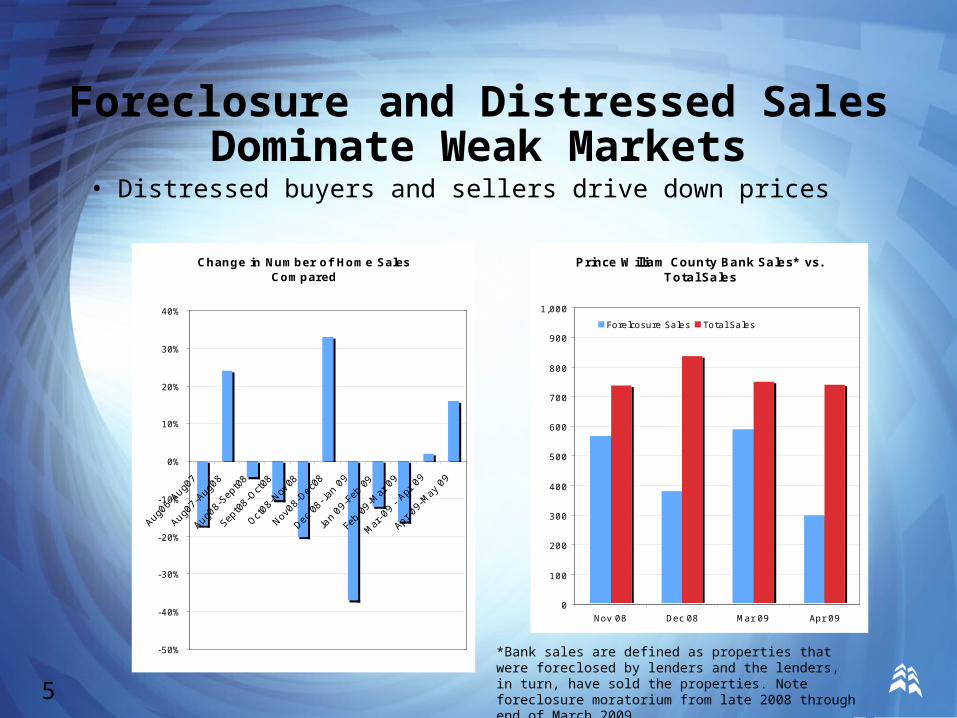
Foreclosure and Distressed Sales Dominate Weak Markets
• Distressed buyers and sellers drive down prices
*Bank sales are defined as properties that were foreclosed by lenders and the lenders, in turn, have sold the properties. Note foreclosure moratorium from late 2008 through end of March 2009.5
Source: MRIS
Change in Number of Home Sales Compared
-50%
-40%
-30%
-20%
-10%
0%
10%
20%
30%
40%
Aug0
6-Au
g07
Aug0
7-Au
g08
Aug0
8-Se
pt08
Sept
08-O
ct08
Oct08
-Nov
08
Nov08
-Dec
08
Dec 0
8-Ja
n 09
Jan
09-F
eb 0
9
Feb
09-M
ar 0
9
Mar
-09
- Ap
r 09
Apr 0
9-May
09
Prince William County Bank Sales* vs. Total Sales
0
100
200
300
400
500
600
700
800
900
1,000
Nov 08 Dec 08 Mar 09 Apr 09
Forelcosure Sales Total Sales

8
Foreclosures and Distressed Properties Rising
• Foreclosures increased significantly since mid-May, following the moratorium
– Incidence of foreclosures especially high in outlying areas: Using Realty Trac data prior to the moratorium effect, foreclosure actions increased from 2006 to 2008 (through October) as % of assessed residential properties
• Fairfax County: 0.2% to 2.6%
• Loudoun County: 0.3% to 3.1%
• Prince William County: 0.5% to 7.6%
• Rising delinquencies and falling prices lead to additional foreclosures and distressed properties
– More than 45% subprime mortgages and 25% Alt-A in Virginia delinquent as of Mar 31 according to CoreLogic data
– Nearly one in five mortgaged properties “upside down” or negative equity as of year-end 2008.
Negative Equity in Virginia - Properties Outstanding
MortgagesNegative Equity
MortgagesNear** Negative
Equity Mortgages Negative Equity ShareNear** Negative
Equity ShareOct '08 1,110,253 177,005 238,414 15.9% 21.5%Dec '08 1,118,334 219,282 280,759 19.6% 25.1%Note: This data only includes properties with a mortgage. Non-mortgaged properties are by definition not included.** Defined as properties within 5% of being in a negative equity position.Source: First American CoreLogic
6
Foreclosures Surging Post-Moratorium
-
2,000
4,000
6,000
8,000
10,000
12,000
14,000
16,000
18,000
20,000
5/15/2008 6/11/2009

9
Negative and Near-Negative Equity in Mortgaged Properties by State and Nationally
Year-End 2008
7
State Mortgages
Negative Equity
Mortgages
Near** Negative Equity
Mortgages
Negative Equity Share
Near** Negative Equity Share State Mortgages
Negative Equity
Mortgages
Near** Negative Equity
MortgagesNegative
Equity Share
Near** Negative
Equity Share
Alabama 243,474 20,626 34,934 8.5% 14.3% Nebraska 181,129 30,116 45,079 16.6% 24.9%
Alaska 72,987 9,730 13,379 13.3% 18.3% Nevada 608,374 335,340 359,117 55.1% 59.0%
Arizona 1,283,174 407,604 477,244 31.8% 37.2% New Hampshire 164,082 33,536 44,700 20.4% 27.2%
Arkansas 171,577 28,685 45,496 16.7% 26.5% New Jersey 1,744,333 168,915 227,923 9.7% 13.1%
California 6,452,766 1,901,066 2,174,955 29.5% 33.7% New Mexico 186,500 15,329 21,770 8.2% 11.7%
Colorado 1,048,437 225,074 292,840 21.5% 27.9% New York 1,554,395 73,811 111,765 4.7% 7.2%
Connecticut 682,719 62,260 87,017 9.1% 12.7% North Carolina 1,197,288 134,508 218,655 11.2% 18.3%
Delaware 147,900 16,700 23,617 11.3% 16.0% North Dakota NA NA NA NA NA
Florida 4,245,623 1,284,679 1,479,234 30.3% 34.8% Ohio 1,888,878 435,107 567,344 23.0% 30.0%
Georgia 1,458,185 335,668 470,216 23.0% 32.2% Oklahoma 308,095 33,779 62,323 11.0% 20.2%
Hawaii 202,226 12,627 17,225 6.2% 8.5% Oregon 647,059 57,446 80,632 8.9% 12.5%
Idaho 191,050 26,993 35,292 14.1% 18.5% Pennsylvania 1,407,328 88,274 132,719 6.3% 9.4%
Illinois 2,075,097 236,936 332,261 11.4% 16.0% Rhode Island 205,881 32,357 41,192 15.7% 20.0%
Indiana 408,062 55,004 77,353 13.5% 19.0% South Carolina 459,705 53,770 83,745 11.7% 18.2%
Iowa 210,620 39,194 60,385 18.6% 28.7% South Dakota NA NA NA NA NA
Kansas 200,728 35,212 47,941 17.5% 23.9% Tennessee 728,981 119,442 174,487 16.4% 23.9%
Kentucky 205,813 31,393 49,734 15.3% 24.2% Texas 2,776,017 497,361 677,397 17.9% 24.4%
Louisiana 124,980 16,186 21,849 13.0% 17.5% Utah 418,176 56,763 74,770 13.6% 17.9%
Maine NA NA NA NA NA Vermont NA NA NA NA NA
Maryland 1,308,860 170,849 228,615 13.1% 17.5% Virginia 1,118,334 219,282 280,759 19.6% 25.1%
Massachusetts 1,393,027 151,750 205,524 10.9% 14.8% Washington 1,280,834 125,992 173,891 9.8% 13.6%
Michigan 1,149,588 459,385 549,672 40.0% 47.8% Washington, DC 99,973 14,915 19,216 14.9% 19.2%
Minnesota 442,040 64,643 87,183 14.6% 19.7% West Virginia NA NA NA NA NA
Mississippi NA NA NA NA NA Wisconsin 428,027 69,414 94,991 16.2% 22.2%
Missouri 664,563 100,507 135,161 15.1% 20.3% Wyoming NA NA NA NA NA
Montana 87,671 6,570 9,164 7.5% 10.5% Nation 41,958,989 8,311,496 10,471,519 19.8% 25.0%
* This data only includes properties with a mortgage as of December 2008. Non-mortgaged properties are by definition not included.
** Defined as properties within 5% of being in a negative equity position.
Source: First Americn Core Logic
10
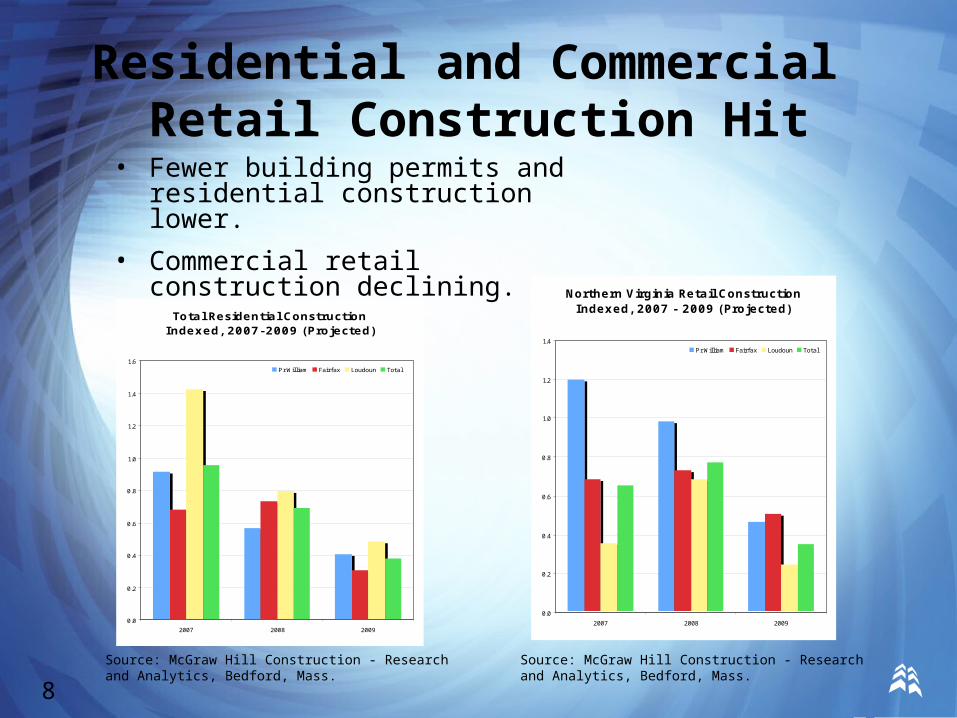
Residential and Commercial Retail Construction Hit
• Fewer building permits and residential construction lower.
• Commercial retail construction declining.
8
Source: McGraw Hill Construction - Research and Analytics, Bedford, Mass.
Source: McGraw Hill Construction - Research and Analytics, Bedford, Mass.
Total Residential Construction Indexed, 2007-2009 (Projected)
0.0
0.2
0.4
0.6
0.8
1.0
1.2
1.4
1.6
2007 2008 2009
Pr William Fairfax Loudoun Total2006=1
Northern Virginia Retail Construction Indexed, 2007 - 2009 (Projected)
0.0
0.2
0.4
0.6
0.8
1.0
1.2
1.4
2007 2008 2009
Pr William Fairfax Loudoun Total2006=1

11
Auto Sales: Example of Credit Crunch Effect on Consumer
Spending• Similar to housing, other consumer purchases drop, especially those that are
credit-dependent
• Example: Northern Virginia new auto sales – fall in sales accelerated in latter part of year and early 2009, especially domestic autos. April-May declines slowed by domestic auto dealer inventory liquidation
9Source: Virginia Auto Dealers Association Source: Virginia Auto Dealers Association
Market Share Compared to Year Ago
0.0%
10.0%
20.0%
30.0%
40.0%
50.0%
60.0%
70.0%
80.0%
Mar 08 Mar 09
Domestic Imported
Change in Auto Sales Compared to a Year Ago
-60.0%
-50.0%
-40.0%
-30.0%
-20.0%
-10.0%
0.0%
J an 09 Feb 09 Mar 09 Apr 09 May 09

12
Taxable Sales Fall More in Markets Distant from Washington, D.C.
-25.00%
-20.00%
-15.00%
-10.00%
-5.00%
0.00%
5.00%
10.00%
ArlingtonCounty
Fairfax County Mannassas
Change in Taxable Sales, 2007-09
Less Consumer Spending Slows Demand For Retail Space
13
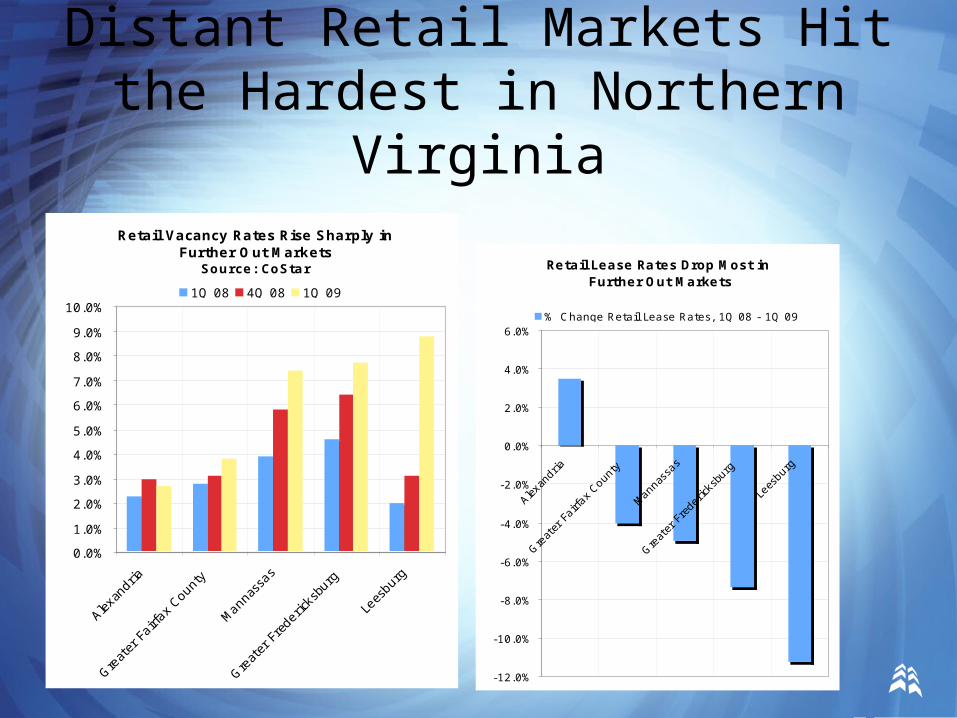
Distant Retail Markets Hit the Hardest in Northern Virginia
Retail Vacancy Rates Rise Sharply in Further Out Markets
Source: CoStar
0.0%
1.0%
2.0%
3.0%
4.0%
5.0%
6.0%
7.0%
8.0%
9.0%
10.0%
Alexan
dria
Great
er F
airfa
x Cou
nty
Manna
ssas
Great
er F
rede
ricks
burg
Lees
burg
1Q 08 4Q 08 1Q 09
Retail Lease Rates Drop Most in Further Out Markets
-12.0%
-10.0%
-8.0%
-6.0%
-4.0%
-2.0%
0.0%
2.0%
4.0%
6.0%
Alexan
dria
Great
er F
airfa
x Cou
nty
Manna
ssas
Great
er F
rede
ricks
burg
Lees
burg
% Change Retail Lease Rates, 1Q 08 - 1Q 09

14
Distant Retail Markets Also Hit the Hardest Region Wide
Retail Vacancy Rates Rise in Further Out Markets
0.0%
1.0%
2.0%
3.0%
4.0%
5.0%
6.0%
7.0%
8.0%
9.0%
CapitalHill
Beth-ChevyChase
D.C.Metro
Region
St.Mary'sCounty
NorthPrince
GeorgesCounty
1Q 08 1Q 09

15
Economic Downturn Weakens Regional Office Market
Office Vacancy Rates Show Same Pattern, Especially in Further Out Markets
0.0%2.0%4.0%6.0%8.0%
10.0%12.0%14.0%16.0%18.0%20.0%
Alexan
dria
Dulles
Cor
ridor
Downt
own
D.C.
Bethe
sda-
Chevy
Cha
se
North
Prin
ce G
eorg
es C
ount
y
2Q 07 2Q 09
16
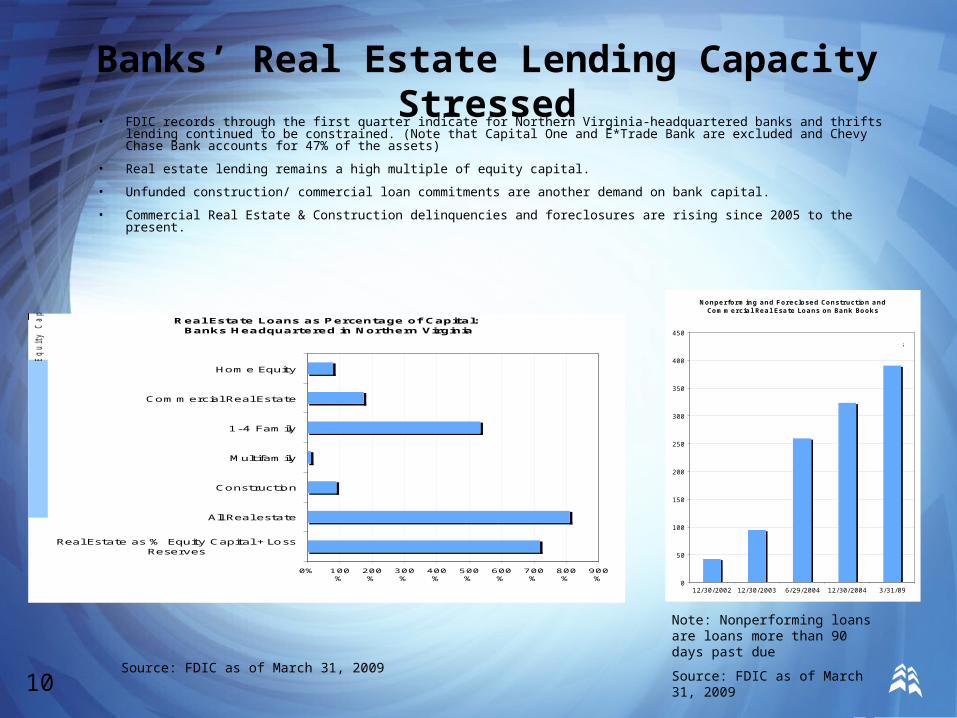
Banks’ Real Estate Lending Capacity Stressed• FDIC records through the first quarter indicate for Northern Virginia-headquartered banks and thrifts lending continued to
be constrained. (Note that Capital One and E*Trade Bank are excluded and Chevy Chase Bank accounts for 47% of the assets)
• Real estate lending remains a high multiple of equity capital.
• Unfunded construction/ commercial loan commitments are another demand on bank capital.
• Commercial Real Estate & Construction delinquencies and foreclosures are rising since 2005 to the present.
10
Note: Nonperforming loans are loans more than 90 days past due
Source: FDIC as of March 31, 2009Source: FDIC as of March 31, 2009
Real Estate Loans as Percentage of Capital: Banks Headquartered in Northern Virginia
0% 100%
200%
300%
400%
500%
600%
700%
800%
900%
Real Estate as % Equity Capital +LossReserves
All Real estate
Construction
Multifamily
1-4 Family
Commercial Real Estate
Home Equity
Rea
l E
sta
te
Lo
an
s a
s a
%
o
f E
qu
ity
C
ap
ita
l
Nonperforming and Foreclosed Construction and Commercial Real Esate Loans on Bank Books
0
50
100
150
200
250
300
350
400
450
12/30/2002 12/30/2003 6/29/2004 12/30/2004 3/31/09
in $ millions

17
Local Government Feels the Heat
• Counties are making plans for budget cuts this fiscal year, in some cases severe
– Bigger cuts this fiscal year (FY ’10)
– Local government revenue base closely tied to real estate
– Recordation taxes lower this fiscal year; some jurisdictions budget increase in FY ’10 assuming more distressed/foreclosure sales
11
Decline in Recordation Taxes: FY 09
-16.0%
-14.0%
-12.0%
-10.0%
-8.0%
-6.0%
-4.0%
-2.0%
0.0%Fairfax Loudoun
PrinceWilliam

18
Property Taxes – Major Source of Local Government Revenues
• Property taxes, on average, make up over 60 percent of the local revenue base and residential assessments, on average, make up over 70 percent of the property tax base.
12
Tax Rate Percentage Change vs. Average Sales Price Change
- 40.0%
- 30.0%
- 20.0%
- 10.0%
0.0%
10.0%
20.0%
30.0%
Arlington Fairfax Loudoun Prince William
% Increase in Property Tax Rate FY10 Decrease in Avg. Median Sales Price - Jan-May 09

19
Sales Tax Revenues Lower in CY 2008 and 2009
• Sales taxes are another important local government revenue source.• Recession has slowed sales tax revenues and the impact is greater
this year.
13 Source: Commonwealth of Virginia
Sales Tax Declines in Selected Counties
-1.9%
-1.0%
-2.0%
-0.4%
-4.3%
-9.0%
-10.0% -8.0% -6.0% -4.0% -2.0% 0.0%
Prince William
Loudoun
Fairfax
2007 to 2008 J an-Apr '08 to J an-Apr 09 (Average of the Four Months)
20
Summary• Northern Virginia in better economic shape than other regions but credit crunch has
significant effects at the local level – most negative in further out jurisdictions.
• Regional economic deterioration started with residential real estate - still in decline: prices dropping, delinquencies rising - distressed sellers major driver of the market.
• Consumer credit pulled back, cuts retail spending, outlook for commercial retail properties and demand for retail construction.
• Biggest effect on commercial real estate markets furthest away from Washington, DC center.
• Eventual recovery will be from a lower base.
• Local government revenues primarily real estate dependent - downward trend continuing, accelerating in FY 10.
• No easy choices, economic pain - public policy response critical variable.
16