Embed Size (px)
Citation preview
Ressources Minérales pour les ENergies
Renouvelables
Olivier Vidal, CNRS, Isterre
MI 24/03/2015
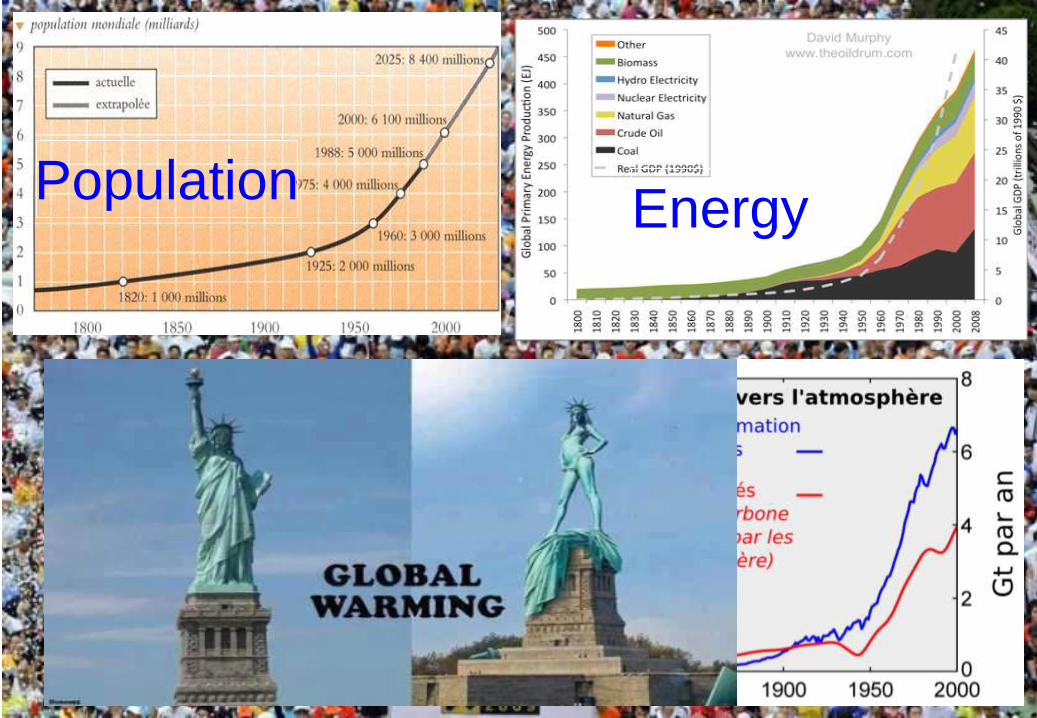
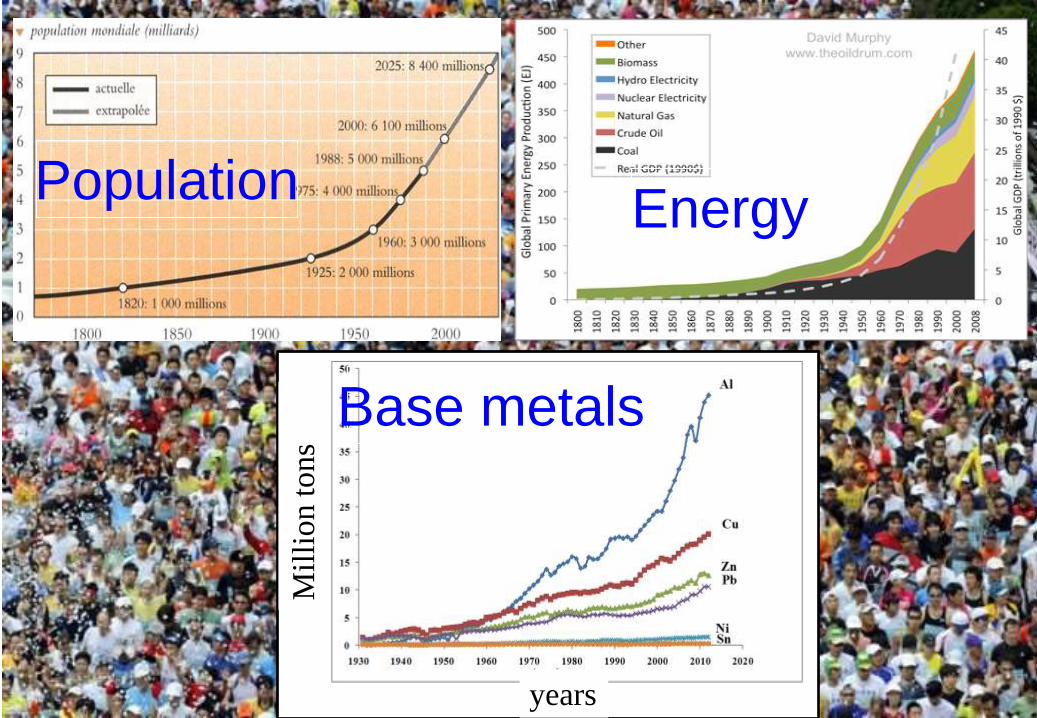
Population Energy
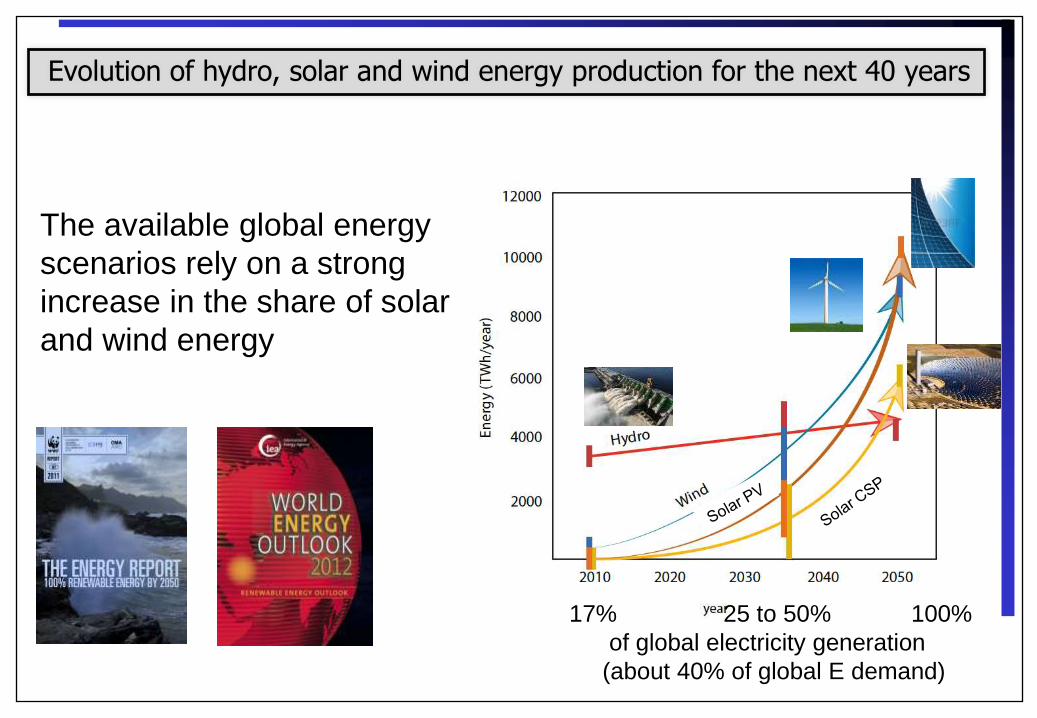
17% 25 to 50% 100%
of global electricity generation
(about 40% of global E demand)
Evolution of hydro, solar and wind energy production for the next 40 years
The available global energy
scenarios rely on a strong
increase in the share of solar
and wind energy
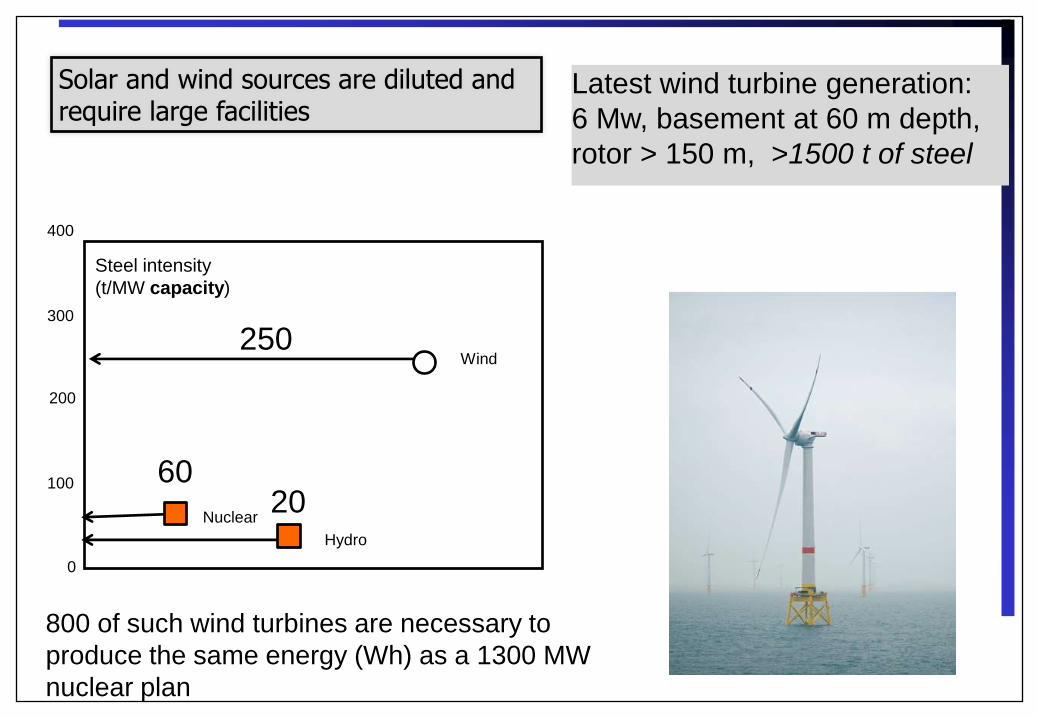
Solar and wind sources are diluted and require large facilities
Latest wind turbine generation:
6 Mw, basement at 60 m depth,
rotor > 150 m, >1500 t of steel
800 of such wind turbines are necessary to
produce the same energy (Wh) as a 1300 MW
nuclear plan
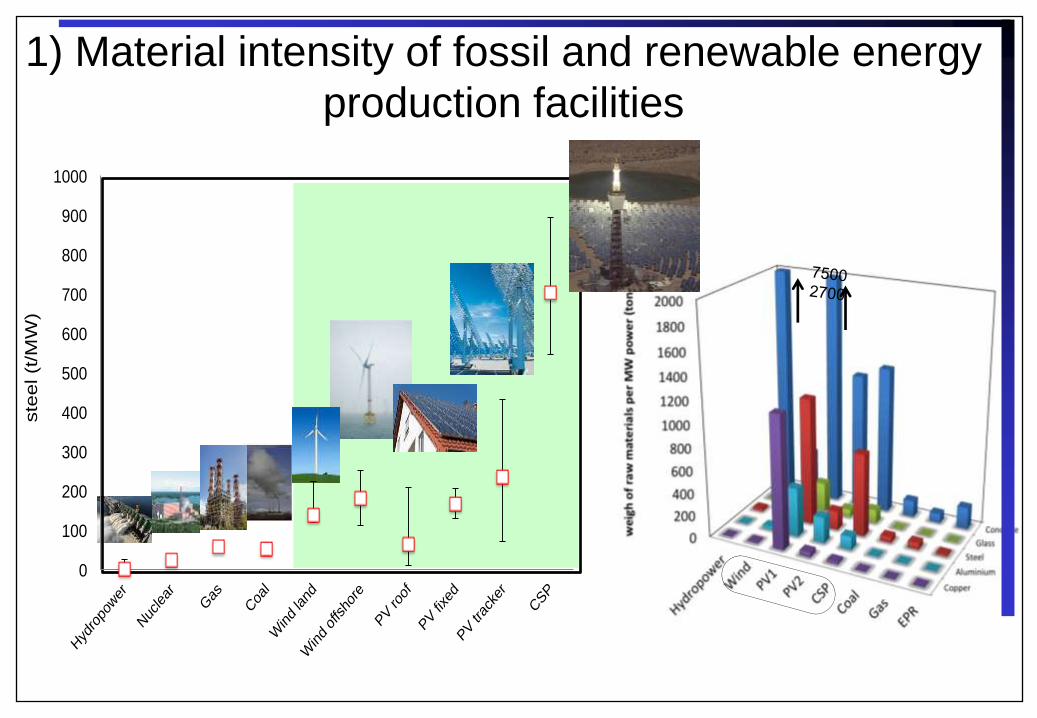
Steel intensity
(t/MW capacity)
400
300
200
100
0
Wind 250
20 Nuclear
Hydro
60
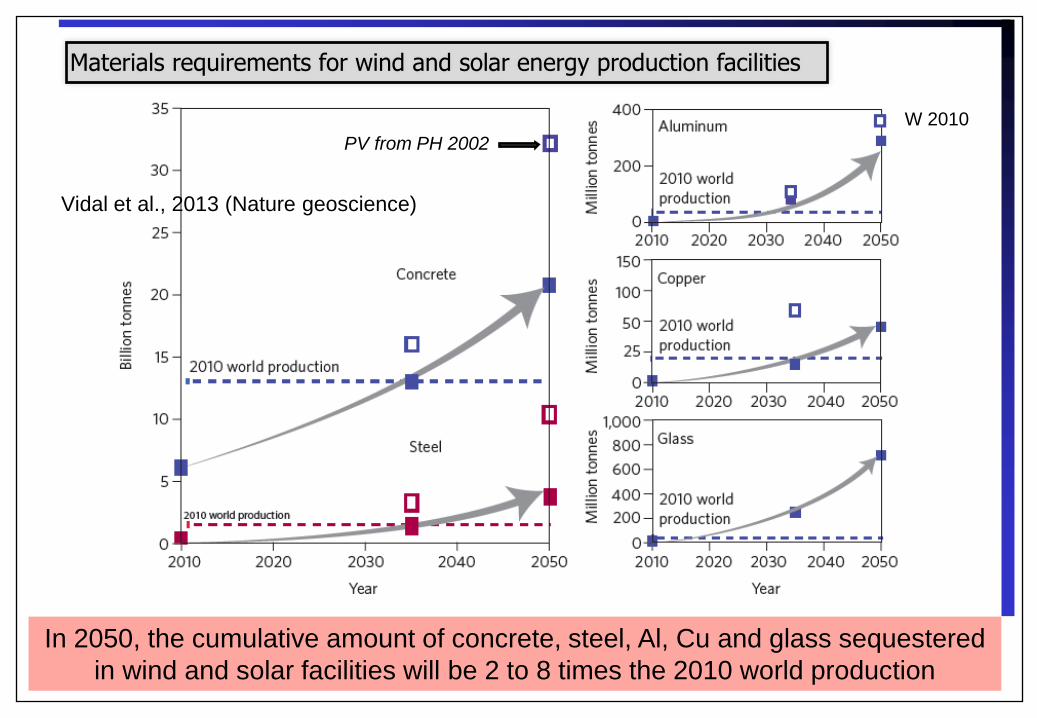
In 2050, the cumulative amount of concrete, steel, Al, Cu and glass sequestered
in wind and solar facilities will be 2 to 8 times the 2010 world production
PH 2002
PH 2002
PV from PH 2002
W 2010
Materials requirements for wind and solar energy production facilities
Vidal et al., 2013 (Nature geoscience)
Mil
lion t
ons
years
Population Energy
Base metals
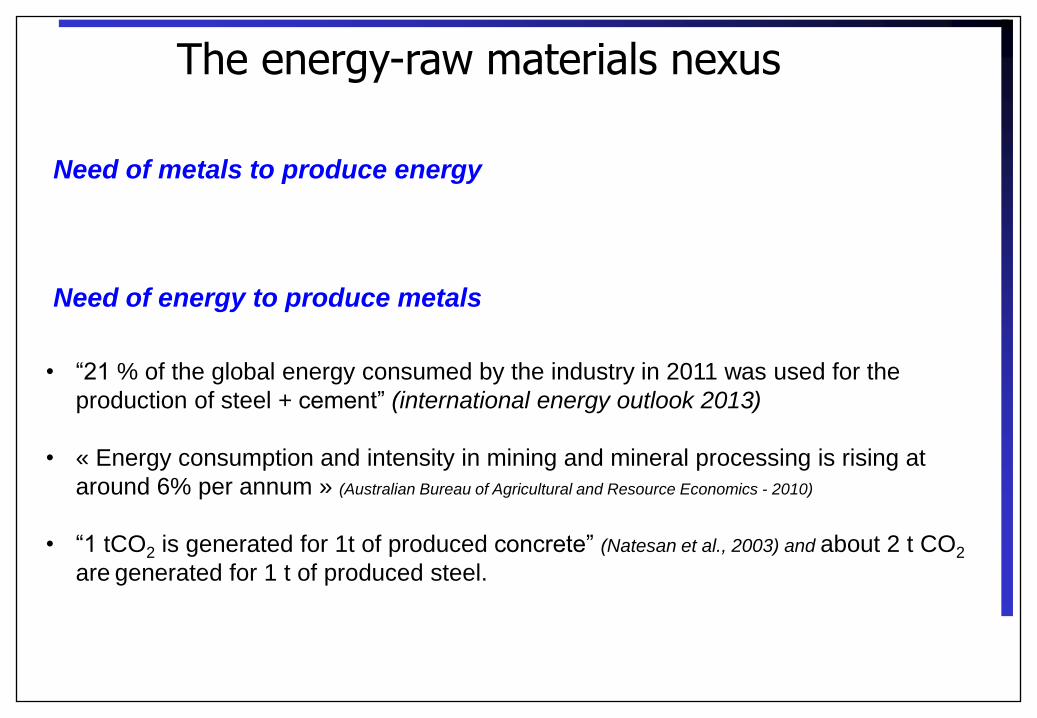
Need of energy to produce metals
• “21 % of the global energy consumed by the industry in 2011 was used for the
production of steel + cement” (international energy outlook 2013)
• « Energy consumption and intensity in mining and mineral processing is rising at
around 6% per annum » (Australian Bureau of Agricultural and Resource Economics - 2010)
• “1 tCO2 is generated for 1t of produced concrete” (Natesan et al., 2003) and about 2 t CO2
are generated for 1 t of produced steel.
Need of metals to produce energy
The energy-raw materials nexus
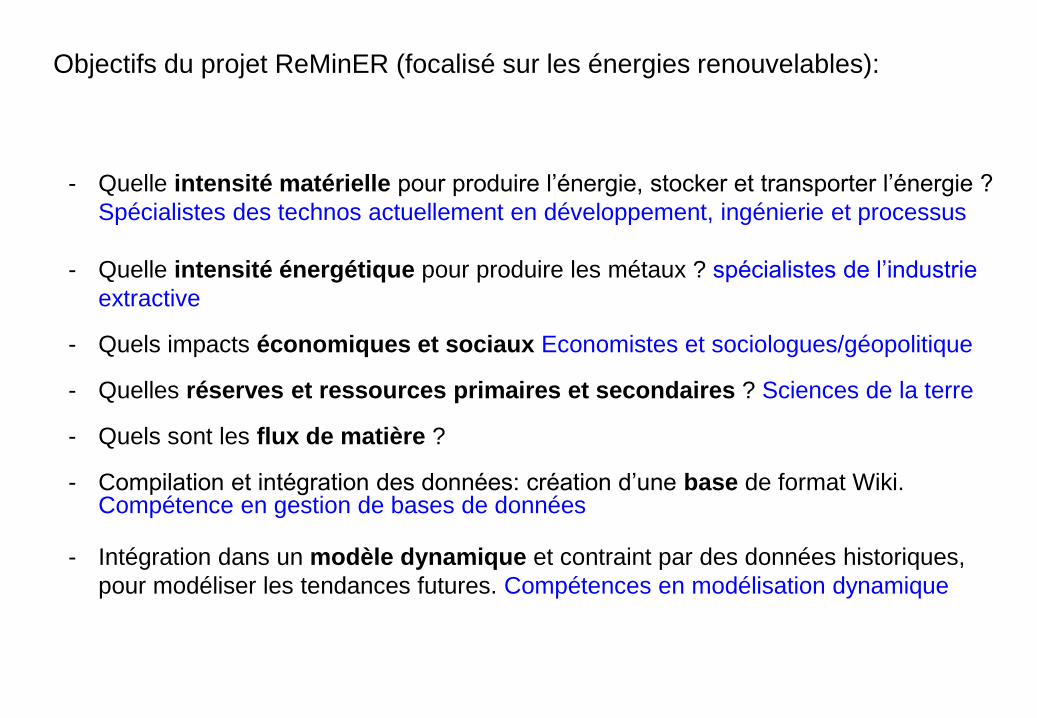
Objectifs du projet ReMinER (focalisé sur les énergies renouvelables):
- Quelle intensité matérielle pour produire l’énergie, stocker et transporter l’énergie ?
Spécialistes des technos actuellement en développement, ingénierie et processus
- Quelle intensité énergétique pour produire les métaux ? spécialistes de l’industrie
extractive - Quels impacts économiques et sociaux Economistes et sociologues/géopolitique - Quelles réserves et ressources primaires et secondaires ? Sciences de la terre
- Quels sont les flux de matière ? - Compilation et intégration des données: création d’une base de format Wiki.
Compétence en gestion de bases de données
- Intégration dans un modèle dynamique et contraint par des données historiques,
pour modéliser les tendances futures. Compétences en modélisation dynamique
0
100
200
300
400
500
600
700
800
900
1000
Hyd
ropo
wer
Nuc
lear
Gas
Coa
l
Wind land
Wind offsho
re
PV ro
of
PV fixe
d
PV tr
acke
r
CSP
ste
el (t
/MW
)
1) Material intensity of fossil and renewable energy
production facilities
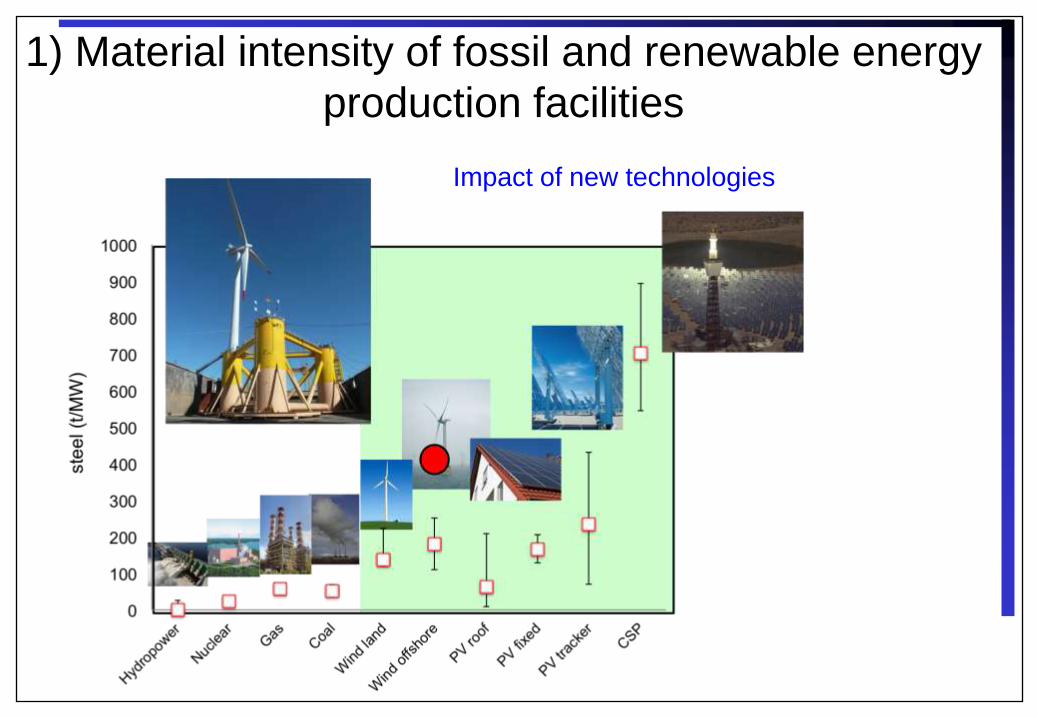
1) Material intensity of fossil and renewable energy
production facilities
Impact of new technologies
0.00
2.00
4.00
6.00
8.00
10.00
12.00
14.00
Hydropower
Nuclear
Gas
Coal
Wland
Wsea
PVroof
PVfixed
PVtracker
CSP
copper(t/M
W)
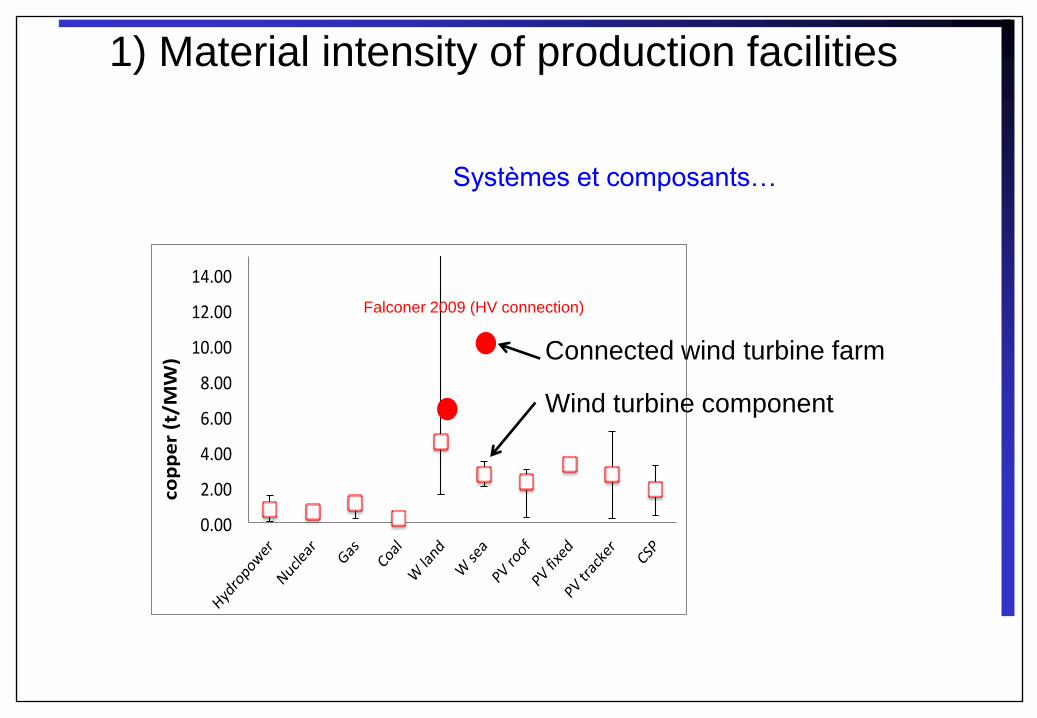
Falconer 2009 (HV connection)
Wind turbine component
Connected wind turbine farm
1) Material intensity of production facilities
Systèmes et composants…
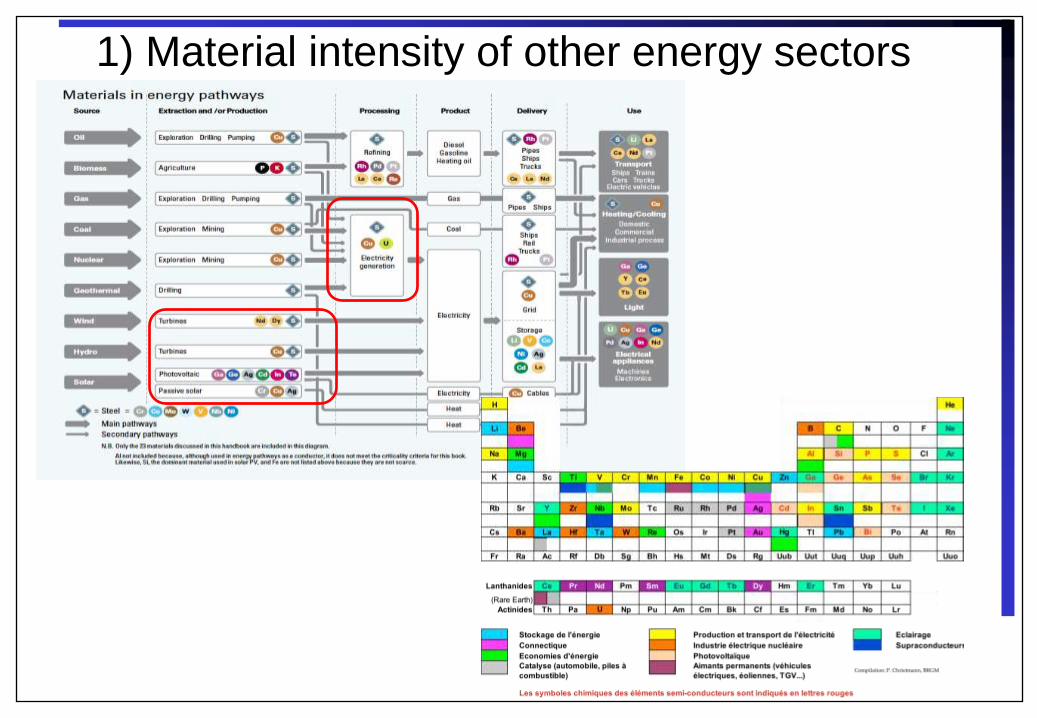
1) Material intensity of other energy sectors
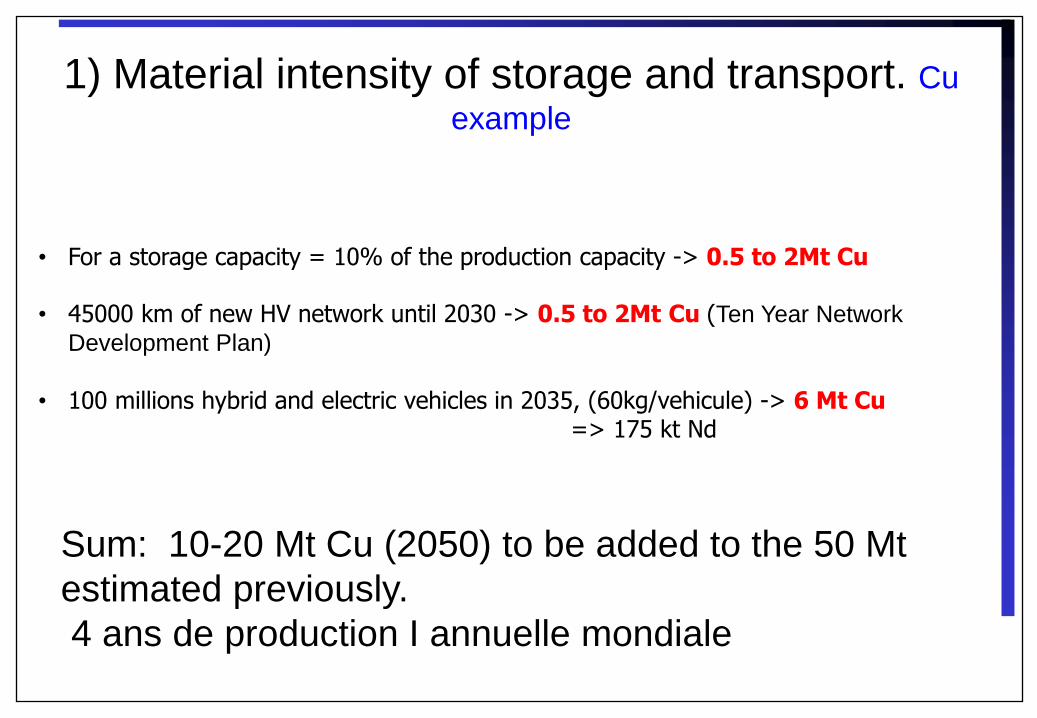
• For a storage capacity = 10% of the production capacity -> 0.5 to 2Mt Cu
• 45000 km of new HV network until 2030 -> 0.5 to 2Mt Cu (Ten Year Network
Development Plan)
• 100 millions hybrid and electric vehicles in 2035, (60kg/vehicule) -> 6 Mt Cu => 175 kt Nd
Sum: 10-20 Mt Cu (2050) to be added to the 50 Mt
estimated previously.
4 ans de production I annuelle mondiale
1) Material intensity of storage and transport. Cu
example
0
50
100
150
200
250
300
350
0 0.5 1 1.5 2 2.5 3 3.5
Energyconsump
oninM
J/kg
Oreheadgrade(%Cu)
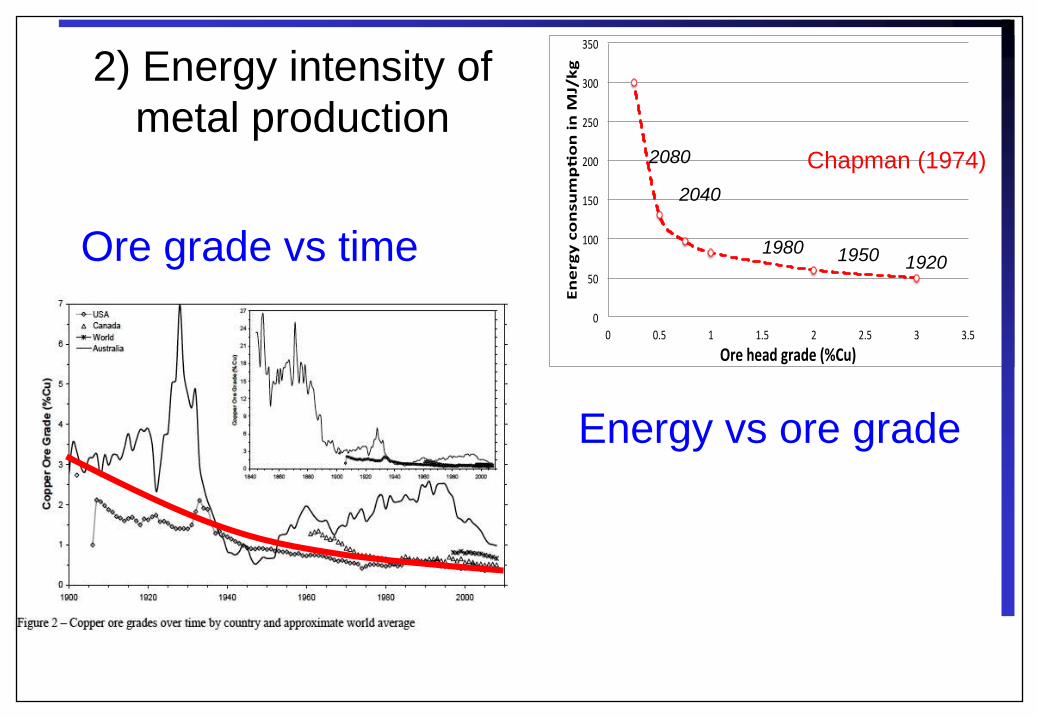
2) Energy intensity of
metal production
Ore grade vs time
Energy vs ore grade
Chapman (1974) 2080
2040
1980 1950 1920
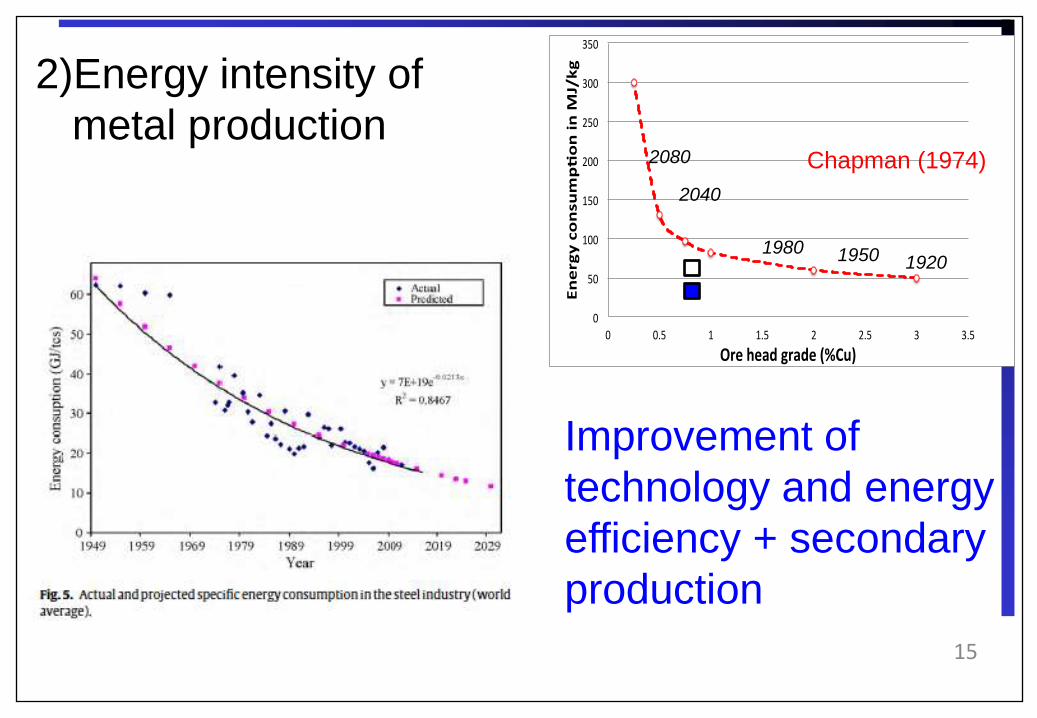
2)Energy intensity of
metal production
Improvement of
technology and energy
efficiency + secondary
production
15
0
50
100
150
200
250
300
350
0 0.5 1 1.5 2 2.5 3 3.5
Energyconsump
oninM
J/kg
Oreheadgrade(%Cu)
Chapman (1974) 2080
2040
1980 1950 1920
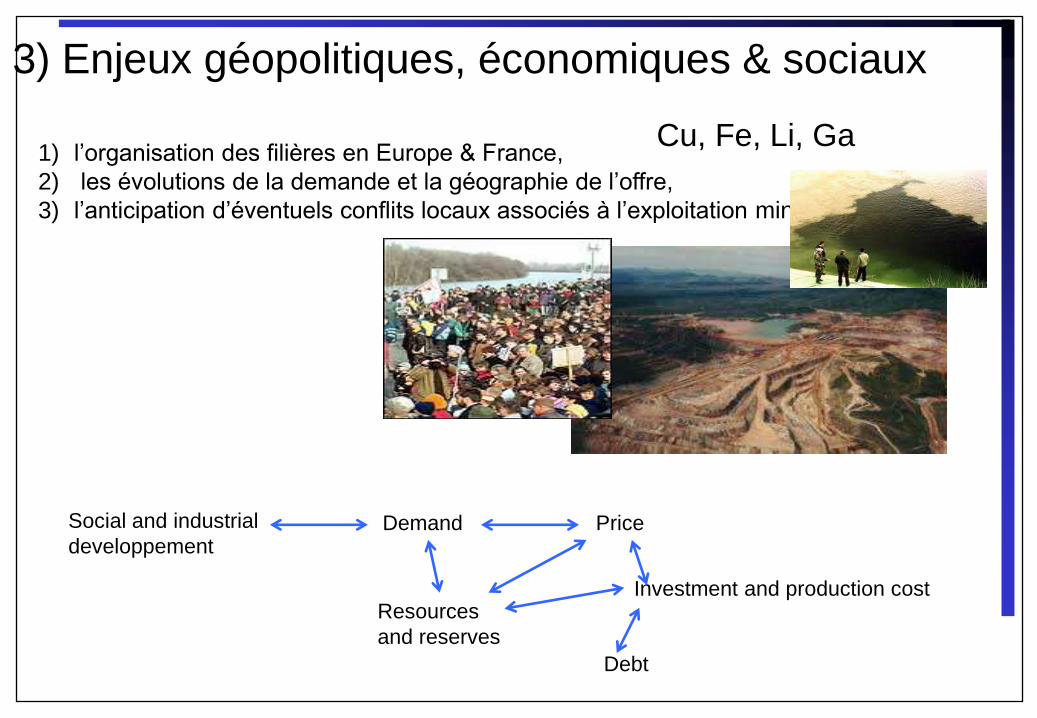
3) Enjeux géopolitiques, économiques & sociaux
1) l’organisation des filières en Europe & France,
2) les évolutions de la demande et la géographie de l’offre,
3) l’anticipation d’éventuels conflits locaux associés à l’exploitation minière.
Cu, Fe, Li, Ga
Demand Social and industrial
developpement
Resources
and reserves
Price
Investment and production cost
Debt
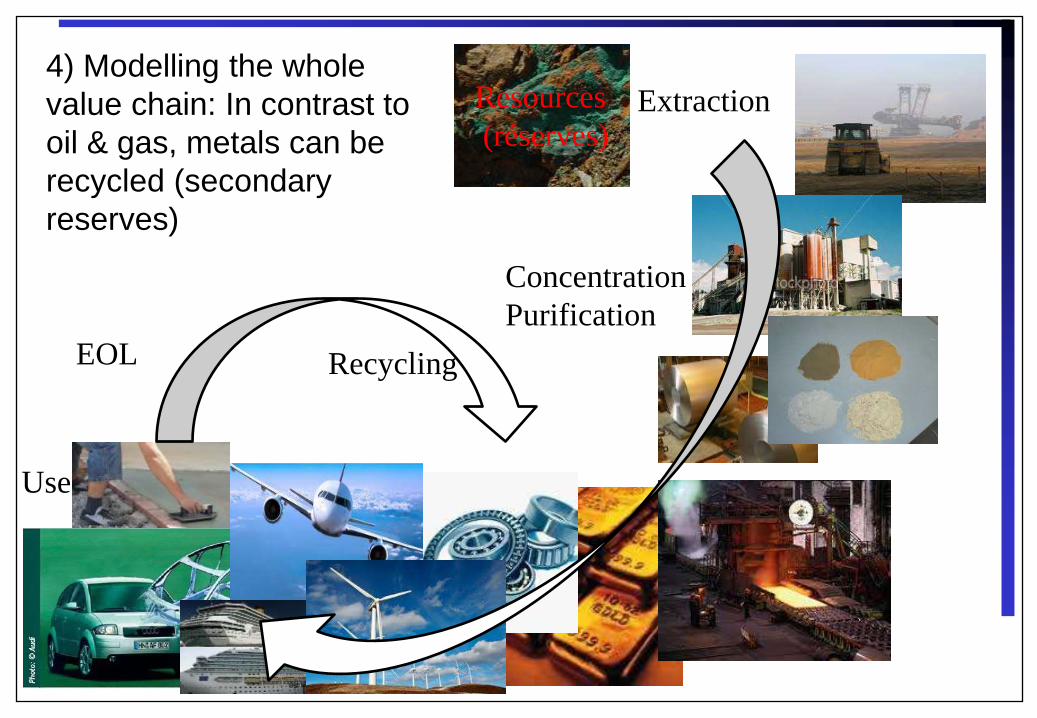
Extraction
Use
Concentration
Purification
Resources
(réserves)
Recycling
4) Modelling the whole
value chain: In contrast to
oil & gas, metals can be
recycled (secondary
reserves)
EOL
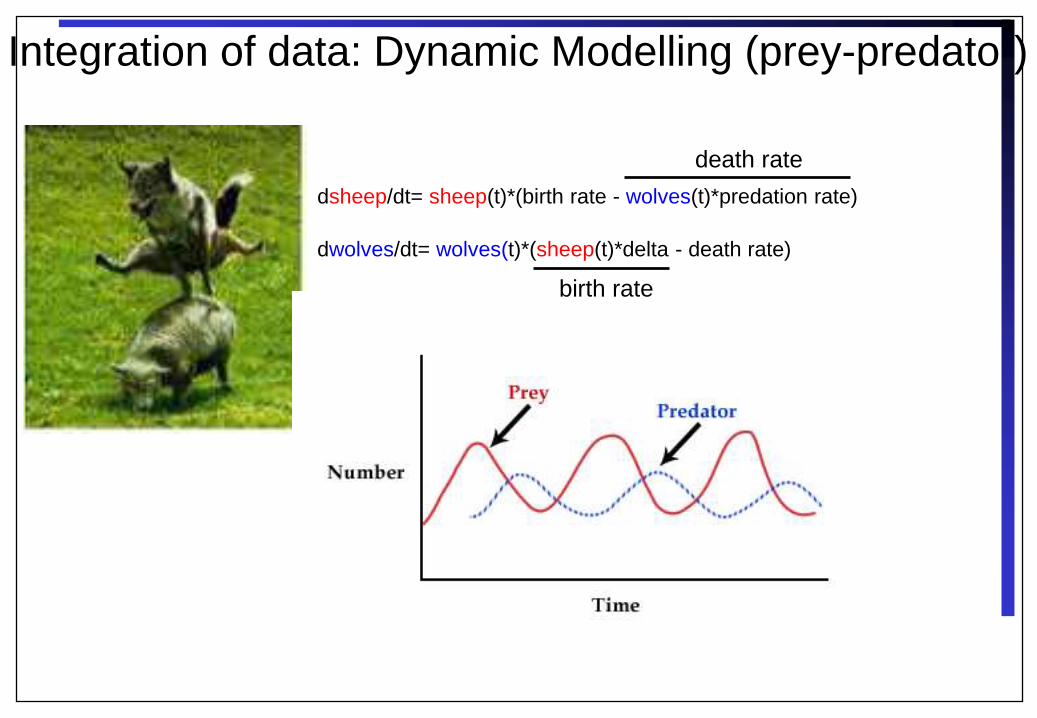
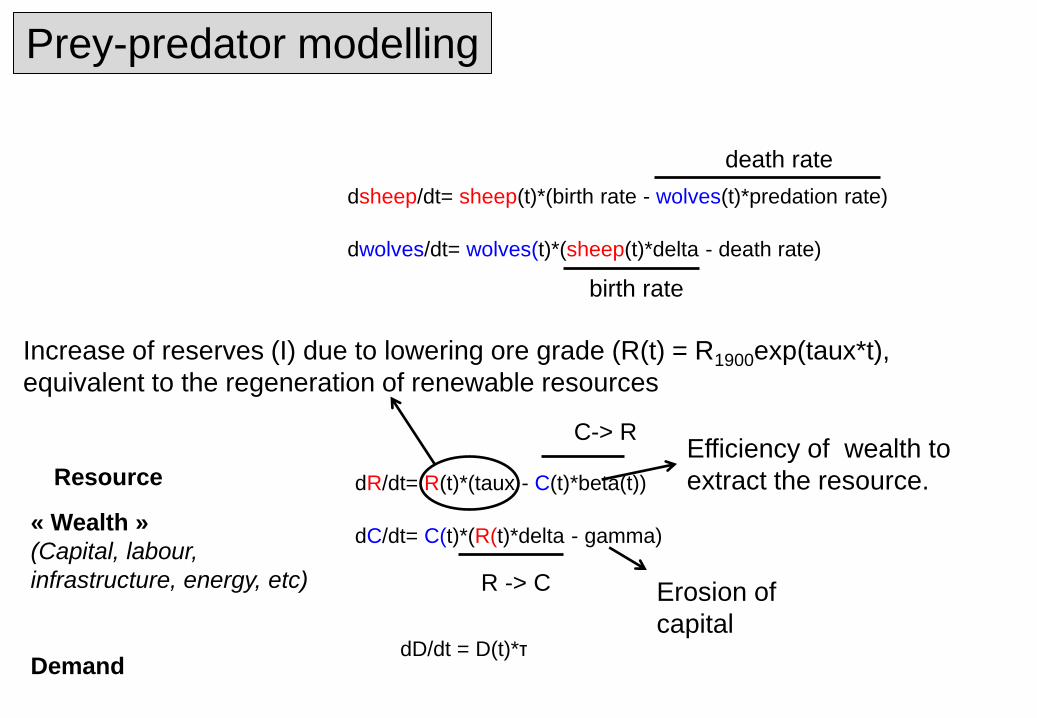
dsheep/dt= sheep(t)*(birth rate - wolves(t)*predation rate)
dwolves/dt= wolves(t)*(sheep(t)*delta - death rate)
death rate
birth rate
Integration of data: Dynamic Modelling (prey-predator)
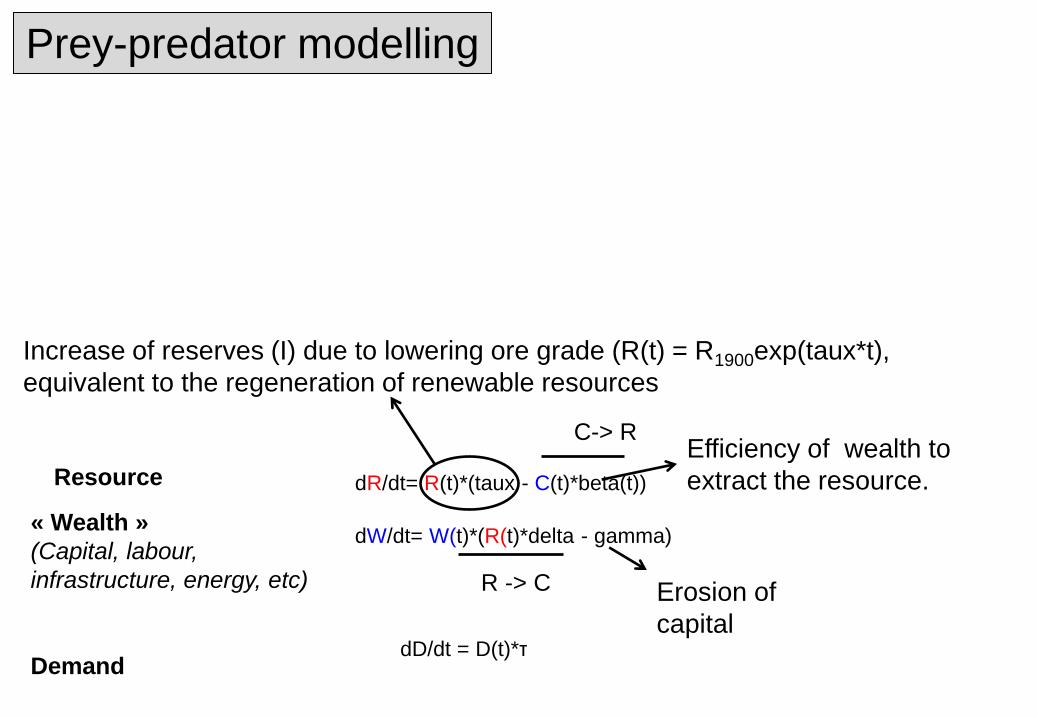
Resource
« Wealth »
(Capital, labour,
infrastructure, energy, etc)
Demand
Prey-predator modelling
dD/dt = D(t)*τ
dR/dt= R(t)*(taux - C(t)*beta(t))
dW/dt= W(t)*(R(t)*delta - gamma)
C-> R
R -> C
Increase of reserves (I) due to lowering ore grade (R(t) = R1900exp(taux*t),
equivalent to the regeneration of renewable resources
Erosion of
capital
Efficiency of wealth to
extract the resource.
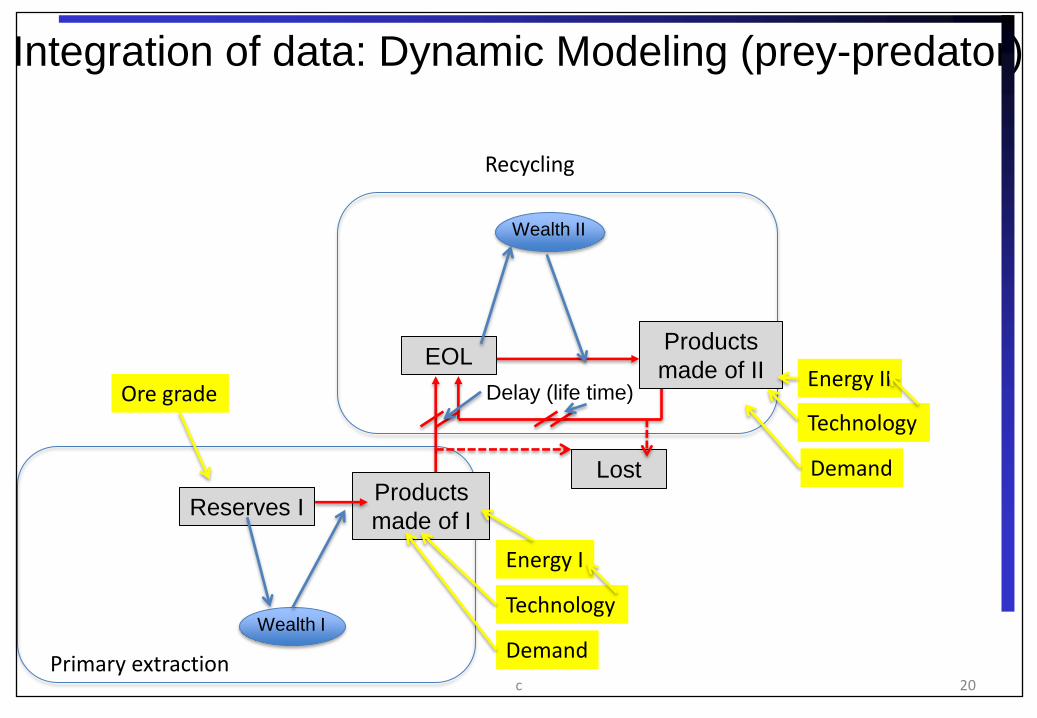
Recycling
Primary extraction
Reserves I Products
made of I
EOL Products
made of II
Lost
Wealth I
Wealth II
Technology
Demand
Technology
Energy I
Energy II
Demand
Ore grade
Integration of data: Dynamic Modeling (prey-predator)
Delay (life time)
c 20
Dem-Prod
40
30
20
10
0
1900 1930 1960 1990 2020 2050
Mt/
Yea
r
secondary production
pimary production
Total production
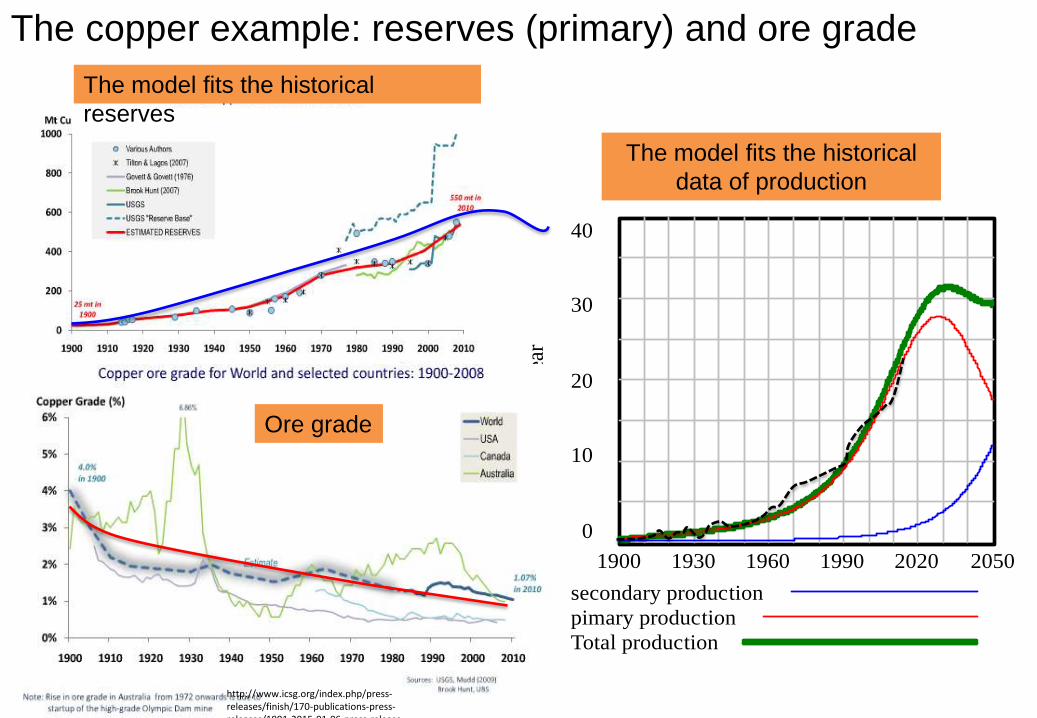
The copper example: reserves (primary) and ore grade
The model fits the historical
reserves
http://www.icsg.org/index.php/press-releases/finish/170-publications-press-releases/1991-2015-01-06-press-release-directory-copper-mines-plants
The model fits the historical
data of production
Ore grade
Stock in use
Non-recycled Cu
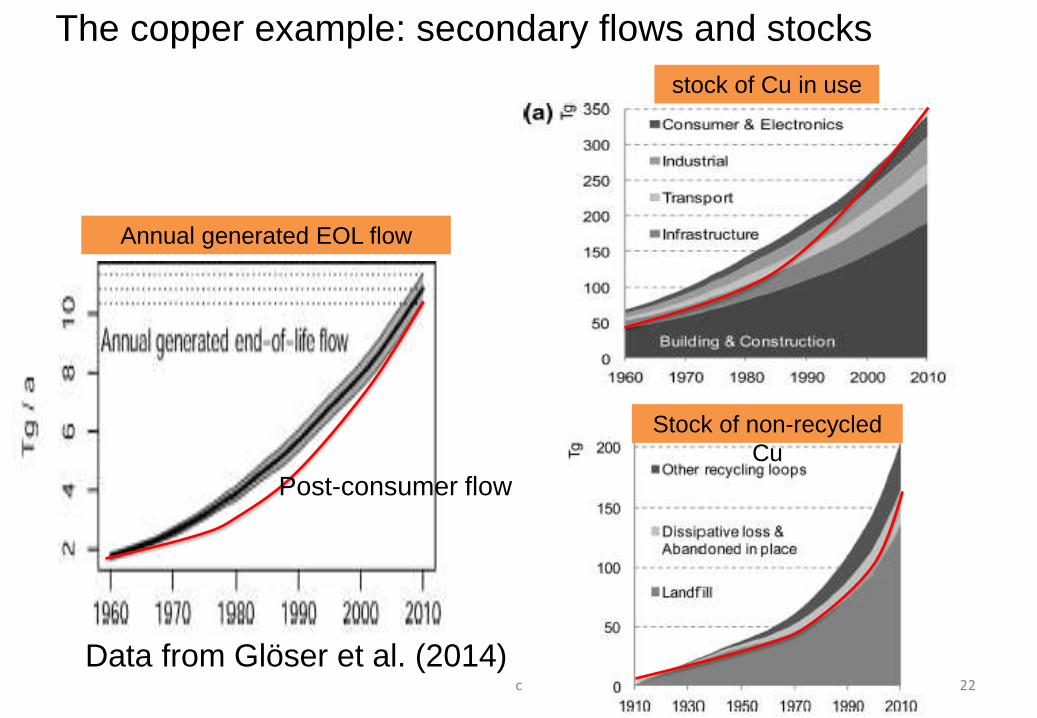
Data from Glöser et al. (2014)
Annual generated EOL flow
c 22
The copper example: secondary flows and stocks
Post-consumer flow
stock of Cu in use
Stock of non-recycled
Cu
Dem-Prod
40
35
30
25
20
15
10
5
0
1900 1930 1960 1990 2020 2050 2080
Mt/
Year
secondary production
pimary production
"Flux EOL I+II" : Current
"Production I + II" : Current
perdu total : Current
demande : Current
Recycled
Primary Cu
Stock
1500
1200
899.2
598.8
298.4
-2
1900 1940 1980 2020 2060 2100
Mt
Stock techno II : Current
Stock techno I : Current
Stock EOL : Current
stock total : Current
Stock perdu : Current
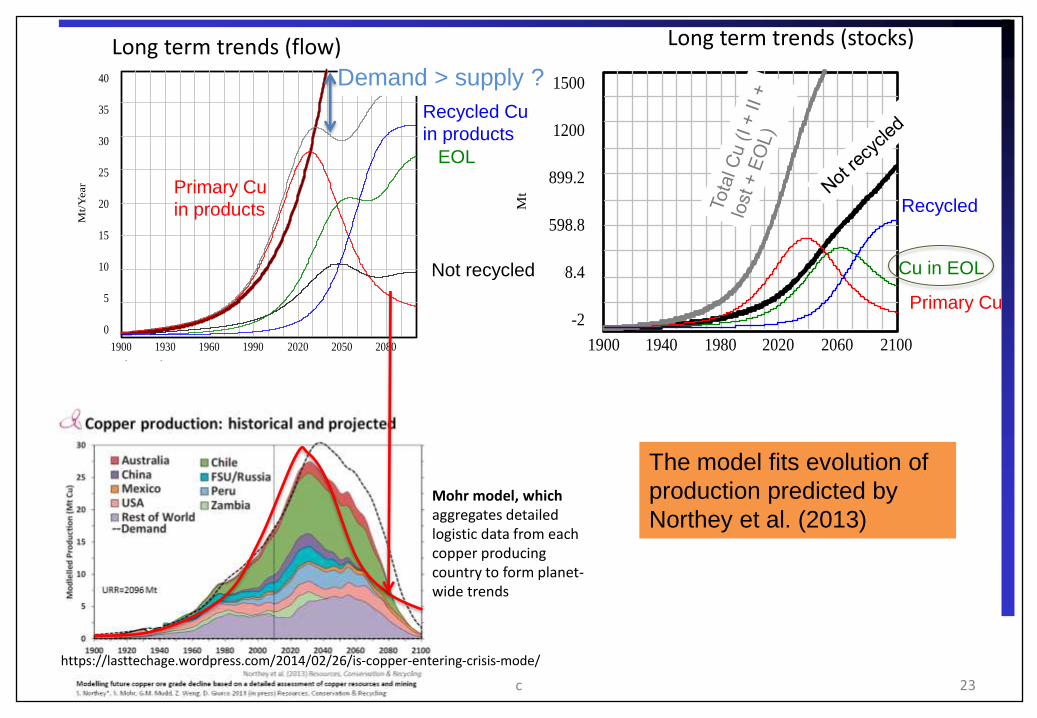
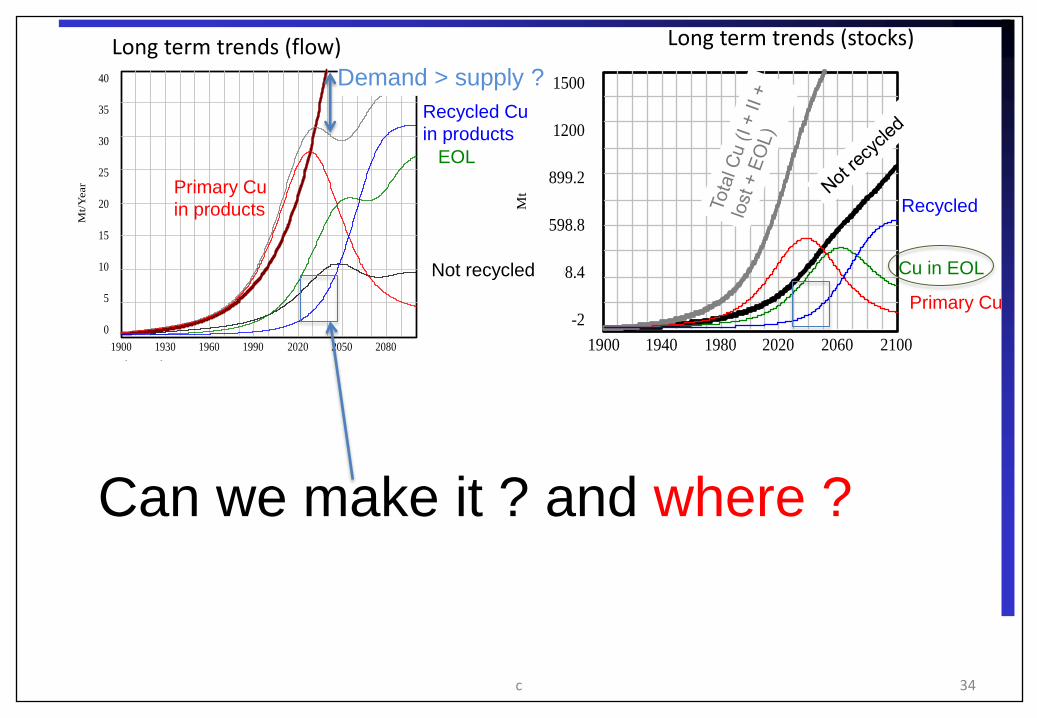
Long term trends (stocks)
Cu in EOL
Long term trends (flow)
Primary Cu
in products
Recycled Cu
in products
Mohr model, which aggregates detailed logistic data from each copper producing country to form planet-wide trends
https://lasttechage.wordpress.com/2014/02/26/is-copper-entering-crisis-mode/
The model fits evolution of
production predicted by
Northey et al. (2013)
Demand > supply ?
EOL
Not recycled
c 23
capital
4000
3000
2000
1000
0
1900 1950 2000 2050 2100 2150
Time (Year)
A.U
.
Capital Recyclage : Current
Capital I : Current
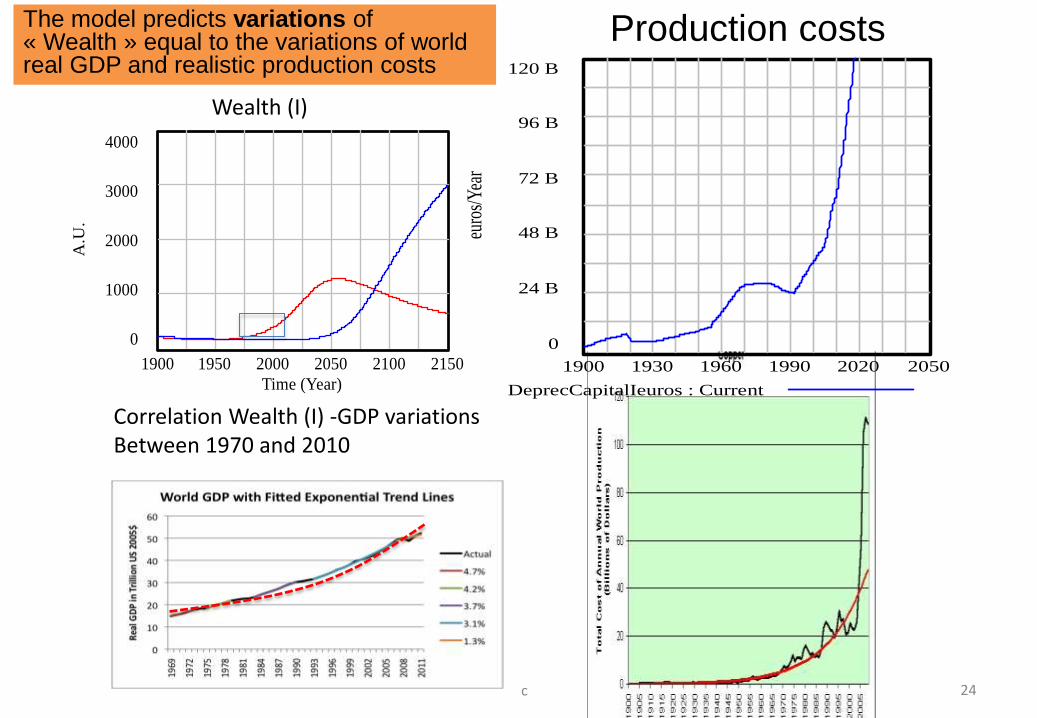
Wealth (I)
Correlation Wealth (I) -GDP variations Between 1970 and 2010
The model predicts variations of « Wealth » equal to the variations of world real GDP and realistic production costs
c 24
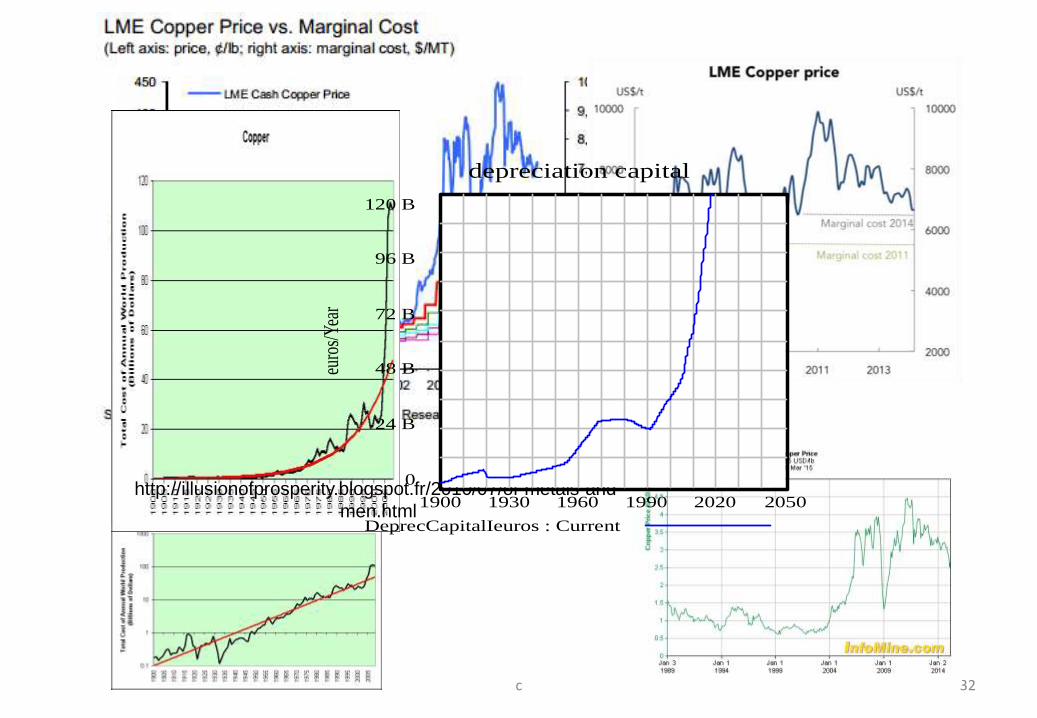
depreciation capital
120 B
96 B
72 B
48 B
24 B
0
1900 1930 1960 1990 2020 2050
euro
s/Y
ear
DeprecCapitalIeuros : Current
Production costs
energie I + II
1500
1125
750
375
0
1900 1950 2000 2050 2100 2150
Time (Year)
GJ/
Yea
r
Energie production II : Current
Energie production I : Current
"Energie production I + II" : Current
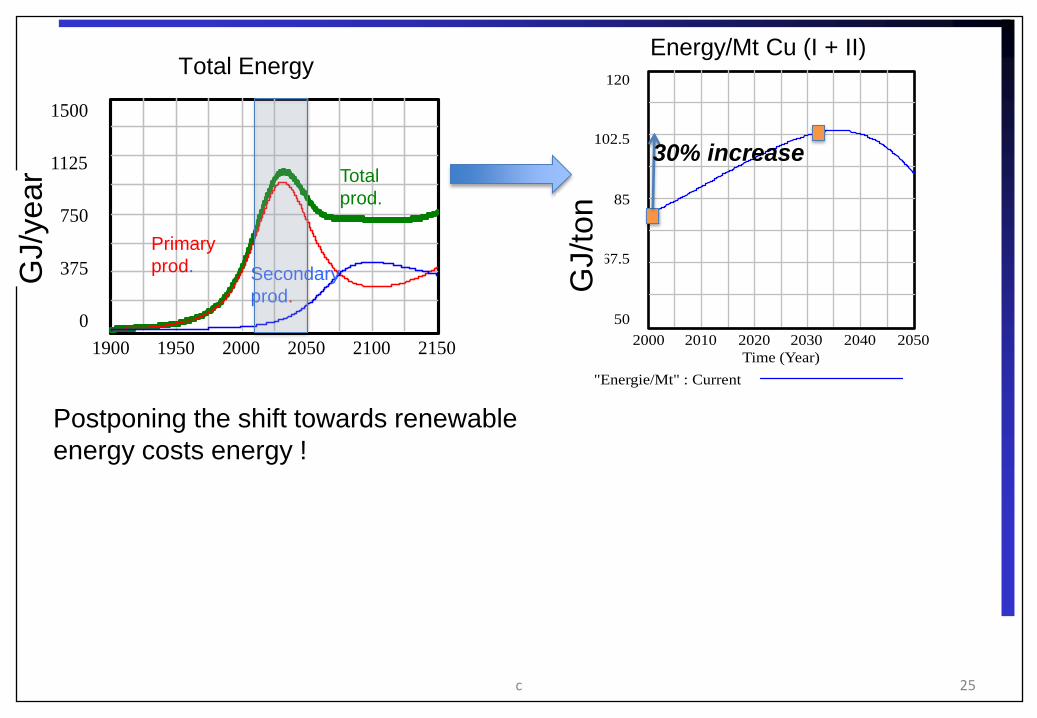
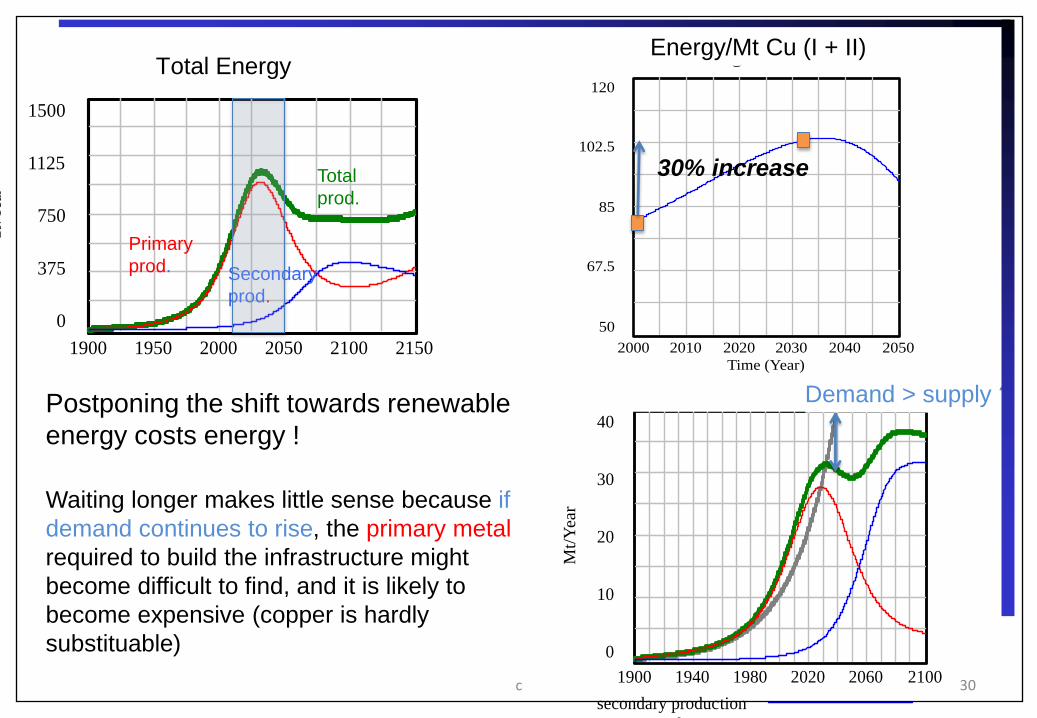
Total Energy
Primary
prod. Secondary
prod.
Total
prod.
energie/Mt
120
102.5
85
67.5
50
2000 2010 2020 2030 2040 2050
Time (Year)
"Energie/Mt" : Current
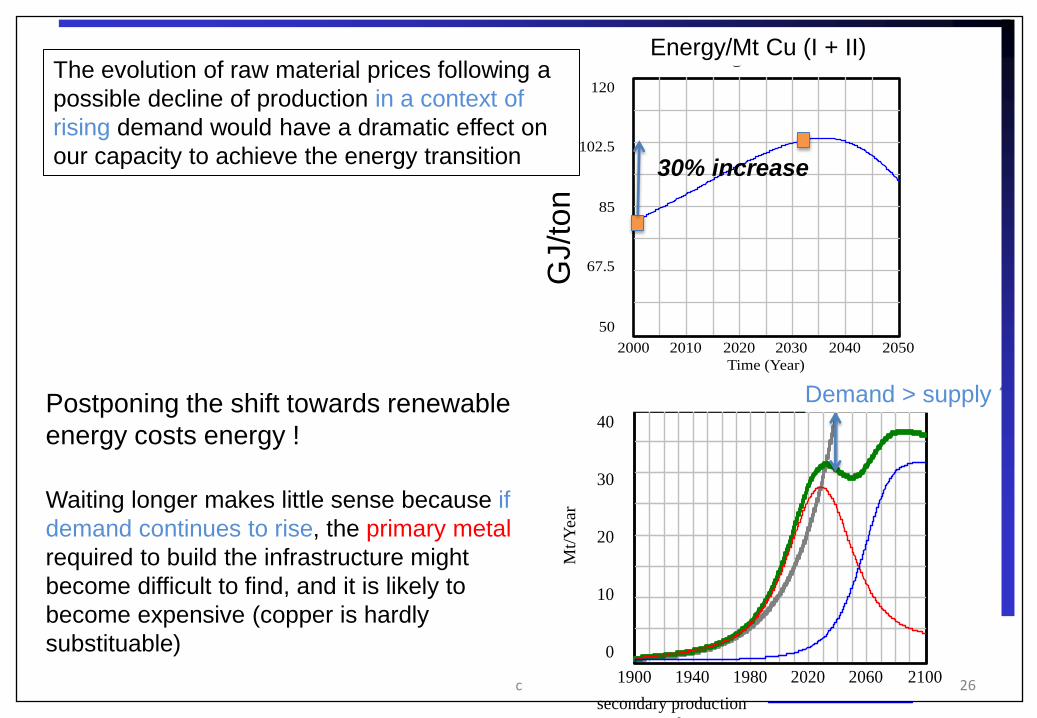
30% increase
Energy/Mt Cu (I + II)
c 25
Postponing the shift towards renewable
energy costs energy !
GJ/y
ear
GJ/t
on
energie/Mt
120
102.5
85
67.5
50
2000 2010 2020 2030 2040 2050
Time (Year)
"Energie/Mt" : Current
30% increase
Energy/Mt Cu (I + II)
Waiting longer makes little sense because if
demand continues to rise, the primary metal
required to build the infrastructure might
become difficult to find, and it is likely to
become expensive (copper is hardly
substituable)
Dem-Prod
40
30
20
10
0
1900 1940 1980 2020 2060 2100
Mt/
Yea
r
secondary production
pimary production
Total production
demande : Current
Demand > supply ?
c 26
Postponing the shift towards renewable
energy costs energy !
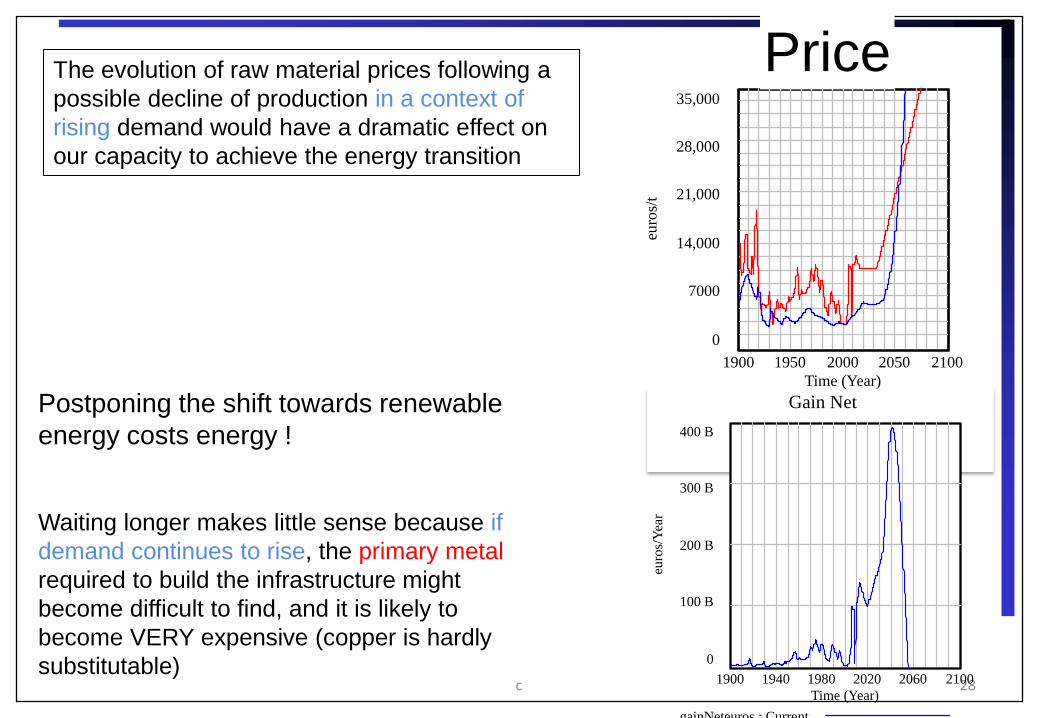
The evolution of raw material prices following a
possible decline of production in a context of
rising demand would have a dramatic effect on
our capacity to achieve the energy transition
GJ/t
on

27
2015 • Première version de la base de données Wiki en ligne - NoSQL database pour gérer
les LCI-LCIA et les intensités en ressource des secteurs de production d’E:
Les bases existantes (e.g. Ecoinvent, ELCD, GaBi, NEEDS) ont des formats différents
(ecospold1, ecospold2, ILCD, SimaPro CSV, etc.) et sont difficiles à désagréger.
Structuration en une base unique avec représentation ontologique, meilleure adéquation
requêtes - besoins.
• Economie: Modèle économique type Goodwin Keen avec matrices d’I/O qui sera
incorporé au modèle dynamique + approche indépendante en Equilibre Général
Calculable.
• Géopolitique/Socio : organisation des filières en Europe & France, évolutions de la
demande et la géographie de l’offre, anticipation d’éventuels conflits locaux associés
à l’exploitation minière: Cu, Li
• Modélisation dynamique: Intégration du module économique et application en
régional, extension aux petits métaux. Lien réserves - prix – Energie - coûts de
production
"price"
35,000
28,000
21,000
14,000
7000
0
1900 1950 2000 2050 2100
Time (Year)
euro
s/t
"coutprod/Mt" : Current
prix : CurrentPostponing the shift towards renewable
energy costs energy !
Waiting longer makes little sense because if
demand continues to rise, the primary metal
required to build the infrastructure might
become difficult to find, and it is likely to
become VERY expensive (copper is hardly
substitutable)
The evolution of raw material prices following a
possible decline of production in a context of
rising demand would have a dramatic effect on
our capacity to achieve the energy transition
c 28
Price
Gain Net
400 B
300 B
200 B
100 B
0
1900 1940 1980 2020 2060 2100
Time (Year)
euro
s/Y
ear
gainNeteuros : Current

c 29
energie I + II
1500
1125
750
375
0
1900 1950 2000 2050 2100 2150
Time (Year)
GJ/
Yea
r
Energie production II : Current
Energie production I : Current
"Energie production I + II" : Current
Total Energy
Primary
prod. Secondary
prod.
Total
prod.
energie/Mt
120
102.5
85
67.5
50
2000 2010 2020 2030 2040 2050
Time (Year)
"Energie/Mt" : Current
30% increase
Energy/Mt Cu (I + II)
Waiting longer makes little sense because if
demand continues to rise, the primary metal
required to build the infrastructure might
become difficult to find, and it is likely to
become expensive (copper is hardly
substituable)
Dem-Prod
40
30
20
10
0
1900 1940 1980 2020 2060 2100
Mt/
Yea
r
secondary production
pimary production
Total production
demande : Current
Demand > supply ?
c 30
Postponing the shift towards renewable
energy costs energy !
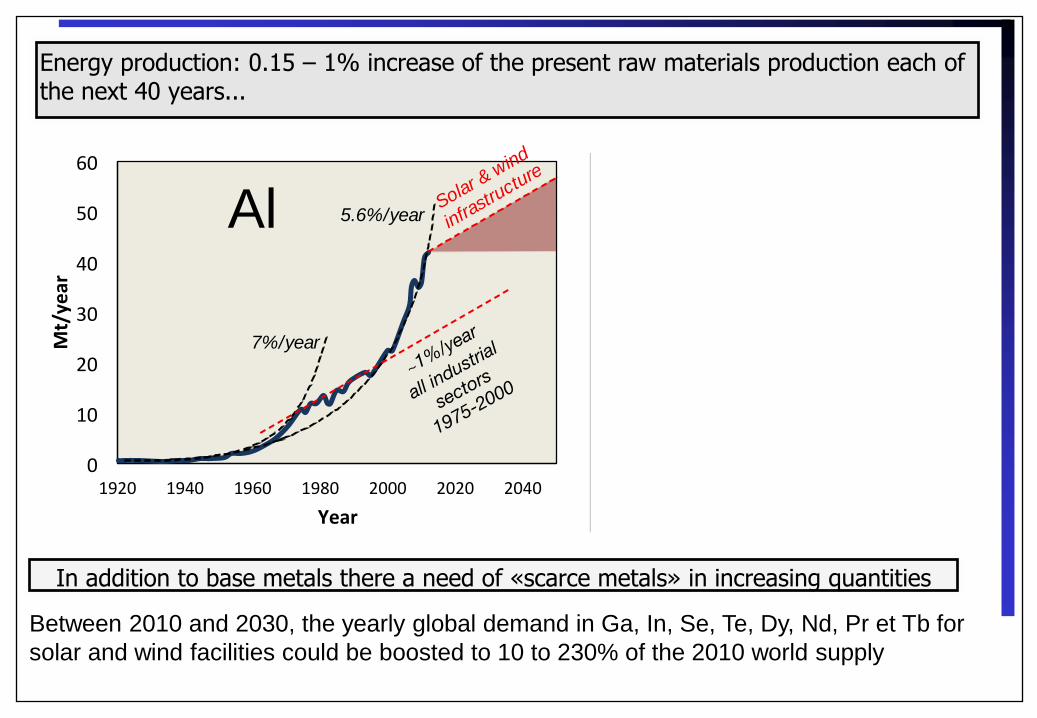
Energy production: 0.15 – 1% increase of the present raw materials production each of the next 40 years...
0
10
20
30
40
50
60
1920 1940 1960 1980 2000 2020 2040
Mt/year
Year
7%/year
5.6%/yearSolar &
wind
infrastru
cture
Al
Between 2010 and 2030, the yearly global demand in Ga, In, Se, Te, Dy, Nd, Pr et Tb for
solar and wind facilities could be boosted to 10 to 230% of the 2010 world supply
In addition to base metals there a need of «scarce metals» in increasing quantities
c 32
http://illusionofprosperity.blogspot.fr/2010/07/of-metals-and-
men.html
depreciation capital
120 B
96 B
72 B
48 B
24 B
0
1900 1930 1960 1990 2020 2050
euro
s/Y
ear
DeprecCapitalIeuros : Current
dsheep/dt= sheep(t)*(birth rate - wolves(t)*predation rate)
dwolves/dt= wolves(t)*(sheep(t)*delta - death rate)
death rate
birth rate
Resource
« Wealth »
(Capital, labour,
infrastructure, energy, etc)
Demand
Prey-predator modelling
dD/dt = D(t)*τ
dR/dt= R(t)*(taux - C(t)*beta(t))
dC/dt= C(t)*(R(t)*delta - gamma)
C-> R
R -> C
Increase of reserves (I) due to lowering ore grade (R(t) = R1900exp(taux*t),
equivalent to the regeneration of renewable resources
Erosion of
capital
Efficiency of wealth to
extract the resource.
Dem-Prod
40
35
30
25
20
15
10
5
0
1900 1930 1960 1990 2020 2050 2080
Mt/
Year
secondary production
pimary production
"Flux EOL I+II" : Current
"Production I + II" : Current
perdu total : Current
demande : Current
Recycled
Primary Cu
Stock
1500
1200
899.2
598.8
298.4
-2
1900 1940 1980 2020 2060 2100
Mt
Stock techno II : Current
Stock techno I : Current
Stock EOL : Current
stock total : Current
Stock perdu : Current
Long term trends (stocks)
Cu in EOL
Long term trends (flow)
Primary Cu
in products
Recycled Cu
in products
Demand > supply ?
EOL
Not recycled
c 34
Can we make it ? and where ?
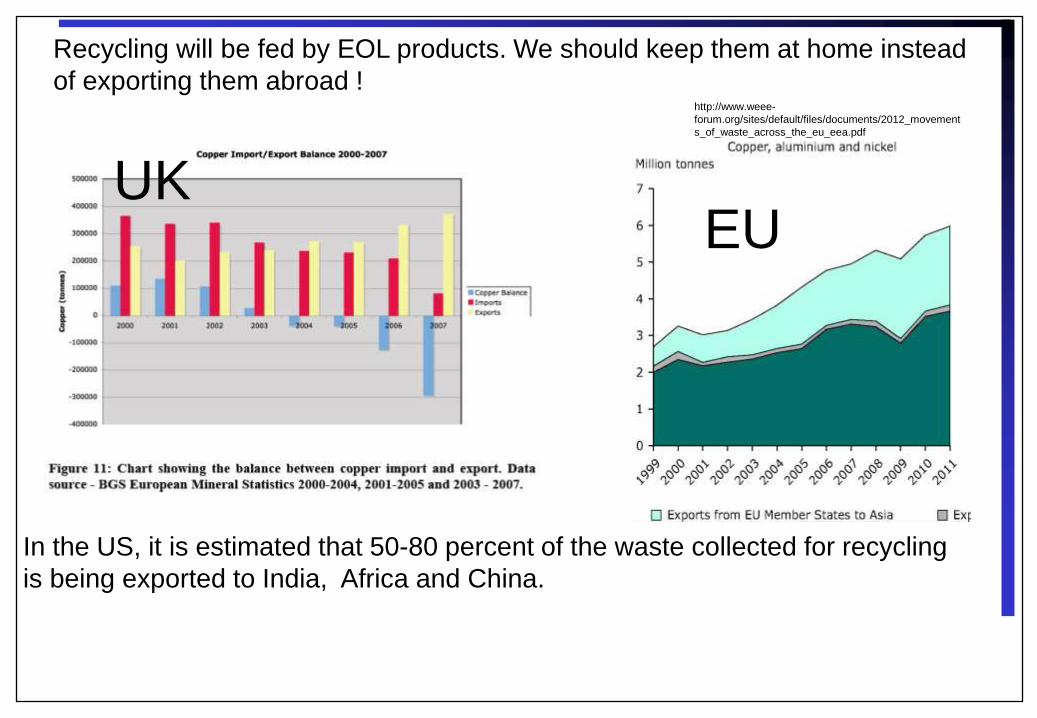
Recycling will be fed by EOL products. We should keep them at home instead
of exporting them abroad !
UK
In the US, it is estimated that 50-80 percent of the waste collected for recycling
is being exported to India, Africa and China.
EU
http://www.weee-
forum.org/sites/default/files/documents/2012_movement
s_of_waste_across_the_eu_eea.pdf
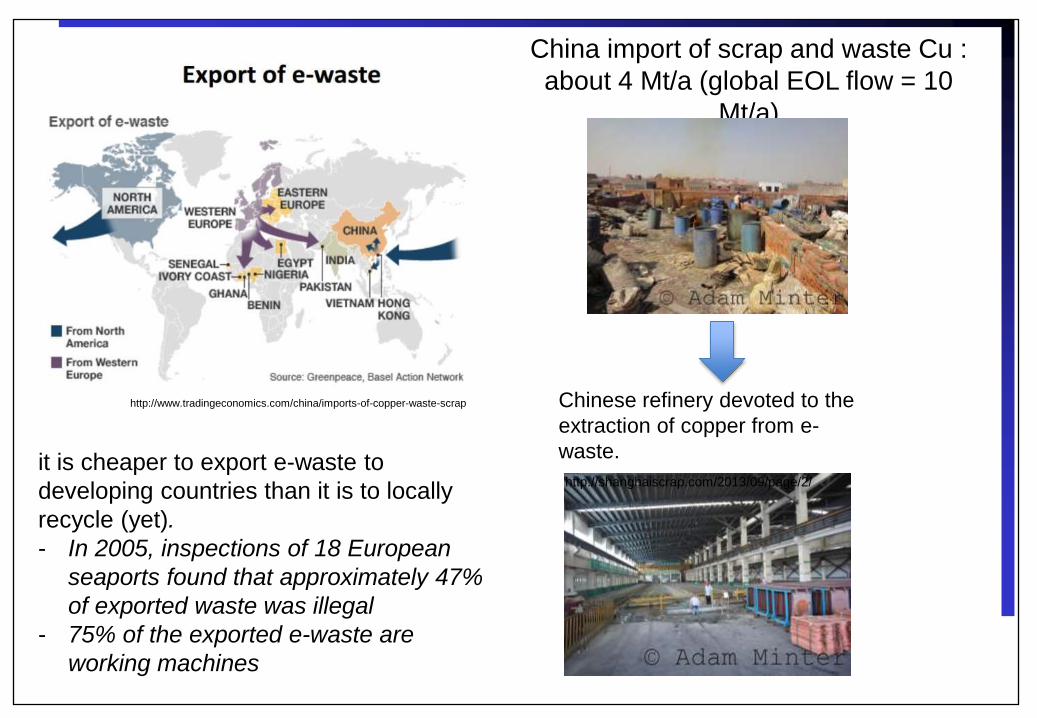
China import of scrap and waste Cu :
about 4 Mt/a (global EOL flow = 10
Mt/a)
http://www.tradingeconomics.com/china/imports-of-copper-waste-scrap Chinese refinery devoted to the
extraction of copper from e-
waste.
http://shanghaiscrap.com/2013/09/page/2/
it is cheaper to export e-waste to
developing countries than it is to locally
recycle (yet).
- In 2005, inspections of 18 European
seaports found that approximately 47%
of exported waste was illegal
- 75% of the exported e-waste are
working machines