Embed Size (px)
Citation preview

2012 Turfgrass Proceedings
The New Jersey Turfgrass Association
In Cooperation with Rutgers Center for Turfgrass Science Rutgers Cooperative Extension

2012 RUTGERS TURFGRASS PROCEEDINGS
of the
GREEN EXPO Turf and Landscape Conference December 4-6, 2012
Trump Taj Mahal Atlantic City, New Jersey
The Rutgers Turfgrass Proceedings is published yearly by the Rutgers Center for Turfgrass Science, Rutgers Cooperative Extension, and the New Jersey Agricultural Experiment Station, School of Environ-mental and Biological Sciences, Rutgers, The State University of New Jersey in cooperation with the New Jersey Turfgrass Association. The purpose of this document is to provide a forum for the dissemination of information and the exchange of ideas and knowl-edge. The proceedings provide turfgrass managers, research scientists, extension specialists, and indus-try personnel with opportunities to communicate with co-workers. Through this forum, these professionals also reach a more general audience, which includes the public.
This publication includes lecture notes of pa-pers presented at the 2012 GREEN EXPO Turf and Landscape Conference. Publication of these lectures provides a readily available source of information
covering a wide range of topics and includes techni-cal and popular presentations of importance to the turfgrass industry.
This proceedings also includes research papers that contain original research findings and reviews of selected subjects in turfgrass science. These papers are presented primarily to facilitate the timely dissemination of original turfgrass research for use by the turfgrass industry.
Special thanks are given to those who have sub-mitted papers for this proceedings, to the New Jersey Turfgrass Association for financial assistance, and to Barbara Fitzgerald, Anne Diglio, and Ann Jenkins for administrative and secretarial support.
Dr. Ann Brooks Gould, Editor Dr. Bruce B. Clarke, Coordinator
i

RESPONSE OF KENTUCKY BLUEGRASS TO WEAR AND TRAFFIC DURING 2012
Bradley S. Park, Hui Chen, William K. Dickson, Joseph B. Clark, and James A. Murphy1
Researchers have employed machines to im-part wear or the combined stresses of wear and compaction (traffic) on turfgrass, including Kentucky bluegrass (Poa pratensis L.), which is commonly established on sports fields grown in temperate cli-mates (Puhalla et al., 1999).
Wear machines, including the Rutgers Wear Simulator (RWS) described by Bonos et al. (2001), are designed to affect aboveground plant parts such as leaves, stems, and shoots and cause minimal soil compaction. Traffic simulators have been designed to generate both wear and soil compaction similar to those stresses resulting from sports field play with cleated shoes. The Cady Traffic Simulator (CTS), a machine described by Henderson and coworkers (2005), has recently been used to successfully im-part traffic on turf trials.
Park et al. (2007, 2008, 2009, 2010, 2011) re-ported on the tolerance of cultivars and selections comprising the 2005 National Turfgrass Evaluation Program (NTEP) Kentucky Bluegrass Test to wear caused by the RWS during spring, summer, and fall. A determination of the wear tolerance of newer culti-vars and experimental selections since 2005 would be useful. Additionally, it would be beneficial to ex-amine the response of these newer Kentucky blue-grasses to traffic caused by the CTS.
The objectives of this study were to assess the tolerance of Kentucky bluegrass to wear applied with the RWS and traffic applied with the CTS dur-ing fall 2012.
MATERIALS AND METHODS
Evaluation Trial
Eighty-two (82) entries comprising the 2011 NTEP Kentucky bluegrass trial were seeded into 12 x 4 ft plots on 10 October 2011 on a well-drained Nixon loam (sand = 44%; silt = 41%; clay = 15%) at the Rutgers Horticultural Research Farm II in North Brunswick, NJ. Also included in the evalua-tion were A04-1547, A05-322, A99-2444, 899-447, Bewitched, Diva, H03666, Midnight II, Princeton P-105, and Rhapsody.
Due to the late seeding date, the entire trial was covered with an Evergreen Turf Cover (Hinsperg-ers, Ontario, Canada) from November 2011 to April 2012.
Soil test results from June 2012 indicated that the soil pH was 5.8; soil phosphorous (P) was 235 lb per acre; and soil potassium (K) was 171 lb per acre. Calcitic lime was applied to the test area in accordance with soil test recommendations at 33 lb per 1000 ft2 on 12 July 2012. The test was mowed approximately 2 times per week with a reel mower at a height of 1.5 inches. The test was irrigated as necessary to avoid severe drought stress.
Nitrogen (N) applications for 2011 totaled 1.0 lb N per 1000 ft2 (0.5 lb N per 1000 ft2 on 10 October and 8 November 2011). In 2012, 4.7 lb N per 1000 ft2 was applied to the trial (0.5, 0.4, 0.4, 0.4, 0.5, 0.5, 0.7, 0.6, and 0.7 lb N per 1000 ft2 on 10 April, 30
1Sports Turf Education and Research Coordinator, Graduate Assistant, Turfgrass Research Farm Supervisor, Principal Laboratory Technician, and Extension Specialist in Turfgrass Management, respectively, New Jersey Agricultural Ex-periment Station, School of Environmental and Biological Sciences, Rutgers, The State University of New Jersey, New Brunswick, NJ 08901-8520.
205

April, 29 May, 15 June, 17 July, 9 August, 22 August, 5 October, and 6 November 2012, respectively).
Wear and Traffic Evaluation
Sixteen passes of wear and traffic were applied as strip-plots across all entries over an eight-week period during fall 2012 (two passes per week during 26 September through 14 November 2012). Wear was applied to approximately one-third of each plot with the RWS, a modified version of the walk-behind machine described by Bonos et al. (2001). The ma-chine was operated at a ground speed of 2.5 miles per hour (mph) and 250 rpm for the paddles. Traf-fic was applied to approximately one third of each plot with a modified version of the CTS described by Henderson et al. (2005). The CTS consisted of a Toro Greens Aerifier equipped with cleated “feet” and was operated in the forward direction at a speed of 1.0 mph. One-third of each plot did not receive wear or traffic (check).
Plot Evaluation
Visual turf quality in the absence of wear or traf-fic stress (i.e., overall appearance, turf color, unifor-mity, density, mowing quality, reduced rate of vertical growth, leaf texture, and freedom from insect and/or disease damage) was rated on 30 May, 25 June, 26 July, 28 August, 26 September, and 31 October 2012.
Turf establishment was assessed on 15 May 2012 and susceptibility to stem rust disease (caused by Puccinia graminis) was evaluated on 16 May and 28 September 2012. A 1 to 9 scale was utilized for these ratings where 9 equaled the best establish-ment or the least disease susceptibility.
After 16 simulator passes, the section of each plot treated with the RWS and CTS as well as the untreated section were visually assessed for green turf cover using a 1 to 9 scale where 9 equaled the most green turf cover in the plot area. Plots were also evaluated for fullness of turfgrass canopy using a 0 to 100% scale where 100% equaled a full can-opy. A Canon PowerShot G12 (Canon USA, Inc., Lake Success, NY) digital camera was positioned to capture images on a box equipped with artificial lighting. Individual digital image size was 1600 x 1064 pixels and camera settings included a shutter speed of 1/40 s, and aperture of F2.8, and ISO of 100 and a focal length of 7 mm.
Images were imported into SigmaScan Pro (v. 5.0, SPSS, Inc., Chicago, IL) for digital image analy-sis (DIA). Percent green cover was determined ac-cording to methods described by Richardson et al. (2001) using batch analysis programming developed by Karcher and Richardson (2005). A hue range of 50 to 107 and a saturation range of 0 to 100 were used in the software to identify green leaves in the images.
The check, RWS-, and CTS-treated plots were analyzed separately. The experimental design was a randomized complete block design with three rep-lications. All data were subjected to analysis of vari-ance and means were separated using the Fisher’s protected least significant difference (LSD) test at p < 0.05.
RESULTS AND DISCUSSION
Response of Kentucky Bluegrass to Wear and Traffic During Fall 2012
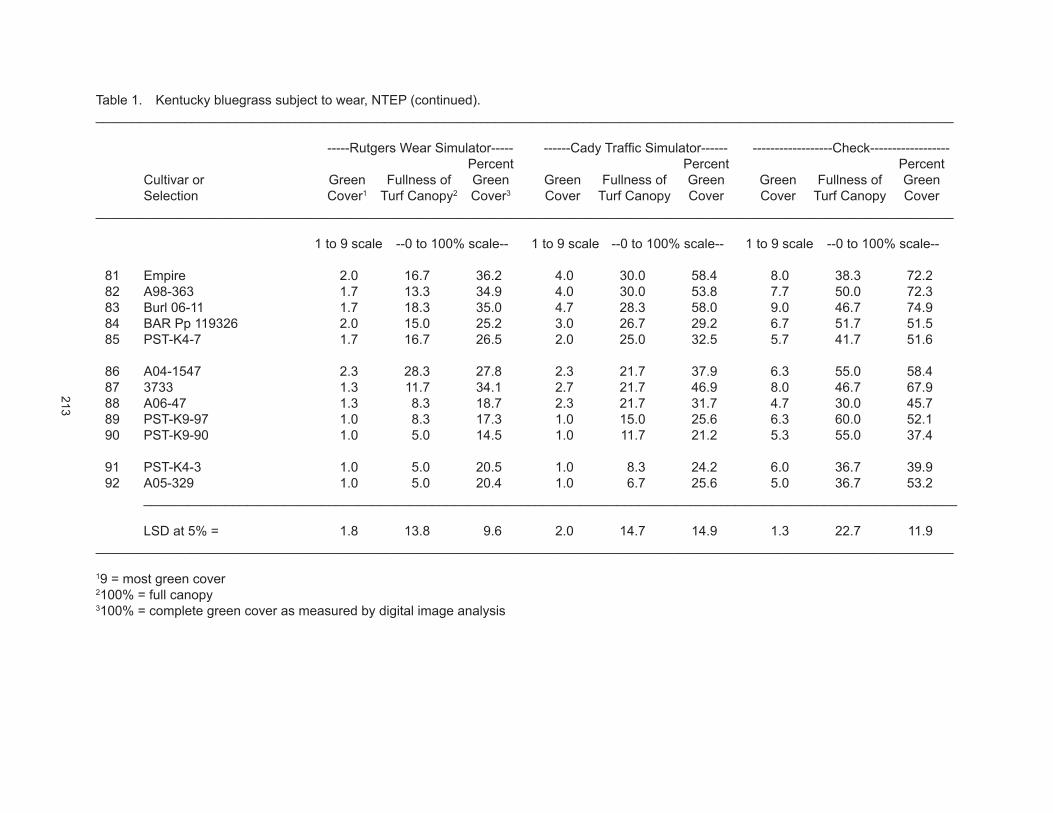
The RWS caused the most severe damage to Kentucky bluegrass cultivars and experimental se-lections. After 16 RWS passes, only BAR VV 0709, Pp 10847, J-1770, Nu Chicago, AKB 2282, J-1853, and SRX 5321 had green turf cover (1 to 9 scale) > 5.0 (Table 1). Fifty-two entries were determined to be in the lowest statistical category for green turf cover and all had a rating < 3.0. In contrast, after 16 passes of the CTS, 52 entries had green turf cover > 5.0 and only 11 entries were rated < 3.0.
Following 16 passes of the RWS and CTS, the best green turf cover was exhibited by BAR VV 0709, J-1770, and Pp 10847 (Table 1). The poorest green turf cover after operation of the two machines was exhibited by BAR Pp 119326, BAR 12PP 612, Blackjack, 3733, PST-07-261, Pick TD9, PpH 9131, A04-1547, A06-47, PST-K4-7, PST-K9-97, PST-K4-3, PST-K9-90, and A05-329.
BAR VV 0709 had the best fullness of turfgrass canopy (0 to 100% scale) after 16 passes of the RWS and CTS (wear and traffic stresses, respec-tively) (Table 1). PST-K9-97, PST-K9-90, PST-K4-3, and A05-329 had the poorest fullness of turfgrass canopy after 16 RWS and CTS passes.
Entries that exhibited the best percent green cover determined by digital image analysis at the
206
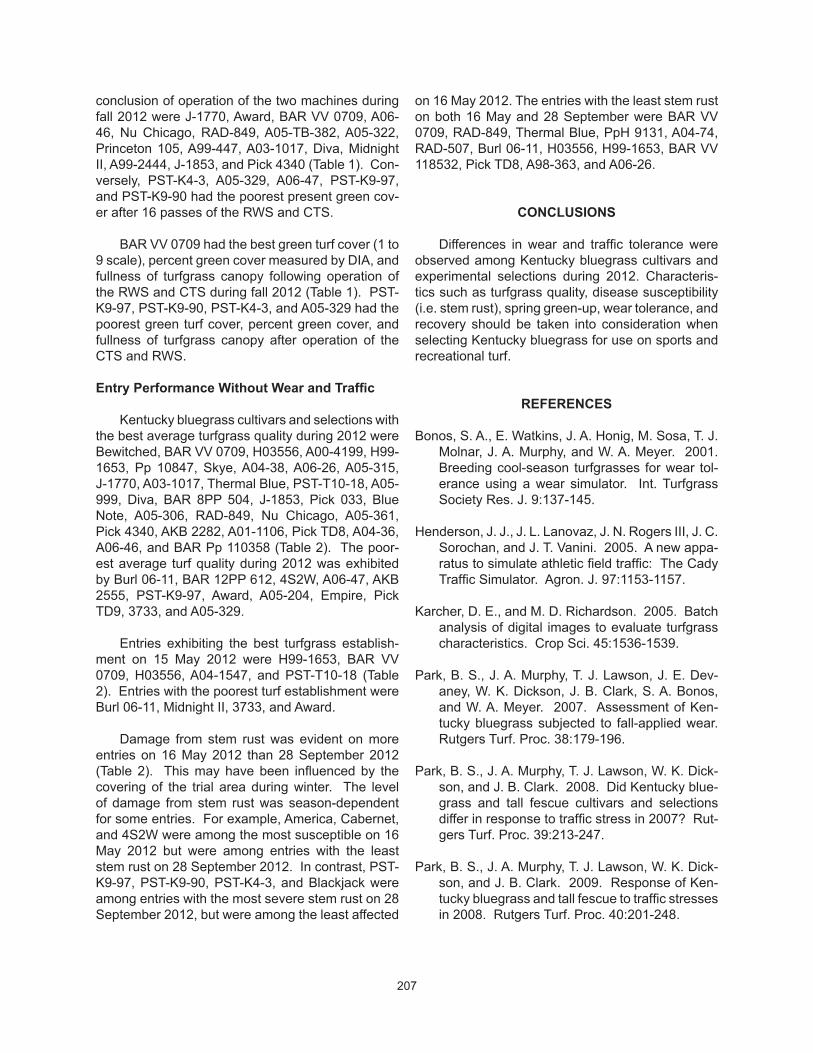
conclusion of operation of the two machines during fall 2012 were J-1770, Award, BAR VV 0709, A06-46, Nu Chicago, RAD-849, A05-TB-382, A05-322, Princeton 105, A99-447, A03-1017, Diva, Midnight II, A99-2444, J-1853, and Pick 4340 (Table 1). Con-versely, PST-K4-3, A05-329, A06-47, PST-K9-97, and PST-K9-90 had the poorest present green cov-er after 16 passes of the RWS and CTS.
BAR VV 0709 had the best green turf cover (1 to 9 scale), percent green cover measured by DIA, and fullness of turfgrass canopy following operation of the RWS and CTS during fall 2012 (Table 1). PST-K9-97, PST-K9-90, PST-K4-3, and A05-329 had the poorest green turf cover, percent green cover, and fullness of turfgrass canopy after operation of the CTS and RWS.
Entry Performance Without Wear and Traffic
Kentucky bluegrass cultivars and selections with the best average turfgrass quality during 2012 were Bewitched, BAR VV 0709, H03556, A00-4199, H99-1653, Pp 10847, Skye, A04-38, A06-26, A05-315, J-1770, A03-1017, Thermal Blue, PST-T10-18, A05-999, Diva, BAR 8PP 504, J-1853, Pick 033, Blue Note, A05-306, RAD-849, Nu Chicago, A05-361, Pick 4340, AKB 2282, A01-1106, Pick TD8, A04-36, A06-46, and BAR Pp 110358 (Table 2). The poor-est average turf quality during 2012 was exhibited by Burl 06-11, BAR 12PP 612, 4S2W, A06-47, AKB 2555, PST-K9-97, Award, A05-204, Empire, Pick TD9, 3733, and A05-329.
Entries exhibiting the best turfgrass establish-ment on 15 May 2012 were H99-1653, BAR VV 0709, H03556, A04-1547, and PST-T10-18 (Table 2). Entries with the poorest turf establishment were Burl 06-11, Midnight II, 3733, and Award.
Damage from stem rust was evident on more entries on 16 May 2012 than 28 September 2012 (Table 2). This may have been influenced by the covering of the trial area during winter. The level of damage from stem rust was season-dependent for some entries. For example, America, Cabernet, and 4S2W were among the most susceptible on 16 May 2012 but were among entries with the least stem rust on 28 September 2012. In contrast, PST-K9-97, PST-K9-90, PST-K4-3, and Blackjack were among entries with the most severe stem rust on 28 September 2012, but were among the least affected
on 16 May 2012. The entries with the least stem rust on both 16 May and 28 September were BAR VV 0709, RAD-849, Thermal Blue, PpH 9131, A04-74, RAD-507, Burl 06-11, H03556, H99-1653, BAR VV 118532, Pick TD8, A98-363, and A06-26.
CONCLUSIONS
Differences in wear and traffic tolerance were observed among Kentucky bluegrass cultivars and experimental selections during 2012. Characteris-tics such as turfgrass quality, disease susceptibility (i.e. stem rust), spring green-up, wear tolerance, and recovery should be taken into consideration when selecting Kentucky bluegrass for use on sports and recreational turf.
REFERENCES
Bonos, S. A., E. Watkins, J. A. Honig, M. Sosa, T. J. Molnar, J. A. Murphy, and W. A. Meyer. 2001. Breeding cool-season turfgrasses for wear tol-erance using a wear simulator. Int. Turfgrass Society Res. J. 9:137-145.
Henderson, J. J., J. L. Lanovaz, J. N. Rogers III, J. C. Sorochan, and J. T. Vanini. 2005. A new appa-ratus to simulate athletic field traffic: The Cady Traffic Simulator. Agron. J. 97:1153-1157.
Karcher, D. E., and M. D. Richardson. 2005. Batch analysis of digital images to evaluate turfgrass characteristics. Crop Sci. 45:1536-1539.
Park, B. S., J. A. Murphy, T. J. Lawson, J. E. Dev-aney, W. K. Dickson, J. B. Clark, S. A. Bonos, and W. A. Meyer. 2007. Assessment of Ken-tucky bluegrass subjected to fall-applied wear. Rutgers Turf. Proc. 38:179-196.
Park, B. S., J. A. Murphy, T. J. Lawson, W. K. Dick-son, and J. B. Clark. 2008. Did Kentucky blue-grass and tall fescue cultivars and selections differ in response to traffic stress in 2007? Rut-gers Turf. Proc. 39:213-247.
Park, B. S., J. A. Murphy, T. J. Lawson, W. K. Dick-son, and J. B. Clark. 2009. Response of Ken-tucky bluegrass and tall fescue to traffic stresses in 2008. Rutgers Turf. Proc. 40:201-248.
207

Park, B. S., J. A. Murphy, T. J. Lawson, W. K. Dick-son, and J. B. Clark. 2010. Response of Ken-tucky bluegrass to wear stress in 2009. Rutgers Turf. Proc. 41:195-215.
Park, B. S., J. A. Murphy, T. J. Lawson, W. K. Dick-son, and J. B. Clark. 2011. Response of Ken-tucky bluegrass to wear stress in 2010. Rutgers Turf. Proc. 42:245-260.
Puhalla, J., J. Krans, and M. Goatley. 1999. Sports Fields: A Manual for Design Construction and Maintenance. Wiley and Sons, Inc. Hoboken, NJ.
Richardson, M. D., D. E. Karcher, and L. C. Purcell. 2001. Quantifying turfgrass cover using digital image analysis. Crop Sci. 41:1884-1888.
208

____________________________________________________________________________________________________________________
____________________________________________________________________________________________________________________
209
Table 1. Performance of Kentucky bluegrass cultivars and selections after 16 passes of the Rutgers Wear Simulator, Cady Traffic Simulator, and without wear or traffic stress in November 2012 at North Brunswick, NJ. (Includes all entries of the 2011 National Turfgrass Evaluation Program (NTEP) Kentucky Bluegrass Test.)
-----Rutgers Wear Simulator----- ------Cady Traffic Simulator------ ------------------Check------------------Percent Percent Percent
Cultivar or Green Fullness of Green Green Fullness of Green Green Fullness of Green Selection Cover1 Turf Canopy2 Cover3 Cover Turf Canopy Cover Cover Turf Canopy Cover
1 to 9 scale --0 to 100% scale-- 1 to 9 scale --0 to 100% scale-- 1 to 9 scale --0 to 100% scale--
1 BAR VV 0709 7.3 70.0 51.9 7.0 71.7 56.9 8.7 98.3 72.5 2 AKB 2282 5.0 50.0 37.4 7.7 71.7 62.4 8.0 70.0 69.2 3 A03-1017 4.3 43.3 47.5 7.0 61.7 71.0 9.0 81.7 78.8 4 BAR Pp 110358 3.0 30.0 34.2 6.7 61.7 67.2 9.0 90.0 81.0 5 Pp 10847 6.0 53.3 45.1 6.3 60.0 51.7 8.0 83.3 66.9
6 J-1770 6.0 46.7 55.3 7.0 55.0 63.2 9.0 86.7 72.3 7 BAR 8PP 504 3.3 38.3 41.0 6.7 55.0 60.2 8.7 86.7 64.2 8 Pick 4340 3.7 31.7 45.7 6.0 55.0 62.7 9.0 76.7 78.7 9 SRX 4338 3.3 28.3 42.7 6.7 55.0 58.4 8.7 70.0 74.9
10 A05-999 3.3 45.0 27.2 6.3 53.3 49.1 9.0 85.0 62.7
11 J-1853 5.0 36.7 45.8 6.3 53.3 63.1 8.3 66.7 66.4 12 BAR VV 112916 2.0 26.7 26.5 6.7 53.3 54.5 8.3 71.7 67.5 13 Midnight 4.3 43.3 45.0 5.7 51.7 60.8 9.0 73.3 77.9 14 Diva 4.3 40.0 47.0 6.3 51.7 69.1 8.7 66.7 81.3 15 SRX 2758 4.0 38.3 42.0 6.3 51.7 57.0 9.0 75.0 73.8
16 Bewitched 4.3 36.7 41.5 5.7 51.7 59.6 9.0 85.0 74.5 17 RAD-849 4.0 33.3 51.1 6.7 51.7 63.3 8.7 76.7 76.9 18 Skye 2.7 28.3 30.5 6.0 51.7 54.8 8.3 78.3 69.9 19 A00-4199 2.3 36.7 31.8 6.0 50.0 49.1 8.7 90.0 61.5 20 Nu Chicago 5.3 41.7 51.3 6.3 48.3 60.6 9.0 86.7 79.3
(Continued)

____________________________________________________________________________________________________________________
____________________________________________________________________________________________________________________
210
Table 1. Kentucky bluegrass subject to wear, NTEP (continued).
-----Rutgers Wear Simulator----- ------Cady Traffic Simulator------ ------------------Check------------------Percent Percent Percent
Cultivar or Green Fullness of Green Green Fullness of Green Green Fullness of Green Selection Cover1 Turf Canopy2 Cover3 Cover Turf Canopy Cover Cover Turf Canopy Cover
1 to 9 scale --0 to 100% scale-- 1 to 9 scale --0 to 100% scale-- 1 to 9 scale --0 to 100% scale--
21 A05-315 4.0 35.0 43.4 7.0 48.3 58.4 8.7 78.3 72.2 22 H03556 1.0 10.0 22.8 5.3 48.3 52.4 9.0 81.7 66.2 23 Award 4.7 38.3 52.6 5.0 46.7 59.9 8.7 75.0 79.1 24 Princeton 105 4.0 35.0 48.2 6.3 46.7 66.2 9.0 75.0 79.0 25 A05-322 4.3 31.7 48.3 6.0 46.7 67.2 9.0 71.7 82.7
26 SRX 5321 5.0 40.0 41.5 6.3 45.0 57.3 8.3 65.0 69.8 27 J-1136 4.7 33.3 43.8 6.0 45.0 51.6 8.7 70.0 69.3 28 A05-306 3.0 33.3 39.5 5.7 45.0 55.0 8.0 85.0 66.9 29 Cabernet 2.7 26.7 42.1 5.0 45.0 53.2 8.7 71.7 76.3 30 Pick 033 2.3 25.0 39.7 5.7 45.0 51.6 8.7 80.0 78.5
31 A04-38 3.3 36.7 40.0 5.7 43.3 46.1 8.3 81.7 70.7 32 PST-K9-99 2.7 35.0 35.4 5.0 43.3 47.5 6.3 58.3 54.5 33 Pick TD8 3.3 31.7 43.8 5.7 43.3 60.4 8.0 56.7 73.0 34 A04-342 3.0 31.7 42.5 5.3 43.3 60.0 9.0 68.3 80.2 35 Sudden Impact 3.7 31.7 38.7 5.3 43.3 48.1 8.7 71.7 68.5
36 A06-46 4.3 30.0 51.3 6.3 43.3 69.3 8.7 63.3 80.9 37 Blue Note 2.7 30.0 36.2 5.0 43.3 56.6 9.0 78.3 73.5 38 A99-447 2.7 23.3 47.9 5.7 43.3 68.3 9.0 61.7 83.6 39 Midnight II 4.7 43.3 46.2 5.7 41.7 62.7 9.0 68.3 75.7 40 A04-36 3.7 36.7 35.7 5.7 41.7 51.2 7.7 60.0 68.1
(Continued)

____________________________________________________________________________________________________________________
____________________________________________________________________________________________________________________
211
Table 1. Kentucky bluegrass subject to wear, NTEP (continued).
-----Rutgers Wear Simulator----- ------Cady Traffic Simulator------ ------------------Check------------------Percent Percent Percent
Cultivar or Green Fullness of Green Green Fullness of Green Green Fullness of Green Selection Cover1 Turf Canopy2 Cover3 Cover Turf Canopy Cover Cover Turf Canopy Cover
1 to 9 scale --0 to 100% scale-- 1 to 9 scale --0 to 100% scale-- 1 to 9 scale --0 to 100% scale--
41 Shamrock 3.7 33.3 33.5 5.3 41.7 52.8 7.7 66.7 64.7 42 DPPp 818 3.7 31.7 36.0 5.0 41.7 52.6 8.3 68.3 65.4 43 Burl 3-51 2.7 26.7 42.8 5.7 41.7 63.5 9.0 55.0 76.7 44 A05-361 2.3 18.3 37.9 4.7 41.7 57.1 8.3 81.7 77.4 45 H99-1653 4.0 35.0 41.8 5.7 40.0 56.1 9.0 83.3 76.7
46 Rhapsody 3.7 31.7 42.1 5.0 40.0 59.1 9.0 66.7 76.0 47 America 3.0 30.0 37.8 3.7 40.0 50.7 8.0 65.0 74.2 48 A05-TB-382 3.3 26.7 49.8 5.0 40.0 60.6 9.0 76.7 84.4 49 Barduke 2.7 26.7 35.6 4.7 40.0 52.1 7.3 70.0 62.0 50 SRX 466 1.7 15.0 31.0 5.0 40.0 53.9 8.7 55.0 66.0
51 PST-T10-18 3.7 36.7 44.5 5.0 38.3 57.9 7.3 61.7 70.8 52 BAR VV 118532 4.0 30.0 44.9 5.7 38.3 63.2 8.3 60.0 76.9 53 Rush 2.3 26.7 32.4 4.0 38.3 43.9 8.0 81.7 60.0 54 Avid 2.3 21.7 45.4 5.0 38.3 65.9 8.7 58.3 75.9 55 Kenblue 2.0 21.7 27.8 4.3 38.3 47.4 8.7 75.0 61.8
56 Blackjack 1.3 21.7 22.8 3.0 38.3 43.7 6.3 73.3 50.8 57 Baron 2.3 26.7 32.6 4.3 36.7 43.1 9.0 78.3 66.8 58 Thermal Blue 2.0 26.7 25.9 4.7 36.7 42.4 7.3 73.3 53.6 59 BAR Pp 119327 2.3 23.3 30.8 5.0 36.7 44.0 7.0 71.7 57.2 60 A99-2444 2.7 20.0 45.9 4.7 36.7 63.2 9.0 41.7 79.9
(Continued)

____________________________________________________________________________________________________________________
____________________________________________________________________________________________________________________
212
Table 1. Kentucky bluegrass subject to wear, NTEP (continued).
-----Rutgers Wear Simulator----- ------Cady Traffic Simulator------ ------------------Check------------------Percent Percent Percent
Cultivar or Green Fullness of Green Green Fullness of Green Green Fullness of Green Selection Cover1 Turf Canopy2 Cover3 Cover Turf Canopy Cover Cover Turf Canopy Cover
1 to 9 scale --0 to 100% scale-- 1 to 9 scale --0 to 100% scale-- 1 to 9 scale --0 to 100% scale--
61 A05-360 2.0 20.0 34.3 4.7 36.7 42.9 8.3 60.0 67.5 62 A04-74 1.7 18.3 38.2 4.7 36.7 58.8 7.7 45.0 70.0 63 RAD-1492 2.0 15.0 36.9 5.0 36.7 55.8 8.3 65.0 72.6 64 Arrowhead 2.0 11.7 29.2 4.3 36.7 48.9 7.3 50.0 65.3 65 A00-2882 1.0 10.0 25.8 3.7 36.7 40.6 7.7 63.3 59.9
66 A06-26 2.7 23.3 36.6 4.7 35.0 50.8 8.7 53.3 74.1 67 RAD-507 2.0 15.0 36.2 4.0 35.0 53.1 7.3 40.0 66.0 68 A01-1106 1.7 13.3 23.3 3.3 35.0 41.0 9.0 85.0 68.7 69 AKB 2555 1.7 23.3 29.8 3.7 33.3 41.0 7.3 55.0 62.8 70 Pick MD07 1.7 23.3 25.4 4.3 33.3 39.0 7.7 63.3 59.2
71 A05-204 1.3 15.0 36.4 4.3 33.3 51.6 6.3 38.3 61.0 72 Pick TD9 1.0 11.7 28.8 2.7 33.3 44.5 7.7 50.0 66.7 73 PST-K10-106D 1.7 11.7 23.3 4.7 33.3 44.0 8.0 75.0 50.6 74 4S2W 3.3 35.0 32.7 3.3 31.7 44.2 8.0 56.7 61.3 75 A10-1 2.3 28.3 46.0 4.7 31.7 53.2 8.3 60.0 78.2
76 PpH 9131 2.0 21.7 26.9 2.7 31.7 35.7 6.3 50.0 60.1 77 LTP-08-6 2.3 20.0 36.5 4.3 31.7 50.5 8.3 48.3 65.7 78 A98-344 2.0 18.3 35.4 3.7 31.7 52.0 8.0 46.7 72.6 79 BAR 12PP 612 2.7 18.3 28.1 3.0 31.7 42.4 6.3 58.3 51.5 80 PST-07-261 1.3 6.7 19.2 2.7 31.7 37.1 8.0 58.3 63.2
(Continued)
____________________________________________________________________________________________________________________
____________________________________________________________________________________________________________________
______________________________________________________________________________________________________________
____________________________________________________________________________________________________________________
213
Table 1. Kentucky bluegrass subject to wear, NTEP (continued).
-----Rutgers Wear Simulator----- ------Cady Traffic Simulator------ ------------------Check------------------Percent Percent Percent
Cultivar or Green Fullness of Green Green Fullness of Green Green Fullness of Green Selection Cover1 Turf Canopy2 Cover3 Cover Turf Canopy Cover Cover Turf Canopy Cover
1 to 9 scale --0 to 100% scale-- 1 to 9 scale --0 to 100% scale-- 1 to 9 scale --0 to 100% scale--
81 Empire 2.0 16.7 36.2 4.0 30.0 58.4 8.0 38.3 72.2 82 A98-363 1.7 13.3 34.9 4.0 30.0 53.8 7.7 50.0 72.3 83 Burl 06-11 1.7 18.3 35.0 4.7 28.3 58.0 9.0 46.7 74.9 84 BAR Pp 119326 2.0 15.0 25.2 3.0 26.7 29.2 6.7 51.7 51.5 85 PST-K4-7 1.7 16.7 26.5 2.0 25.0 32.5 5.7 41.7 51.6
86 A04-1547 2.3 28.3 27.8 2.3 21.7 37.9 6.3 55.0 58.4 87 3733 1.3 11.7 34.1 2.7 21.7 46.9 8.0 46.7 67.9 88 A06-47 1.3 8.3 18.7 2.3 21.7 31.7 4.7 30.0 45.7 89 PST-K9-97 1.0 8.3 17.3 1.0 15.0 25.6 6.3 60.0 52.190 PST-K9-90 1.0 5.0 14.5 1.0 11.7 21.2 5.3 55.0 37.4
91 PST-K4-3 1.0 5.0 20.5 1.0 8.3 24.2 6.0 36.7 39.9 92 A05-329 1.0 5.0 20.4 1.0 6.7 25.6 5.0 36.7 53.2
LSD at 5% = 1.8 13.8 9.6 2.0 14.7 14.9 1.3 22.7 11.9
19 = most green cover 2100% = full canopy 3100% = complete green cover as measured by digital image analysis

____________________________________________________________________________________________________________________
____________________________________________________________________________________________________________________
214
Table 2. Performance of Kentucky bluegrass cultivars and selections without wear or traffic stress in a turf trial established in October 2011 at North Brunswick, NJ. (Includes all entries of the 2011 National Turfgrass Evaluation Program (NTEP) Kentucky Bluegrass Test.)
Establish--------------------------------------Turfgrass Quality1------------------------------------- ment2 ----Stem Rust3----
Cultivar or 2012 May June July Aug. Sept. Oct. 15 May 16 May 28 Sept. Selection Avg. 2012 2012 2012 2012 2012 2012 2012 2012 2012
1 Bewitched 6.4 5.0 4.7 6.3 8.3 7.7 6.3 4.7 4.7 8.0 2 BAR VV 0709 6.2 4.7 6.0 7.0 7.7 6.3 5.7 9.0 8.7 9.0 3 H03556 6.1 5.3 6.7 7.0 7.0 5.7 5.0 8.7 8.3 8.0 4 A00-4199 6.0 3.3 5.3 6.7 8.3 6.7 5.3 6.7 3.7 9.0 5 H99-1653 5.9 5.0 5.7 6.3 7.0 6.7 5.0 9.0 8.0 9.0
6 Skye 5.9 4.7 5.3 6.3 7.7 6.3 5.0 6.3 6.7 8.3 7 Pp 10847 5.9 4.3 6.7 6.7 7.0 6.0 4.7 6.0 7.0 8.0 8 A04-38 5.7 3.7 5.0 6.0 7.7 6.7 5.3 6.3 6.7 8.7 9 A06-26 5.7 5.0 4.7 6.3 8.0 6.3 3.7 4.7 7.7 8.3
10 A05-315 5.6 3.7 4.7 6.0 7.3 6.3 5.7 6.3 6.7 9.0
11 J-1770 5.6 3.7 4.7 5.3 6.3 7.3 6.3 4.3 5.3 9.0 12 A03-1017 5.6 2.7 4.0 5.0 7.0 8.0 6.7 4.7 3.7 9.0 13 Thermal Blue 5.6 6.7 5.7 6.7 5.7 4.7 4.0 6.7 8.7 8.3 14 A05-999 5.5 5.0 5.7 6.0 5.7 5.7 5.0 7.0 7.0 6.7 15 PST-T10-18 5.5 5.7 5.7 6.3 7.0 4.7 3.7 7.7 7.3 9.0
16 Diva 5.4 4.7 4.7 5.3 6.0 6.0 5.7 6.7 7.0 9.0 17 J-1853 5.3 4.0 4.3 5.0 7.3 6.3 5.0 5.0 6.0 9.0 18 BAR 8PP 504 5.3 4.0 5.7 6.3 5.0 6.0 5.0 6.7 7.0 8.0 19 Pick 033 5.3 4.3 4.7 5.0 6.3 5.3 6.0 4.3 5.0 9.0 20 Blue Note 5.3 3.7 4.3 5.3 6.0 6.0 6.3 5.3 6.0 8.7
21 RAD-849 5.3 5.0 4.3 5.3 6.3 5.7 5.0 6.7 8.7 8.3 22 A05-306 5.3 4.0 5.0 6.7 6.7 5.3 4.0 6.7 7.0 7.7 23 Nu Chicago 5.2 3.3 4.0 4.3 6.0 7.3 6.3 5.0 4.0 9.0 24 A05-361 5.2 3.3 3.7 4.3 6.7 7.0 6.0 4.7 4.7 9.0 25 A01-1106 5.1 3.7 4.0 4.3 6.0 6.0 6.7 6.3 6.0 8.0
(Continued)

____________________________________________________________________________________________________________________
____________________________________________________________________________________________________________________
215
Table 2. Kentucky bluegrass trial without wear or traffic stress, NTEP (continued).
Establish--------------------------------------Turfgrass Quality1------------------------------------- ment2 ----Stem Rust3----
Cultivar or 2012 May June July Aug. Sept. Oct. 15 May 16 May 28 Sept. Selection Avg. 2012 2012 2012 2012 2012 2012 2012 2012 2012
26 Pick 4340 5.1 3.7 5.0 5.0 4.7 5.7 6.7 4.3 5.3 9.0 27 AKB 2282 5.1 4.3 3.0 4.7 6.3 6.7 5.7 3.3 7.3 7.7 28 Pick TD8 5.1 4.7 4.0 5.7 6.0 5.7 4.7 5.3 8.0 8.3 29 A04-36 5.1 4.0 4.3 6.0 7.0 5.3 4.0 5.7 6.7 9.0 30 BAR Pp 110358 5.1 2.3 4.3 4.7 5.3 6.0 7.7 7.3 6.0 8.3
31 A06-46 5.1 4.7 5.0 4.3 5.3 5.0 6.0 6.0 5.0 9.0 32 A04-342 5.0 3.3 3.7 4.7 6.7 6.0 6.0 3.3 4.0 9.0 33 SRX 2758 4.8 3.0 4.0 4.3 4.7 7.3 5.7 4.3 4.3 8.0 34 A05-TB-382 4.8 4.0 4.3 4.3 6.3 5.3 4.7 5.7 6.7 8.7 35 PST-07-261 4.8 4.7 5.0 4.7 5.0 5.7 4.0 5.0 9.0 7.0
36 Midnight 4.8 3.3 3.3 3.3 5.3 6.3 7.0 3.3 5.3 9.0 37 A99-447 4.8 4.0 3.3 5.7 5.0 5.0 5.7 5.0 4.7 8.7 38 A05-360 4.8 3.7 4.7 5.0 6.0 4.7 4.7 5.3 4.0 6.0 39 Rush 4.8 3.3 3.7 4.7 6.7 6.3 4.0 4.7 4.3 8.0 40 PST-K9-90 4.8 3.7 4.0 5.7 7.7 5.3 2.3 3.7 9.0 3.3
41 RAD-1492 4.7 4.0 4.7 5.3 5.3 4.3 4.3 4.3 8.7 7.3 42 Rhapsody 4.7 2.7 3.3 5.0 5.7 5.7 5.7 3.3 5.0 9.0 43 SRX 4338 4.7 3.0 4.3 5.0 5.3 5.3 5.0 4.7 6.0 9.0 44 BAR Pp 119327 4.7 3.0 4.7 5.0 5.7 5.7 4.0 3.7 5.7 7.7 45 BAR VV 118532 4.7 5.3 4.3 4.7 5.3 4.3 4.0 6.7 8.0 8.3
46 SRX 5321 4.6 4.0 3.7 5.0 4.7 6.0 4.7 4.0 5.0 8.3 47 Princeton 105 4.6 3.0 4.0 4.3 6.0 4.7 5.3 5.0 4.7 8.3 48 A04-1547 4.6 2.7 5.7 6.7 5.7 4.0 2.7 8.0 4.0 8.0 49 A05-322 4.5 3.7 3.3 4.7 5.3 4.3 5.7 3.7 7.0 8.0 50 Sudden Impact 4.5 3.3 3.7 4.7 5.7 5.3 4.3 4.3 5.0 9.0
(Continued)

____________________________________________________________________________________________________________________
____________________________________________________________________________________________________________________
216
Table 2. Kentucky bluegrass trial without wear or traffic stress, NTEP (continued).
Establish--------------------------------------Turfgrass Quality1------------------------------------- ment2 ----Stem Rust3----
Cultivar or 2012 May June July Aug. Sept. Oct. 15 May 16 May 28 Sept. Selection Avg. 2012 2012 2012 2012 2012 2012 2012 2012 2012
51 Shamrock 4.5 2.7 4.3 5.0 6.0 5.0 4.0 5.7 6.3 8.3 52 J-1136 4.4 2.3 2.7 4.0 6.0 6.7 4.7 3.7 4.3 9.0 53 A10-1 4.4 4.0 3.3 5.3 4.7 5.3 3.7 4.7 5.3 8.0 54 PST-K10-106D 4.4 2.0 4.0 5.3 6.7 4.3 4.0 7.3 3.7 4.7 55 Cabernet 4.3 3.3 4.7 4.7 6.0 4.0 3.3 4.0 3.3 7.7
56 BAR VV 112916 4.3 3.0 4.3 5.0 5.3 5.0 3.0 6.7 5.3 9.0 57 Baron 4.2 3.7 3.7 5.0 4.3 4.7 4.0 3.7 6.0 8.7 58 BAR Pp 119326 4.2 5.7 4.7 4.7 4.3 3.0 2.7 6.0 8.7 7.3 59 PST-K4-3 4.1 4.7 4.7 4.7 6.0 3.0 1.7 5.0 9.0 3.0 60 SRX 466 4.1 3.0 3.7 3.7 4.3 5.0 4.7 4.3 4.0 6.3
61 PST-K9-99 4.1 3.0 3.0 4.7 5.7 5.0 3.0 3.7 6.3 7.3 62 Blackjack 4.1 6.0 6.3 4.0 3.7 2.3 2.0 7.0 8.0 3.7 63 Midnight II 4.0 1.7 2.0 4.0 5.3 5.0 6.0 2.3 5.0 9.0 64 A00-2882 4.0 3.3 3.0 4.0 4.0 5.3 4.3 5.0 4.3 7.3 65 A98-363 4.0 4.0 3.7 4.0 4.3 4.0 4.0 4.0 8.0 8.0
66 Barduke 4.0 3.0 4.3 4.3 5.0 4.0 3.0 3.7 5.3 8.3 67 LTP-08-6 3.9 3.7 2.7 4.3 5.0 4.7 3.3 3.3 5.7 8.0 68 Kenblue 3.9 2.7 4.7 5.3 5.0 3.0 3.0 7.3 3.7 8.0 69 PpH 9131 3.9 4.0 4.0 4.7 5.0 3.7 2.0 4.3 8.7 8.3 70 DPPp 818 3.8 3.0 3.3 5.0 4.3 4.3 3.0 4.3 4.7 7.7
71 Arrowhead 3.7 2.3 2.7 4.0 4.7 4.3 4.3 5.0 4.3 6.3 72 PST-K4-7 3.6 3.7 3.7 4.3 4.3 4.0 2.0 4.7 9.0 6.0 73 A98-344 3.5 3.0 2.3 4.3 4.0 4.3 3.3 4.0 5.0 7.0 74 America 3.5 2.3 2.7 4.3 3.7 4.0 4.0 4.3 3.3 8.7 75 Pick MD07 3.4 2.0 2.7 4.3 4.3 3.7 3.3 3.7 4.0 7.0
(Continued)

____________________________________________________________________________________________________________________
____________________________________________________________________________________________________________________
_______________________________________________________________________________________________________________
____________________________________________________________________________________________________________________
217
Table 2. Kentucky bluegrass trial without wear or traffic stress, NTEP (continued).
Establish--------------------------------------Turfgrass Quality1------------------------------------- ment2 ----Stem Rust3----
Cultivar or 2012 May June July Aug. Sept. Oct. 15 May 16 May 28 Sept. Selection Avg. 2012 2012 2012 2012 2012 2012 2012 2012 2012
76 A04-74 3.4 3.3 2.3 4.0 3.7 3.7 3.3 3.3 8.7 8.0 77 A99-2444 3.4 3.7 2.3 3.7 3.0 3.7 4.0 4.0 5.7 8.7 78 Avid 3.3 2.0 2.3 4.0 4.3 3.7 3.7 3.3 4.7 7.3 79 RAD-507 3.3 3.3 3.7 3.7 4.0 2.7 2.7 4.3 8.3 8.3 80 Burl 3-51 3.3 3.0 2.3 3.7 3.3 3.3 4.0 3.0 6.3 8.7
81 Burl 06-11 3.2 2.7 2.0 3.7 3.7 3.0 4.3 2.7 8.3 8.3 82 BAR 12PP 612 3.2 2.3 2.0 3.3 4.3 4.7 2.3 4.3 7.0 6.0 83 4S2W 3.1 2.0 2.7 4.0 4.0 3.7 2.7 3.7 3.3 7.7 84 A06-47 3.0 3.0 2.7 3.7 4.3 3.0 1.7 3.3 6.0 7.0 85 AKB 2555 3.0 2.7 2.3 3.3 3.3 3.3 3.0 3.3 7.3 6.0
86 PST-K9-97 3.0 2.3 2.0 3.3 5.0 3.0 2.3 4.0 9.0 3.3 87 Award 2.9 1.0 1.3 2.3 3.3 4.0 5.7 1.3 7.0 9.0 88 A05-204 2.9 3.0 2.0 3.7 3.3 2.7 2.7 4.0 7.3 9.0 89 Empire 2.5 1.3 2.0 3.3 2.3 3.0 3.0 3.0 4.3 8.0 90 Pick TD9 2.0 1.0 2.3 2.3 3.3 1.3 2.0 6.3 2.0 6.0
91 3733 2.0 1.3 1.3 2.3 2.0 2.0 3.0 1.7 7.0 8.7 92 A05-329 1.9 1.7 1.3 3.0 2.7 1.3 1.3 3.3 4.3 2.3
LSD at 5% = 1.3 1.2 1.4 1.7 1.9 1.9 2.2 1.4 1.4 1.4
19 = best turf quality 29 = best establishment 39 = least disease