Embed Size (px)
Citation preview
Resonant Ultrasonic Activation of Damage: Application forDiagnostic ImagingIgor Solodov
University of Stuttgart, Institut für Kunststofftechnik (IKT), Stuttgart, Germany
ABSTRACTDefects induced in materials are accompanied by a localdecrease of stiffness in the damaged area, which manifests intheir characteristic frequencies and a possibility of resonantactivation by a driving acoustic wave. Such Local DefectResonance (LDR) enables to reliably detect and visualize thedefect as soon as the driving acoustic frequency is matched todamage characteristic frequency. This also provides a highfrequency selectivity of the LDR-based imaging, i.e., an oppor-tunity of detecting a certain defect among a multitude of otherdefects in material. In this article, the benefits of the resonantapproach are demonstrated via multiple case studies for non-linear, optical, and thermosonic frequency-selective imaging ofdefects in lightweight materials and components.
KEYWORDSLaser vibrometry; localdefect resonance (LDR);nonlinear defect imaging;thermosonics; ultrasonicshearography
1. Introduction
As market of products and the areas of safety-critical applications of light-weight materials grow steadily, the problems of failure prognosis and damagedetection become pressing priorities. Among the multitude of methodologiesfor nondestructive evaluation (NDE) of composite materials, ultrasonic tech-niques feature simple and reliable operation based on relatively inexpensivelow-power electronics. However, despite a variety of acoustic NDE appara-tuses developed, basically all of them use the same fundamental principle: themajor implication of wave-defect interaction is considered to be reflection/scattering of ultrasound from damage in the material in question [1].
The outcome of ultrasonic reflection/scattering from a defect depends onits acoustic impedance, geometry and orientation. An important role ofultrasonic frequency of a probing wave comes to a simple rule of thumb:the higher the frequency, the better lateral resolution. However, in fiber-reinforced composite materials, the high frequency ultrasound (MHz range)often is not applicable due to substantial damping. The orientation of defectsis also difficult to change; as a result, a surface breaking crack is basically
CONTACT Igor Solodov [email protected] University of Stuttgart, Institut fürKunststofftechnik (IKT), 70569 Stuttgart, Germany.Color versions of one or more of the figures in the article can be found online at www.tandfonline.com/urnd.
RESEARCH IN NONDESTRUCTIVE EVALUATION2017, VOL. 28, NO. 1, 28–44http://dx.doi.org/10.1080/09349847.2016.1259519
© 2017 American Society for Nondestructive Testing
“invisible” for ultrasonic wave incident normal to the surface. In many cases,therefore, a low efficiency of ultrasonic reflection/scattering has to beaccepted and taken as given since no changes can be introduced in theabove mentioned factors.
The efficiency of acoustic wave-defect interaction relevant to detection andimaging can also be quantified by the amplitude of the defect vibration for thegiven amplitude of a driving wave. The increase in local vibration of thedamaged area would be beneficial for enhancing efficiency and sensitivity ofthe so-called derivative effects in acoustic wave-defect encounter. They include,for instance, nonlinear, thermal, acousto-optic responses also applied for NDEand acoustic imaging of damage. These secondary effects are normally rela-tively inefficient so that the corresponding NDE techniques require an elevatedacoustic power and stand out from conventional acoustic NDE counterpartsfor their specific instrumentation particularly adapted to high-power ultraso-nics. A natural way to increase the vibration amplitude is to drive the specimenat one of its natural frequencies. This approach is used in various ultrasonicNDE techniques with an obvious drawback of “missing” the defect due to thepresence of nodal lines in a standing wave pattern.
In this article, a new approach to acoustic imaging of damage in composites isdiscussed based on frequency-selective acoustic activation of defects by means ofLocal Defect Resonance (LDR) [2,3]. Unlike the resonance of the whole speci-men, LDR provides an efficient energy delivery from the wave directly to thedefect. It is experimentally shown that the frequency- and spatially-selectiveactivation of defects via the concept of LDR is the way to optimize efficiencyand sensitivity of damage imaging by using laser vibrometry, thermosonics,ultrasonic shearography (shearosonics), and nonlinear NDE techniques.
2. LDR concept and simulations
The concept of LDR is based on the fact that inclusion of a defect leads to alocal decrease in stiffness of a certain mass of the material in this area, whichshould manifest in a particular characteristic frequency of the defect. TheLDR frequency can be introduced as a natural frequency of the defect with aneffective rigidity Keff and mass Meff :f0 ¼ 1
2π
ffiffiffiffiffiffiffiffiffiffiffiffiffiffiffiffiffiffiKeff=Meff
p. To derive the expres-
sions for Keff and Meff , one should evaluate the potential and kinetic vibra-tion energy of the defect [4]. To clarify the physical nature of LDR, thisapproach is applied to model defects such as flat-bottomed holes (FBH). Fora circular FBH (radius R, thickness h), the expressions obtained are
Keff ¼ 192πD=R2; Meff ¼ 1:8m; (1)
while for a square FBH (side a and thickness h),
Keff ¼ 32π4D=a2; Meff ¼ 2:25m; (2)
RESEARCH IN NONDESTRUCTIVE EVALUATION 29
where D ¼ Eh3=12ð1� ν2Þ is the bending stiffness, E is Young’s modulus, νis Poisson’s ratio, and m are the masses of the material with density ρ in thebottom of the defect.
Equations (1) and (2) are then combined to yield the LDR frequencies forthe defects in question, as follows:
f0 ¼ 10h3πR2
ffiffiffiffiffiffiffiffiffiffiffiffiffiffiffiffiffiffiffiffiffiE
5ρð1� ν2Þ
s; (3)
f0 ¼ 4πh3a2
ffiffiffiffiffiffiffiffiffiffiffiffiffiffiffiffiffiffiffiffiffiE
6ρð1� ν2Þ
s: (4)
The expressions for f0 obtained above are applicable to the evaluation of thefundamental resonance frequencies of the defects, like FBH, as well aslaminar defects in rolled sheet metals and delaminations in composites. Forexample, an application of (4) to a square FBH in polymethyl methacrylate(PMMA) (h ¼ 1:2 mm; a ¼ 2 cm) yields f0 ¼ ð7:2� 9:4Þ kHz for Young’smodulus variation in the range ð1:8� 3:1Þ GPa given in the literature.
The problem in practical use of the analytical approach is concerned withthe boundary conditions for the defect edges, which were assumed to beclamped in deriving (3) and (4). This is apparently justifiable for “deep” FBH;however, in a general case the analytical formulation presented abovebecomes problematic. Instead, the finite element simulation was used tovisualize the LDR vibration patterns and to evaluate the LDR frequencies.
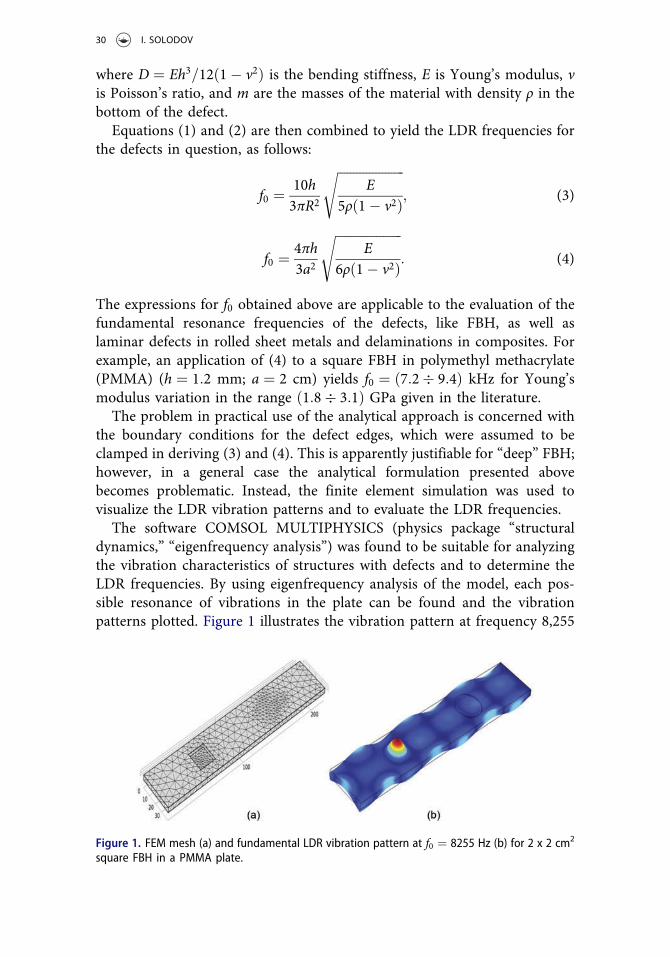
The software COMSOL MULTIPHYSICS (physics package “structuraldynamics,” “eigenfrequency analysis”) was found to be suitable for analyzingthe vibration characteristics of structures with defects and to determine theLDR frequencies. By using eigenfrequency analysis of the model, each pos-sible resonance of vibrations in the plate can be found and the vibrationpatterns plotted. Figure 1 illustrates the vibration pattern at frequency 8,255
Figure 1. FEM mesh (a) and fundamental LDR vibration pattern at f0 ¼ 8255 Hz (b) for 2 x 2 cm2
square FBH in a PMMA plate.
30 I. SOLODOV
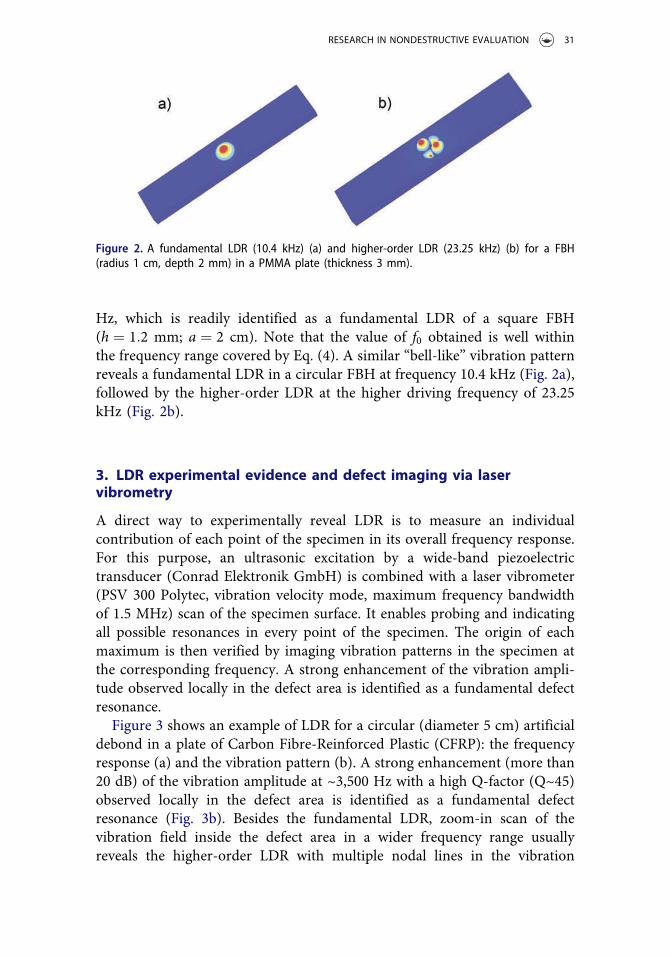
Hz, which is readily identified as a fundamental LDR of a square FBH(h ¼ 1:2 mm; a ¼ 2 cm). Note that the value of f0 obtained is well withinthe frequency range covered by Eq. (4). A similar “bell-like” vibration patternreveals a fundamental LDR in a circular FBH at frequency 10.4 kHz (Fig. 2a),followed by the higher-order LDR at the higher driving frequency of 23.25kHz (Fig. 2b).
3. LDR experimental evidence and defect imaging via laservibrometry
A direct way to experimentally reveal LDR is to measure an individualcontribution of each point of the specimen in its overall frequency response.For this purpose, an ultrasonic excitation by a wide-band piezoelectrictransducer (Conrad Elektronik GmbH) is combined with a laser vibrometer(PSV 300 Polytec, vibration velocity mode, maximum frequency bandwidthof 1.5 MHz) scan of the specimen surface. It enables probing and indicatingall possible resonances in every point of the specimen. The origin of eachmaximum is then verified by imaging vibration patterns in the specimen atthe corresponding frequency. A strong enhancement of the vibration ampli-tude observed locally in the defect area is identified as a fundamental defectresonance.
Figure 3 shows an example of LDR for a circular (diameter 5 cm) artificialdebond in a plate of Carbon Fibre-Reinforced Plastic (CFRP): the frequencyresponse (a) and the vibration pattern (b). A strong enhancement (more than20 dB) of the vibration amplitude at ~3,500 Hz with a high Q-factor (Q~45)observed locally in the defect area is identified as a fundamental defectresonance (Fig. 3b). Besides the fundamental LDR, zoom-in scan of thevibration field inside the defect area in a wider frequency range usuallyreveals the higher-order LDR with multiple nodal lines in the vibration
Figure 2. A fundamental LDR (10.4 kHz) (a) and higher-order LDR (23.25 kHz) (b) for a FBH(radius 1 cm, depth 2 mm) in a PMMA plate (thickness 3 mm).
RESEARCH IN NONDESTRUCTIVE EVALUATION 31
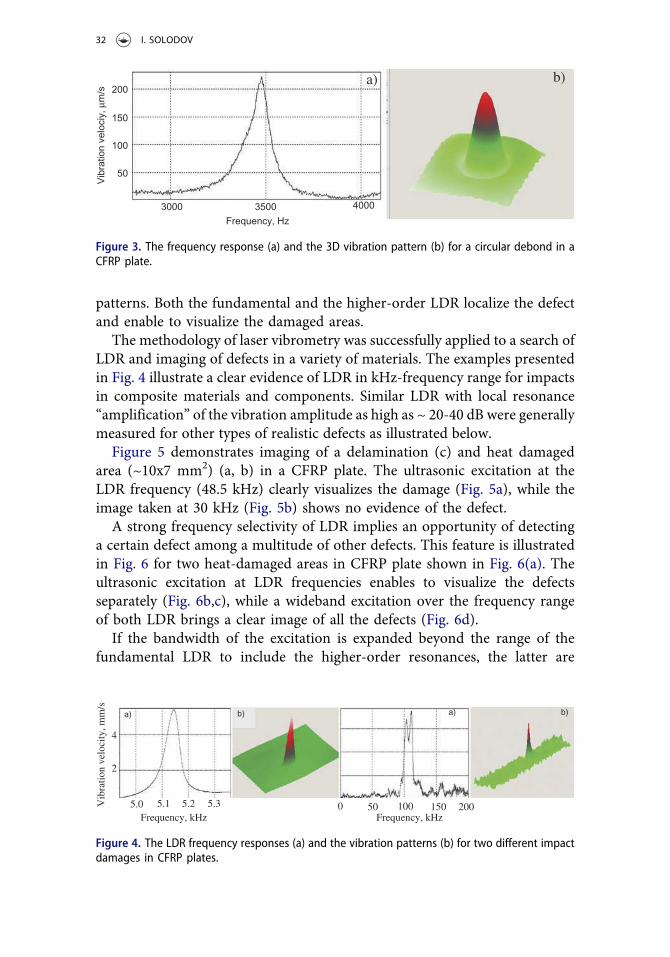
patterns. Both the fundamental and the higher-order LDR localize the defectand enable to visualize the damaged areas.
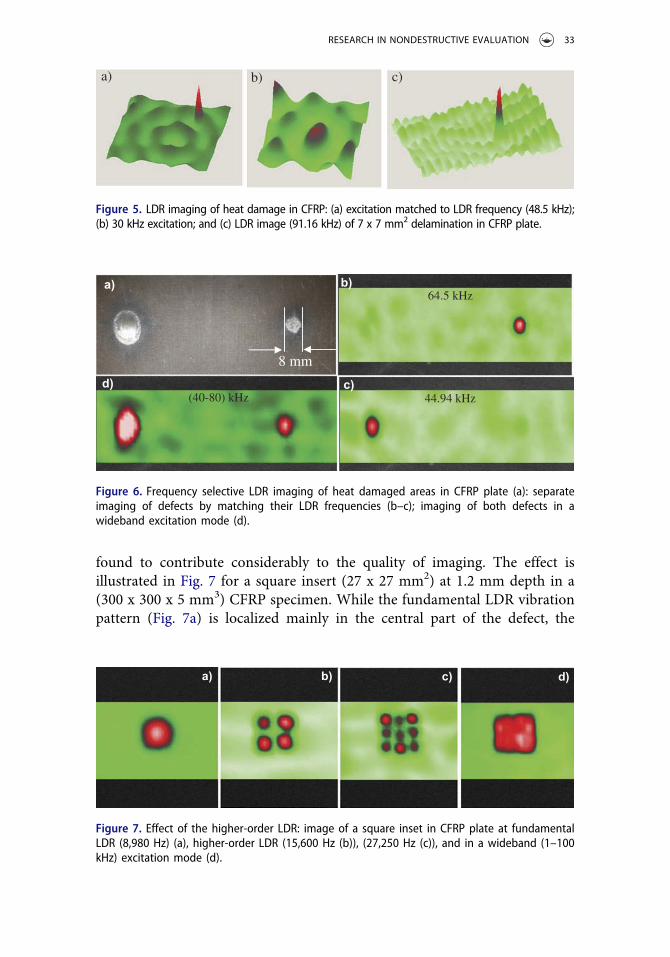
The methodology of laser vibrometry was successfully applied to a search ofLDR and imaging of defects in a variety of materials. The examples presentedin Fig. 4 illustrate a clear evidence of LDR in kHz-frequency range for impactsin composite materials and components. Similar LDR with local resonance“amplification” of the vibration amplitude as high as ~ 20-40 dB were generallymeasured for other types of realistic defects as illustrated below.
Figure 5 demonstrates imaging of a delamination (c) and heat damagedarea (~10x7 mm2) (a, b) in a CFRP plate. The ultrasonic excitation at theLDR frequency (48.5 kHz) clearly visualizes the damage (Fig. 5a), while theimage taken at 30 kHz (Fig. 5b) shows no evidence of the defect.
A strong frequency selectivity of LDR implies an opportunity of detectinga certain defect among a multitude of other defects. This feature is illustratedin Fig. 6 for two heat-damaged areas in CFRP plate shown in Fig. 6(a). Theultrasonic excitation at LDR frequencies enables to visualize the defectsseparately (Fig. 6b,c), while a wideband excitation over the frequency rangeof both LDR brings a clear image of all the defects (Fig. 6d).
If the bandwidth of the excitation is expanded beyond the range of thefundamental LDR to include the higher-order resonances, the latter are
3000 3500 4000
50
100
150
200
Frequency, Hz
Vib
ratio
n ve
loci
y, µ
m/s
a) b)
Figure 3. The frequency response (a) and the 3D vibration pattern (b) for a circular debond in aCFRP plate.
a) b)
5.0
2
4
Vib
ratio
n ve
loci
ty, m
m/s
Frequency, kHz
a)
1005.1 5.2 5.3 50 150 2000 Frequency, kHz
b)
Figure 4. The LDR frequency responses (a) and the vibration patterns (b) for two different impactdamages in CFRP plates.
32 I. SOLODOV
found to contribute considerably to the quality of imaging. The effect isillustrated in Fig. 7 for a square insert (27 x 27 mm2) at 1.2 mm depth in a(300 x 300 x 5 mm3) CFRP specimen. While the fundamental LDR vibrationpattern (Fig. 7a) is localized mainly in the central part of the defect, the
a) b) c)
Figure 5. LDR imaging of heat damage in CFRP: (a) excitation matched to LDR frequency (48.5 kHz);(b) 30 kHz excitation; and (c) LDR image (91.16 kHz) of 7 x 7 mm2 delamination in CFRP plate.
a) b)
c) d)
64.5 kHz
44.94 kHz (40-80) kHz
8 mm
Figure 6. Frequency selective LDR imaging of heat damaged areas in CFRP plate (a): separateimaging of defects by matching their LDR frequencies (b–c); imaging of both defects in awideband excitation mode (d).
a) b) c) d)
Figure 7. Effect of the higher-order LDR: image of a square inset in CFRP plate at fundamentalLDR (8,980 Hz) (a), higher-order LDR (15,600 Hz (b)), (27,250 Hz (c)), and in a wideband (1–100kHz) excitation mode (d).
RESEARCH IN NONDESTRUCTIVE EVALUATION 33
maxima of the higher-order resonances are closer to the contour parts of theinset (Fig. 7b) and gradually fill complete area of the defect (Fig. 7c). As aresult, a wideband excitation which covers a number of the higher-orderLDR visualizes clearly a total shape of the defect (Fig. 7d).
4. LDR nonlinear defect imaging
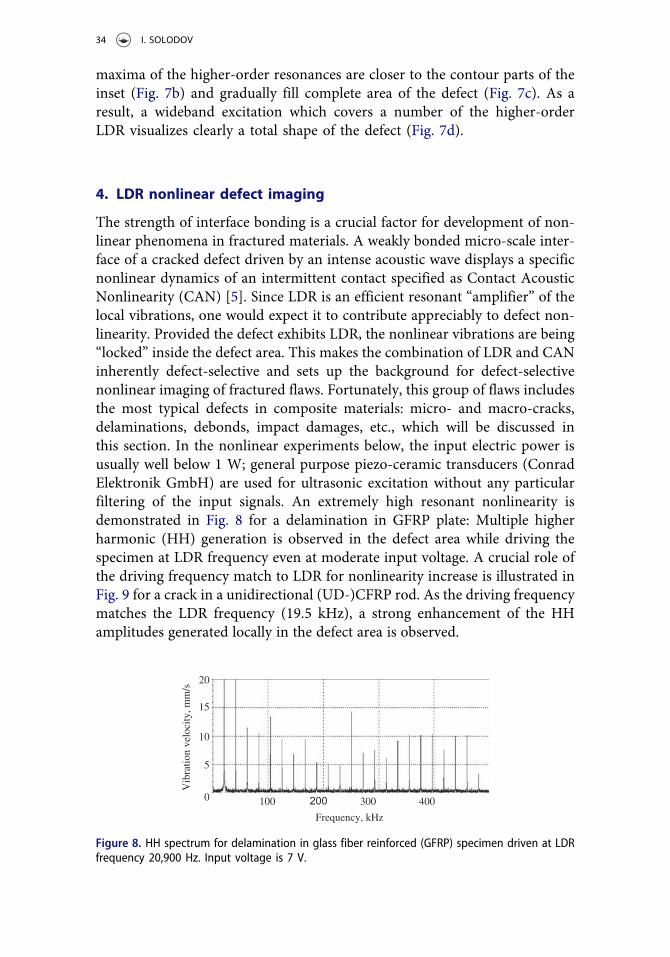
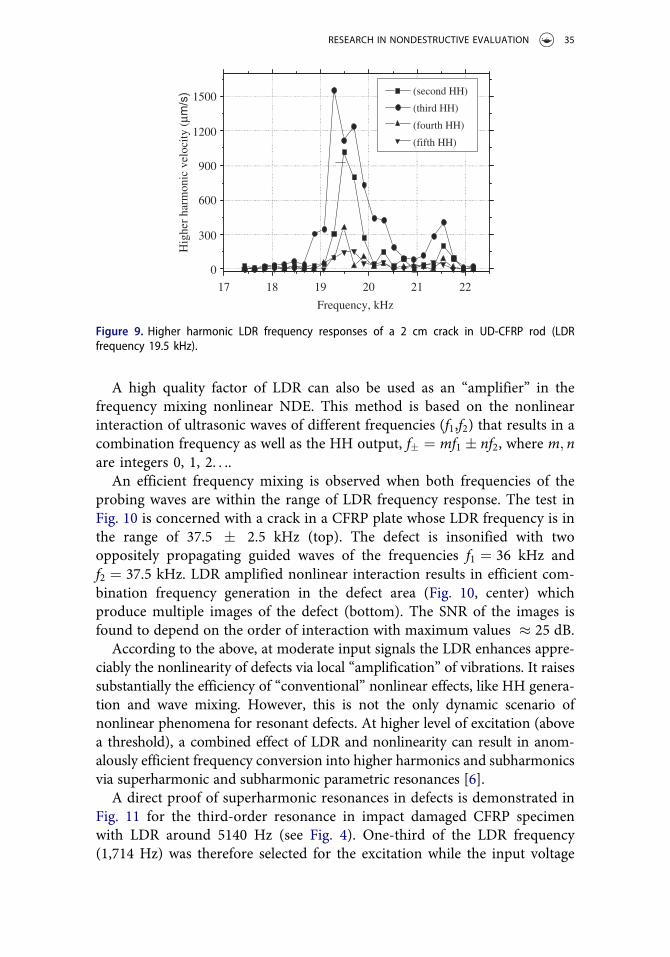
The strength of interface bonding is a crucial factor for development of non-linear phenomena in fractured materials. A weakly bonded micro-scale inter-face of a cracked defect driven by an intense acoustic wave displays a specificnonlinear dynamics of an intermittent contact specified as Contact AcousticNonlinearity (CAN) [5]. Since LDR is an efficient resonant “amplifier” of thelocal vibrations, one would expect it to contribute appreciably to defect non-linearity. Provided the defect exhibits LDR, the nonlinear vibrations are being“locked” inside the defect area. This makes the combination of LDR and CANinherently defect-selective and sets up the background for defect-selectivenonlinear imaging of fractured flaws. Fortunately, this group of flaws includesthe most typical defects in composite materials: micro- and macro-cracks,delaminations, debonds, impact damages, etc., which will be discussed inthis section. In the nonlinear experiments below, the input electric power isusually well below 1 W; general purpose piezo-ceramic transducers (ConradElektronik GmbH) are used for ultrasonic excitation without any particularfiltering of the input signals. An extremely high resonant nonlinearity isdemonstrated in Fig. 8 for a delamination in GFRP plate: Multiple higherharmonic (HH) generation is observed in the defect area while driving thespecimen at LDR frequency even at moderate input voltage. A crucial role ofthe driving frequency match to LDR for nonlinearity increase is illustrated inFig. 9 for a crack in a unidirectional (UD-)CFRP rod. As the driving frequencymatches the LDR frequency (19.5 kHz), a strong enhancement of the HHamplitudes generated locally in the defect area is observed.
100 200 300 400
Frequency, kHz
Vib
ratio
n ve
loci
ty, m
m/s
5
10
15
20
0
Figure 8. HH spectrum for delamination in glass fiber reinforced (GFRP) specimen driven at LDRfrequency 20,900 Hz. Input voltage is 7 V.
34 I. SOLODOV
A high quality factor of LDR can also be used as an “amplifier” in thefrequency mixing nonlinear NDE. This method is based on the nonlinearinteraction of ultrasonic waves of different frequencies (f1,f2) that results in acombination frequency as well as the HH output, f� ¼ mf1 � nf2, where m; nare integers 0, 1, 2. . ..
An efficient frequency mixing is observed when both frequencies of theprobing waves are within the range of LDR frequency response. The test inFig. 10 is concerned with a crack in a CFRP plate whose LDR frequency is inthe range of 37.5 � 2.5 kHz (top). The defect is insonified with twooppositely propagating guided waves of the frequencies f1 ¼ 36 kHz andf2 ¼ 37.5 kHz. LDR amplified nonlinear interaction results in efficient com-bination frequency generation in the defect area (Fig. 10, center) whichproduce multiple images of the defect (bottom). The SNR of the images isfound to depend on the order of interaction with maximum values � 25 dB.
According to the above, at moderate input signals the LDR enhances appre-ciably the nonlinearity of defects via local “amplification” of vibrations. It raisessubstantially the efficiency of “conventional” nonlinear effects, like HH genera-tion and wave mixing. However, this is not the only dynamic scenario ofnonlinear phenomena for resonant defects. At higher level of excitation (abovea threshold), a combined effect of LDR and nonlinearity can result in anom-alously efficient frequency conversion into higher harmonics and subharmonicsvia superharmonic and subharmonic parametric resonances [6].
A direct proof of superharmonic resonances in defects is demonstrated inFig. 11 for the third-order resonance in impact damaged CFRP specimenwith LDR around 5140 Hz (see Fig. 4). One-third of the LDR frequency(1,714 Hz) was therefore selected for the excitation while the input voltage
17 18 19 20 21 22
0
300
600
900
1200
1500 (second HH)
(third HH)
(fourth HH)
(fifth HH)
Hig
her
harm
onic
vel
ocity
(µm
/s)
Frequency, kHz
Figure 9. Higher harmonic LDR frequency responses of a 2 cm crack in UD-CFRP rod (LDRfrequency 19.5 kHz).
RESEARCH IN NONDESTRUCTIVE EVALUATION 35
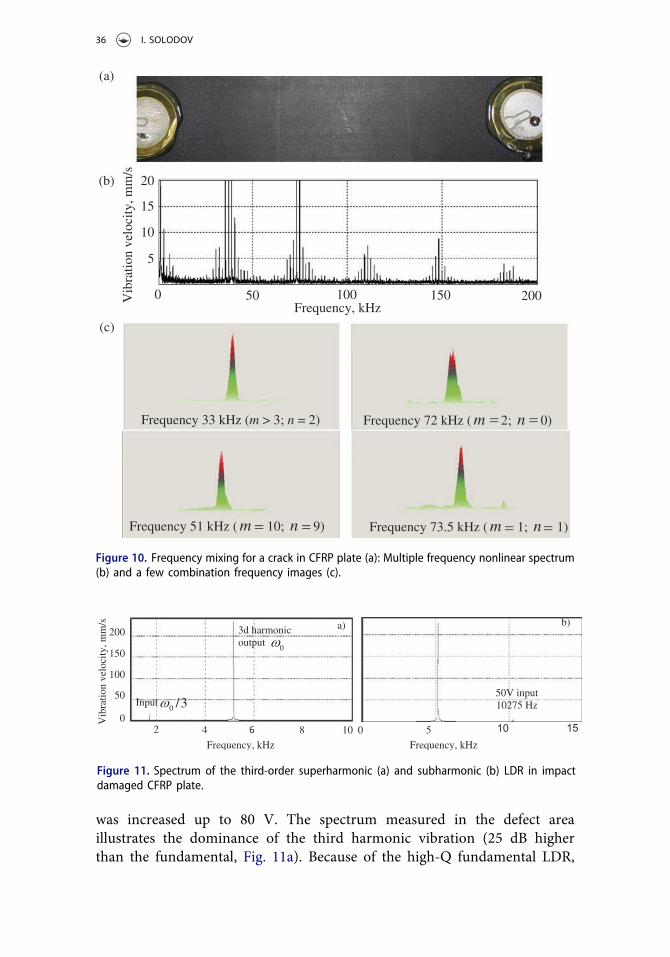
was increased up to 80 V. The spectrum measured in the defect areaillustrates the dominance of the third harmonic vibration (25 dB higherthan the fundamental, Fig. 11a). Because of the high-Q fundamental LDR,
50 100 150 0
Frequency 33 kHz (m > 3; n = 2)
5
10
15
20
(a)
(b)
(c)
Frequency, kHz
Vib
ratio
n ve
loci
ty, m
m/s
200
Frequency 72 kHz ( m 2; n 0)
Frequency 73.5 kHz ( m 1; n 1) Frequency 51 kHz ( m 10; n 9)
Figure 10. Frequency mixing for a crack in CFRP plate (a): Multiple frequency nonlinear spectrum(b) and a few combination frequency images (c).
Frequency, kHz
50V input 10275 Hz
5 10 15 0
b)
2 4 6 8
Frequency, kHz
Input
3d harmonic output
200
150
100
50
0Vib
ratio
n ve
loci
ty, m
m/s
10
3/0
0
a)
Figure 11. Spectrum of the third-order superharmonic (a) and subharmonic (b) LDR in impactdamaged CFRP plate.
36 I. SOLODOV
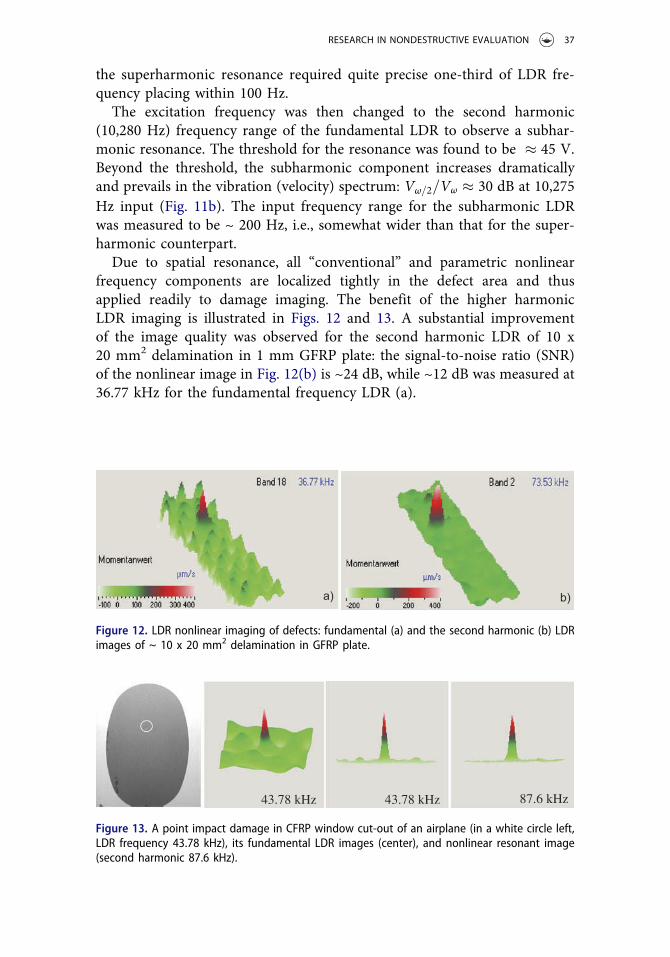
the superharmonic resonance required quite precise one-third of LDR fre-quency placing within 100 Hz.
The excitation frequency was then changed to the second harmonic(10,280 Hz) frequency range of the fundamental LDR to observe a subhar-monic resonance. The threshold for the resonance was found to be � 45 V.Beyond the threshold, the subharmonic component increases dramaticallyand prevails in the vibration (velocity) spectrum: Vω=2=Vω � 30 dB at 10,275Hz input (Fig. 11b). The input frequency range for the subharmonic LDRwas measured to be ~ 200 Hz, i.e., somewhat wider than that for the super-harmonic counterpart.
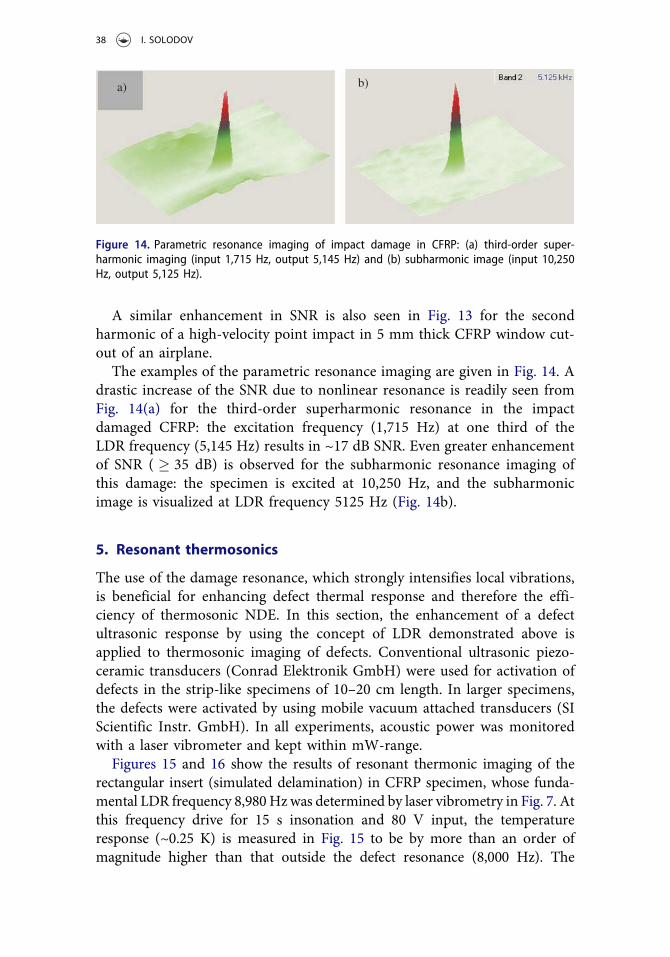
Due to spatial resonance, all “conventional” and parametric nonlinearfrequency components are localized tightly in the defect area and thusapplied readily to damage imaging. The benefit of the higher harmonicLDR imaging is illustrated in Figs. 12 and 13. A substantial improvementof the image quality was observed for the second harmonic LDR of 10 x20 mm2 delamination in 1 mm GFRP plate: the signal-to-noise ratio (SNR)of the nonlinear image in Fig. 12(b) is ~24 dB, while ~12 dB was measured at36.77 kHz for the fundamental frequency LDR (a).
Figure 12. LDR nonlinear imaging of defects: fundamental (a) and the second harmonic (b) LDRimages of ~ 10 x 20 mm2 delamination in GFRP plate.
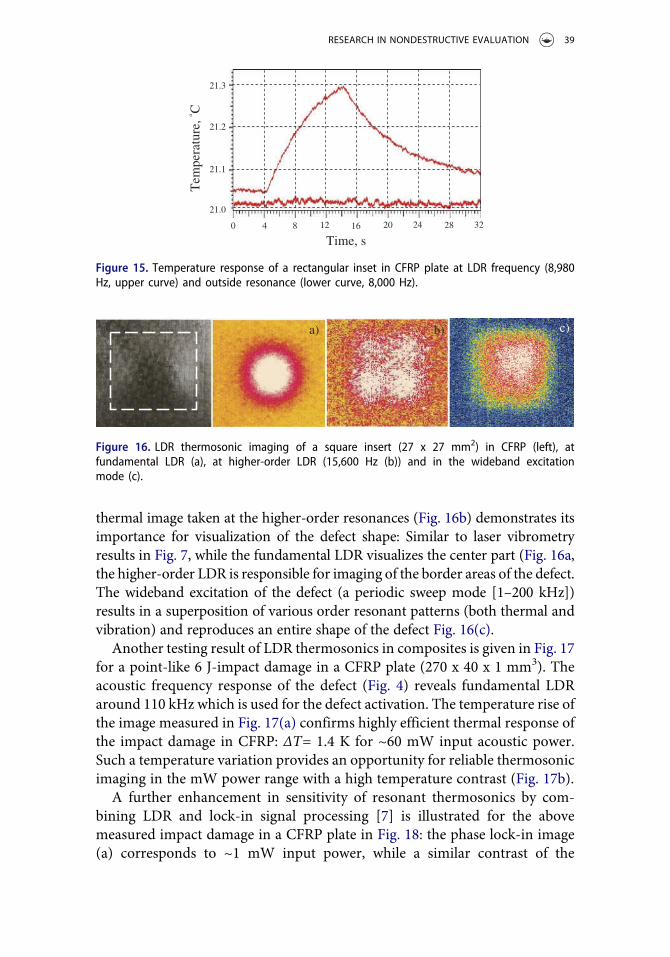
43.78 kHz 43.78 kHz 87.6 kHz
Figure 13. A point impact damage in CFRP window cut-out of an airplane (in a white circle left,LDR frequency 43.78 kHz), its fundamental LDR images (center), and nonlinear resonant image(second harmonic 87.6 kHz).
RESEARCH IN NONDESTRUCTIVE EVALUATION 37
A similar enhancement in SNR is also seen in Fig. 13 for the secondharmonic of a high-velocity point impact in 5 mm thick CFRP window cut-out of an airplane.
The examples of the parametric resonance imaging are given in Fig. 14. Adrastic increase of the SNR due to nonlinear resonance is readily seen fromFig. 14(a) for the third-order superharmonic resonance in the impactdamaged CFRP: the excitation frequency (1,715 Hz) at one third of theLDR frequency (5,145 Hz) results in ~17 dB SNR. Even greater enhancementof SNR ( � 35 dB) is observed for the subharmonic resonance imaging ofthis damage: the specimen is excited at 10,250 Hz, and the subharmonicimage is visualized at LDR frequency 5125 Hz (Fig. 14b).
5. Resonant thermosonics
The use of the damage resonance, which strongly intensifies local vibrations,is beneficial for enhancing defect thermal response and therefore the effi-ciency of thermosonic NDE. In this section, the enhancement of a defectultrasonic response by using the concept of LDR demonstrated above isapplied to thermosonic imaging of defects. Conventional ultrasonic piezo-ceramic transducers (Conrad Elektronik GmbH) were used for activation ofdefects in the strip-like specimens of 10–20 cm length. In larger specimens,the defects were activated by using mobile vacuum attached transducers (SIScientific Instr. GmbH). In all experiments, acoustic power was monitoredwith a laser vibrometer and kept within mW-range.
Figures 15 and 16 show the results of resonant thermonic imaging of therectangular insert (simulated delamination) in CFRP specimen, whose funda-mental LDR frequency 8,980Hzwas determined by laser vibrometry in Fig. 7. Atthis frequency drive for 15 s insonation and 80 V input, the temperatureresponse (~0.25 K) is measured in Fig. 15 to be by more than an order ofmagnitude higher than that outside the defect resonance (8,000 Hz). The
a) b)
Figure 14. Parametric resonance imaging of impact damage in CFRP: (a) third-order super-harmonic imaging (input 1,715 Hz, output 5,145 Hz) and (b) subharmonic image (input 10,250Hz, output 5,125 Hz).
38 I. SOLODOV
thermal image taken at the higher-order resonances (Fig. 16b) demonstrates itsimportance for visualization of the defect shape: Similar to laser vibrometryresults in Fig. 7, while the fundamental LDR visualizes the center part (Fig. 16a,the higher-order LDR is responsible for imaging of the border areas of the defect.The wideband excitation of the defect (a periodic sweep mode [1–200 kHz])results in a superposition of various order resonant patterns (both thermal andvibration) and reproduces an entire shape of the defect Fig. 16(c).
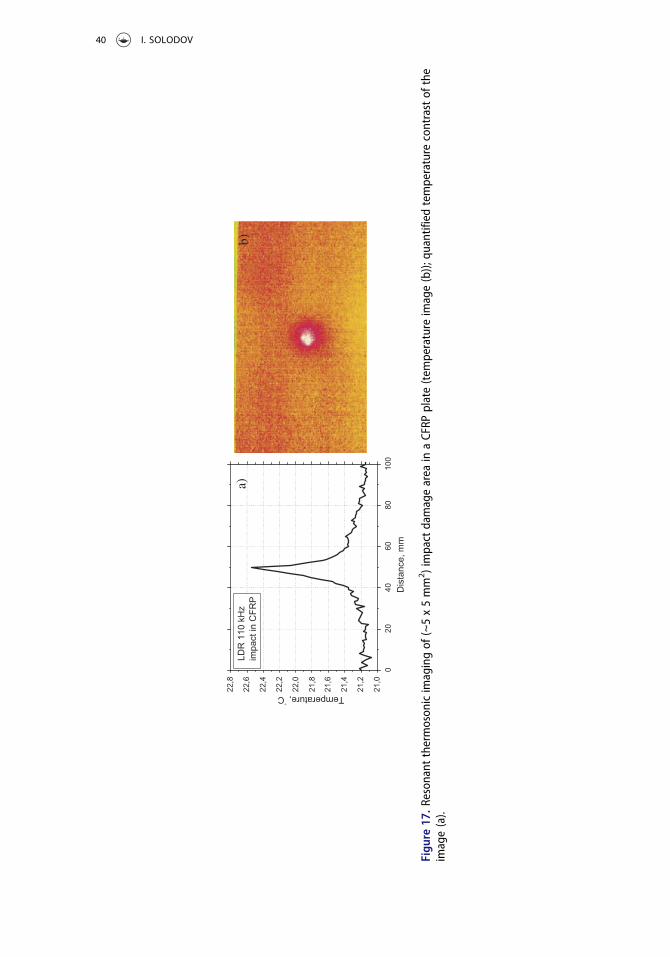
Another testing result of LDR thermosonics in composites is given in Fig. 17for a point-like 6 J-impact damage in a CFRP plate (270 x 40 x 1 mm3). Theacoustic frequency response of the defect (Fig. 4) reveals fundamental LDRaround 110 kHz which is used for the defect activation. The temperature rise ofthe image measured in Fig. 17(a) confirms highly efficient thermal response ofthe impact damage in CFRP: ΔT= 1.4 K for ~60 mW input acoustic power.Such a temperature variation provides an opportunity for reliable thermosonicimaging in the mW power range with a high temperature contrast (Fig. 17b).
A further enhancement in sensitivity of resonant thermosonics by com-bining LDR and lock-in signal processing [7] is illustrated for the abovemeasured impact damage in a CFRP plate in Fig. 18: the phase lock-in image(a) corresponds to ~1 mW input power, while a similar contrast of the
4 8 12 16 20 24 28 32 0
21.0
21.1
21.2
21.3
Time, s
Tem
pera
ture
, ° C
Figure 15. Temperature response of a rectangular inset in CFRP plate at LDR frequency (8,980Hz, upper curve) and outside resonance (lower curve, 8,000 Hz).
a) b) c)
Figure 16. LDR thermosonic imaging of a square insert (27 x 27 mm2) in CFRP (left), atfundamental LDR (a), at higher-order LDR (15,600 Hz (b)) and in the wideband excitationmode (c).
RESEARCH IN NONDESTRUCTIVE EVALUATION 39
020
4060
8010
021
,0
21,2
21,4
21,6
21,8
22,0
22,2
22,4
22,6
22,8
LDR
110
kH
z im
pact
in C
FR
PTemperature,
°C
Dis
tanc
e, m
m
a)
b)
Figu
re17.R
eson
antthermoson
icimagingof
(~5x5mm
2 )impactdamagearea
inaCFRP
plate(tem
perature
image(b));
quantifiedtemperature
contrastof
the
image(a).
40 I. SOLODOV
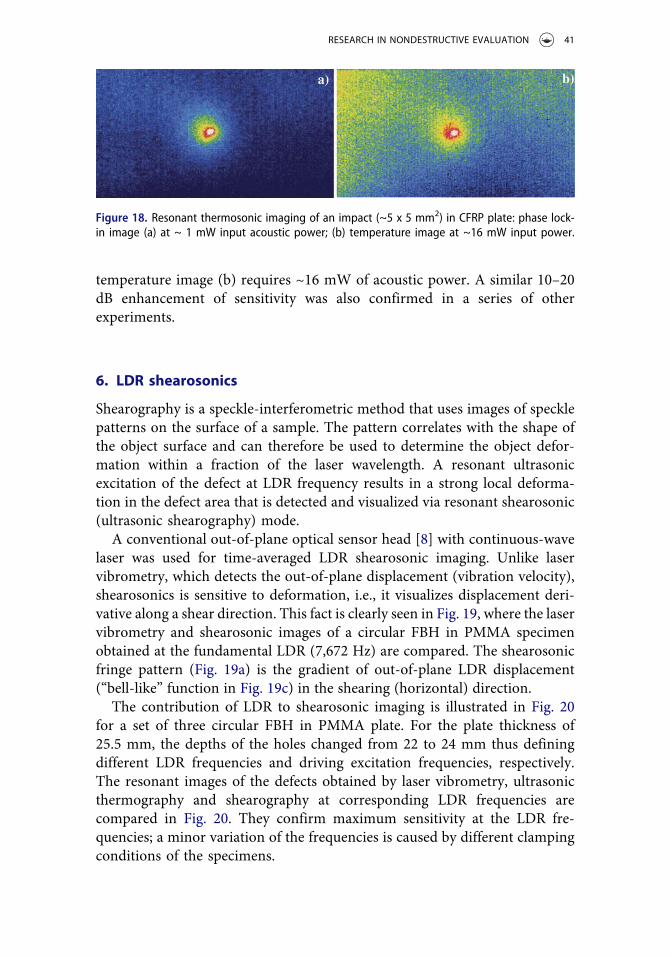
temperature image (b) requires ~16 mW of acoustic power. A similar 10–20dB enhancement of sensitivity was also confirmed in a series of otherexperiments.
6. LDR shearosonics
Shearography is a speckle-interferometric method that uses images of specklepatterns on the surface of a sample. The pattern correlates with the shape ofthe object surface and can therefore be used to determine the object defor-mation within a fraction of the laser wavelength. A resonant ultrasonicexcitation of the defect at LDR frequency results in a strong local deforma-tion in the defect area that is detected and visualized via resonant shearosonic(ultrasonic shearography) mode.
A conventional out-of-plane optical sensor head [8] with continuous-wavelaser was used for time-averaged LDR shearosonic imaging. Unlike laservibrometry, which detects the out-of-plane displacement (vibration velocity),shearosonics is sensitive to deformation, i.e., it visualizes displacement deri-vative along a shear direction. This fact is clearly seen in Fig. 19, where the laservibrometry and shearosonic images of a circular FBH in PMMA specimenobtained at the fundamental LDR (7,672 Hz) are compared. The shearosonicfringe pattern (Fig. 19a) is the gradient of out-of-plane LDR displacement(“bell-like” function in Fig. 19c) in the shearing (horizontal) direction.
The contribution of LDR to shearosonic imaging is illustrated in Fig. 20for a set of three circular FBH in PMMA plate. For the plate thickness of25.5 mm, the depths of the holes changed from 22 to 24 mm thus definingdifferent LDR frequencies and driving excitation frequencies, respectively.The resonant images of the defects obtained by laser vibrometry, ultrasonicthermography and shearography at corresponding LDR frequencies arecompared in Fig. 20. They confirm maximum sensitivity at the LDR fre-quencies; a minor variation of the frequencies is caused by different clampingconditions of the specimens.
a) b)
Figure 18. Resonant thermosonic imaging of an impact (~5 x 5 mm2) in CFRP plate: phase lock-in image (a) at ~ 1 mW input acoustic power; (b) temperature image at ~16 mW input power.
RESEARCH IN NONDESTRUCTIVE EVALUATION 41
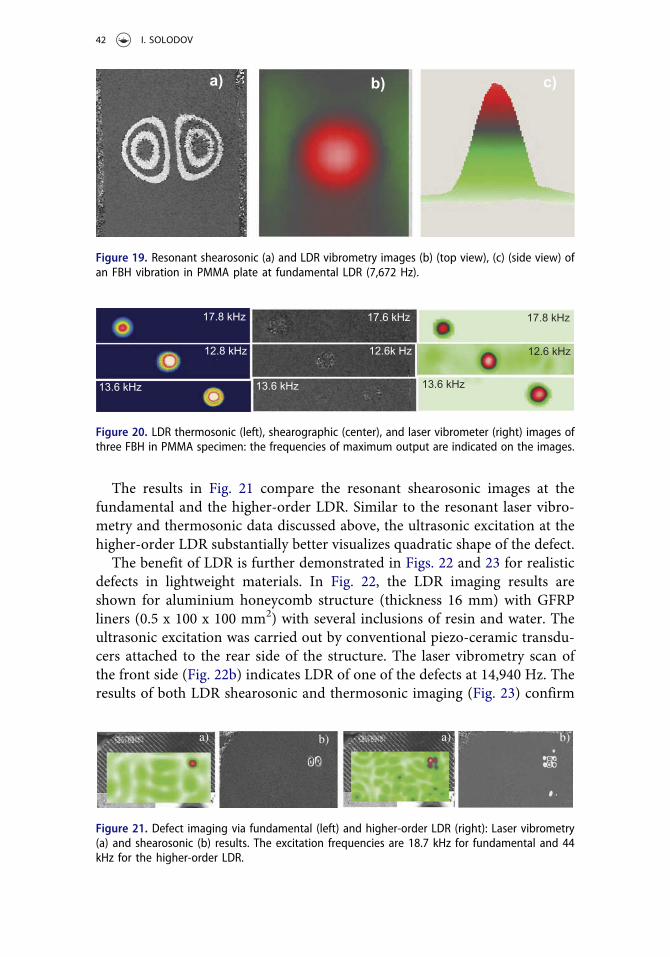
The results in Fig. 21 compare the resonant shearosonic images at thefundamental and the higher-order LDR. Similar to the resonant laser vibro-metry and thermosonic data discussed above, the ultrasonic excitation at thehigher-order LDR substantially better visualizes quadratic shape of the defect.
The benefit of LDR is further demonstrated in Figs. 22 and 23 for realisticdefects in lightweight materials. In Fig. 22, the LDR imaging results areshown for aluminium honeycomb structure (thickness 16 mm) with GFRPliners (0.5 x 100 x 100 mm2) with several inclusions of resin and water. Theultrasonic excitation was carried out by conventional piezo-ceramic transdu-cers attached to the rear side of the structure. The laser vibrometry scan ofthe front side (Fig. 22b) indicates LDR of one of the defects at 14,940 Hz. Theresults of both LDR shearosonic and thermosonic imaging (Fig. 23) confirm
a) b) c)
Figure 19. Resonant shearosonic (a) and LDR vibrometry images (b) (top view), (c) (side view) ofan FBH vibration in PMMA plate at fundamental LDR (7,672 Hz).
17.8 kHz 17.6 kHz
12.6k Hz12.8 kHz
13.6 kHz 13.6 kHz 13.6 kHz
12.6 kHz
17.8 kHz
Figure 20. LDR thermosonic (left), shearographic (center), and laser vibrometer (right) images ofthree FBH in PMMA specimen: the frequencies of maximum output are indicated on the images.
a) b) a) b)
Figure 21. Defect imaging via fundamental (left) and higher-order LDR (right): Laser vibrometry(a) and shearosonic (b) results. The excitation frequencies are 18.7 kHz for fundamental and 44kHz for the higher-order LDR.
42 I. SOLODOV
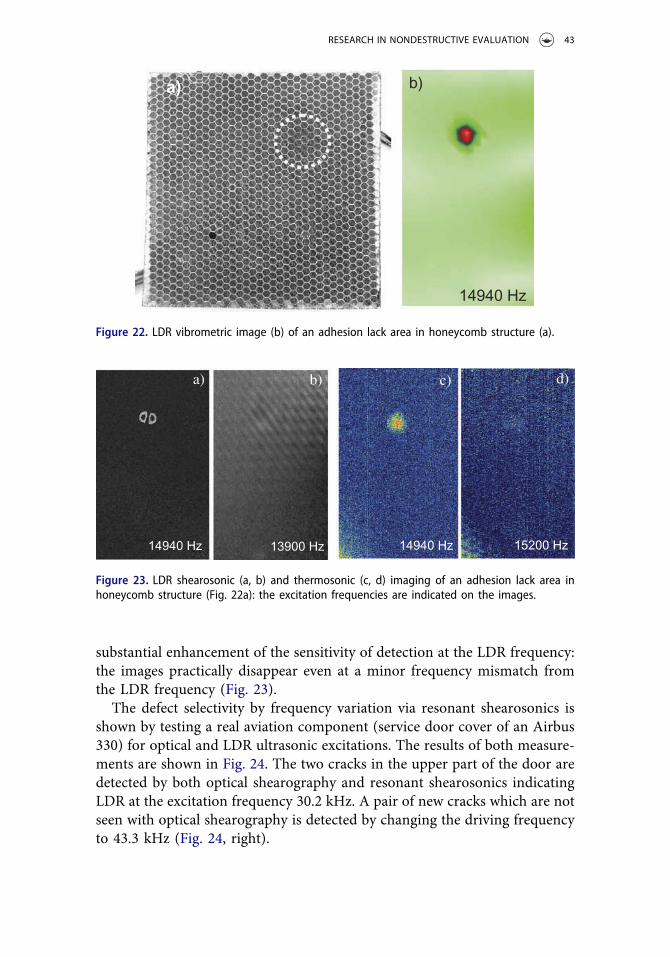
substantial enhancement of the sensitivity of detection at the LDR frequency:the images practically disappear even at a minor frequency mismatch fromthe LDR frequency (Fig. 23).
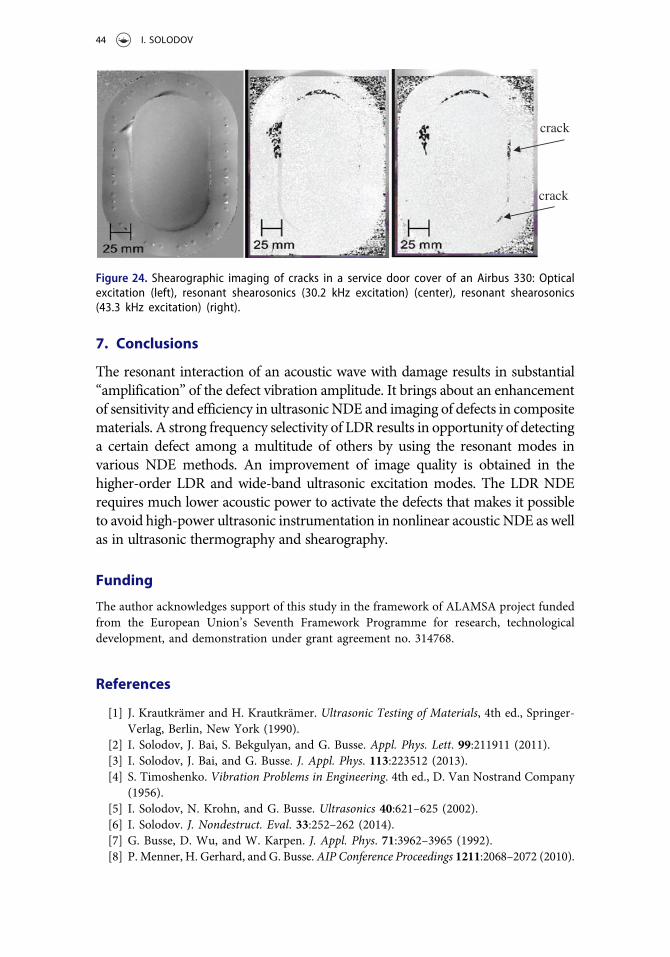
The defect selectivity by frequency variation via resonant shearosonics isshown by testing a real aviation component (service door cover of an Airbus330) for optical and LDR ultrasonic excitations. The results of both measure-ments are shown in Fig. 24. The two cracks in the upper part of the door aredetected by both optical shearography and resonant shearosonics indicatingLDR at the excitation frequency 30.2 kHz. A pair of new cracks which are notseen with optical shearography is detected by changing the driving frequencyto 43.3 kHz (Fig. 24, right).
a) b)
14940 Hz
Figure 22. LDR vibrometric image (b) of an adhesion lack area in honeycomb structure (a).
14940 Hz 14940 Hz 13900 Hz 15200 Hz
a) b) c) d)
Figure 23. LDR shearosonic (a, b) and thermosonic (c, d) imaging of an adhesion lack area inhoneycomb structure (Fig. 22a): the excitation frequencies are indicated on the images.
RESEARCH IN NONDESTRUCTIVE EVALUATION 43
7. Conclusions
The resonant interaction of an acoustic wave with damage results in substantial“amplification” of the defect vibration amplitude. It brings about an enhancementof sensitivity and efficiency in ultrasonic NDE and imaging of defects in compositematerials. A strong frequency selectivity of LDR results in opportunity of detectinga certain defect among a multitude of others by using the resonant modes invarious NDE methods. An improvement of image quality is obtained in thehigher-order LDR and wide-band ultrasonic excitation modes. The LDR NDErequires much lower acoustic power to activate the defects that makes it possibleto avoid high-power ultrasonic instrumentation in nonlinear acoustic NDE as wellas in ultrasonic thermography and shearography.
Funding
The author acknowledges support of this study in the framework of ALAMSA project fundedfrom the European Union’s Seventh Framework Programme for research, technologicaldevelopment, and demonstration under grant agreement no. 314768.
References
[1] J. Krautkrämer and H. Krautkrämer. Ultrasonic Testing of Materials, 4th ed., Springer-Verlag, Berlin, New York (1990).
[2] I. Solodov, J. Bai, S. Bekgulyan, and G. Busse. Appl. Phys. Lett. 99:211911 (2011).[3] I. Solodov, J. Bai, and G. Busse. J. Appl. Phys. 113:223512 (2013).[4] S. Timoshenko. Vibration Problems in Engineering. 4th ed., D. Van Nostrand Company
(1956).[5] I. Solodov, N. Krohn, and G. Busse. Ultrasonics 40:621–625 (2002).[6] I. Solodov. J. Nondestruct. Eval. 33:252–262 (2014).[7] G. Busse, D. Wu, and W. Karpen. J. Appl. Phys. 71:3962–3965 (1992).[8] P. Menner, H. Gerhard, and G. Busse.AIP Conference Proceedings 1211:2068–2072 (2010).
crack
crack
Figure 24. Shearographic imaging of cracks in a service door cover of an Airbus 330: Opticalexcitation (left), resonant shearosonics (30.2 kHz excitation) (center), resonant shearosonics(43.3 kHz excitation) (right).
44 I. SOLODOV