Embed Size (px)
Citation preview

Residual current analysis system DRCA 1
Instructions for use
and technical information
www --------- doepke.de
Doepke

Liability
All information contained in this document belonging to Doepke Schaltgeräte GmbH is protected by copyright. The reproduction and processing, altering and/or transfer against payment of such information is permissible only with the express written approval of Doepke Schaltgeräte GmbH. This information is provided solely as customer information and does not constitute a binding guarantee or undertaking. It is subject to changes at any time, be it in technical content or in price/commercial terms. Binding statements can only be given following specific enquiries.
The use of this document is solely at your own discretion. Doepke Schaltgeräte GmbH accepts no liability for any damages arising from the use of this document, in particular breakdown of operations, loss of earnings, loss of information and data or consequential damages, except in cases of compulsory liability, e.g. as provided for by the Product Liability Law, or in cases of premeditation, gross negligence, absence of promised capabilities or because of infringement of fundamental contractual obligations.
Compensation for infringement of fundamental contract obligations shall, however, be limited to contract-typical foreseeable damage, provided there is no premeditation or gross negligence.
Copyright © Doepke Schaltgeräte GmbH

Technical Information
June 2021

1. TheDRCA 1residualcurrentanalysissystem
1.1 Intended use of the device ––––––––––––––––––––––––––––––––––––––––––––––––––––––––––––––––– page 6
2. Installation –––––––––––––––––––––––––––––––––––––––––––––––––––––––––––––––––––––––––––––––––––– page 7
3. Connectingthedevice –––––––––––––––––––––––––––––––––––––––––––––––––––––––––––––––––––––– page 7
4. Mainmenu––––––––––––––––––––––––––––––––––––––––––––––––––––––––––––––––––––––––––––––––––––– page 9
5. Generalsignalanalysis
5.1 Current Waveform ––––––––––––––––––––––––––––––––––––––––––––––––––––––––––––––––––––––––––– page 105.2 RMS Values ––––––––––––––––––––––––––––––––––––––––––––––––––––––––––––––––––––––––––––––––––– page 115.3 Frequency Analysis ––––––––––––––––––––––––––––––––––––––––––––––––––––––––––––––––––––––––– page 125.4 Triggermode –––––––––––––––––––––––––––––––––––––––––––––––––––––––––––––––––––––––––––––––––– page 14
6. DataStorage
6.1 Store RMS Values –––––––––––––––––––––––––––––––––––––––––––––––––––––––––––––––––––––––––––– page 156.2 Read RMS Values ––––––––––––––––––––––––––––––––––––––––––––––––––––––––––––––––––––––––––––– page 17
7. RatedAnalysis
7.1 Choose Productgroup ––––––––––––––––––––––––––––––––––––––––––––––––––––––––––––––––––––––– page 197.2 Explanation of Rated Analysis ––––––––––––––––––––––––––––––––––––––––––––––––––––––––––––– page 207.3 Productgroup(usingtheexampleofDFS 4 B) –––––––––––––––––––––––––––––––––––––––––– page 217.4 Colour coding ––––––––––––––––––––––––––––––––––––––––––––––––––––––––––––––––––––––––––––––––– page 22
8. Notesandapplicationtips
8.1 Maximum frequency –––––––––––––––––––––––––––––––––––––––––––––––––––––––––––––––––––––––– page 228.2 Screen resolution –––––––––––––––––––––––––––––––––––––––––––––––––––––––––––––––––––––––––––– page 238.3 Crossover frequencies in the tripping current frequency response –––––––––––––––– page 238.4 Computer processor load –––––––––––––––––––––––––––––––––––––––––––––––––––––––––––––––––– page 238.5 Switch selection after RCD overview –––––––––––––––––––––––––––––––––––––––––––––––––––– page 23
9. Ratingdata
9.1 Supply voltage ––––––––––––––––––––––––––––––––––––––––––––––––––––––––––––––––––––––––––––––– page 249.2 Description of input connections ––––––––––––––––––––––––––––––––––––––––––––––––––––––––– page 249.3 Environmental conditions –––––––––––––––––––––––––––––––––––––––––––––––––––––––––––––––––– page 24
Content

9.4 Installation requirements ––––––––––––––––––––––––––––––––––––––––––––––––––––––––––––––––––– page 249.5 Connection to the power supply –––––––––––––––––––––––––––––––––––––––––––––––––––––––––– page 249.6 Ventilation and cooling ––––––––––––––––––––––––––––––––––––––––––––––––––––––––––––––––––––– page 249.7 Residual current input ––––––––––––––––––––––––––––––––––––––––––––––––––––––––––––––––––––––– page 249.8 Symbols ––––––––––––––––––––––––––––––––––––––––––––––––––––––––––––––––––––––––––––––––––––––– page 259.9 Cleaning and consumable materials ––––––––––––––––––––––––––––––––––––––––––––––––––––– page 259.10 Operational safety ––––––––––––––––––––––––––––––––––––––––––––––––––––––––––––––––––––––––––– page 259.11 Maintenance –––––––––––––––––––––––––––––––––––––––––––––––––––––––––––––––––––––––––––––––––– page 259.12 Warranty –––––––––––––––––––––––––––––––––––––––––––––––––––––––––––––––––––––––––––––––––––––– page 259.13 Measurement category ––––––––––––––––––––––––––––––––––––––––––––––––––––––––––––––––––––– page 259.14 Firmware and updates –––––––––––––––––––––––––––––––––––––––––––––––––––––––––––––––––––––– page 25
10. Technicaldata –––––––––––––––––––––––––––––––––––––––––––––––––––––––––––––––––––––––––––––––– page 26
10.1 Product overview/Article numbers ––––––––––––––––––––––––––––––––––––––––––––––––––––––– page 27

6 / 7
1. TheDRCA 1residualcurrentanalysissystem
1.1 Intendeduseofthedevice
The device is used exclusively for the measurement of residual currents with the DRCA 1-CT residual current transformer intended for this purpose. Load currents, e.g. motor currents, may not be measured. The device may not be operated for measurement without a transformer. If the measurement device is to be used to investigate the direct effect of the residual current on the residual current circuit-breaker, the residual current transformer must be electrically installed where the residual current circuit-breaker is located. The residual current transformer is to be permanently installed when the distribution board is free from voltage. The DRCA 1-MC cable is to be used for measurement. The installation of the transformer must only be performed by qualified electricians.
Important:The device must only be used under the conditions and for the purposes for which it was designed. Operational safety is not guaranteed in the event of modification, conversion or unintended use.
Scopeofdelivery
1 × installation USB stick DRCA 1 V2-SW1 × measuring unit DRCA 11 × connection cable DRCA 1-MC1 × transducer DRCA 1-CT 0701 × USB cable1 × manual/documentation

THEDRCA 1RESIDUALCURRENTANALYSISSYSTEM
2. Installation
Note ���������������� The software requires approximately 500 MB of free hard disk space. The device must not be connected to start with. After executing the pro-gram Setup_DRCA1_V2_en.exe, follow the further instructions in the installation program. It will then prompt a restart, which is compulsory.
3. Connecting the device
Fig. 1: Schematic structure of the measuring system

8 / 9
When the distribution board is free from voltage, the DRCA 1-CT series transformer is permanently installed in the distribution board by qualified electricians. The transformer should be electrically con-nected to the circuit directly after the residual current circuit-breaker. The three phases and the neutral conductor must be guided through the transformer. The transformer is then connected to the measuring unit using the associated DRCA 1-MC measuring cable. The USB connector of the measuring unit must be connected to a free USB port on the computer.
The residual current circuit-breaker may need to be bypassed or removed while the measurement is being carried out in order to prevent it being tripped due to a false alarm during the measurement.
USB
power
DRCA 1-CT
Fig. 2: Front view of measuring unit (schematic)
The figure shows a front view of the measuring unit with the connectors for the USB cable and the DRCA 1-CT residual current transformer. The 'Power' LED is located between these: it will flash as soon as the device receives voltage via the USB connection.
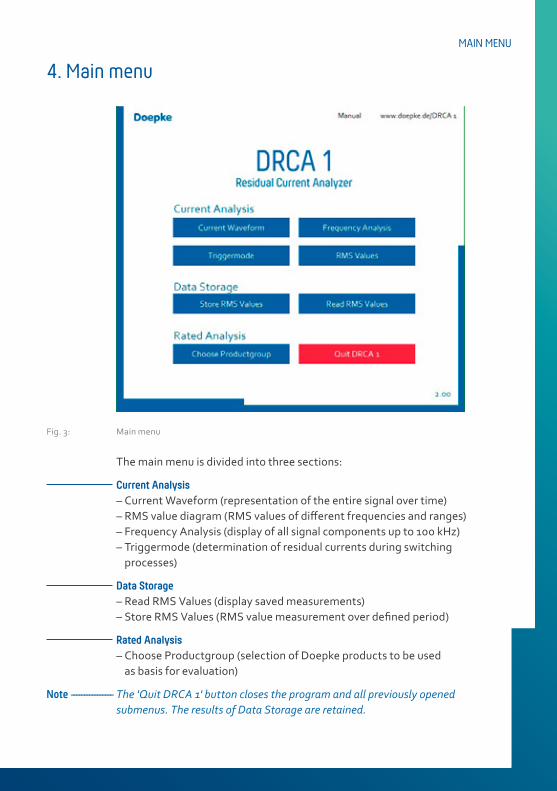
4. Main menu
Fig. 3: Main menu
The main menu is divided into three sections:
CurrentAnalysis– Current Waveform (representation of the entire signal over time)– RMS value diagram (RMS values of different frequencies and ranges)– Frequency Analysis (display of all signal components up to 100 kHz)– Triggermode (determination of residual currents during switching
processes)
DataStorage– Read RMS Values (display saved measurements)– Store RMS Values (RMS value measurement over defined period)
RatedAnalysis– Choose Productgroup (selection of Doepke products to be used
as basis for evaluation)
Note ���������������� The 'Quit DRCA 1' button closes the program and all previously opened submenus. The results of Data Storage are retained.
MAINMENU

10 / 11
5. General signal analysis
5.1 CurrentWaveform
Fig. 4: Signal progression
The measuring signal is shown in terms of its progression over time. The X and Y axes of the diagram can be scaled as desired. There are two sliders with additional entry fields on the diagram for this purpose. The setting is adjusted using the mouse via the slider or by entering numbers on the keyboard. Two cursors can be seen in the diagram. These can be moved freely over the graphs. The X and Y positions of the cursor are displayed in the caption beneath the diagram. The differences between the cursor positions as ∆Y and ∆X are also additionally shown in the graphs themselves, as well as the frequency arising from the positions: 1/∆X. The overall RMS of the current is also displayed.
When scaling the current and time axis, the cursors retain their position, which may mean that they are outside of the visible area. The 'Centre cursors' button sets the positions of the cursors inside the current image section. To improve readability, the signal can be 'frozen', primarily in order to be able to position the cursor better. The signal will then no longer be updated.

The 'Screenshot' button has been added for documentation purpos-es. When this button is pressed, an image of the screen is saved. The user is informed of the save location and the file names used.
5.2 RMSValues
Fig. 5: RMS value display
In order to extract particularly interesting frequency components and ranges from the residual current, various filters are applied to the RMS value display. The RMS of the measured current is displayed for each frequency and frequency range. The display is provided in the form of a bar chart and a text display of the exact value. The bar scaling is performed using the 'Display Final Value' in mA slider. The frequency components listed in Table 1 are displayed.
overallsignal
50 Hz
cannot be changed150 Hz
up to 100 Hz
100 Hz to 1 kHzStandard values when opened; can be freely selected by entry
in the fields above the bar charts.less than 1 kHz
more than 1 kHz
Table 1: RMS value diagram bar chart
GENERALSIGNALANALYSIS

12 / 13
5.3 FrequencyAnalysis
Fig. 6: Frequency analysis
In the frequency analysis, all frequency components from 10 Hz to 100 kHz present in the measuring signal are displayed. The whole spectrum of effective frequency components in the overall signal is shown. The scaling of the frequency and current axis is done via the sliders or associated text fields beneath the graph on the left. It is possible for the values in the text fields to be higher or lower than those set by the sliders. The display of the measurement result can be adapted using two buttons: Both the frequency and the current can be shown with either logarithmic or linear scaling. A coarse or fine grid can be used for the current and frequency axis. These can be selected using the four buttons 'Small Grid' and 'Main Grid'. The two cursors can be moved freely over the graphs. The positions of the cursors are shown in the caption. The graphs also contain additional displays for the ∆Y and ∆X of the cursors. If, due to the scaling, the cursors are outside of the visible area, they can be moved back to the current image section using the 'Centre cursors' button.
If the 'Trigger' button is enabled, the display is only updated when the residual current exceeds the set trigger level (blue cursor).

Note ���������������� If, for example, a trigger level of 300 mA is set and enabled, a residual current of 200 mA would no longer be displayed. In order to avoid erroneous measurement, the trigger is therefore disabled by default.
Fig. 7: Menu hidden Fig. 8: Menu visible
If the mouse pointer is moved to the 'Characteristic curves of AC-DC sensitive products' bar, a further menu will open.
Here, a model can be selected from the product groups
DFS 4 BDFS 4 B+DFS 4 B MIDFL 8 BDCTR BDMRCD 1 B+DRCM 1 B+
in some cases with sub-groups, the tripping current frequency response of which is then shown in the diagram. The product which is currently selected is shown beneath the graphs. By moving the mouse pointer to the right-hand bar in the characteristic curve menu, this menu will be hidden, the characteristic curve remains in the graphs until 'no characteristic curve' is selected.
GENERALSIGNALANALYSIS
14 / 15
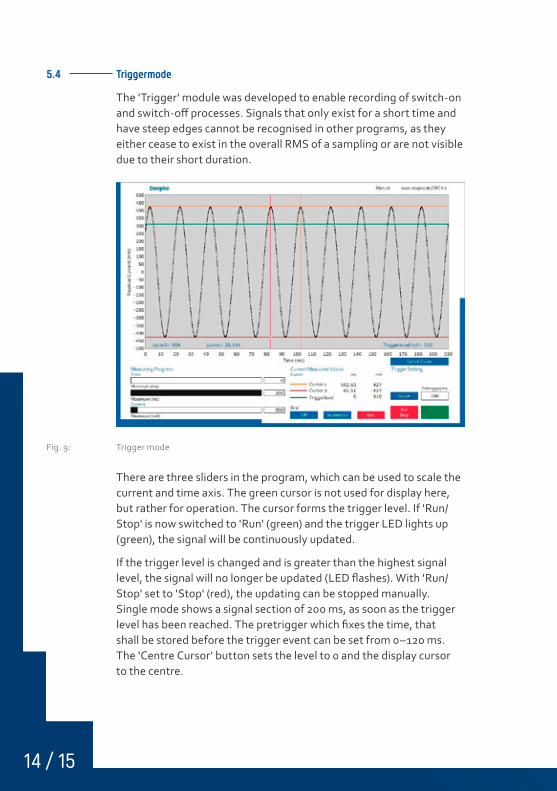
5.4 Triggermode
The 'Trigger' module was developed to enable recording of switch-on and switch-off processes. Signals that only exist for a short time and have steep edges cannot be recognised in other programs, as they either cease to exist in the overall RMS of a sampling or are not visible due to their short duration.
Fig. 9: Trigger mode
There are three sliders in the program, which can be used to scale the current and time axis. The green cursor is not used for display here, but rather for operation. The cursor forms the trigger level. If 'Run/Stop' is now switched to 'Run' (green) and the trigger LED lights up (green), the signal will be continuously updated.
If the trigger level is changed and is greater than the highest signal level, the signal will no longer be updated (LED flashes). With 'Run/Stop' set to 'Stop' (red), the updating can be stopped manually. Single mode shows a signal section of 200 ms, as soon as the trigger level has been reached. The pretrigger which fixes the time, that shall be stored before the trigger event can be set from 0–120 ms. The 'Centre Cursor' button sets the level to 0 and the display cursor to the centre.

6. Data Storage
In addition to the values shown in chapter 5.2 ('RMS value diagram'), the peak value determined in each measurement cycle is also saved.
6.1 StoreRMSValues
Fig. 10: Recording of measured values after the program has been opened
When the program is first opened, all elements except for 'Define save location' are disabled. The current date and time are displayed at the top of the program. This corresponds to the time details set on the computer.
Before a measurement can be started, the save location for the meas-urement file must be defined. The file path can be freely selected through the standard Windows file dialog. The file format is restricted to *.txt. If an attempt is made to select other file types or to overwrite existing files, an error message is generated by the program and a new selection is requested. Once the save location has been defined, the previously blocked operating elements are made available.
DATA STORAGE

16 / 17
Fig. 11: Manual recording of measured values Fig. 12: Automatic recording of measured values
Via the 'Startmode' element, the user can define whether the measurements should be taken manually or started automatically at a particular time. The measurement can, however, only begin once a correct time setting has been displayed by the program: Times in the past and end times that are earlier than the start time for the measurements cannot be accepted.
ManualStartmode(button)
If the setting is correct, the measurement can be activated using 'Start measurement'.
AutomaticStartmode(specifiedtime)
If the time setting is correct, the measurement starts automatically as soon as the set 'Measurement start time' is reached.
Fig. 13: Active measurements Fig. 14: Abort active measurements

As soon as the measurement is started, all elements are blocked to the user, except for 'Cancel Storage'. The measurement ends automatically once the 'Measurement end time' is reached, although it can be ended before this using 'Early termination'. Data recorded up to this point is saved. The remaining memory time is indicated by a progress bar. This process can take up to 20 seconds. The recorded data is saved as text files on the computer. For every day of long-term measurement, a new file is created with the name specified before the start and the date affixed.
A file contains at most 24 hours of measurement data; for a measure-ment lasting one week, seven files would be generated. This proce-dure ensures that not all of the data is lost in the event of a computer crash.
6.2 ReadRMSValues
Fig. 15: Read RMS Values
Previously recorded measured values can be easily displayed using the 'Open file' button: After selecting the desired measured data file, the corresponding data will be loaded. Only files with the extension *.txt which contain correct measurement data can be read. If a different file type is selected or in the event of incorrect content, the user will be informed accordingly.
DATA STORAGE

18 / 19
The progression of RMS values across the entire time period is now shown. The beginning and end of the measurements is indicated beneath the diagram. The X-axis of the graphs shows the time elapsed since the start of measurements. This is set to seconds by default when opened, but can be changed to minutes and hours using the button in the axis label.
After opening a file, the 'Overall signal' display is always set to begin with by default. By simply clicking on the other frequencies, it can be seen whether and to what extent signal components were present in these frequencies during the measurement period. The button for the currently selected area is highlighted in green.
The Y-axis, which shows the effective current in mA, can be scaled using the slider or the text field beneath. The X-axis can, for closer observation of a period, also be individually adjusted, but only via the two text fields beneath the diagram. In this way, by using 'Min. time' and 'Max. time', a particular time range can be shown in more detail. Using the 'Reset' button, the values 0 to maximum measurement duration are restored.
The cursors and cursor caption have the same properties as in chapter 5.1 ('Signal progression'). It is also possible to take screenshots at this stage. It is always the visible area that is recorded, so that images can be taken of all frequency ranges.

7. Rated Analysis
7.1 ChooseProductgroup
Fig. 16: Product group overview menu
By selecting 'Product group selection' in the main menu, an overview menu opens.
The product groups
DFS 4 BDFS 4 B+DFS 4 B MIDFL 8 BDCTR BDMRCD 1 B+DRCM 1 B+
produced by Doepke Schaltgeräte GmbH are available, which can measure the residual current to be evaluated.
As the program operation for each product group is identical, the function is explained using one selected group (DFS 4 B). There follows a brief explanation of why an evaluated analysis is actually necessary.
RATEDANALYSIS

20 / 21
7.2 ExplanationofRatedAnalysis
AC-DC sensitive residual current circuit-breakers evaluate current differently depending on frequency and are also sensitive to currents at higher frequencies. Types with tripping currents of 100 mA can be seen in the tripping frequency response in Fig. 17.
Further information on this topic can also be found in Doepke's brochure: 'AC-DC sensitive residual current devices: RCD Type B'.
Fig. 17: Tripping current frequency response DFS 4 B+/B NK/B SK, 100 mA
These are the tripping current frequency responses of the DFS 4 B+, DFS 4 B NK and DFS 4 B SK residual current circuit-breakers – 100 mA in each case. The comparison highlights the different tripping ranges above 100 Hz. For instance, it can be seen that type B SK is less sen-sitive than type B NK and therefore only trips in response to greater residual currents. The bars represent the range in which the switches must trip. In order to evaluate the tripping current, the middle of these ranges is used in the software for the respective type.

7.3 Productgroup(usingtheexampleofDFS 4 B)
Fig. 18: Overview DFS 4 B
In this view, the viewing window is divided into two areas. In the left-hand part of the image, there is an overview of all designs in the selected product group. For each type it is shown at what percentage tripping occurs, i.e. what percentage of the tripping current is effec-tively reached overall across the entire frequency range from 10 Hz to 100 kHz. The diagram in the right-hand part of the image is similar to the frequency analysis, although absolute currents are not shown here, but instead relative values in relation to the tripping current frequency responses of the products.
Explanation ���� A DFS 4 B 30 mA NK trips at 50 Hz/30 mA. From this it follows that, at 50 Hz, a residual current would represent a peak of 100% in the diagram. If, at 30 mA, there is a frequency of 20 kHz, this would represent a load of 10%, since the DFS 4 B NK only trips at 300 mA or above at 20 kHz.
The product to which the diagram relates can be determined using the options field next to the percentage display for the individual types.
RATEDANALYSIS

22 / 23
7.4 Colourcoding
Display Evaluation
greater than 74%
(red)
high load, restricted availability or operational safety
50% to 74% (yellow)
elevated load, insecure availability
0% to 49% (green)
low to no load, high availability
Table 2: 'Traffic light' colour coding
For a better overview, the values are colour-coded according to the tripping threshold reached.
8. Notesandapplicationtips
8.1 Maximumfrequency
Double the sampling frequency is required for meaningful sampling of a signal that is continuous over time. The DRCA 1 uses a sampling rate of greater than 200 kHz. Therefore, the maximum frequency that can be recorded is around 100 kHz. Even signals close to this frequen-cy are recorded with reduced amplitude and altered signal form, as only very few values are recorded within a period. Frequencies above 100 kHz are filtered out by an additional circuit, but as this can never work perfectly, high-frequency signals may appear as image frequen-cies in the display to some extent.
DFS 4 B+ 30 mA
DFS 4 B+ 100 mA
DFS 4 B+ 300 mA

8.2 Screenresolution
The program has been designed for a fixed resolution of 1024 × 768 pixels. The windows can be scaled up/down, but the displays retain their fixed size. The windows initially appear centred on the screen, regardless of resolution, and can then be moved as desired.
8.3 Crossoverfrequenciesinthetrippingcurrentfrequencyresponse
As already indicated in chapter 7 ('Evaluated signal analysis'), the frequency responses of the residual current circuit-breakers have three characteristic ranges. Initially, the tripping current remains identical, then increases by 20 dB per decade and then remains the same from a certain frequency. In order to reproduce this in the soft-ware, very steep-edged filters are used for each of the three ranges. As they cannot be infinitely steep, however, slight crossovers occur at the limits of the ranges. This does not affect the percentage display of the resolution, but the frequency analysis graphs may display a value that is slightly too low or too high at precisely these frequencies.
This is due to the differing filter settling times. After the filtration, the signals are no longer one hundred-percent synchronous, which, following the addition of two identical frequency components, enlarges or reduces the resulting signal to some extent. The bars of the frequency analysis are therefore somewhat too small or too large; the percentage display, however, always shows the correct value and is therefore to be given preference.
8.4 Computerprocessorload
DRCA 1 requires sufficient processor capacity for the measurement. If several programs are open at the same time, interruptions may occur during the measurement.
8.5 SwitchselectionafterRCDoverview
The RCD overview shows snapshots and not an evaluation of longer-term measurements: If the product group overview is considered, only a small part of the tripping current may be displayed, for example. If this exact device is now installed, it can nevertheless be tripped by leakage currents if non-measured system statuses or unforeseeable switching processes occur.
NOTESANDAPPLICATIONTIPS

24 / 25
9. Rating data
9.1 Supplyvoltage
The power supply is provided via +5 V (USB).
9.2 Descriptionofinputconnections
The USB cable, which is connected to the PC/notebook, is connected via a USB socket. The transformer is connected to the DRCA 1-CT socket with the supplied DRCA 1-MC measuring cable.
9.3 Environmentalconditions
Pollution degree 2: The device must only be used indoors.Temperature range: 0 °C to 45 °CHumidity: max. 90% rel. humidity. Condensation not permitted.Max. permitted height above sea level: 2000 m
9.4 Installationrequirements
The following requirements must be met during assembly, selection of installation location and installation:All installation work relating to the residual current transformer must only be performed by appropriately qualified specialist personnel.For the installation, the voltage to the distribution board must first be switched off.The residual current transformer must be added to the circuit at the point at which the residual current circuit-breaker is or will in future be located. For the measurement, the transformer must be permanently installed in the distribution board.The residual current transformer is connected to the measurement device using the DRCA 1-CT measuring cable.Only residual currents may be measured, not load currents such as individual phases of a motor.
9.5 Connectiontothepowersupply
The measurement device is connected to the computer using a USB cable (plug type A to plug type B).
9.6 Ventilationandcooling
The device does not require any special measures with regard to ventilation or cooling.
9.7 Residualcurrentinput
The maximum rated residual current that can be measured with the transformer is a peak value of 10 A. For the measuring unit a maximum rated current of 10 mA applies (secondary current transformer).
9.8 Symbols
The safety symbol on the transformer connections indicates a general hazard point. All connections for measuring devices in category I are labelled in this way.
9.9 Cleaningandconsumablematerials
The device does not require any special cleaning. There are no consumable materials, which means that no mainte-nance intervals have to be complied with for their replacement.
9.10 Operationalsafety
If the device is not used in accordance with the manufacturer's operating instructions, the intended protection may be impaired. Operational safety will no longer be guaranteed.
9.11 Maintenance
The device has no wearing parts. No maintenance work is therefore required.
9.12 Warranty
All professionally installed, unaltered devices are covered by warranty during the statutory warranty period from the day of purchase by the end user. The guarantee is not applicable to damage incurred during transport or caused by short-circuit, overloading or improper use. In the event of defects in workmanship or material being discovered within the warranty period, the company will provide repair or replacement free of charge. The warranty will be rendered null and void if the device is opened without authorisation.
9.13 Measurementcategory
The device corresponds to measurement category I (measurements in circuits not directly connected to the mains).
Warning:The device must not be used in measurement categories II, III and IV. Protection and operational safety will no longer be guaranteed.
9.14 Firmwareandupdates
Current information about firmware versions and updates can be found on our website, www.doepke.de.
RATINGDATA

26 / 27
10. Technical data
DRCA 1measuringunit
Rated voltage +5 V (USB)
Wiring USB cable
Sampling rate 250 kHz
Damping 40 dB/decade greater than 100 kHz
Frequency range: 10 Hz to 100 kHz
Measuring rangeAC: up to 10 A peak-to-peak value, DC: not measurable
Accuracy when I = 100 mA
when residual current I = 100 mA10 Hz - 100 kHz: ± 1 dB20 Hz - 20 kHz: ± 0.3 dB1 kHz: ± 0.1 dB
Resolution 0.2 mA
Pollution degree 2 (for indoor use only)
Operating temperature range 0 °C to 45 °C
Storage temperature range -20°C to 70°C
Resistance to climatic changesmax. 90% rel. humidity, condensation not permitted
Operating altitude max. 2000 m above sea level
Dimensions250 mm × 160 mm × 40 mm (L × W x D)
Weight 0.85 kg
Positioning optional
Measurement category
I (please note: the device must not be used in measurement categories II, III and IV)

DRCA1-CTtransducer
Rated current DRCA 1-CT 070 200 A
DRCA 1-CT 105 250 A
DRCA 1-CT 140 350 A
DRCA 1measuringunit
Design requirements
The device was manufactured in accordance with DIN EN 61010-1 (VDE 0411 Part 1): 2002-08 'Safety requirements for electrical equipment for measurement, control and laboratory use'.
Note ���������������� With the rated currents stated above, a maximum measurement error of 10 mA can be expected with a centred line structure for the primary load current. This error is the result of asymmetrical currents within the transformer core material.
DRCA 1V2-SWsoftware
Operating system Windows 7 SP1 or higher
Memory requirements 500 MB free hard disk storage
10.1 Productoverview/Articlenumbers
DRCA 1 set 09 352 050consisting of:DRCA 1 09 352 051DRCA 1-CT 070 09 352 058DRCA 1-MC 09 352 053DRCA 1 V2-SW 09 352 055
TECHNICALDATA

article number 59 625 11 | state 06/2021
Doepke Schaltgeräte GmbHStellmacherstraße 1126506 Norden | Germany
@----------------- [email protected] T----------------- +49 (0) 49 31 18 06-0F----------------- +49 (0) 49 31 18 06-101
www-------- doepke.de
Doepke