Embed Size (px)
Citation preview
Preliminary – Do Not Cite or Quote INTERNAL USE ONLY – NOT APPROVED FOR PUBLIC RELEASE
August 7, 2019 DOE/NETL-YYYY/####
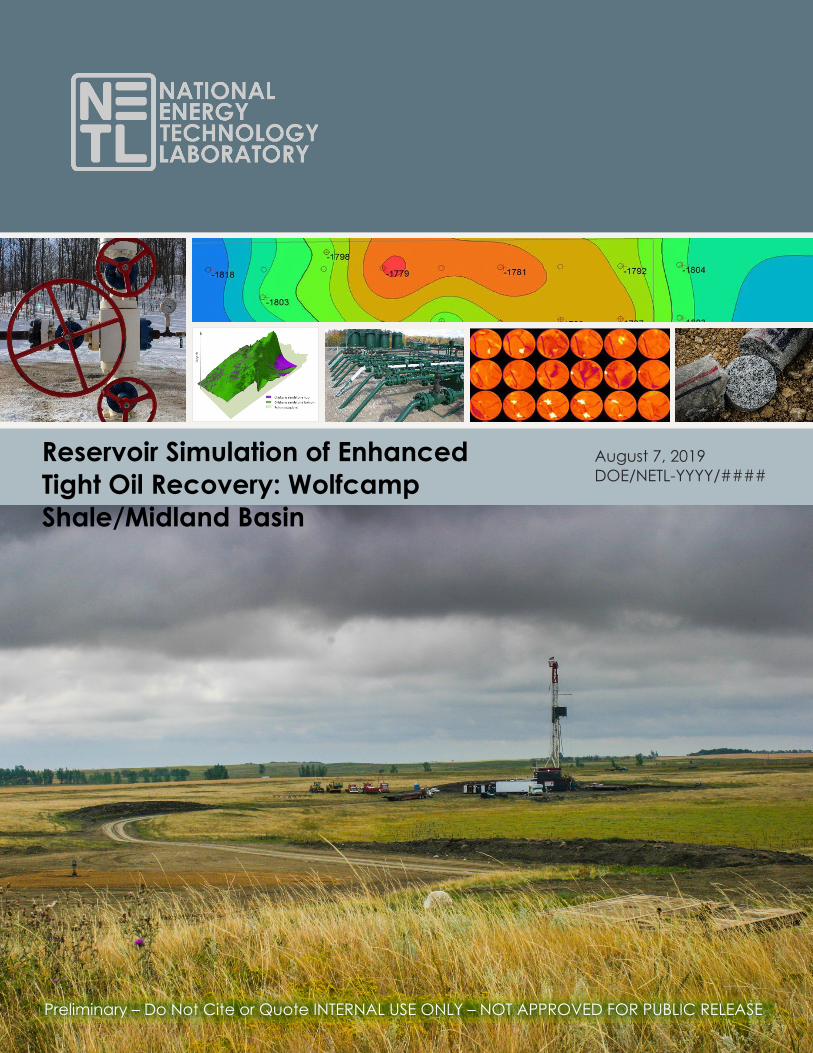
Reservoir Simulation of Enhanced Tight Oil Recovery: Wolfcamp Shale/Midland Basin
About the National Energy Technology Laboratory
The National Energy Technology Laboratory (NETL), part of the United States (U.S.) Department of Energy (DOE) national laboratory system, is owned and operated by DOE. NETL supports DOE’s mission to advance the energy security of the United States.
Disclaimer
This report was prepared as an account of work sponsored by an agency of the United States Government. Neither the United States Government nor any agency thereof, nor any of their employees, makes any warranty, express or implied, or assumes any legal liability or responsibility for the accuracy, completeness, or usefulness of any information, apparatus, product, or process disclosed, or represents that its use would not infringe privately owned rights. Reference therein to any specific commercial product, process, or service by trade name, trademark, manufacturer, or otherwise does not necessarily constitute or imply its endorsement, recommendation, or favoring by the United States Government or any agency thereof. The views and opinions of authors expressed therein do not necessarily state or reflect those of the United States Government or any agency thereof.
Printed in the United States of America
Available to DOE and DOE contractors from the Office of Scientific and Technical Information (OSTI):
U.S. Department of Energy Office of Scientific and Technical Information P.O. Box 62 Oak Ridge, TN 37831-0062 www.osti.gov Phone: (865) 576-8401 Fax: (865) 576-5728 Email: [email protected]
Available to the public from the National Technical Information Service (NTIS):
U.S. Department of Commerce National Technical Information Service 5301 Shawnee Road Alexandria, VA 22312 www.ntis.gov Phone: (800) 553-NTIS (6847) or (703) 605-6000 Fax: (703) 605-6900 Email: [email protected]
Reservoir Simulation of Enhanced Tight Oil Recovery: Wolfcamp Shale/Midland Basin
INTERNAL USE ONLY – NOT APPROVED FOR PUBLIC RELEASE
Author List: Advanced Resources International (ARI)
Vello A. Kuuskraa President
Anne Oudinot Project Manager
George J. Koperna, Jr. Vice President
This report was prepared by MESA for the U.S. DOE NETL. This work was completed under DOE NETL Contract Number DE-FE0025912. This work was performed under MESA Study Activity: 0025192.01.2110.104.006.
The authors wish to acknowledge the excellent guidance, contributions, and cooperation of the NETL staff, particularly:
Jared Ciferno, NETL Technical Monitor
Elena Melchert, Gary Covatch
DOE Contract Number DE-FE0025912

Reservoir Simulation of Enhanced Tight Oil Recovery: Wolfcamp Shale/Midland Basin
INTERNAL USE ONLY – NOT APPROVED FOR PUBLIC RELEASE
This page intentionally left blank.
Reservoir Simulation of Enhanced Tight Oil Recovery: Wolfcamp Shale/Midland Basin
i INTERNAL USE ONLY – NOT APPROVED FOR PUBLIC RELEASE
TABLE OF CONTENTS List of Exhibits ............................................................................................................................... iii
Acronyms and Abbreviations .................................................................................................... v
1 Geologic Setting .................................................................................................................. 1
2 Study Area ............................................................................................................................ 3
3 Sources of Data for Reservoir Properties ........................................................................... 4
4 Reservoir Properties and Oil Composition for Reservoir Simulation in the Wolfcamp Shale (Bench B) ........................................................................................................................... 5
4.1 Representative Reservoir Properties ........................................................................... 5
4.2 Oil Composition ............................................................................................................ 6
4.3 Estimating Minimum Miscibility Pressure for CO2 and the Reservoir’s Oil ................ 7
4.4 Estimated Original Oil and Gas In-Place ................................................................... 7
4.5 Matrix Permeability ....................................................................................................... 8
4.6 Reservoir Temperature ................................................................................................. 8
4.7 Reservoir Pressure ......................................................................................................... 8
5 Reservoir Model ................................................................................................................... 9
5.1 Model Dimensions, Layers and Grid Blocks ............................................................... 9
5.2 Reservoir Simulator ..................................................................................................... 11
5.3 Relative Permeability ................................................................................................. 11
6 Type Well for Study Area ................................................................................................... 12
7 Representing the Impact of Hydraulic Stimulation ........................................................ 14
7.1 Stimulated Reservoir Volume .................................................................................... 14
7.2 SRV Dimensions from History Match ......................................................................... 15
7.3 Permeability Values from History Match .................................................................. 16
8 History-Matching Oil and Natural Gas Production ........................................................ 17
8.1 History Match .............................................................................................................. 17
8.2 Modeling of Cyclic CO2 Injection ............................................................................ 19
8.2.1 Cyclic CO2 Injection ........................................................................................... 19
8.2.2 Performance of Cyclic CO2 Injection: Reduced Hz Well Segment (500 ft) . 20
8.2.3 Performance of Cyclic CO2 Injection: Full Hz Well (10,500 ft)......................... 21
8.2.4 Pressure Distribution ............................................................................................. 22
8.2.5 CO2 Distribution and Storage ............................................................................ 23
Reservoir Simulation of Enhanced Tight Oil Recovery: Wolfcamp Shale/Midland Basin
ii INTERNAL USE ONLY – NOT APPROVED FOR PUBLIC RELEASE
8.3 Performance of Cyclic CO2 Versus Cyclic Natural Gas Injection ......................... 24
8.3.1 Dry Gas Injection ................................................................................................. 24
8.3.2 Wet Gas Injection ................................................................................................ 26
8.3.3 Comparison of Cyclic CO2, Dry Gas, and Wet Gas Injection ........................ 27
9 References ......................................................................................................................... 28
Reservoir Simulation of Enhanced Tight Oil Recovery: Wolfcamp Shale/Midland Basin
iii INTERNAL USE ONLY – NOT APPROVED FOR PUBLIC RELEASE
LIST OF EXHIBITS Exhibit 1-1 Midland Basin Wolfcamp Shale Location and Depth Map (Top of Wolfcamp Bench B) ...................................................................................................................................... 1 Exhibit 1-2 Midland Basin Stratigraphic Column ...................................................................... 2 Exhibit 2-1 Typical Wolfcamp Shale Logs ................................................................................. 3 Exhibit 3-1 Reagan County Well Log, Eastern Basin Extension Area, Wolfcamp Shale ..... 4 Exhibit 4-1 Wolfcamp Shale Study Area Reservoir Properties ................................................ 5 Exhibit 4-2 Wolfcamp Shale PVT and Oil Composition Data ................................................. 6 Exhibit 4-3 Binary Interaction Coefficients for Wolfcamp Live Oil .......................................... 6 Exhibit 4-4 Minimum Miscibility Processes (MMP) for CO2 for Study Area Oil Composition ...................................................................................................................................................... 7 Exhibit 4-5 Porosity versus Permeability for Wolfcamp Shale, Midland Basin ...................... 8 Exhibit 5-1 Reservoir Model and Grid Blocks Used for Wolfcamp Shale Study ................... 10 Exhibit 5-2 Reservoir Model Layers to Represent Distributed Lithology ............................... 10 Exhibit 5-3 Wolfcamp Shale Bench B Relative Permeability Curves .................................... 11 Exhibit 6-1 Study Area Type Well Oil Production .................................................................... 12 Exhibit 6-2 Study Area Type Well Water Production .............................................................. 13 Exhibit 7-1 Representative SRV for “Segment” Well .............................................................. 14 Exhibit 7-2 Estimated SRV Dimensions from History Match of Well Performance ............... 15 Exhibit 7-3 Permeability Values Used for History Match (mD) .............................................. 16 Exhibit 8-1 Comparison of Oil Production for Type Well and History Matched Study Area Well ............................................................................................................................................. 17 Exhibit 8-2 Comparison of Water Production for Actual and History Matched Study Well .................................................................................................................................................... 17 Exhibit 8-3 History Match of Monthly Oil Production (5 Years) ............................................. 17 Exhibit 8-4 History Match of Annual Oil Production (30 Years) ............................................ 18 Exhibit 8-5 Primary Production and Enhanced Oil Recovery from Cyclic CO2 Injection .. 19 Exhibit 8-6 Cumulative Oil Production, CO2 Injection and CO2 Production (Hz Well Segment) ................................................................................................................................... 20 Exhibit 8-7 Cumulative Oil Production from Primary and Cyclic CO2 Injection ................. 21 Exhibit 8-8 Cumulative Oil Production, CO2 Injection and CO2 Production: Full Hz Well 21 Exhibit 8-9 Pressure Profiles Following Primary Recovery and Cyclic CO2 Injection (psig) .................................................................................................................................................... 22 Exhibit 8-10 CO2 Saturation Profiles Following Cyclic CO2 Injection ................................... 23 Exhibit 8-11 Primary Production and Enhanced Oil Recovery from Cyclic Dry Gas Injection ..................................................................................................................................... 24 Exhibit 8-12 Cumulative Oil Production: CO2 Injection versus Dry Gas Injection (Hz Well Segment) ................................................................................................................................... 25 Exhibit 8-13 Primary Production and Enhanced Oil Recovery from Cyclic Wet Gas Injection ..................................................................................................................................... 26 Exhibit 8-14 Cumulative Oil Production: CO2 Injection versus Wet Gas Injection (Hz Well Segment) ................................................................................................................................... 26

Reservoir Simulation of Enhanced Tight Oil Recovery: Wolfcamp Shale/Midland Basin
iv INTERNAL USE ONLY – NOT APPROVED FOR PUBLIC RELEASE
Exhibit 8-15 Comparison of Cyclic CO2, Dry Gas and Wet Gas Injection (Hz Well Segment) ................................................................................................................................... 27
Reservoir Simulation of Enhanced Tight Oil Recovery: Wolfcamp Shale/Midland Basin
v INTERNAL USE ONLY – NOT APPROVED FOR PUBLIC RELEASE
ACRONYMS AND ABBREVIATIONS API American Petroleum Institute ARI Advanced Resources International bbl Barrel Bcf Billion cubic feet B/D Barrels per day CO2 Carbon dioxide DOE Department of Energy EERC Energy & Environmental Research Center ft Foot, Feet GOR Gas-oil ratio Hz Horizontal MBbl Thousand barrels MBOED Thousand Barrels Oil Equivalent per Day Mcf Thousand cubic feet Mcfd Thousand cubic feet per day MESA Mission Execution and Strategic Analysis mi2 Square mile MM Million MMB/D Million barrels per day MMB/mi2 Million barrels per day per square mile MMcf Million cubic feet MMcfd Million cubic feet per day MMP Minimum miscibility pressure N2 Nitrogen NETL National Energy Technology Laboratory OGIP Original gas in-place OOIP Original oil in-place psi Pounds per square inch psia Pounds per square inch absolute psi/ft Pounds per square inch per foot PVT Pressure volume temperature RB/STB Reservoir barrels/stock tank barrels Scf/Bbl Standard cubic foot/barrel SRV Stimulated Reservoir Volume U.S. United States °F Degrees Fahrenheit

Reservoir Simulation of Enhanced Tight Oil Recovery: Wolfcamp Shale/Midland Basin
vi INTERNAL USE ONLY – NOT APPROVED FOR PUBLIC RELEASE
This page intentionally left blank.
Reservoir Simulation of Enhanced Tight Oil Recovery: Wolfcamp Shale/Midland Basin
1 INTERNAL USE ONLY – NOT APPROVED FOR PUBLIC RELEASE – August 7, 2019
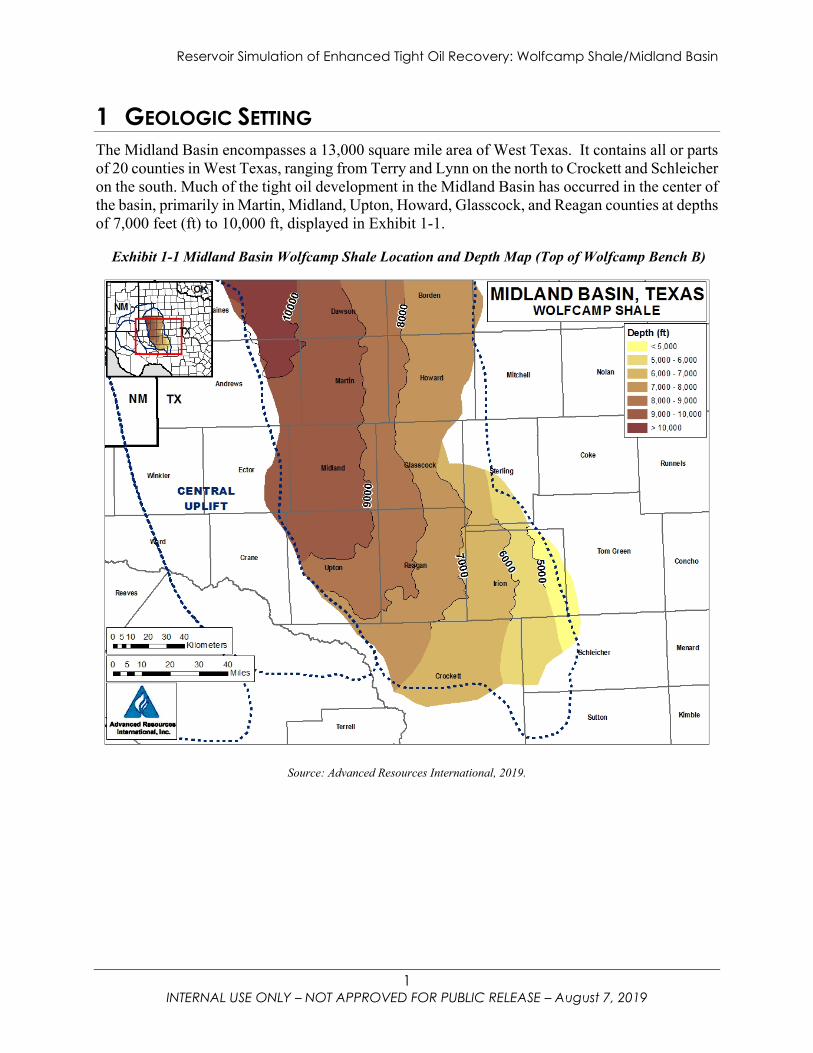
1 GEOLOGIC SETTING The Midland Basin encompasses a 13,000 square mile area of West Texas. It contains all or parts of 20 counties in West Texas, ranging from Terry and Lynn on the north to Crockett and Schleicher on the south. Much of the tight oil development in the Midland Basin has occurred in the center of the basin, primarily in Martin, Midland, Upton, Howard, Glasscock, and Reagan counties at depths of 7,000 feet (ft) to 10,000 ft, displayed in Exhibit 1-1.
Exhibit 1-1 Midland Basin Wolfcamp Shale Location and Depth Map (Top of Wolfcamp Bench B)
Source: Advanced Resources International, 2019.
Reservoir Simulation of Enhanced Tight Oil Recovery: Wolfcamp Shale/Midland Basin
2 INTERNAL USE ONLY – NOT APPROVED FOR PUBLIC RELEASE – August 7, 2019
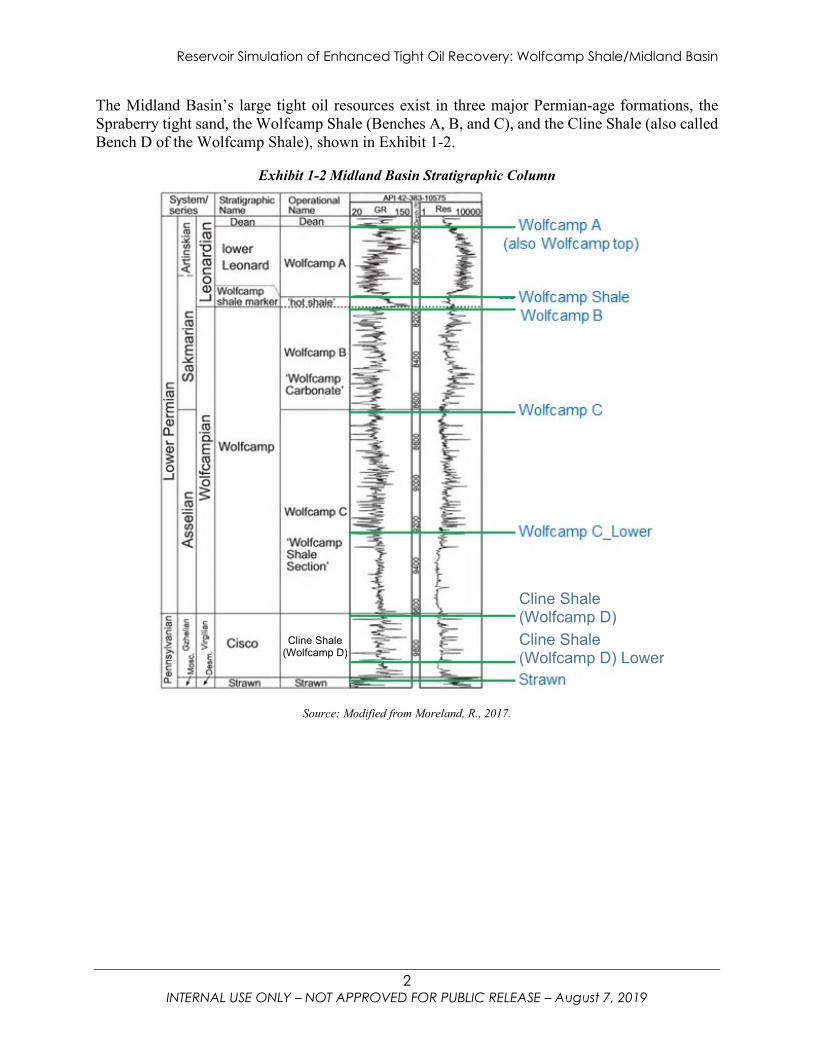
The Midland Basin’s large tight oil resources exist in three major Permian-age formations, the Spraberry tight sand, the Wolfcamp Shale (Benches A, B, and C), and the Cline Shale (also called Bench D of the Wolfcamp Shale), shown in Exhibit 1-2.
Exhibit 1-2 Midland Basin Stratigraphic Column
Source: Modified from Moreland, R., 2017.
Cline Shale (Wolfcamp D) Cline Shale (Wolfcamp D) Lower
Cline Shale (Wolfcamp D)
Reservoir Simulation of Enhanced Tight Oil Recovery: Wolfcamp Shale/Midland Basin
3 INTERNAL USE ONLY – NOT APPROVED FOR PUBLIC RELEASE – August 7, 2019
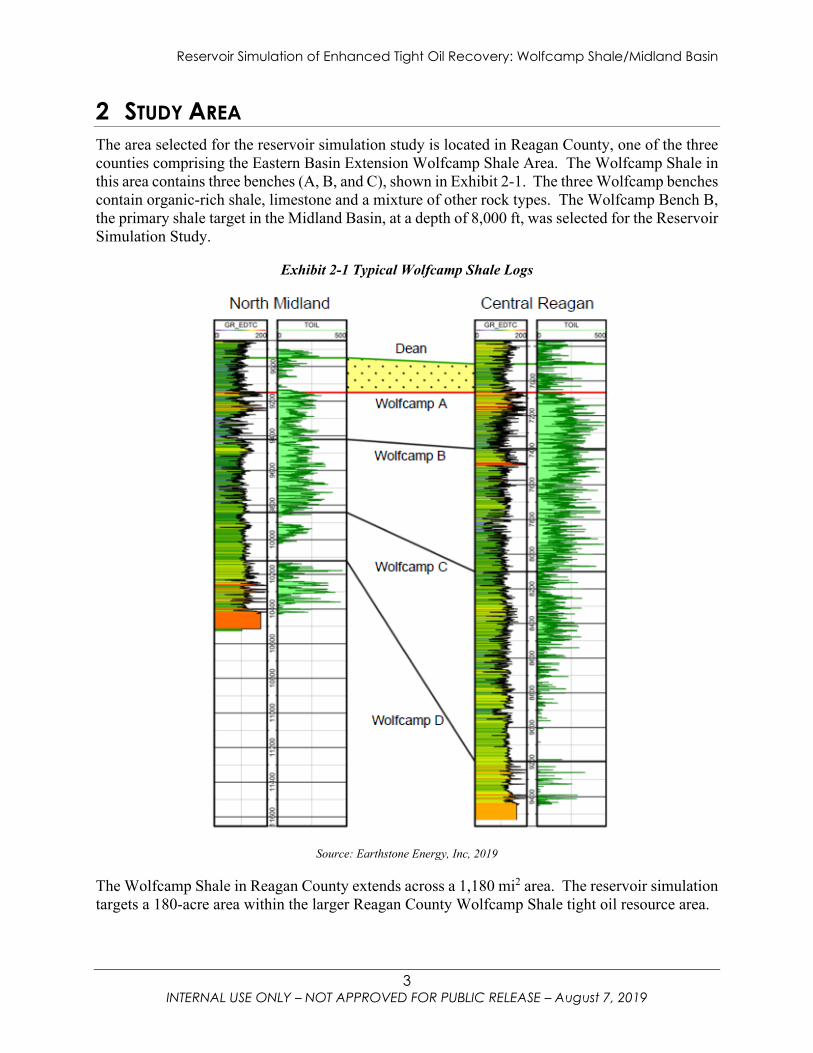
2 STUDY AREA The area selected for the reservoir simulation study is located in Reagan County, one of the three counties comprising the Eastern Basin Extension Wolfcamp Shale Area. The Wolfcamp Shale in this area contains three benches (A, B, and C), shown in Exhibit 2-1. The three Wolfcamp benches contain organic-rich shale, limestone and a mixture of other rock types. The Wolfcamp Bench B, the primary shale target in the Midland Basin, at a depth of 8,000 ft, was selected for the Reservoir Simulation Study.
Exhibit 2-1 Typical Wolfcamp Shale Logs
Source: Earthstone Energy, Inc, 2019
The Wolfcamp Shale in Reagan County extends across a 1,180 mi2 area. The reservoir simulation targets a 180-acre area within the larger Reagan County Wolfcamp Shale tight oil resource area.
Reservoir Simulation of Enhanced Tight Oil Recovery: Wolfcamp Shale/Midland Basin
4 INTERNAL USE ONLY – NOT APPROVED FOR PUBLIC RELEASE – August 7, 2019
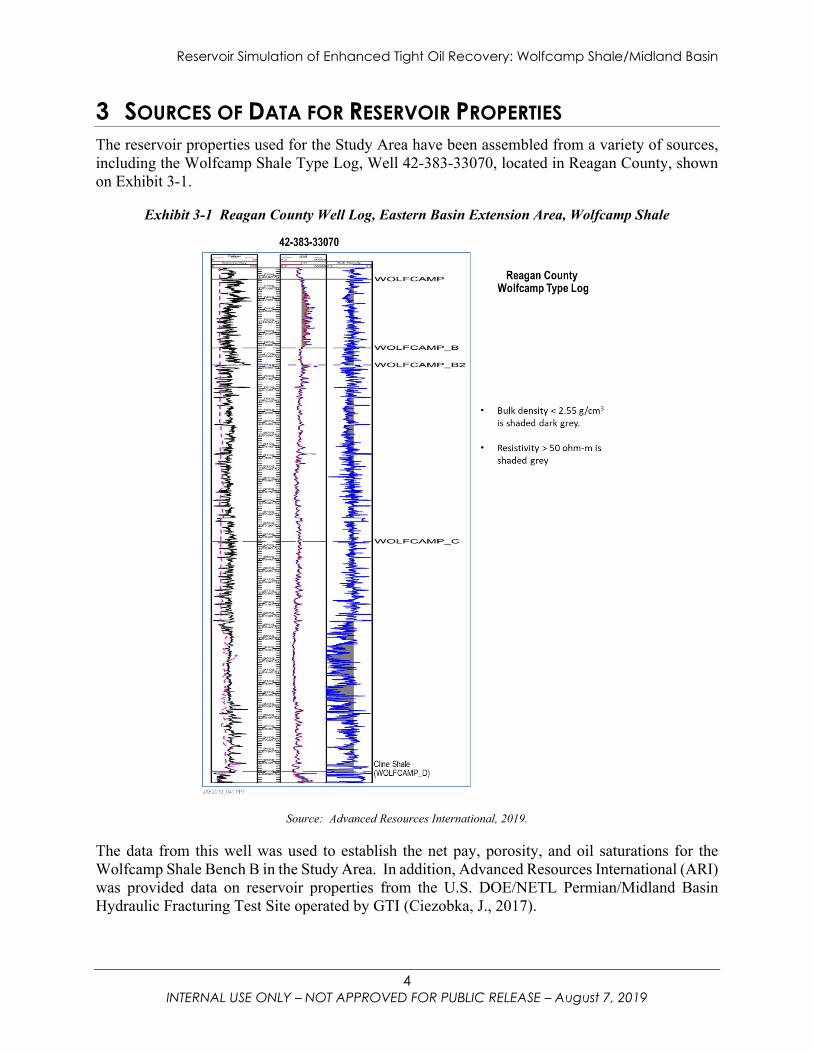
3 SOURCES OF DATA FOR RESERVOIR PROPERTIES The reservoir properties used for the Study Area have been assembled from a variety of sources, including the Wolfcamp Shale Type Log, Well 42-383-33070, located in Reagan County, shown on Exhibit 3-1.
Exhibit 3-1 Reagan County Well Log, Eastern Basin Extension Area, Wolfcamp Shale
Source: Advanced Resources International, 2019.
The data from this well was used to establish the net pay, porosity, and oil saturations for the Wolfcamp Shale Bench B in the Study Area. In addition, Advanced Resources International (ARI) was provided data on reservoir properties from the U.S. DOE/NETL Permian/Midland Basin Hydraulic Fracturing Test Site operated by GTI (Ciezobka, J., 2017).
Reservoir Simulation of Enhanced Tight Oil Recovery: Wolfcamp Shale/Midland Basin
5 INTERNAL USE ONLY – NOT APPROVED FOR PUBLIC RELEASE – August 7, 2019
4 RESERVOIR PROPERTIES AND OIL COMPOSITION FOR RESERVOIR SIMULATION IN THE WOLFCAMP SHALE (BENCH B)
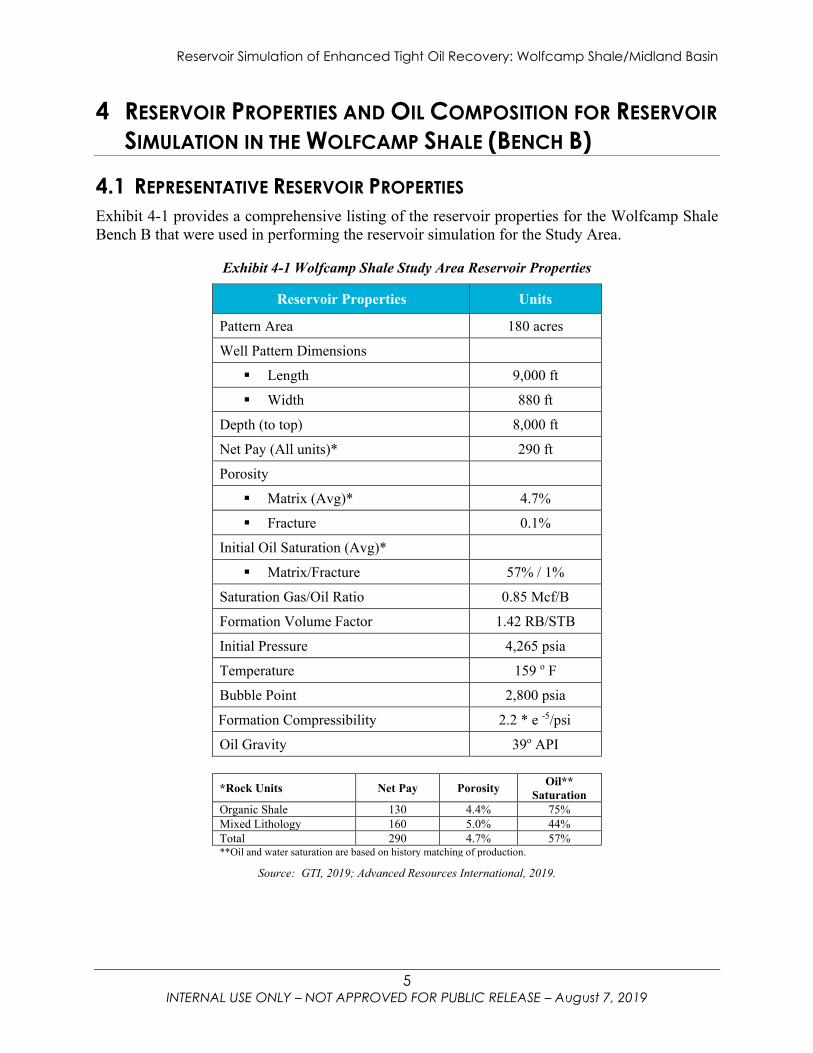
4.1 REPRESENTATIVE RESERVOIR PROPERTIES Exhibit 4-1 provides a comprehensive listing of the reservoir properties for the Wolfcamp Shale Bench B that were used in performing the reservoir simulation for the Study Area.
Exhibit 4-1 Wolfcamp Shale Study Area Reservoir Properties
Reservoir Properties Units
Pattern Area 180 acres
Well Pattern Dimensions
Length 9,000 ft
Width 880 ft
Depth (to top) 8,000 ft
Net Pay (All units)* 290 ft
Porosity
Matrix (Avg)* 4.7%
Fracture 0.1%
Initial Oil Saturation (Avg)*
Matrix/Fracture 57% / 1%
Saturation Gas/Oil Ratio 0.85 Mcf/B
Formation Volume Factor 1.42 RB/STB
Initial Pressure 4,265 psia
Temperature 159 o F
Bubble Point 2,800 psia
Formation Compressibility 2.2 * e -5/psi
Oil Gravity 39o API *Rock Units Net Pay Porosity Oil**
Saturation Organic Shale 130 4.4% 75% Mixed Lithology 160 5.0% 44% Total 290 4.7% 57% **Oil and water saturation are based on history matching of production.
Source: GTI, 2019; Advanced Resources International, 2019.
Reservoir Simulation of Enhanced Tight Oil Recovery: Wolfcamp Shale/Midland Basin
6 INTERNAL USE ONLY – NOT APPROVED FOR PUBLIC RELEASE – August 7, 2019
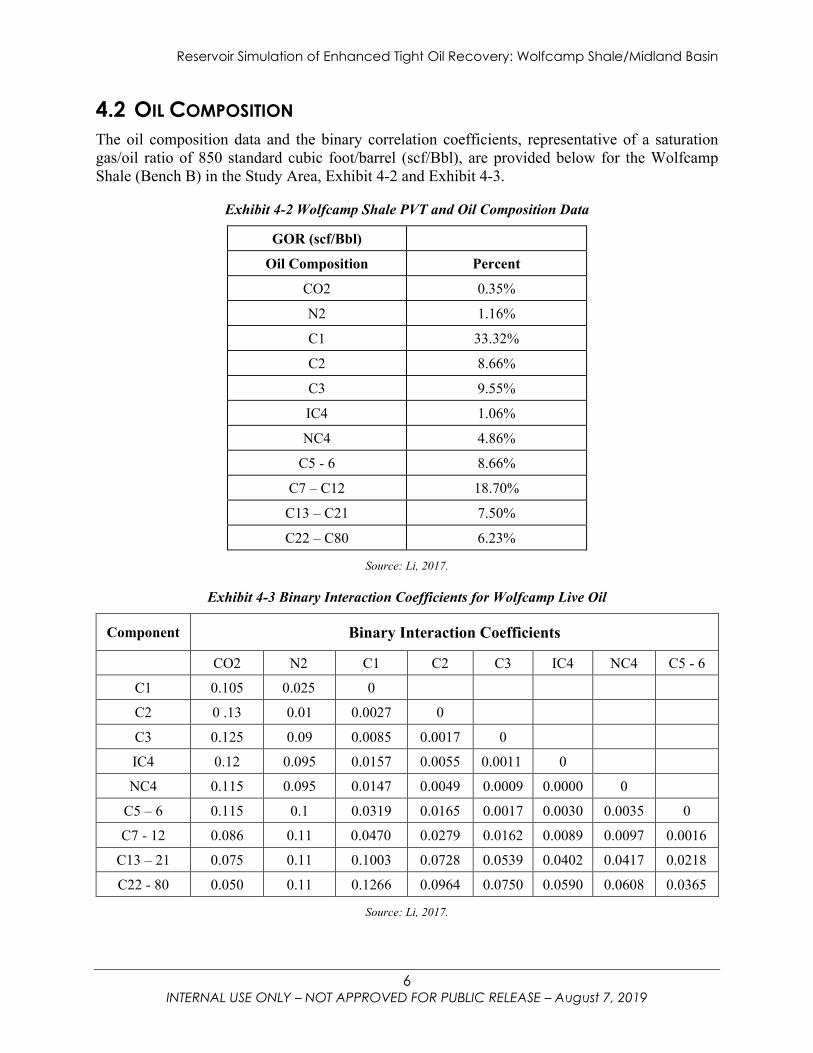
4.2 OIL COMPOSITION The oil composition data and the binary correlation coefficients, representative of a saturation gas/oil ratio of 850 standard cubic foot/barrel (scf/Bbl), are provided below for the Wolfcamp Shale (Bench B) in the Study Area, Exhibit 4-2 and Exhibit 4-3.
Exhibit 4-2 Wolfcamp Shale PVT and Oil Composition Data
GOR (scf/Bbl)
Oil Composition Percent
CO2 0.35%
N2 1.16%
C1 33.32%
C2 8.66%
C3 9.55%
IC4 1.06%
NC4 4.86%
C5 - 6 8.66%
C7 – C12 18.70%
C13 – C21 7.50%
C22 – C80 6.23%
Source: Li, 2017.
Exhibit 4-3 Binary Interaction Coefficients for Wolfcamp Live Oil
Component Binary Interaction Coefficients
CO2 N2 C1 C2 C3 IC4 NC4 C5 - 6
C1 0.105 0.025 0
C2 0 .13 0.01 0.0027 0
C3 0.125 0.09 0.0085 0.0017 0
IC4 0.12 0.095 0.0157 0.0055 0.0011 0
NC4 0.115 0.095 0.0147 0.0049 0.0009 0.0000 0
C5 – 6 0.115 0.1 0.0319 0.0165 0.0017 0.0030 0.0035 0
C7 - 12 0.086 0.11 0.0470 0.0279 0.0162 0.0089 0.0097 0.0016
C13 – 21 0.075 0.11 0.1003 0.0728 0.0539 0.0402 0.0417 0.0218
C22 - 80 0.050 0.11 0.1266 0.0964 0.0750 0.0590 0.0608 0.0365
Source: Li, 2017.
Reservoir Simulation of Enhanced Tight Oil Recovery: Wolfcamp Shale/Midland Basin
7 INTERNAL USE ONLY – NOT APPROVED FOR PUBLIC RELEASE – August 7, 2019
4.3 ESTIMATING MINIMUM MISCIBILITY PRESSURE FOR CO2 AND THE RESERVOIR’S OIL
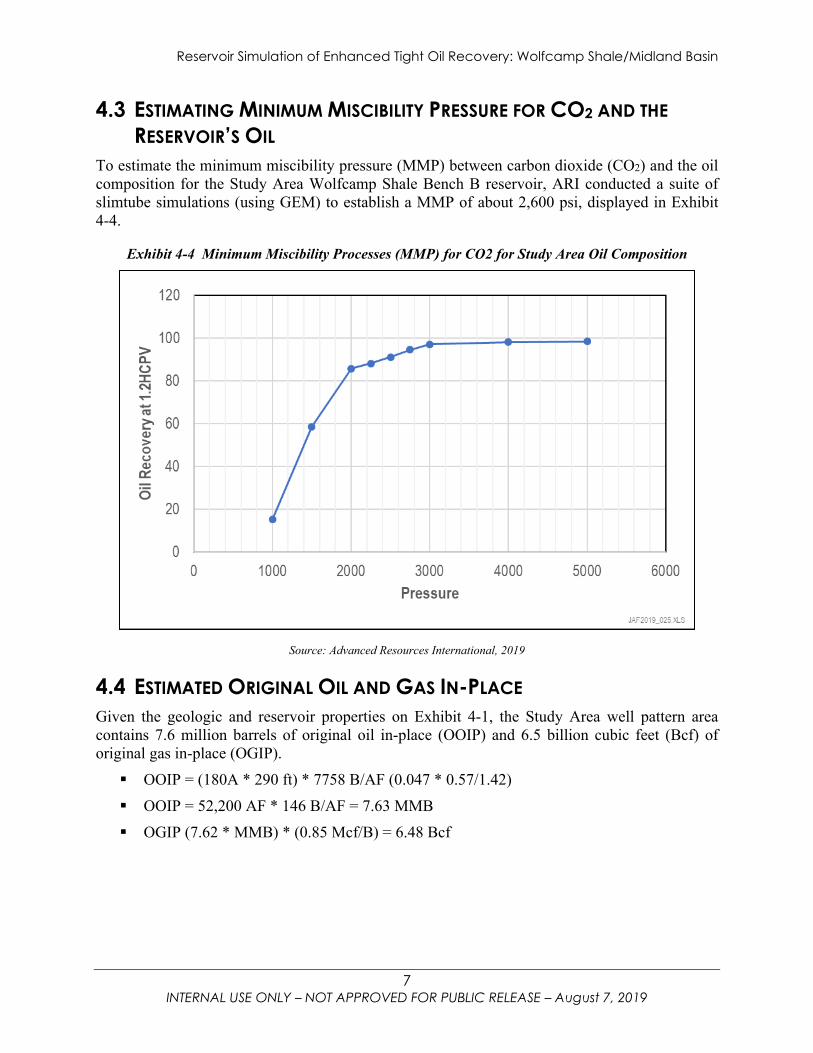
To estimate the minimum miscibility pressure (MMP) between carbon dioxide (CO2) and the oil composition for the Study Area Wolfcamp Shale Bench B reservoir, ARI conducted a suite of slimtube simulations (using GEM) to establish a MMP of about 2,600 psi, displayed in Exhibit 4-4.
Exhibit 4-4 Minimum Miscibility Processes (MMP) for CO2 for Study Area Oil Composition
Source: Advanced Resources International, 2019
4.4 ESTIMATED ORIGINAL OIL AND GAS IN-PLACE Given the geologic and reservoir properties on Exhibit 4-1, the Study Area well pattern area contains 7.6 million barrels of original oil in-place (OOIP) and 6.5 billion cubic feet (Bcf) of original gas in-place (OGIP). OOIP = (180A * 290 ft) * 7758 B/AF (0.047 * 0.57/1.42) OOIP = 52,200 AF * 146 B/AF = 7.63 MMB OGIP (7.62 * MMB) * (0.85 Mcf/B) = 6.48 Bcf
Reservoir Simulation of Enhanced Tight Oil Recovery: Wolfcamp Shale/Midland Basin
8 INTERNAL USE ONLY – NOT APPROVED FOR PUBLIC RELEASE – August 7, 2019
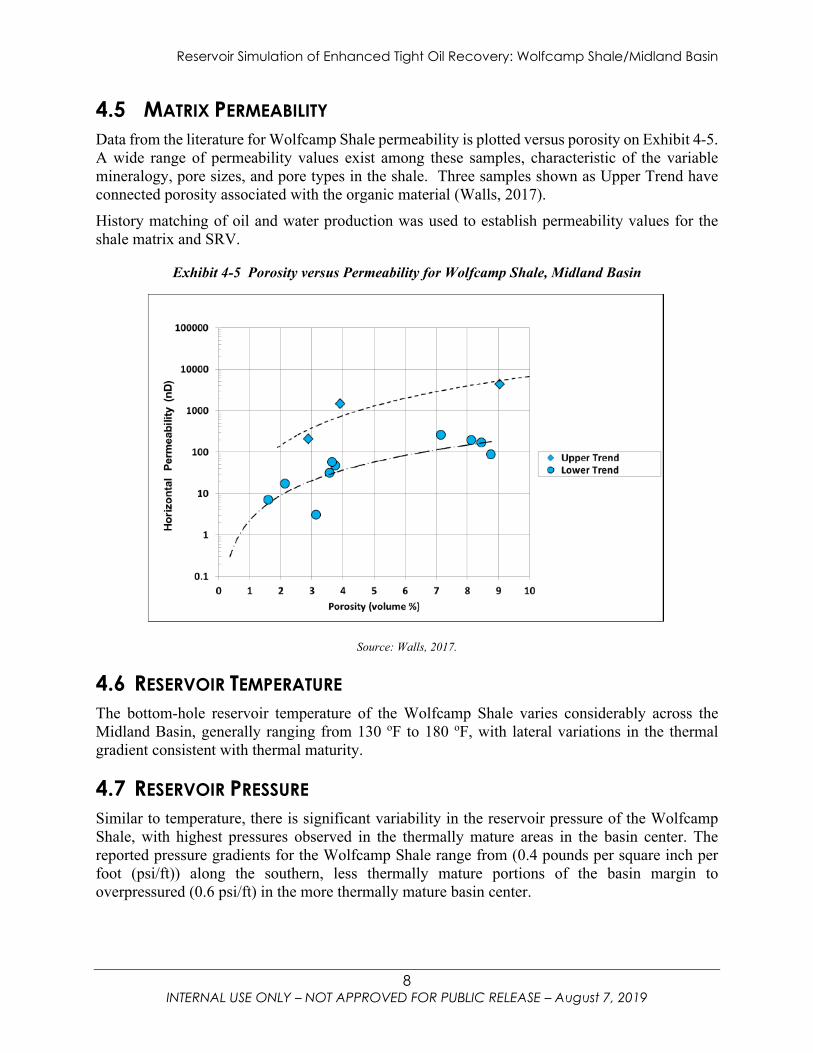
4.5 MATRIX PERMEABILITY Data from the literature for Wolfcamp Shale permeability is plotted versus porosity on Exhibit 4-5. A wide range of permeability values exist among these samples, characteristic of the variable mineralogy, pore sizes, and pore types in the shale. Three samples shown as Upper Trend have connected porosity associated with the organic material (Walls, 2017). History matching of oil and water production was used to establish permeability values for the shale matrix and SRV.
Exhibit 4-5 Porosity versus Permeability for Wolfcamp Shale, Midland Basin
Source: Walls, 2017.
4.6 RESERVOIR TEMPERATURE The bottom-hole reservoir temperature of the Wolfcamp Shale varies considerably across the Midland Basin, generally ranging from 130 oF to 180 oF, with lateral variations in the thermal gradient consistent with thermal maturity.
4.7 RESERVOIR PRESSURE Similar to temperature, there is significant variability in the reservoir pressure of the Wolfcamp Shale, with highest pressures observed in the thermally mature areas in the basin center. The reported pressure gradients for the Wolfcamp Shale range from (0.4 pounds per square inch per foot (psi/ft)) along the southern, less thermally mature portions of the basin margin to overpressured (0.6 psi/ft) in the more thermally mature basin center.
Reservoir Simulation of Enhanced Tight Oil Recovery: Wolfcamp Shale/Midland Basin
9 INTERNAL USE ONLY – NOT APPROVED FOR PUBLIC RELEASE – August 7, 2019
5 RESERVOIR MODEL
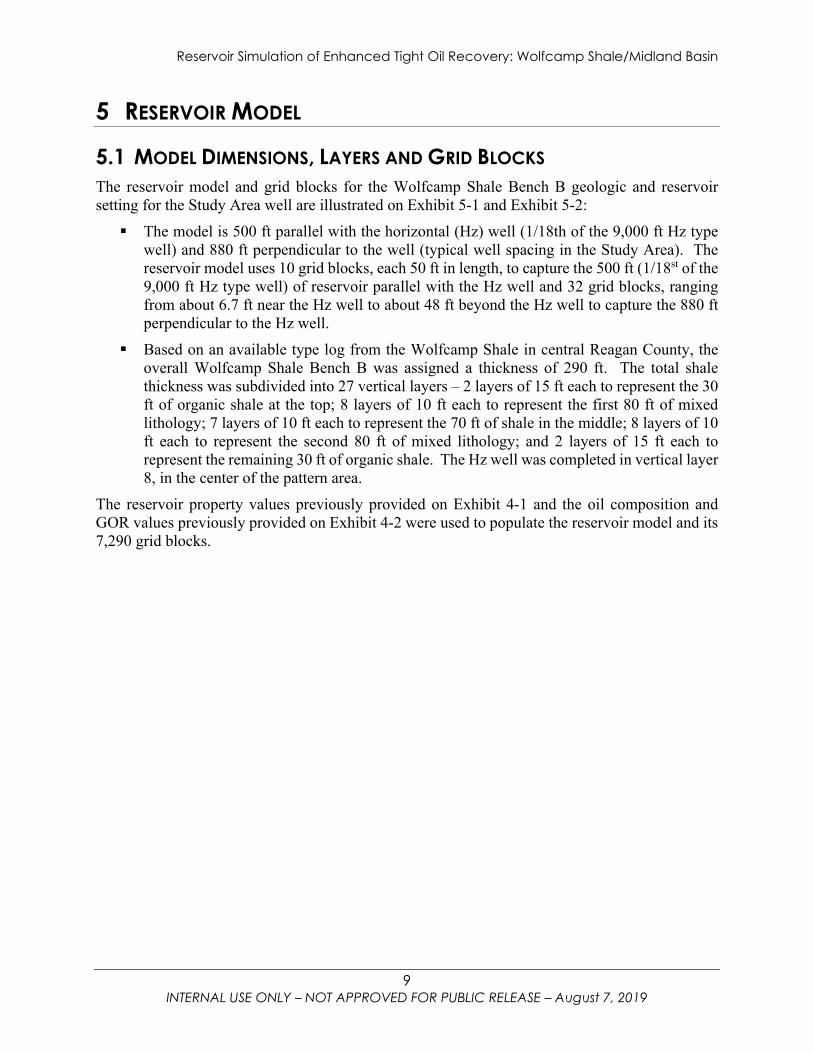
5.1 MODEL DIMENSIONS, LAYERS AND GRID BLOCKS The reservoir model and grid blocks for the Wolfcamp Shale Bench B geologic and reservoir setting for the Study Area well are illustrated on Exhibit 5-1 and Exhibit 5-2: The model is 500 ft parallel with the horizontal (Hz) well (1/18th of the 9,000 ft Hz type
well) and 880 ft perpendicular to the well (typical well spacing in the Study Area). The reservoir model uses 10 grid blocks, each 50 ft in length, to capture the 500 ft (1/18st of the 9,000 ft Hz type well) of reservoir parallel with the Hz well and 32 grid blocks, ranging from about 6.7 ft near the Hz well to about 48 ft beyond the Hz well to capture the 880 ft perpendicular to the Hz well.
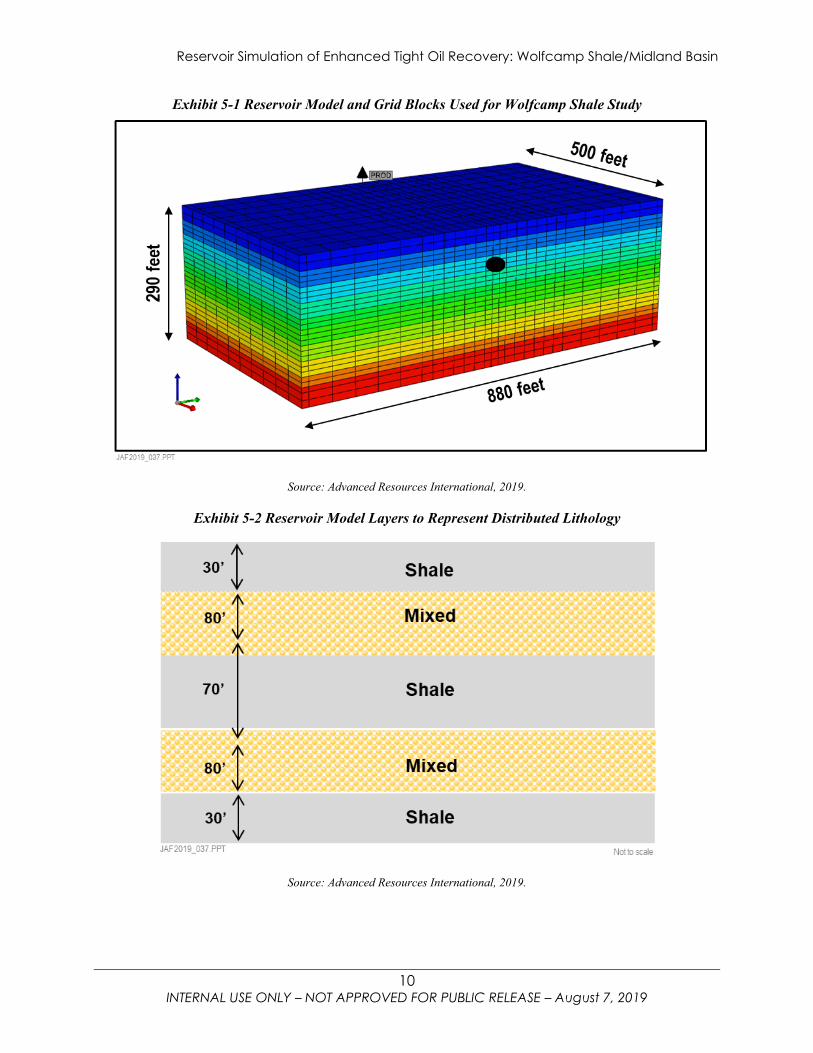
Based on an available type log from the Wolfcamp Shale in central Reagan County, the overall Wolfcamp Shale Bench B was assigned a thickness of 290 ft. The total shale thickness was subdivided into 27 vertical layers – 2 layers of 15 ft each to represent the 30 ft of organic shale at the top; 8 layers of 10 ft each to represent the first 80 ft of mixed lithology; 7 layers of 10 ft each to represent the 70 ft of shale in the middle; 8 layers of 10 ft each to represent the second 80 ft of mixed lithology; and 2 layers of 15 ft each to represent the remaining 30 ft of organic shale. The Hz well was completed in vertical layer 8, in the center of the pattern area.
The reservoir property values previously provided on Exhibit 4-1 and the oil composition and GOR values previously provided on Exhibit 4-2 were used to populate the reservoir model and its 7,290 grid blocks.
Reservoir Simulation of Enhanced Tight Oil Recovery: Wolfcamp Shale/Midland Basin
10 INTERNAL USE ONLY – NOT APPROVED FOR PUBLIC RELEASE – August 7, 2019
Exhibit 5-1 Reservoir Model and Grid Blocks Used for Wolfcamp Shale Study
Source: Advanced Resources International, 2019.
Exhibit 5-2 Reservoir Model Layers to Represent Distributed Lithology
Source: Advanced Resources International, 2019.
Reservoir Simulation of Enhanced Tight Oil Recovery: Wolfcamp Shale/Midland Basin
11 INTERNAL USE ONLY – NOT APPROVED FOR PUBLIC RELEASE – August 7, 2019
5.2 RESERVOIR SIMULATOR The GEM reservoir simulator from the Computer Modeling Group was utilized for the study. GEM is a robust, fully compositional, Equation of State reservoir simulator used widely by industry for modeling the flow of three-phase, multi-component fluids through porous media.
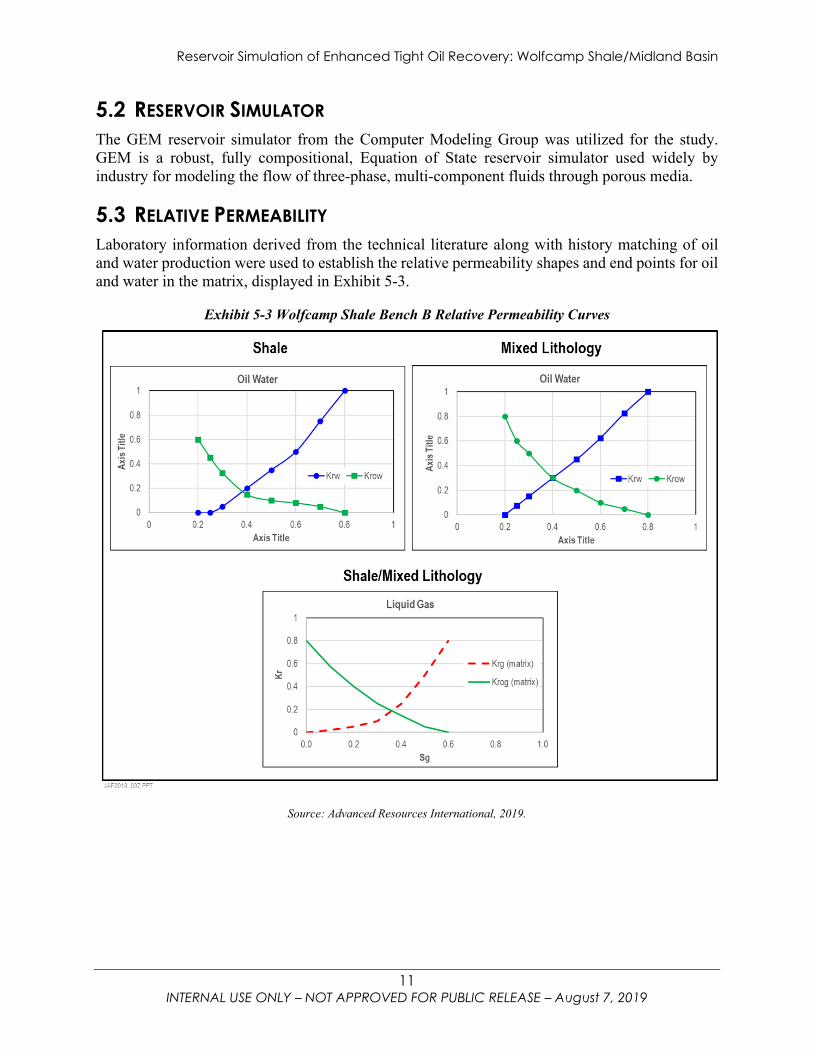
5.3 RELATIVE PERMEABILITY Laboratory information derived from the technical literature along with history matching of oil and water production were used to establish the relative permeability shapes and end points for oil and water in the matrix, displayed in Exhibit 5-3.
Exhibit 5-3 Wolfcamp Shale Bench B Relative Permeability Curves
Source: Advanced Resources International, 2019.
Reservoir Simulation of Enhanced Tight Oil Recovery: Wolfcamp Shale/Midland Basin
12 INTERNAL USE ONLY – NOT APPROVED FOR PUBLIC RELEASE – August 7, 2019
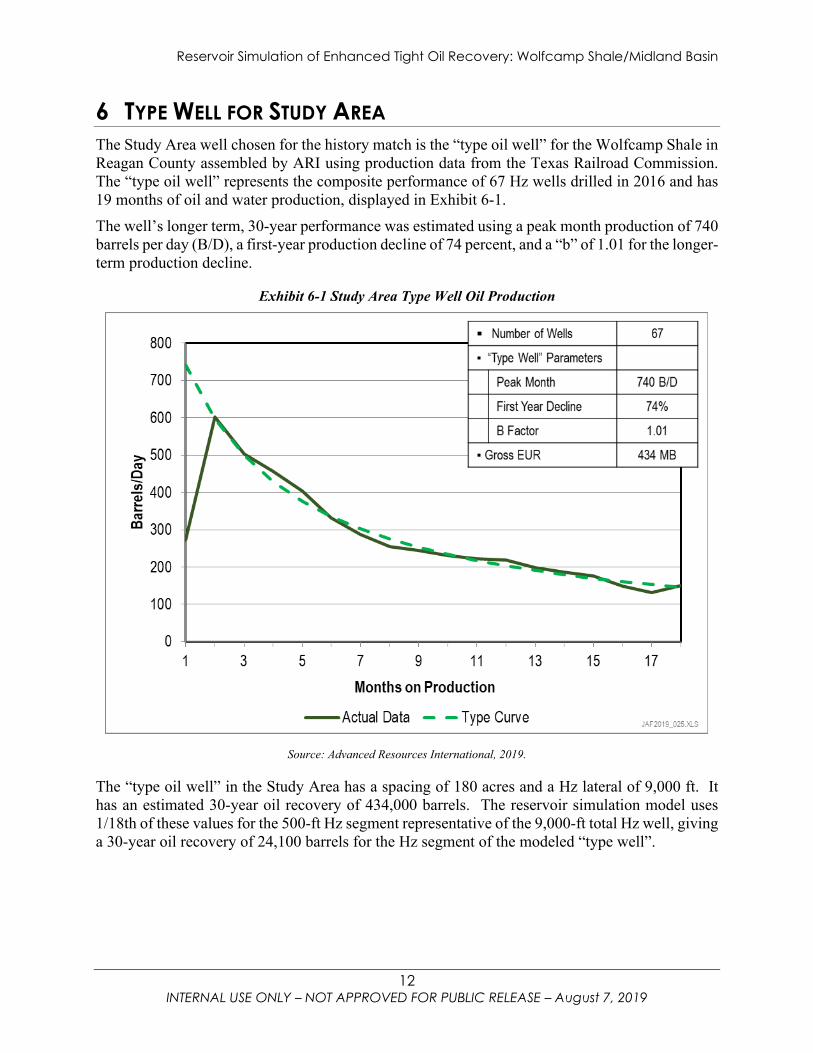
6 TYPE WELL FOR STUDY AREA The Study Area well chosen for the history match is the “type oil well” for the Wolfcamp Shale in Reagan County assembled by ARI using production data from the Texas Railroad Commission. The “type oil well” represents the composite performance of 67 Hz wells drilled in 2016 and has 19 months of oil and water production, displayed in Exhibit 6-1. The well’s longer term, 30-year performance was estimated using a peak month production of 740 barrels per day (B/D), a first-year production decline of 74 percent, and a “b” of 1.01 for the longer-term production decline.
Exhibit 6-1 Study Area Type Well Oil Production
Source: Advanced Resources International, 2019.
The “type oil well” in the Study Area has a spacing of 180 acres and a Hz lateral of 9,000 ft. It has an estimated 30-year oil recovery of 434,000 barrels. The reservoir simulation model uses 1/18th of these values for the 500-ft Hz segment representative of the 9,000-ft total Hz well, giving a 30-year oil recovery of 24,100 barrels for the Hz segment of the modeled “type well”.
Reservoir Simulation of Enhanced Tight Oil Recovery: Wolfcamp Shale/Midland Basin
13 INTERNAL USE ONLY – NOT APPROVED FOR PUBLIC RELEASE – August 7, 2019
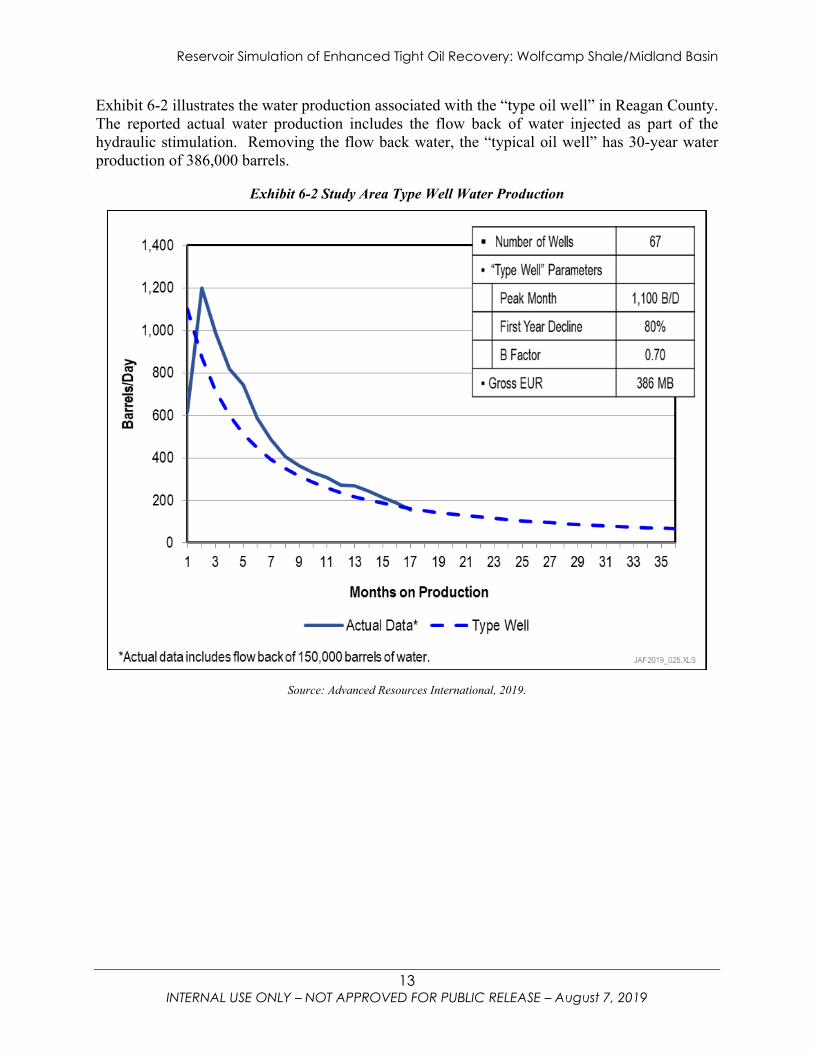
Exhibit 6-2 illustrates the water production associated with the “type oil well” in Reagan County. The reported actual water production includes the flow back of water injected as part of the hydraulic stimulation. Removing the flow back water, the “typical oil well” has 30-year water production of 386,000 barrels.
Exhibit 6-2 Study Area Type Well Water Production
Source: Advanced Resources International, 2019.
Reservoir Simulation of Enhanced Tight Oil Recovery: Wolfcamp Shale/Midland Basin
14 INTERNAL USE ONLY – NOT APPROVED FOR PUBLIC RELEASE – August 7, 2019
7 REPRESENTING THE IMPACT OF HYDRAULIC STIMULATION
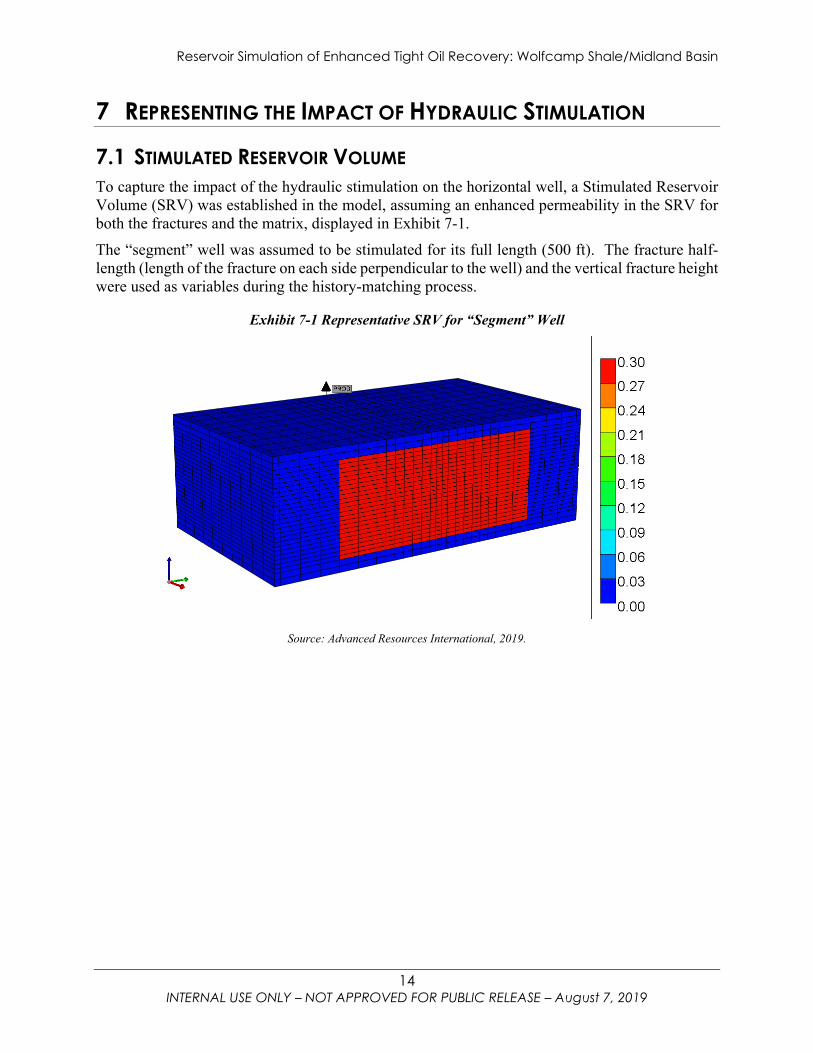
7.1 STIMULATED RESERVOIR VOLUME To capture the impact of the hydraulic stimulation on the horizontal well, a Stimulated Reservoir Volume (SRV) was established in the model, assuming an enhanced permeability in the SRV for both the fractures and the matrix, displayed in Exhibit 7-1. The “segment” well was assumed to be stimulated for its full length (500 ft). The fracture half-length (length of the fracture on each side perpendicular to the well) and the vertical fracture height were used as variables during the history-matching process.
Exhibit 7-1 Representative SRV for “Segment” Well
Source: Advanced Resources International, 2019.
Reservoir Simulation of Enhanced Tight Oil Recovery: Wolfcamp Shale/Midland Basin
15 INTERNAL USE ONLY – NOT APPROVED FOR PUBLIC RELEASE – August 7, 2019
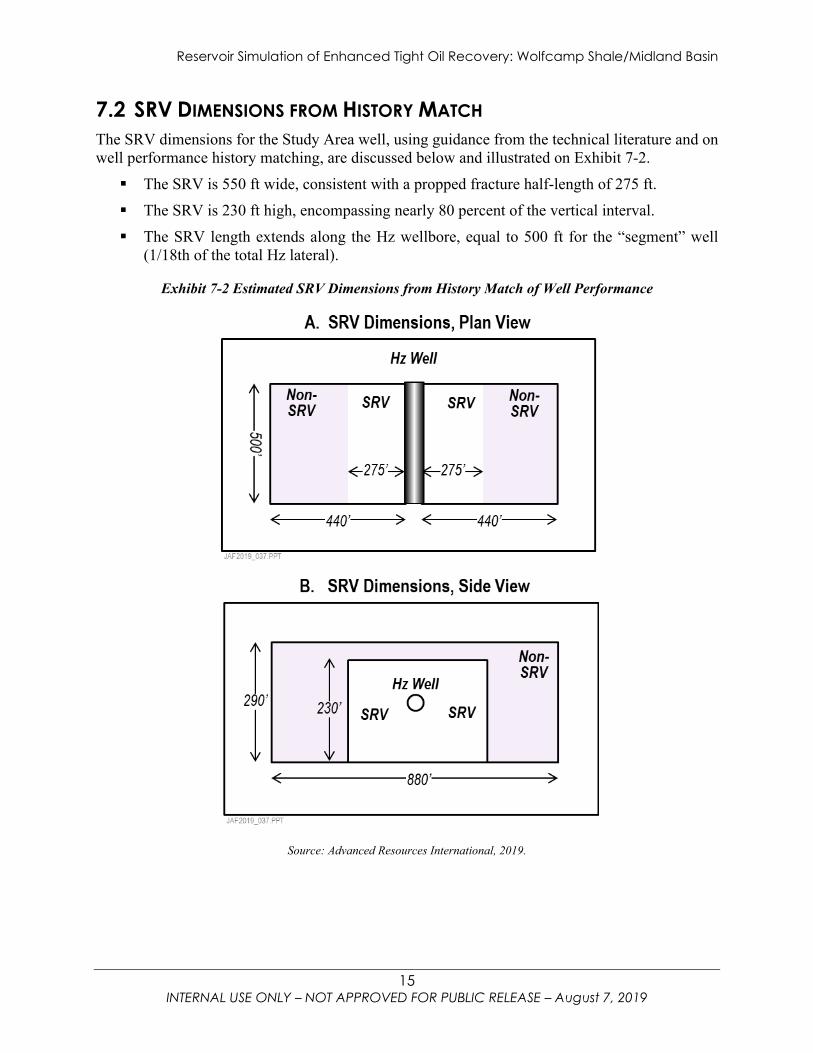
7.2 SRV DIMENSIONS FROM HISTORY MATCH The SRV dimensions for the Study Area well, using guidance from the technical literature and on well performance history matching, are discussed below and illustrated on Exhibit 7-2. The SRV is 550 ft wide, consistent with a propped fracture half-length of 275 ft. The SRV is 230 ft high, encompassing nearly 80 percent of the vertical interval. The SRV length extends along the Hz wellbore, equal to 500 ft for the “segment” well
(1/18th of the total Hz lateral).
Exhibit 7-2 Estimated SRV Dimensions from History Match of Well Performance
Source: Advanced Resources International, 2019.
Reservoir Simulation of Enhanced Tight Oil Recovery: Wolfcamp Shale/Midland Basin
16 INTERNAL USE ONLY – NOT APPROVED FOR PUBLIC RELEASE – August 7, 2019
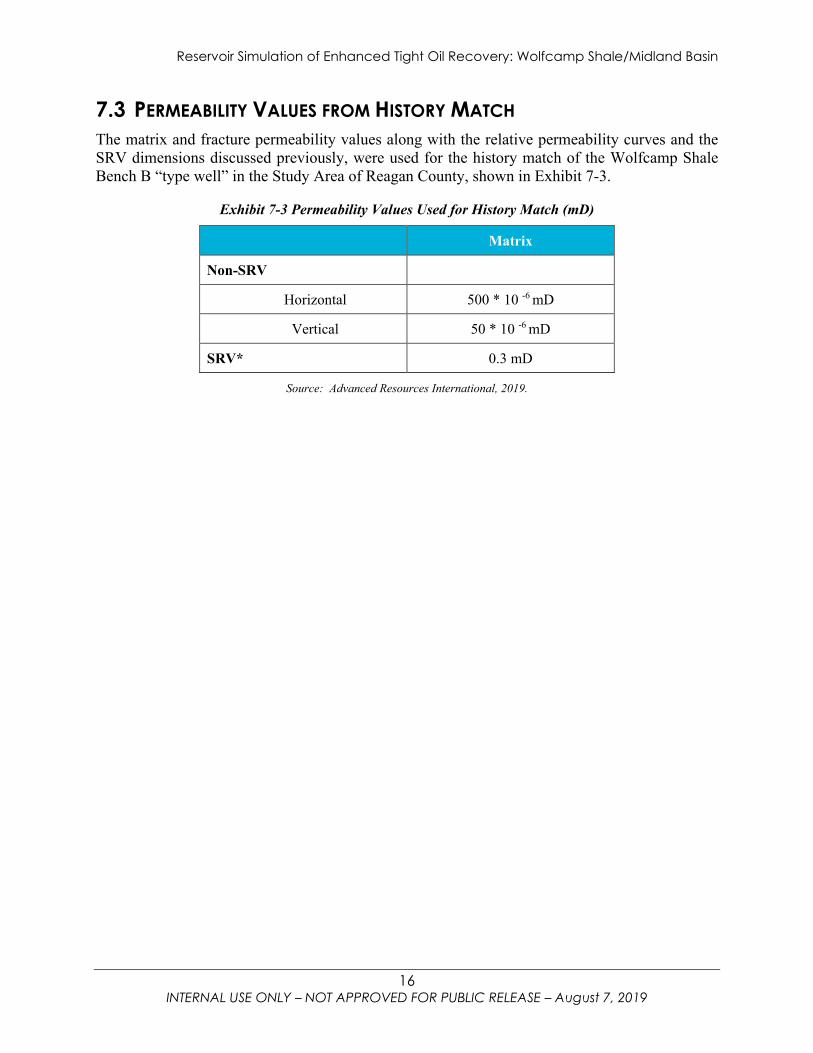
7.3 PERMEABILITY VALUES FROM HISTORY MATCH The matrix and fracture permeability values along with the relative permeability curves and the SRV dimensions discussed previously, were used for the history match of the Wolfcamp Shale Bench B “type well” in the Study Area of Reagan County, shown in Exhibit 7-3.
Exhibit 7-3 Permeability Values Used for History Match (mD)
Matrix
Non-SRV
Horizontal 500 * 10 -6 mD
Vertical 50 * 10 -6 mD
SRV* 0.3 mD
Source: Advanced Resources International, 2019.
Reservoir Simulation of Enhanced Tight Oil Recovery: Wolfcamp Shale/Midland Basin
17 INTERNAL USE ONLY – NOT APPROVED FOR PUBLIC RELEASE – August 7, 2019
8 HISTORY-MATCHING OIL AND NATURAL GAS PRODUCTION
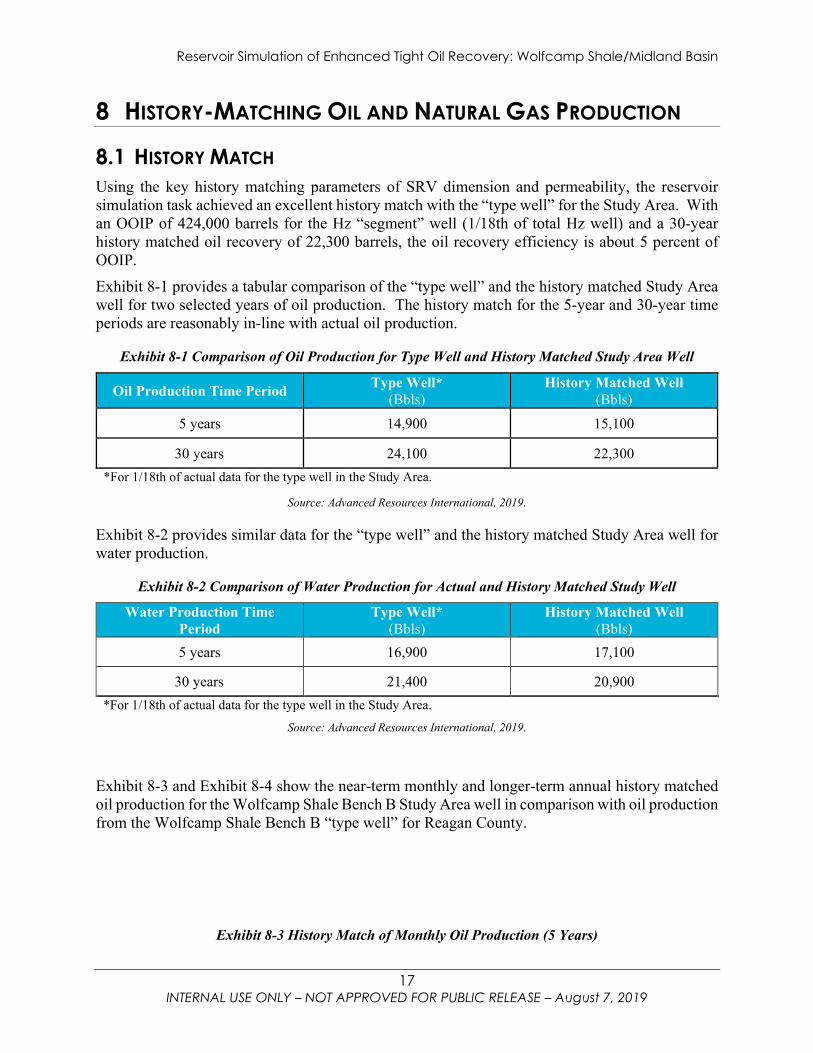
8.1 HISTORY MATCH Using the key history matching parameters of SRV dimension and permeability, the reservoir simulation task achieved an excellent history match with the “type well” for the Study Area. With an OOIP of 424,000 barrels for the Hz “segment” well (1/18th of total Hz well) and a 30-year history matched oil recovery of 22,300 barrels, the oil recovery efficiency is about 5 percent of OOIP. Exhibit 8-1 provides a tabular comparison of the “type well” and the history matched Study Area well for two selected years of oil production. The history match for the 5-year and 30-year time periods are reasonably in-line with actual oil production.
Exhibit 8-1 Comparison of Oil Production for Type Well and History Matched Study Area Well
Oil Production Time Period Type Well* (Bbls)
History Matched Well (Bbls)
5 years 14,900 15,100
30 years 24,100 22,300 *For 1/18th of actual data for the type well in the Study Area.
Source: Advanced Resources International, 2019.
Exhibit 8-2 provides similar data for the “type well” and the history matched Study Area well for water production.
Exhibit 8-2 Comparison of Water Production for Actual and History Matched Study Well
Water Production Time Period
Type Well* (Bbls)
History Matched Well (Bbls)
5 years 16,900 17,100
30 years 21,400 20,900 *For 1/18th of actual data for the type well in the Study Area.
Source: Advanced Resources International, 2019.
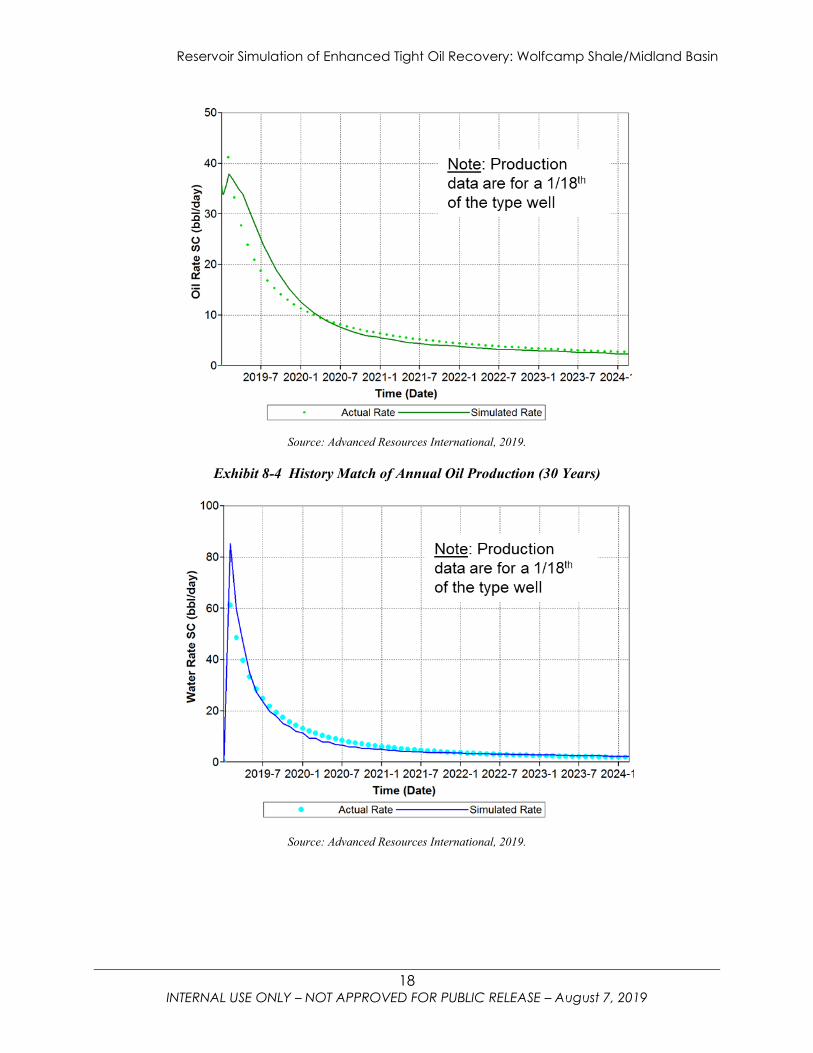
Exhibit 8-3 and Exhibit 8-4 show the near-term monthly and longer-term annual history matched oil production for the Wolfcamp Shale Bench B Study Area well in comparison with oil production from the Wolfcamp Shale Bench B “type well” for Reagan County.
Exhibit 8-3 History Match of Monthly Oil Production (5 Years)
Reservoir Simulation of Enhanced Tight Oil Recovery: Wolfcamp Shale/Midland Basin
18 INTERNAL USE ONLY – NOT APPROVED FOR PUBLIC RELEASE – August 7, 2019
Source: Advanced Resources International, 2019.
Exhibit 8-4 History Match of Annual Oil Production (30 Years)
Source: Advanced Resources International, 2019.
Reservoir Simulation of Enhanced Tight Oil Recovery: Wolfcamp Shale/Midland Basin
19 INTERNAL USE ONLY – NOT APPROVED FOR PUBLIC RELEASE – August 7, 2019
8.2 MODELING OF CYCLIC CO2 INJECTION
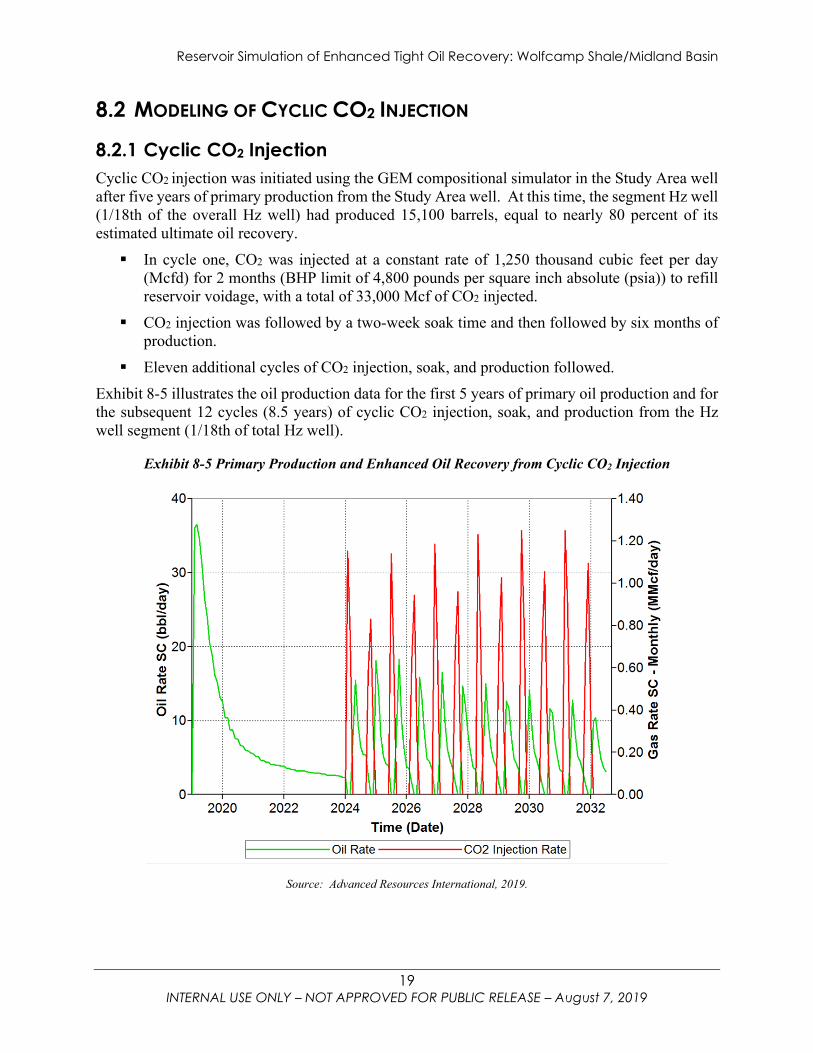
8.2.1 Cyclic CO2 Injection Cyclic CO2 injection was initiated using the GEM compositional simulator in the Study Area well after five years of primary production from the Study Area well. At this time, the segment Hz well (1/18th of the overall Hz well) had produced 15,100 barrels, equal to nearly 80 percent of its estimated ultimate oil recovery. In cycle one, CO2 was injected at a constant rate of 1,250 thousand cubic feet per day
(Mcfd) for 2 months (BHP limit of 4,800 pounds per square inch absolute (psia)) to refill reservoir voidage, with a total of 33,000 Mcf of CO2 injected.
CO2 injection was followed by a two-week soak time and then followed by six months of production.
Eleven additional cycles of CO2 injection, soak, and production followed. Exhibit 8-5 illustrates the oil production data for the first 5 years of primary oil production and for the subsequent 12 cycles (8.5 years) of cyclic CO2 injection, soak, and production from the Hz well segment (1/18th of total Hz well).
Exhibit 8-5 Primary Production and Enhanced Oil Recovery from Cyclic CO2 Injection
Source: Advanced Resources International, 2019.
Reservoir Simulation of Enhanced Tight Oil Recovery: Wolfcamp Shale/Midland Basin
20 INTERNAL USE ONLY – NOT APPROVED FOR PUBLIC RELEASE – August 7, 2019
8.2.2 Performance of Cyclic CO2 Injection: Reduced Hz Well Segment (500 ft)
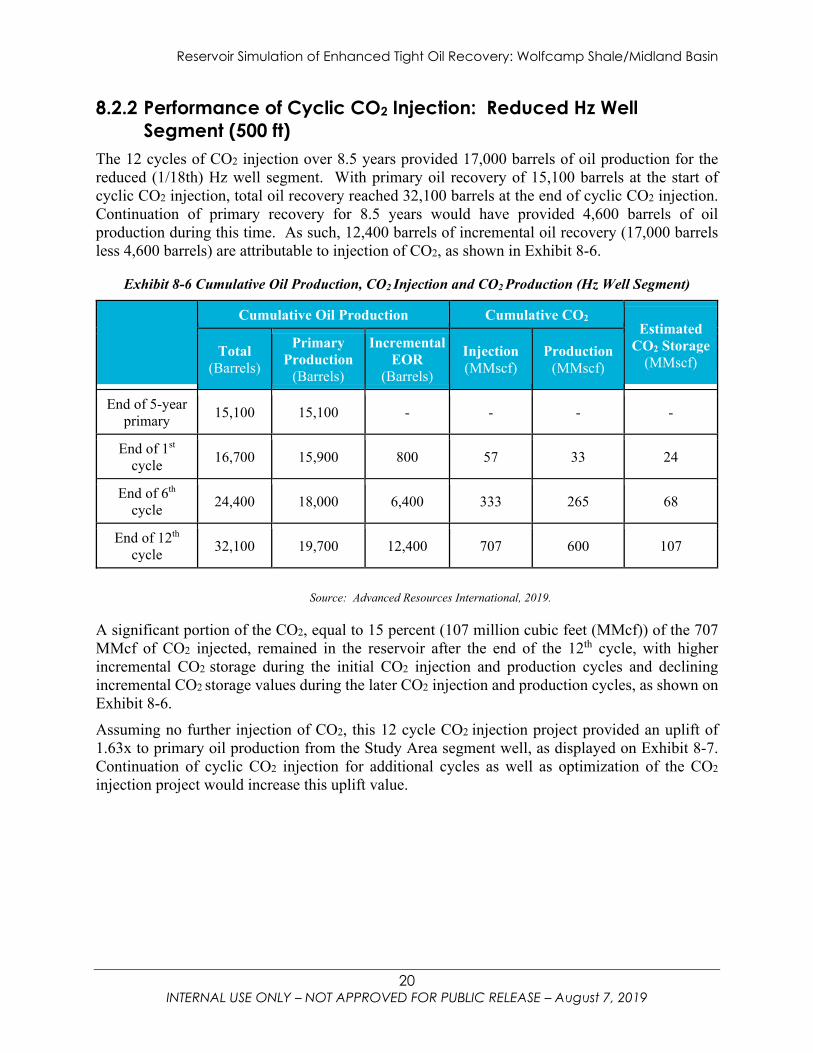
The 12 cycles of CO2 injection over 8.5 years provided 17,000 barrels of oil production for the reduced (1/18th) Hz well segment. With primary oil recovery of 15,100 barrels at the start of cyclic CO2 injection, total oil recovery reached 32,100 barrels at the end of cyclic CO2 injection. Continuation of primary recovery for 8.5 years would have provided 4,600 barrels of oil production during this time. As such, 12,400 barrels of incremental oil recovery (17,000 barrels less 4,600 barrels) are attributable to injection of CO2, as shown in Exhibit 8-6.
Exhibit 8-6 Cumulative Oil Production, CO2 Injection and CO2 Production (Hz Well Segment)
Cumulative Oil Production Cumulative CO2 Estimated
CO2 Storage (MMscf)
Total (Barrels)
Primary Production
(Barrels)
Incremental EOR
(Barrels)
Injection (MMscf)
Production (MMscf)
End of 5-year primary 15,100 15,100 - - - -
End of 1st cycle 16,700 15,900 800 57 33 24
End of 6th cycle 24,400 18,000 6,400 333 265 68
End of 12th cycle 32,100 19,700 12,400 707 600 107
Source: Advanced Resources International, 2019.
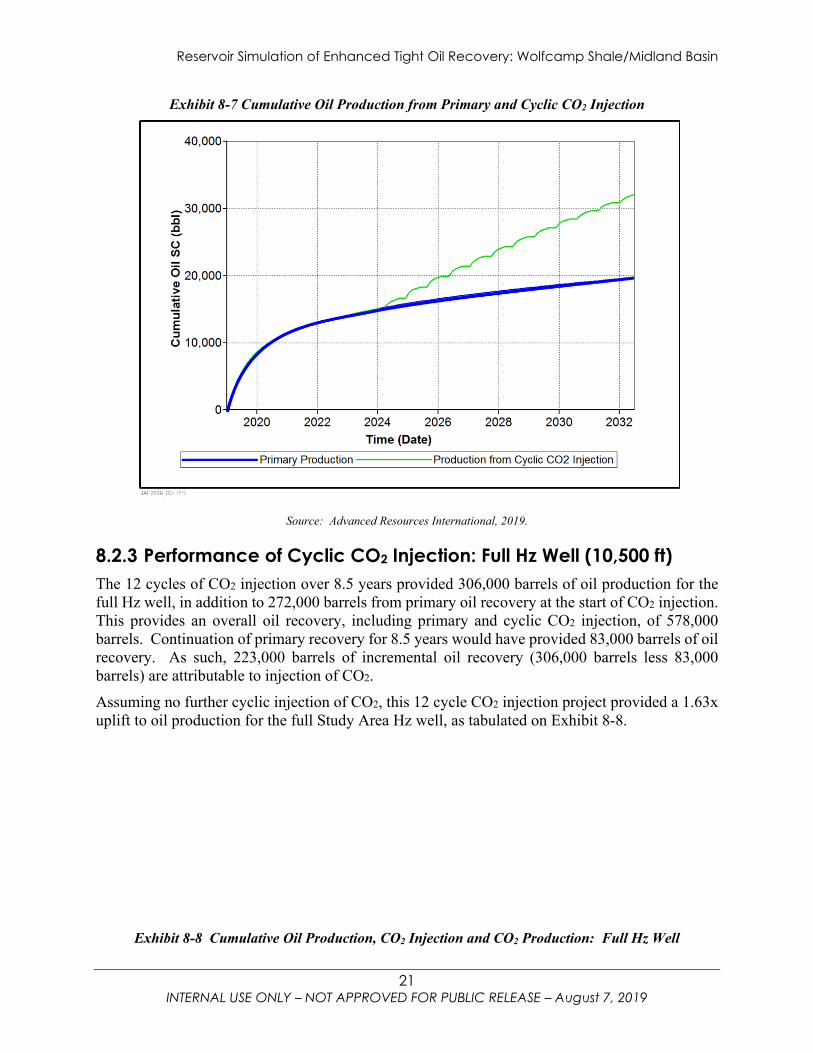
A significant portion of the CO2, equal to 15 percent (107 million cubic feet (MMcf)) of the 707 MMcf of CO2 injected, remained in the reservoir after the end of the 12th cycle, with higher incremental CO2 storage during the initial CO2 injection and production cycles and declining incremental CO2 storage values during the later CO2 injection and production cycles, as shown on Exhibit 8-6. Assuming no further injection of CO2, this 12 cycle CO2 injection project provided an uplift of 1.63x to primary oil production from the Study Area segment well, as displayed on Exhibit 8-7. Continuation of cyclic CO2 injection for additional cycles as well as optimization of the CO2 injection project would increase this uplift value.
Reservoir Simulation of Enhanced Tight Oil Recovery: Wolfcamp Shale/Midland Basin
21 INTERNAL USE ONLY – NOT APPROVED FOR PUBLIC RELEASE – August 7, 2019
Exhibit 8-7 Cumulative Oil Production from Primary and Cyclic CO2 Injection
Source: Advanced Resources International, 2019.
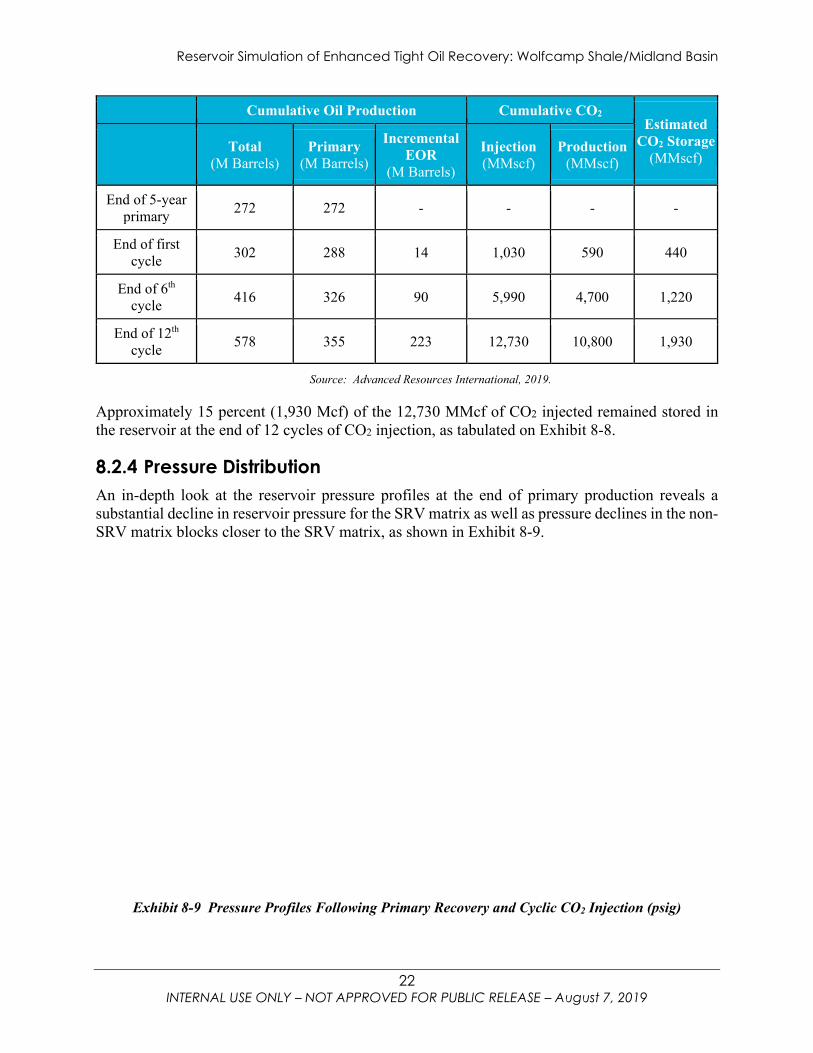
8.2.3 Performance of Cyclic CO2 Injection: Full Hz Well (10,500 ft) The 12 cycles of CO2 injection over 8.5 years provided 306,000 barrels of oil production for the full Hz well, in addition to 272,000 barrels from primary oil recovery at the start of CO2 injection. This provides an overall oil recovery, including primary and cyclic CO2 injection, of 578,000 barrels. Continuation of primary recovery for 8.5 years would have provided 83,000 barrels of oil recovery. As such, 223,000 barrels of incremental oil recovery (306,000 barrels less 83,000 barrels) are attributable to injection of CO2. Assuming no further cyclic injection of CO2, this 12 cycle CO2 injection project provided a 1.63x uplift to oil production for the full Study Area Hz well, as tabulated on Exhibit 8-8.
Exhibit 8-8 Cumulative Oil Production, CO2 Injection and CO2 Production: Full Hz Well
Reservoir Simulation of Enhanced Tight Oil Recovery: Wolfcamp Shale/Midland Basin
22 INTERNAL USE ONLY – NOT APPROVED FOR PUBLIC RELEASE – August 7, 2019
Cumulative Oil Production Cumulative CO2 Estimated
CO2 Storage (MMscf) Total
(M Barrels) Primary
(M Barrels)
Incremental EOR
(M Barrels)
Injection (MMscf)
Production (MMscf)
End of 5-year primary 272 272 - - - -
End of first cycle 302 288 14 1,030 590 440
End of 6th cycle 416 326 90 5,990 4,700 1,220
End of 12th cycle 578 355 223 12,730 10,800 1,930
Source: Advanced Resources International, 2019.
Approximately 15 percent (1,930 Mcf) of the 12,730 MMcf of CO2 injected remained stored in the reservoir at the end of 12 cycles of CO2 injection, as tabulated on Exhibit 8-8.
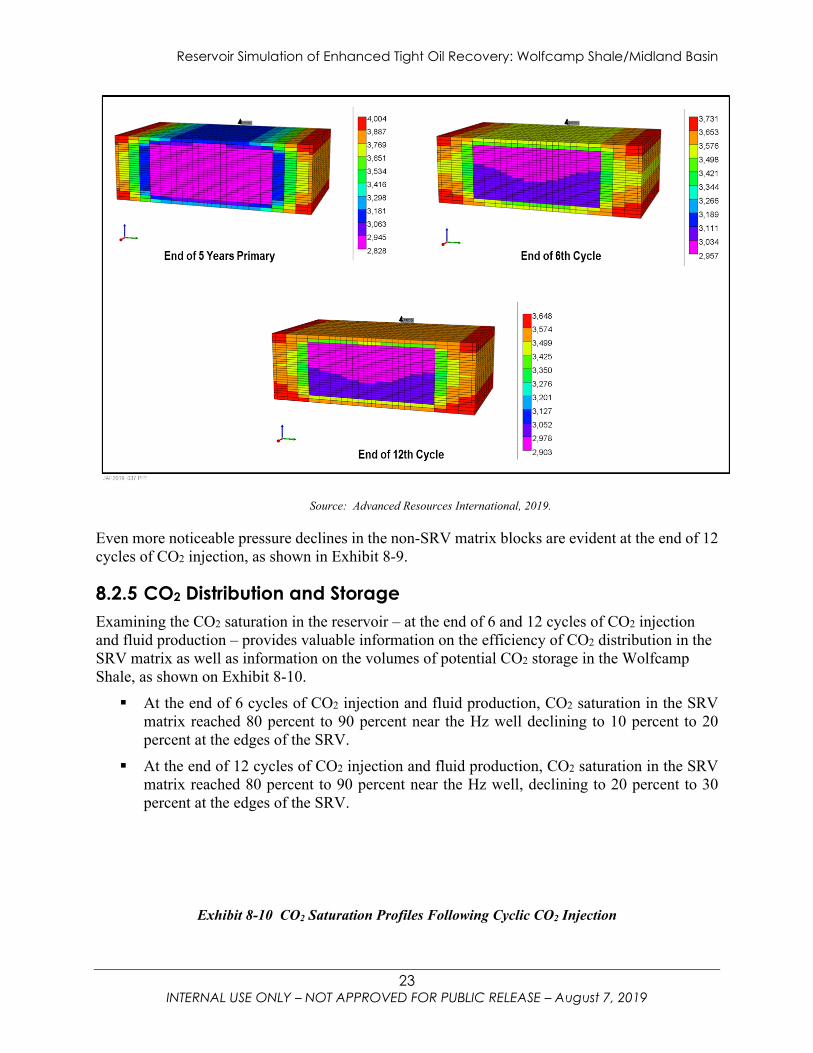
8.2.4 Pressure Distribution An in-depth look at the reservoir pressure profiles at the end of primary production reveals a substantial decline in reservoir pressure for the SRV matrix as well as pressure declines in the non-SRV matrix blocks closer to the SRV matrix, as shown in Exhibit 8-9.
Exhibit 8-9 Pressure Profiles Following Primary Recovery and Cyclic CO2 Injection (psig)
Reservoir Simulation of Enhanced Tight Oil Recovery: Wolfcamp Shale/Midland Basin
23 INTERNAL USE ONLY – NOT APPROVED FOR PUBLIC RELEASE – August 7, 2019
Source: Advanced Resources International, 2019.
Even more noticeable pressure declines in the non-SRV matrix blocks are evident at the end of 12 cycles of CO2 injection, as shown in Exhibit 8-9.
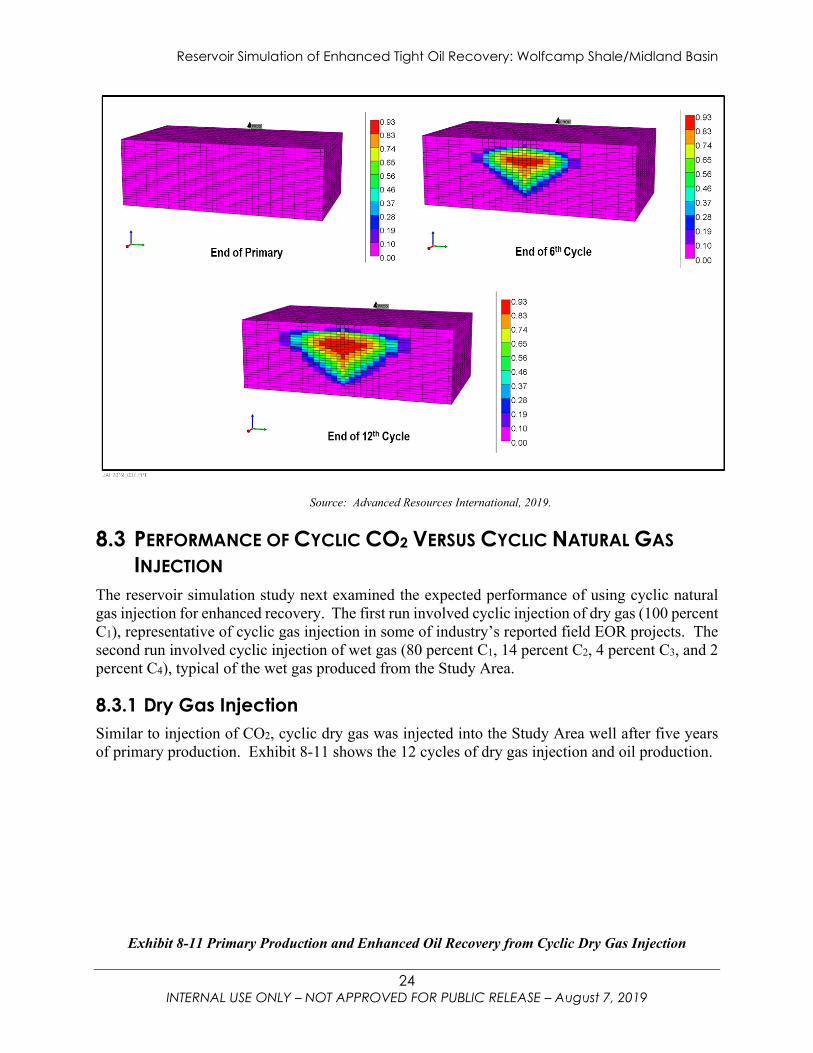
8.2.5 CO2 Distribution and Storage Examining the CO2 saturation in the reservoir – at the end of 6 and 12 cycles of CO2 injection and fluid production – provides valuable information on the efficiency of CO2 distribution in the SRV matrix as well as information on the volumes of potential CO2 storage in the Wolfcamp Shale, as shown on Exhibit 8-10. At the end of 6 cycles of CO2 injection and fluid production, CO2 saturation in the SRV
matrix reached 80 percent to 90 percent near the Hz well declining to 10 percent to 20 percent at the edges of the SRV.
At the end of 12 cycles of CO2 injection and fluid production, CO2 saturation in the SRV matrix reached 80 percent to 90 percent near the Hz well, declining to 20 percent to 30 percent at the edges of the SRV.
Exhibit 8-10 CO2 Saturation Profiles Following Cyclic CO2 Injection
Reservoir Simulation of Enhanced Tight Oil Recovery: Wolfcamp Shale/Midland Basin
24 INTERNAL USE ONLY – NOT APPROVED FOR PUBLIC RELEASE – August 7, 2019
Source: Advanced Resources International, 2019.
8.3 PERFORMANCE OF CYCLIC CO2 VERSUS CYCLIC NATURAL GAS INJECTION
The reservoir simulation study next examined the expected performance of using cyclic natural gas injection for enhanced recovery. The first run involved cyclic injection of dry gas (100 percent C1), representative of cyclic gas injection in some of industry’s reported field EOR projects. The second run involved cyclic injection of wet gas (80 percent C1, 14 percent C2, 4 percent C3, and 2 percent C4), typical of the wet gas produced from the Study Area.
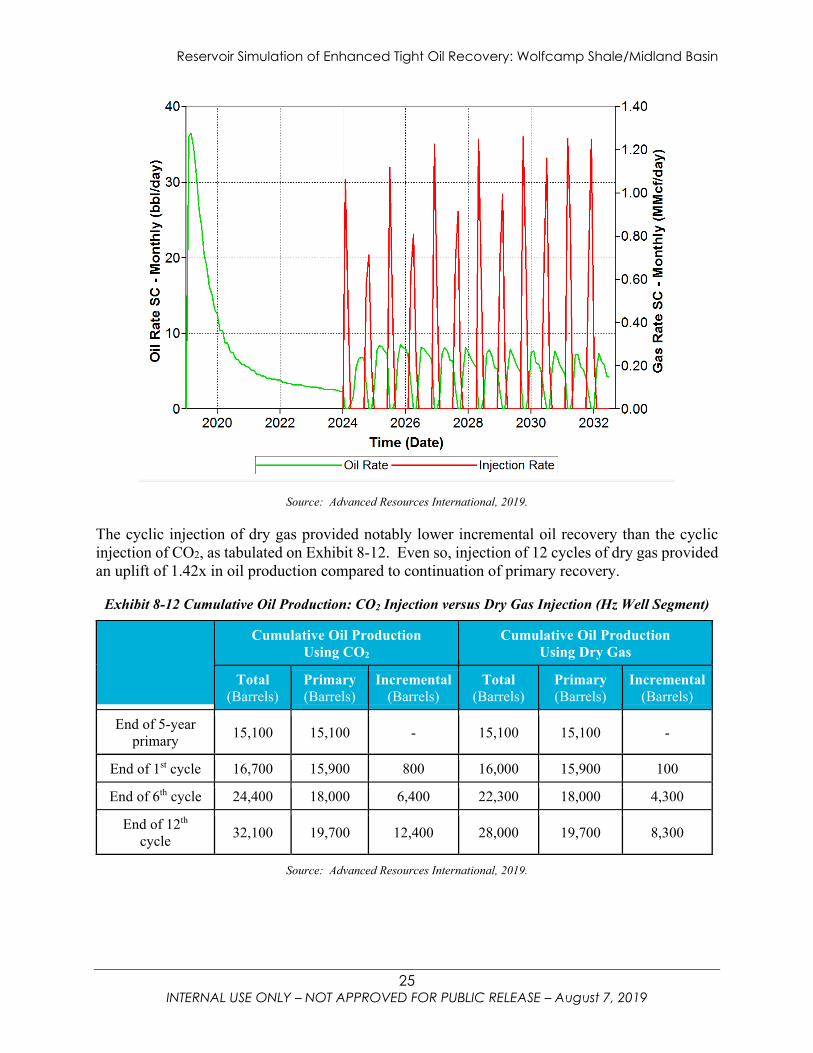
8.3.1 Dry Gas Injection Similar to injection of CO2, cyclic dry gas was injected into the Study Area well after five years of primary production. Exhibit 8-11 shows the 12 cycles of dry gas injection and oil production.
Exhibit 8-11 Primary Production and Enhanced Oil Recovery from Cyclic Dry Gas Injection
Reservoir Simulation of Enhanced Tight Oil Recovery: Wolfcamp Shale/Midland Basin
25 INTERNAL USE ONLY – NOT APPROVED FOR PUBLIC RELEASE – August 7, 2019
Source: Advanced Resources International, 2019.
The cyclic injection of dry gas provided notably lower incremental oil recovery than the cyclic injection of CO2, as tabulated on Exhibit 8-12. Even so, injection of 12 cycles of dry gas provided an uplift of 1.42x in oil production compared to continuation of primary recovery.
Exhibit 8-12 Cumulative Oil Production: CO2 Injection versus Dry Gas Injection (Hz Well Segment)
Cumulative Oil Production Using CO2
Cumulative Oil Production Using Dry Gas
Total (Barrels)
Primary (Barrels)
Incremental (Barrels)
Total (Barrels)
Primary (Barrels)
Incremental (Barrels)
End of 5-year primary 15,100 15,100 - 15,100 15,100 -
End of 1st cycle 16,700 15,900 800 16,000 15,900 100
End of 6th cycle 24,400 18,000 6,400 22,300 18,000 4,300
End of 12th cycle 32,100 19,700 12,400 28,000 19,700 8,300
Source: Advanced Resources International, 2019.
Reservoir Simulation of Enhanced Tight Oil Recovery: Wolfcamp Shale/Midland Basin
26 INTERNAL USE ONLY – NOT APPROVED FOR PUBLIC RELEASE – August 7, 2019
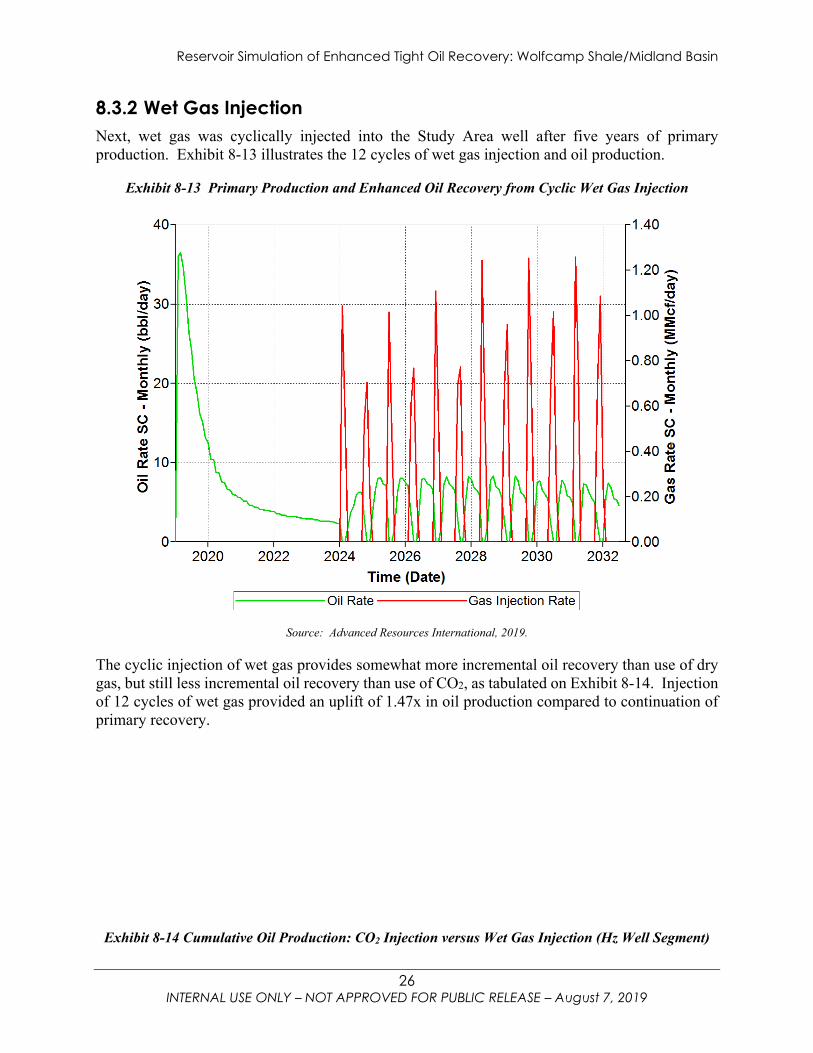
8.3.2 Wet Gas Injection Next, wet gas was cyclically injected into the Study Area well after five years of primary production. Exhibit 8-13 illustrates the 12 cycles of wet gas injection and oil production.
Exhibit 8-13 Primary Production and Enhanced Oil Recovery from Cyclic Wet Gas Injection
Source: Advanced Resources International, 2019.
The cyclic injection of wet gas provides somewhat more incremental oil recovery than use of dry gas, but still less incremental oil recovery than use of CO2, as tabulated on Exhibit 8-14. Injection of 12 cycles of wet gas provided an uplift of 1.47x in oil production compared to continuation of primary recovery.
Exhibit 8-14 Cumulative Oil Production: CO2 Injection versus Wet Gas Injection (Hz Well Segment)
Reservoir Simulation of Enhanced Tight Oil Recovery: Wolfcamp Shale/Midland Basin
27 INTERNAL USE ONLY – NOT APPROVED FOR PUBLIC RELEASE – August 7, 2019
Cumulative Oil Production Using CO2
Cumulative Oil Production Using Wet Gas
Total (Barrels)
Primary (Barrels)
Incremental (Barrels)
Total (Barrels)
Primary (Barrels)
Incremental (Barrels)
End of 5-year primary 15,100 15,100 - 15,100 15,100 -
End of 1st cycle 16,700 15,900 800 16,100 15,900 200
End of 6th cycle 24,400 18,000 6,400 22,300 18,000 4,300
End of 12th cycle 32,100 19,700 12,400 29,100 19,700 9,400
Source: Advanced Resources International, 2019.
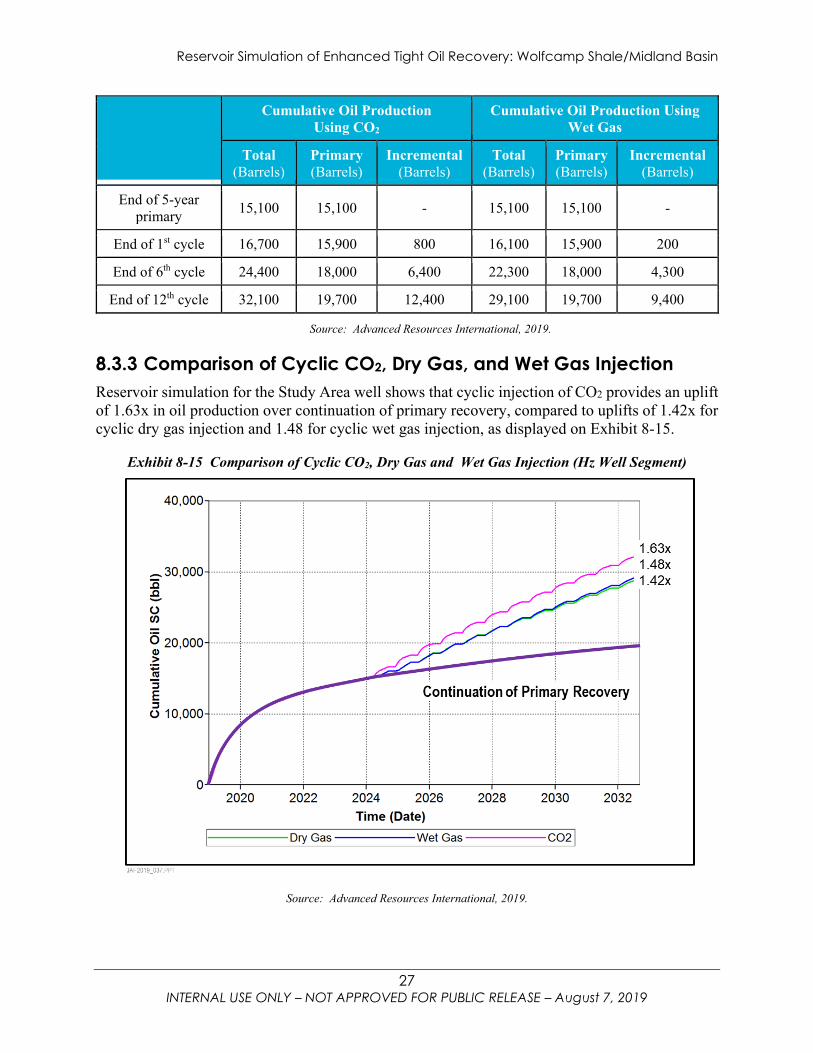
8.3.3 Comparison of Cyclic CO2, Dry Gas, and Wet Gas Injection Reservoir simulation for the Study Area well shows that cyclic injection of CO2 provides an uplift of 1.63x in oil production over continuation of primary recovery, compared to uplifts of 1.42x for cyclic dry gas injection and 1.48 for cyclic wet gas injection, as displayed on Exhibit 8-15.
Exhibit 8-15 Comparison of Cyclic CO2, Dry Gas and Wet Gas Injection (Hz Well Segment)
Source: Advanced Resources International, 2019.
Reservoir Simulation of Enhanced Tight Oil Recovery: Wolfcamp Shale/Midland Basin
28 INTERNAL USE ONLY – NOT APPROVED FOR PUBLIC RELEASE – August 7, 2019
9 REFERENCES Ciezobka, J., 2017. Hydraulic Fracturing Test Site (HFTS). DE-FE0024292, U.S. DOE NETL, Mastering the Subsurface Through Technology Innovation, Partnerships and Collaboration: Carbon Storage and Oil and Natural Gas Technologies Review Meeting, August 1-3, 2017. Earthstone Energy, Inc, 2019, Investor Presentation GTI, 2019. Tables 1, 2, 3 and 4 for Wolfcamp Shale reservoir properties, Reagan County, HFTS field research laboratory. Li, L., Sheng, J. J., & Xu, J. (2017, February 15). Gas Selection for Huff-n-Puff EOR in Shale Oil Reservoirs Based upon Experimental and Numerical Study. Society of Petroleum Engineers. doi:10.2118/185066-MS. Moreland, R., 2017. Petrophysical techniques for unconventional analysis in the Permian Basin. www.ihsmarkit.com Energy and Natural Resources, June 20, 2017. Walls, J., Ver Hoeve, M., Morcote, A., & Foster, M. (2017, July 24). Integrated Multi-Scale Reservoir Characterization: Wolfcamp Formation - Midland Basin. Unconventional Resources Technology Conference. doi:10.15530/URTEC-2017-2670796
www.netl.doe.gov
Albany, OR • Anchorage, AK • Morgantown, WV • Pittsburgh, PA • Sugar Land, TX
(800) 553-7681
Jared Ciferno [email protected]
Michael Tennyson [email protected]