Embed Size (px)
Citation preview
Modelling Seismicity Due to Reservoir Stimulation in
Enhanced Geothermal Systems
G. De Natale 1, M.G. Di Giuseppe1, A. Troiano1,
C. Troise1, G. Perillo2
1INGV - Osservatorio Vesuviano, Naples, Italy
2University of Naples Parthenope, Italy
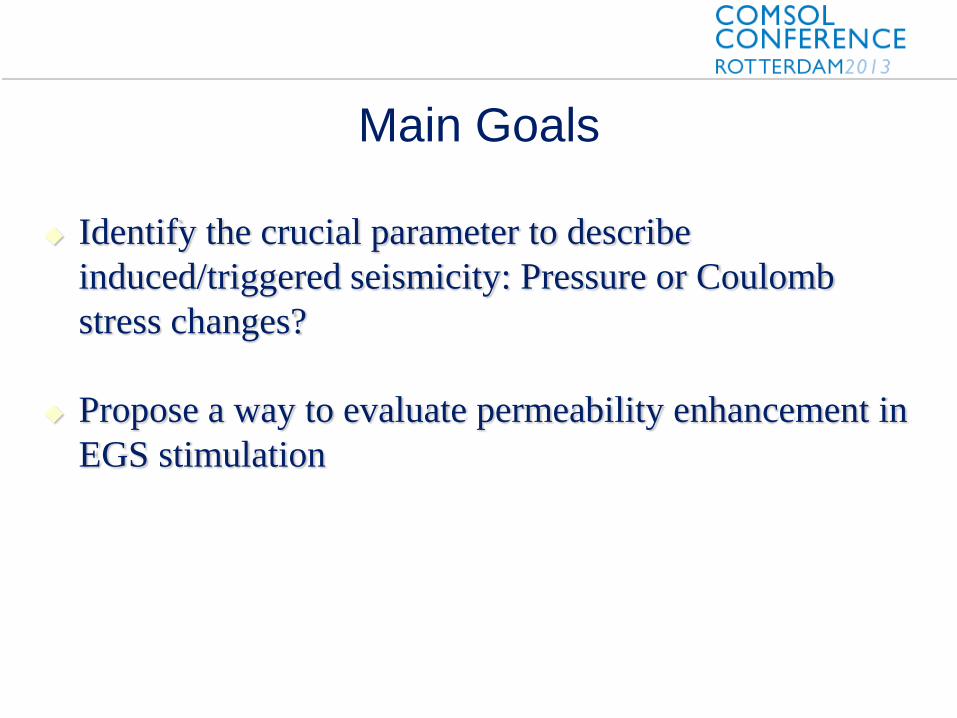
Identify the crucial parameter to describe
induced/triggered seismicity: Pressure or Coulomb
stress changes?
Propose a way to evaluate permeability enhancement in
EGS stimulation
Main Goals
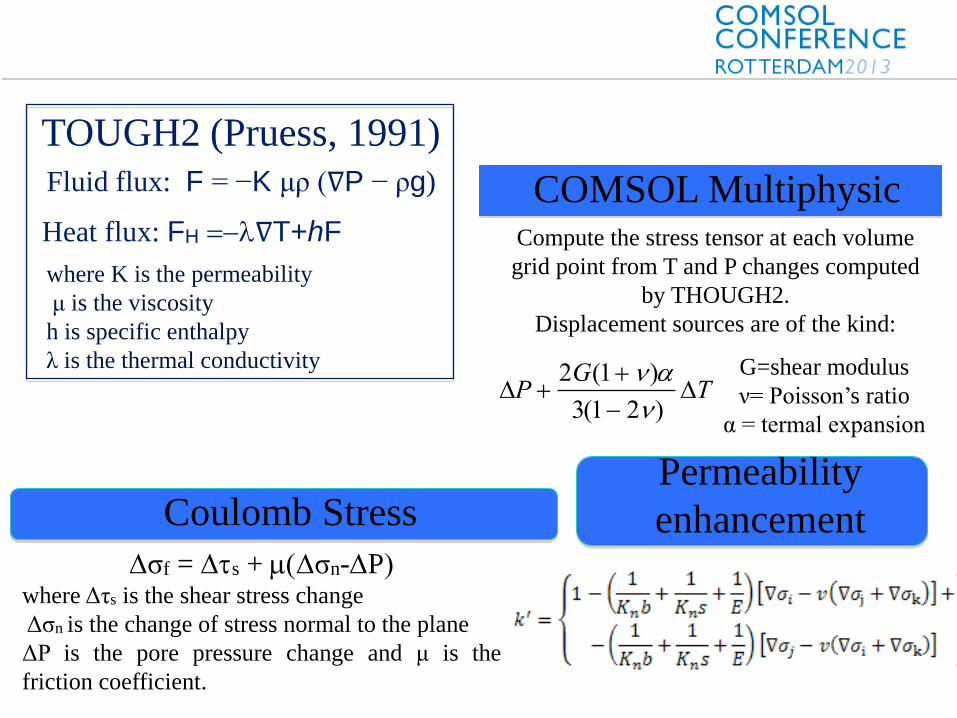
Coulomb Stress
σf = s + (σn-P) where Δτs is the shear stress change
Δσn is the change of stress normal to the plane
ΔP is the pore pressure change and μ is the
friction coefficient.
Fluid flux: F = −K μρ (∇P − ρg)
Heat flux: FH =-∇T+hF
TOUGH2 (Pruess, 1991)
where K is the permeability
μ is the viscosity
h is specific enthalpy
λ is the thermal conductivity
COMSOL Multiphysic Compute the stress tensor at each volume
grid point from T and P changes computed
by THOUGH2.
Displacement sources are of the kind:
G=shear modulus
ν= Poisson’s ratio
α = termal expansion
Permeability
enhancement
P 2G(1 )
3(1- 2)T
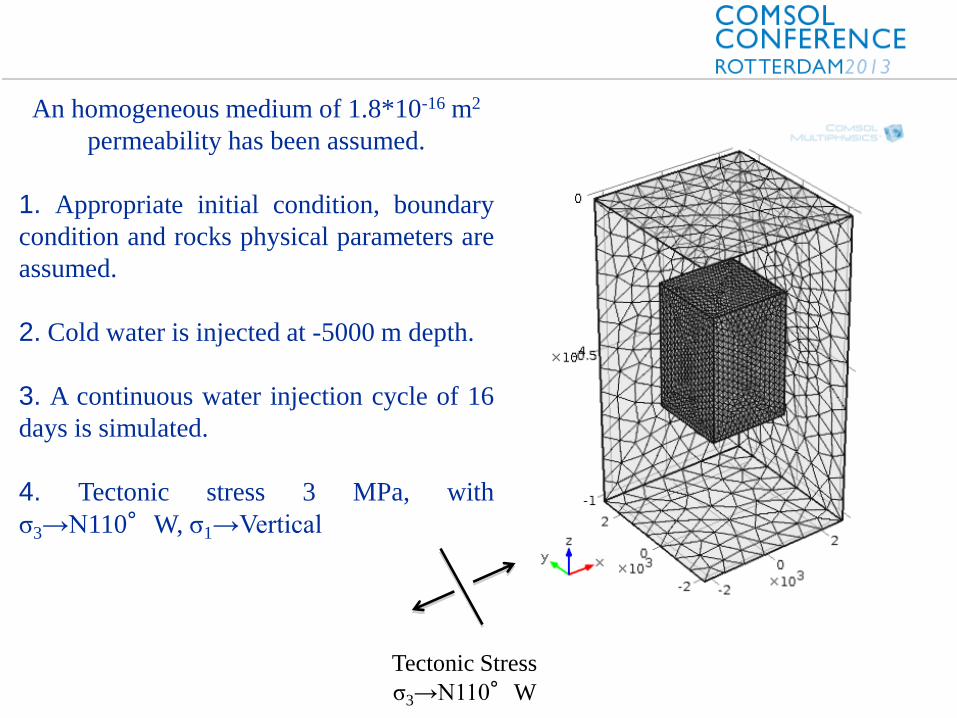
An homogeneous medium of 1.8*10-16 m2
permeability has been assumed.
1. Appropriate initial condition, boundary
condition and rocks physical parameters are
assumed.
2. Cold water is injected at -5000 m depth.
3. A continuous water injection cycle of 16
days is simulated.
4. Tectonic stress 3 MPa, with
σ3→N110°W, σ1→Vertical
Tectonic Stress
σ3→N110°W
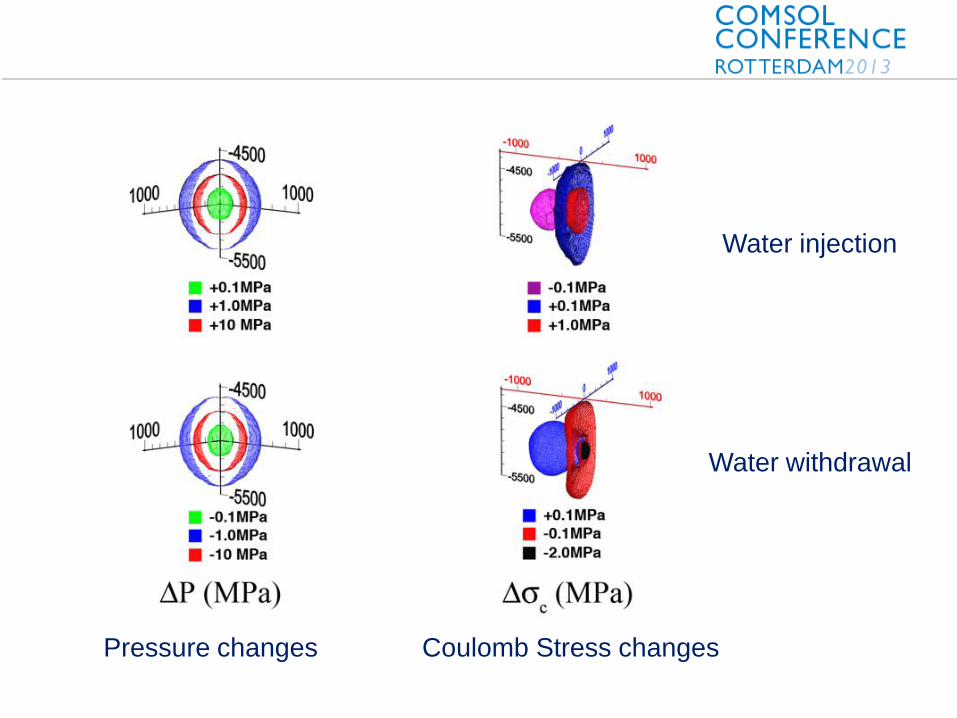
Pressure changes Coulomb Stress changes
Water injection
Water withdrawal
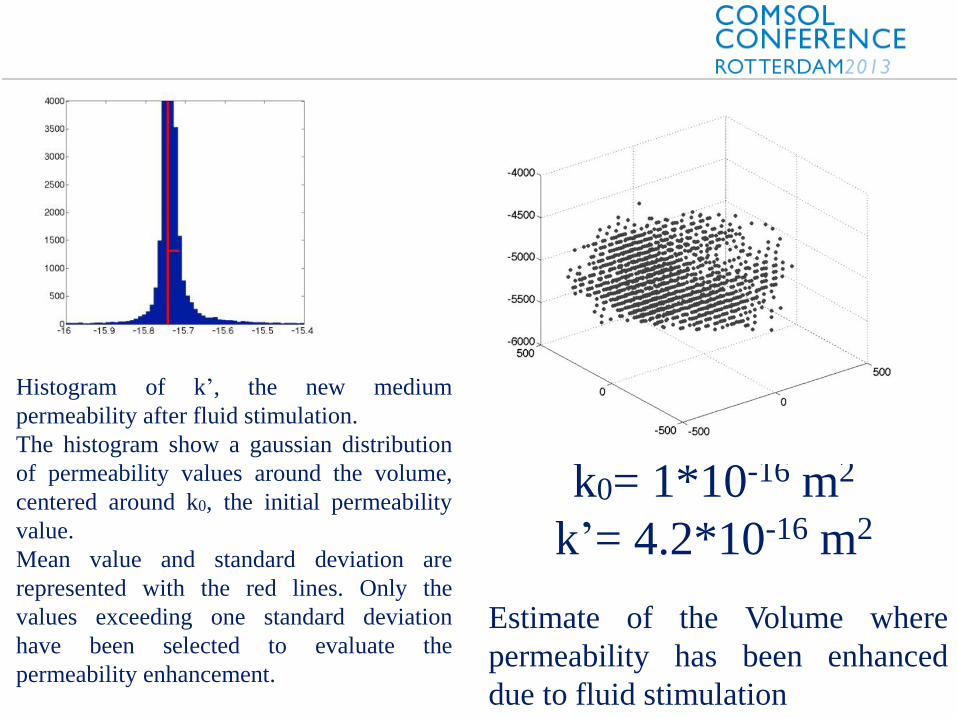
k0= 1*10-16 m2
k’= 4.2*10-16 m2
Histogram of k’, the new medium
permeability after fluid stimulation.
The histogram show a gaussian distribution
of permeability values around the volume,
centered around k0, the initial permeability
value.
Mean value and standard deviation are
represented with the red lines. Only the
values exceeding one standard deviation
have been selected to evaluate the
permeability enhancement.
Estimate of the Volume where
permeability has been enhanced
due to fluid stimulation
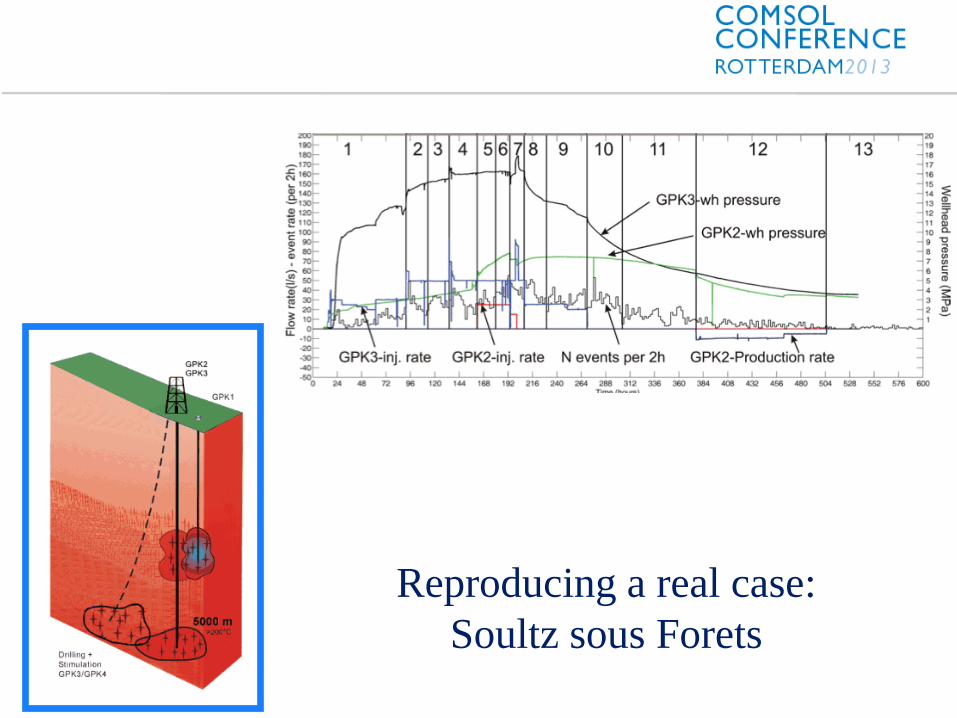
Reproducing a real case:
Soultz sous Forets
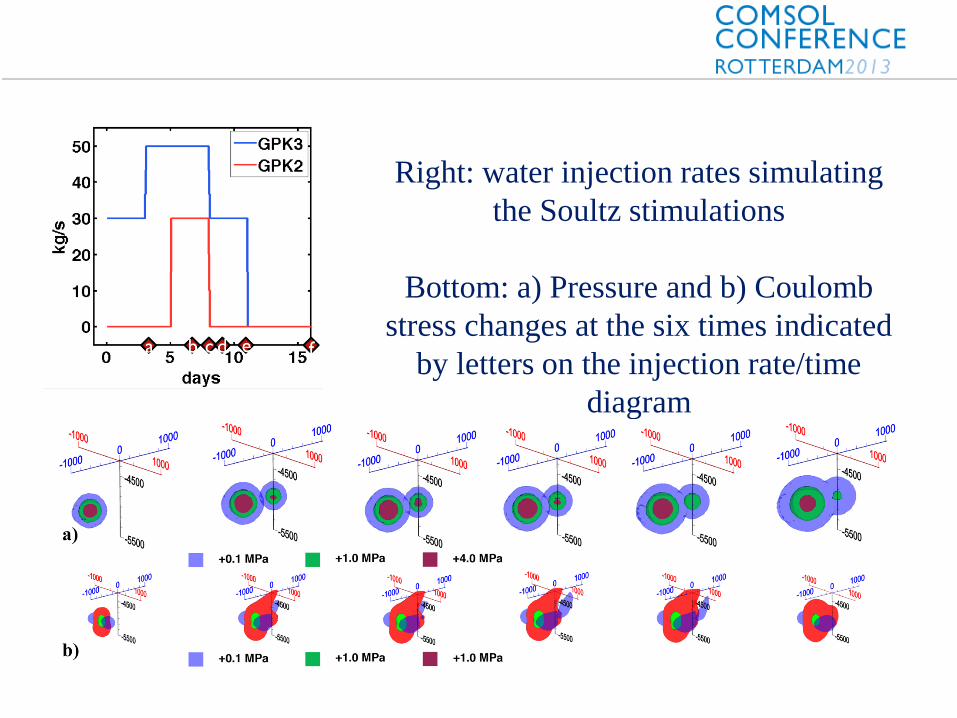
Right: water injection rates simulating
the Soultz stimulations
Bottom: a) Pressure and b) Coulomb
stress changes at the six times indicated
by letters on the injection rate/time
diagram
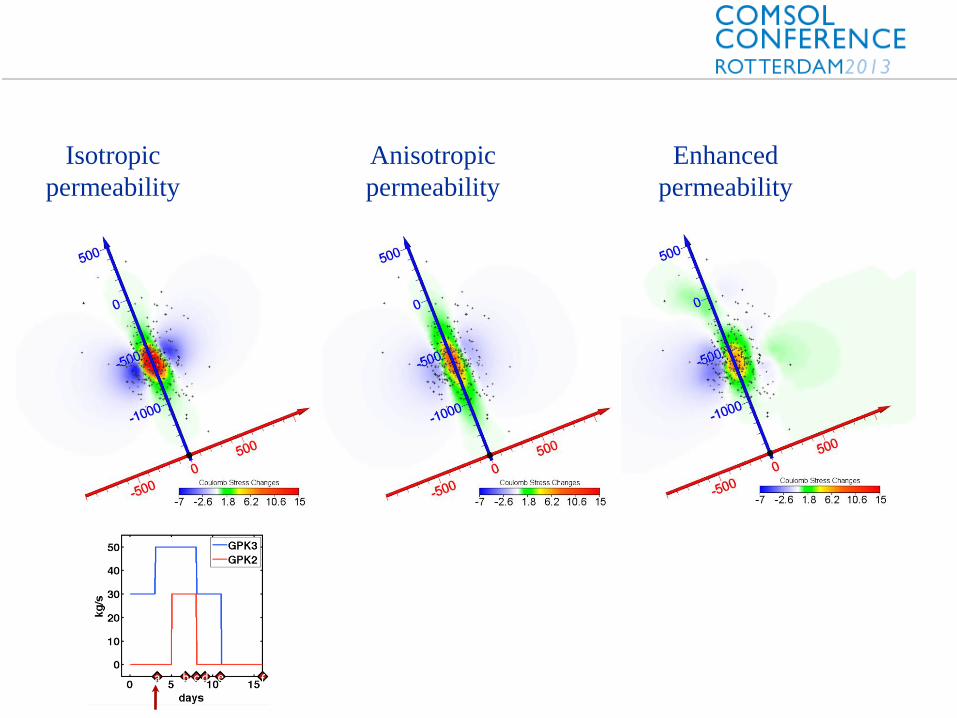
Anisotropic
permeability
Isotropic
permeability
Enhanced
permeability
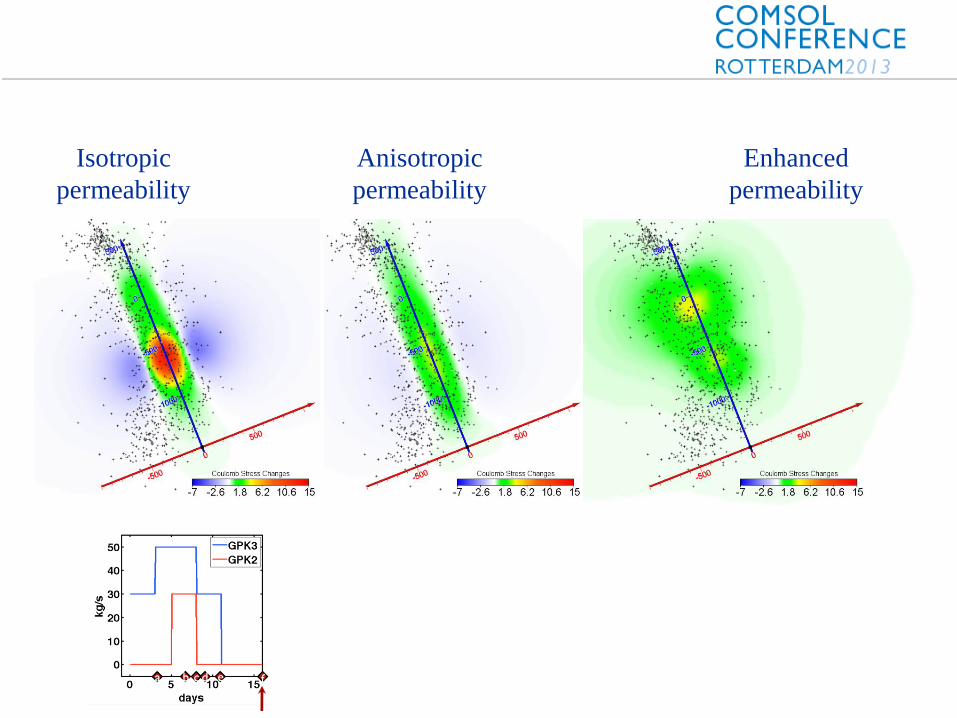
Isotropic
permeability
Anisotropic
permeability
Enhanced
permeability
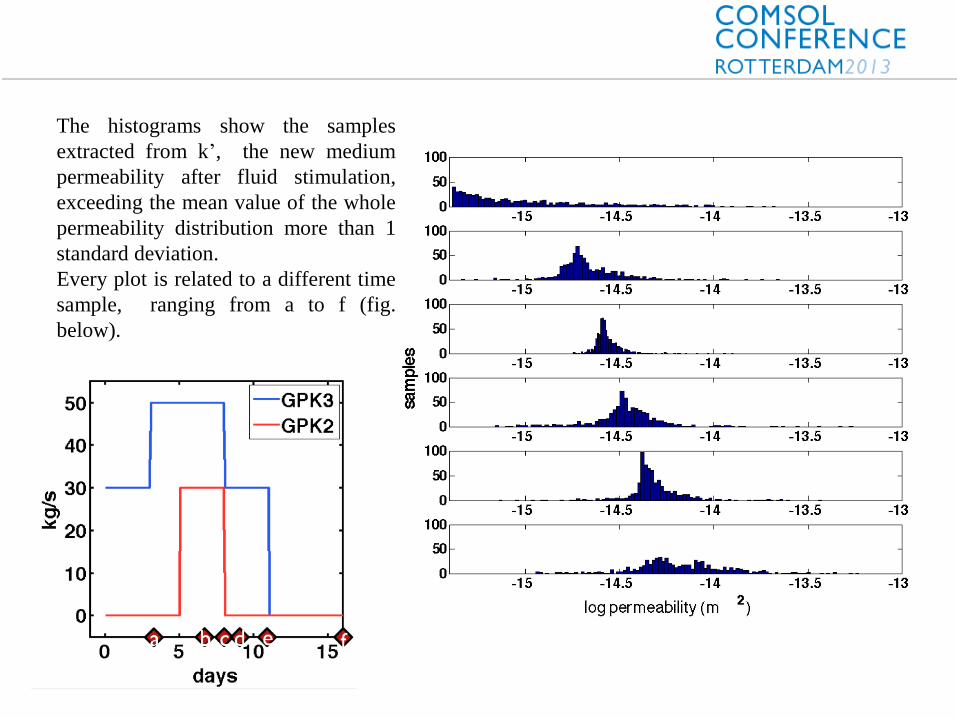
The histograms show the samples
extracted from k’, the new medium
permeability after fluid stimulation,
exceeding the mean value of the whole
permeability distribution more than 1
standard deviation.
Every plot is related to a different time
sample, ranging from a to f (fig.
below).
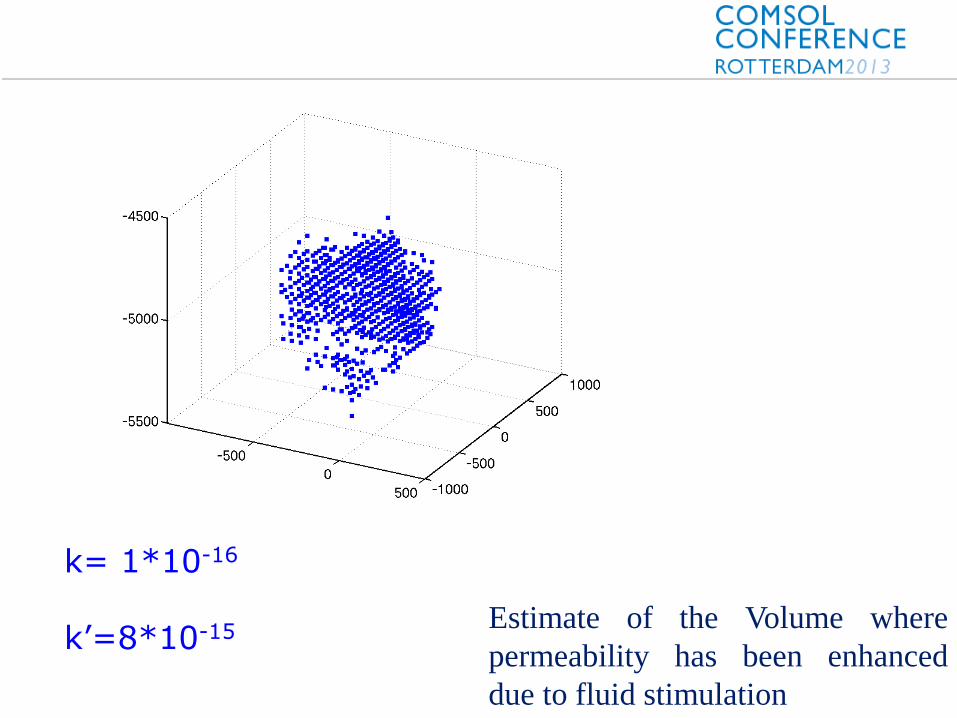
k= 1*10-16
k’=8*10-15
Estimate of the Volume where
permeability has been enhanced
due to fluid stimulation
These simulations show that Coulomb stress changes,
rather than simple pore pressure, control the induced
seismicity during pumping and withdrawal activity in
deep boreholes.
They also indicate we can at some extent to
theoretically predict the seismically activated
volumes during such activities, including EGS
reservoir stimulation.
Thus, we have a powerful method to control both
permeability enhancement and seismogenic
potential, in order to prevent, in the future, they can
approach a critical threshold to cause disasters
?